THE DECISION PROCESS FOR IMPLEMENTING FIXED- GUIDEWAY SYSTEMS PREPARED BY: M. J1QEEMAN ------- MARK A. EURITT C. MICHAEL WALTON , · Cif r·,fj'ffm ,(rr.ncm RESEARCt( kOt)M CENTER FOR TRANSPORTATION RESEARCH BUREAU OF ENGINEERING RESEARCH TilE UNIVERSITY OF TEXAS AT AUSTIN MARCH 1989
Transcript
THE DECISION PROCESS FOR IMPLEMENTING FIXEDGUIDEWAY SYSTEMS
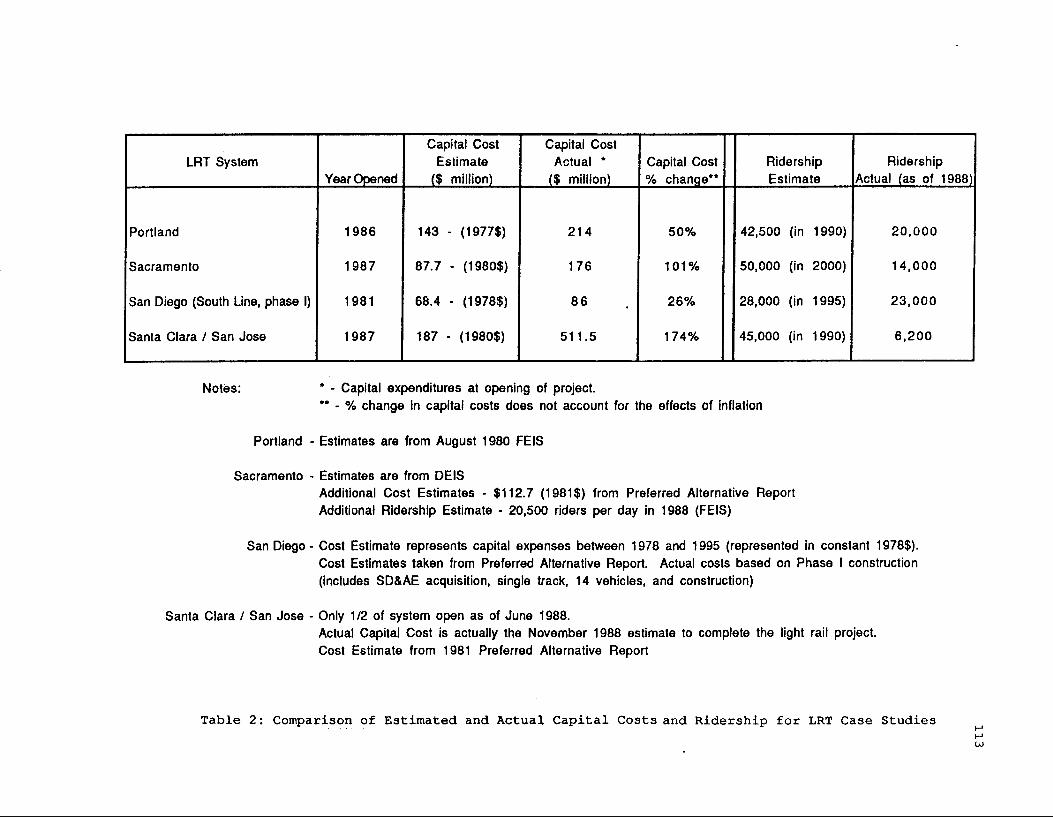
Table 2: Comparison of Estimated and Actual Capital Costs .and Ridership for LRT Case Studies •.....•...........•...... 113
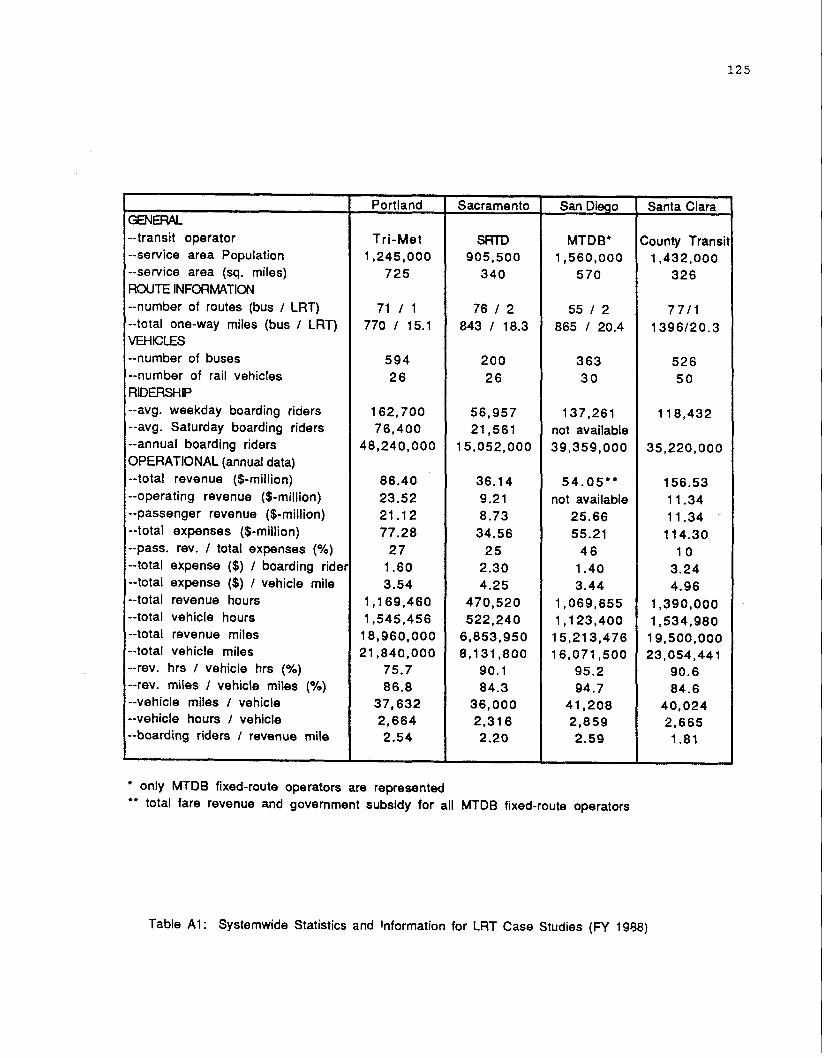
Table Al: Systemwide Statistics and Information for LRT Case Studies (FY 1988) ........................•................ 125
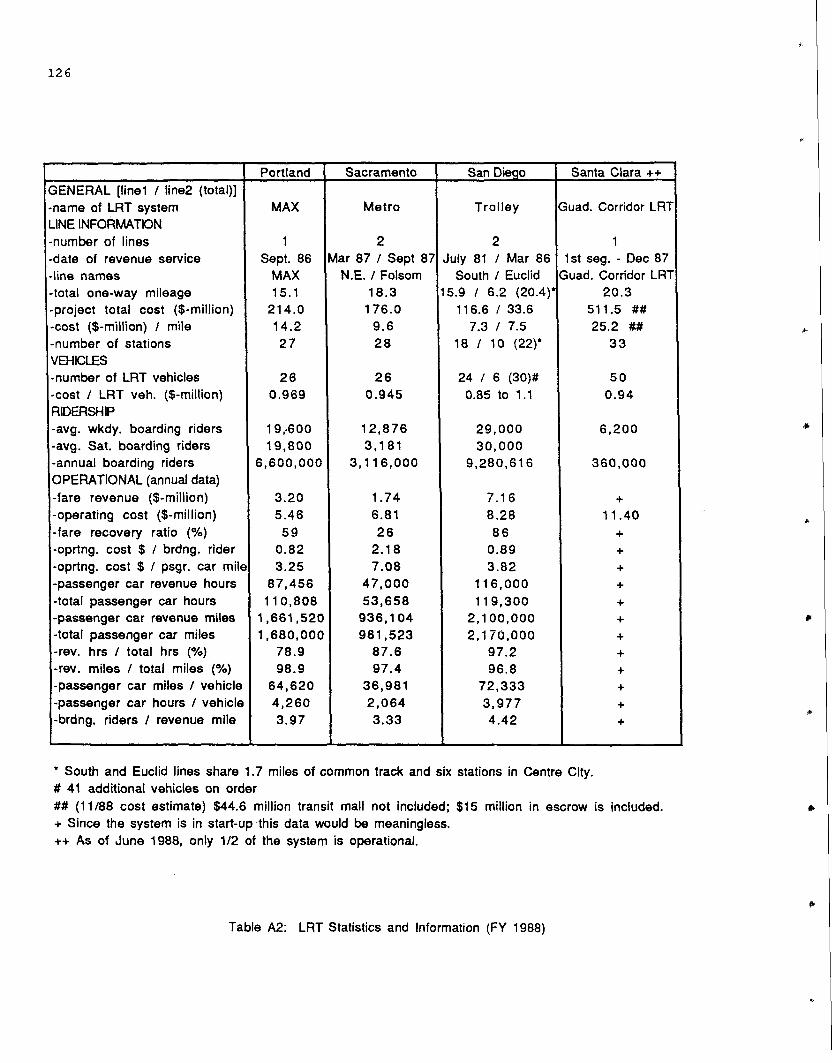
Table A2: LRT Statistics and Information (FY 1988) ................... 126
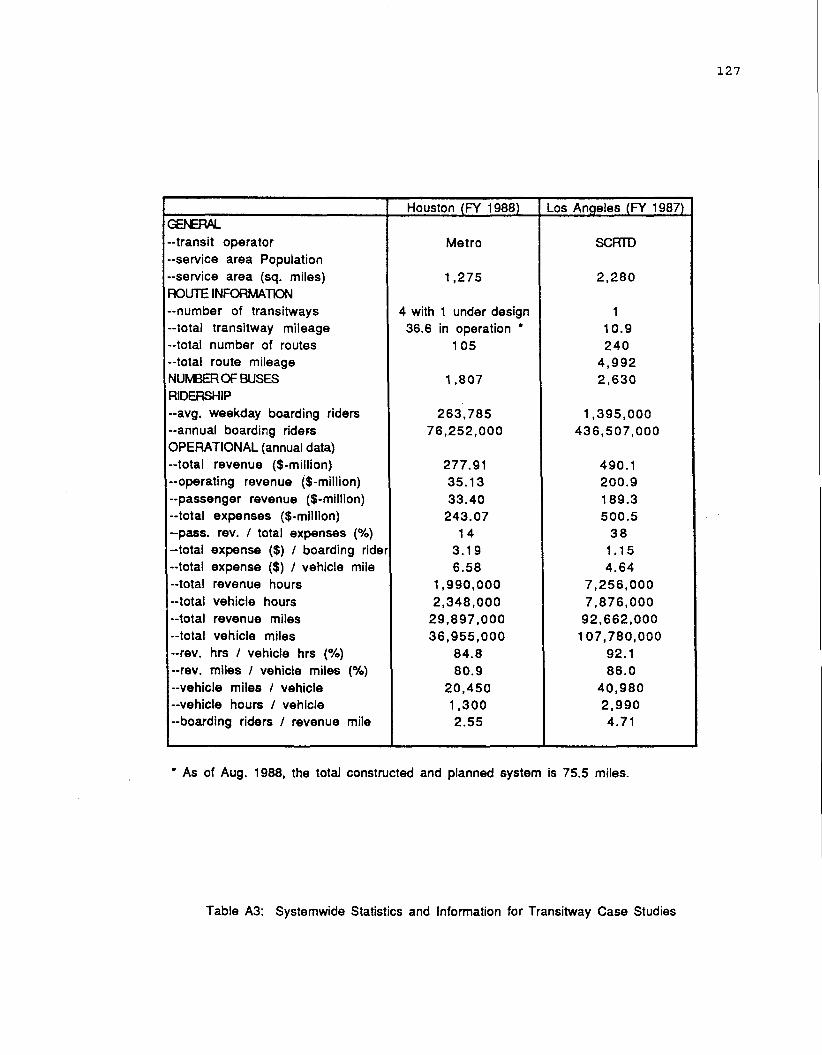
Table A3: Systemwide Statistics and Information for Transitway Case Studies ...........•...............................•.• 127
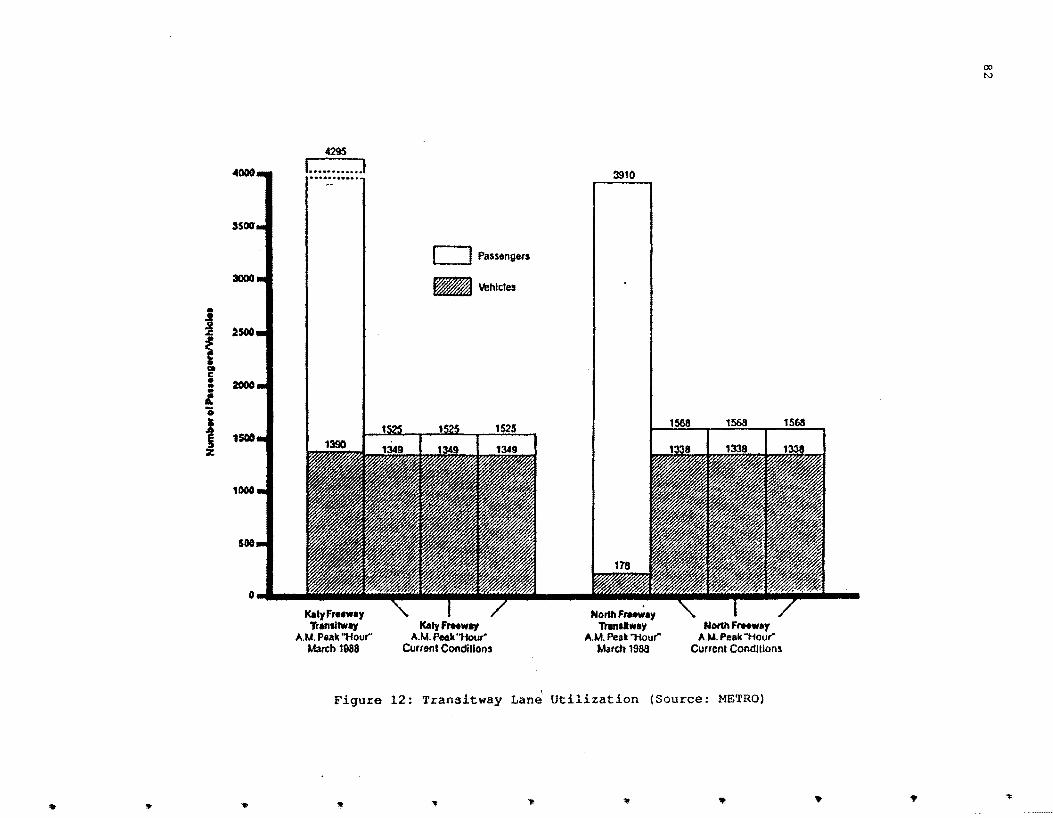
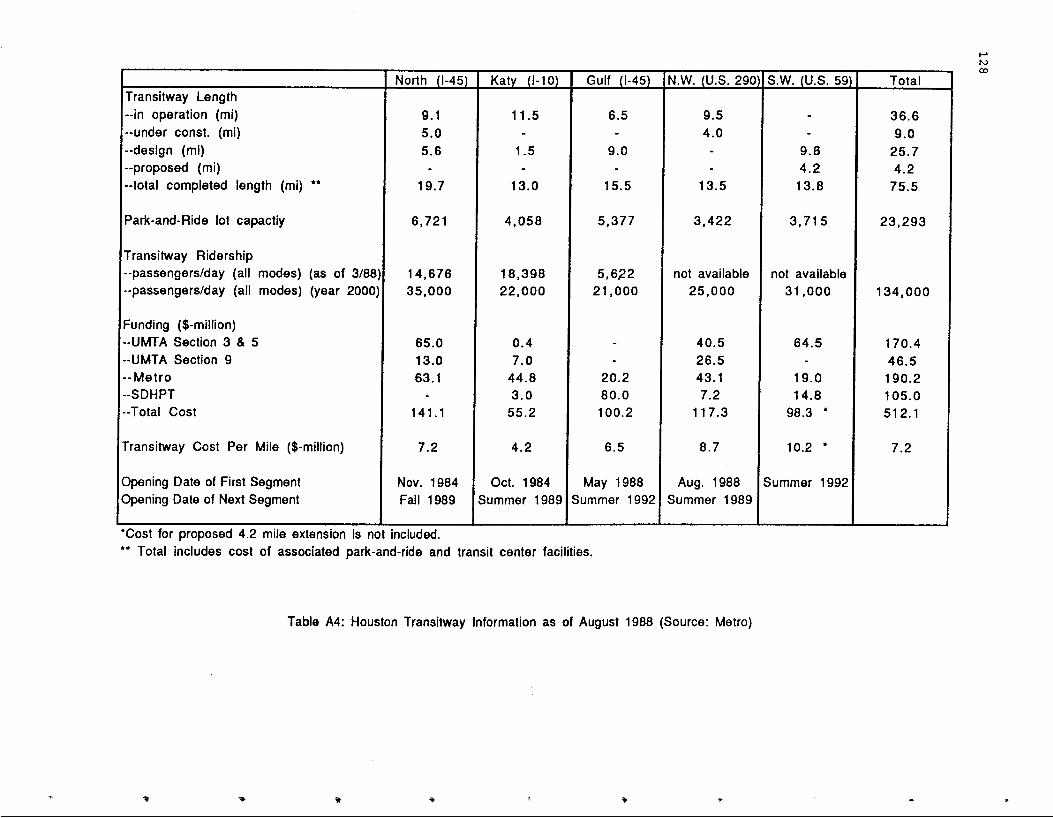
Table A4: Houston Transitway Information As of August 1988 ........... 128
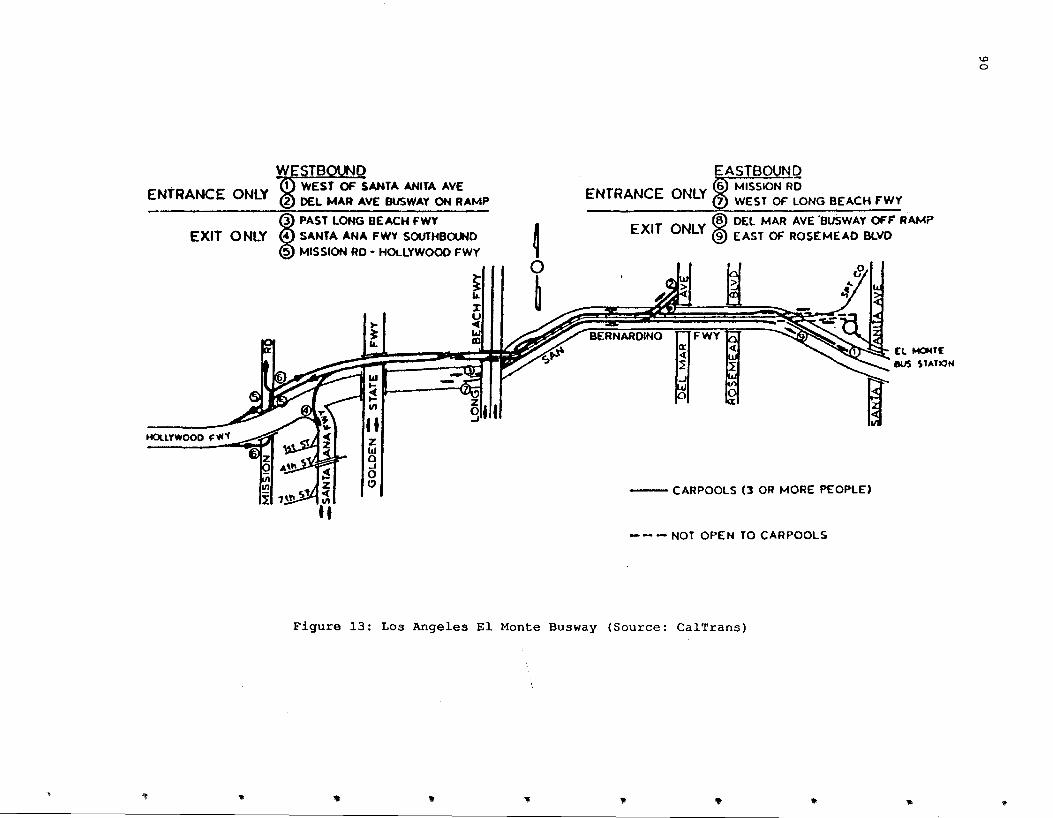
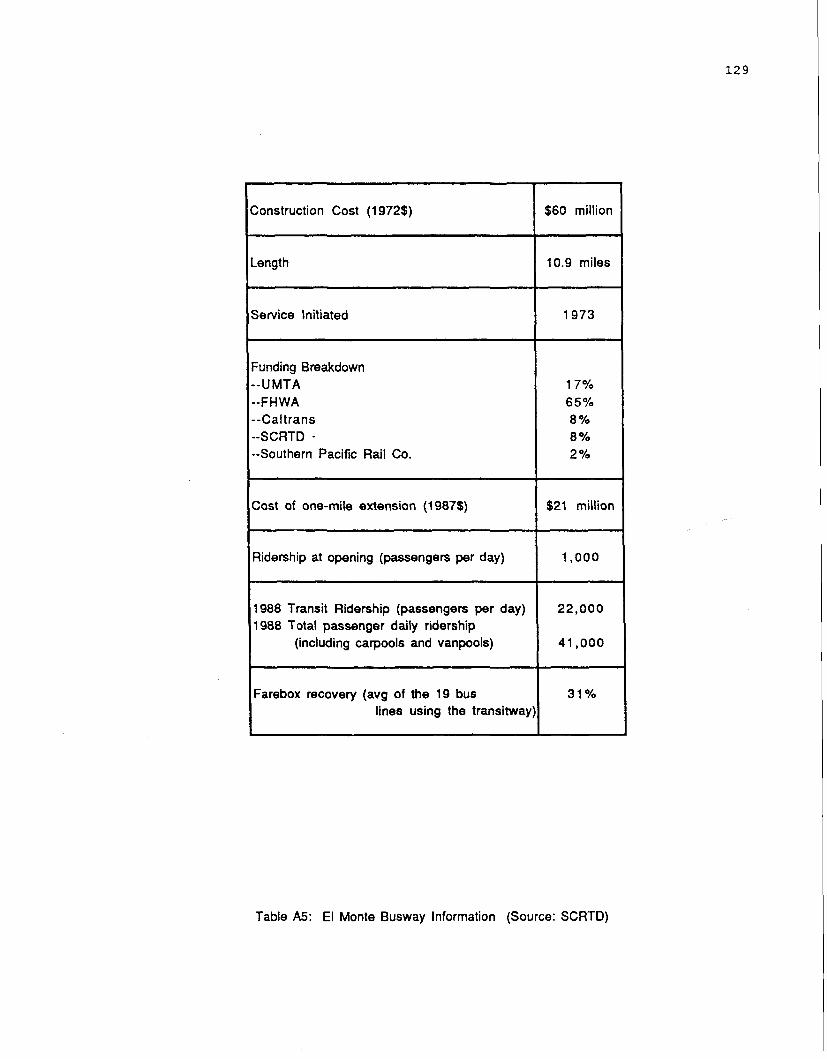
Table AS: El Monte Busway Information .................•........•..... 129
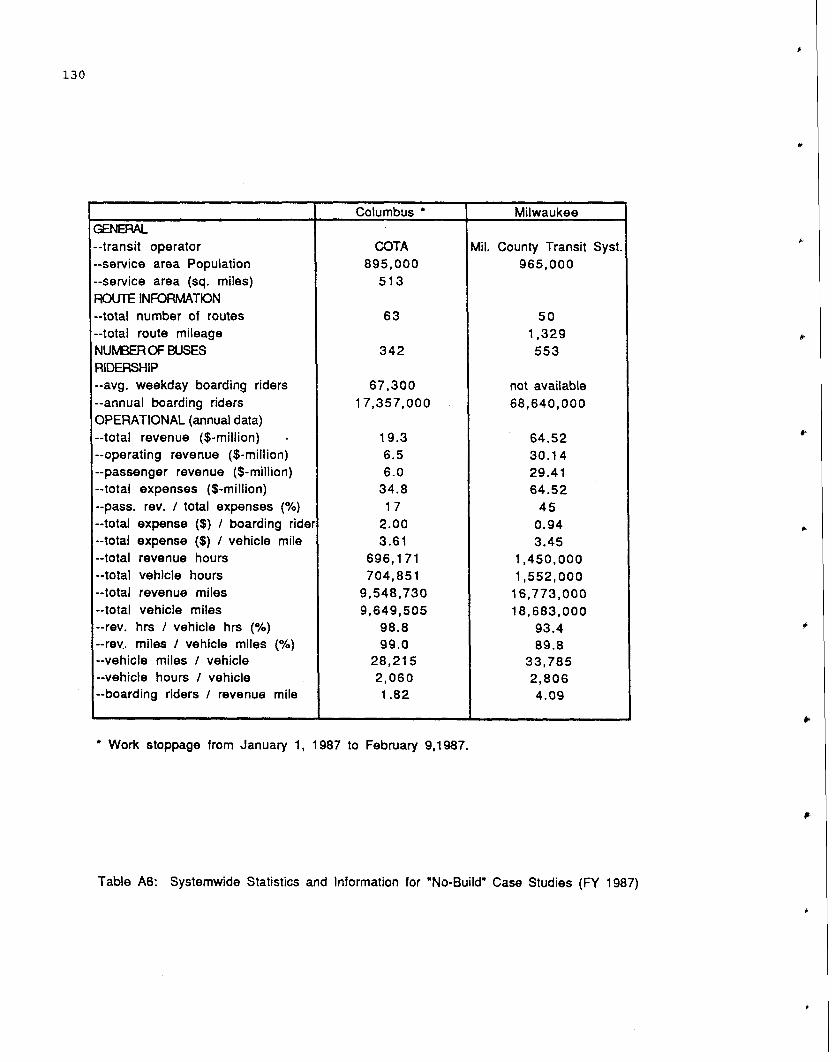
Table A6: Systemwide Statistics and Information for No-Build Case Studies (FY 1987) ...................•..•............. 130
ix
..
X
SECTION I
INTRODUCTION
..
Study Objectives and Methodology
Capital Metro began the Transitway Corridor Analysis Project (TCAP) in
1986 to study alternatives for improving public transportation in the Austin
service area. As a supplement to TCAP, Capital Metro contracted with the
Center for Transportation Research (CTR) at the University of Texas at Austin
to study decision evaluation criteria for fixed guideway alternatives. The
objectives of this research effort are:
1. To gather data on fixed guideway system performance from transit agencies in the U.S. with special emphasis placed on recently implemented systems in Sunbelt and West Coast cities.
2. To compare, where possible, projected costs for construction and operation with actual costs incurred; and projected versus actual ridership by trip purpose.
3. To identify key factors and guidelines for evaluating fixed-guideway systems.
The research project is divided into three phases: Phase I - Define
Project Scope, Phase II -Data Collection, and Phase III -Data Analysis_and
Summary. Phase I begins with identification of cities for study. Based on
the objectives is was determined that three categories of cities should be
selected -- light rail transit systems, transitways, and "no-build" cities.
No-build cities refer to areas that were considering fixed-guideway systems
and concluded that no action was warranted. Following consultation with Urban
Mass Transportation Administration (UMTA) officials, transit experts, and
Capital Metro staff the following cities were selected for study:
Light Rail Transit
Portland, OR Sacramento, CA San Diego, CA San Jose, CA
Transitway
Los Angeles, CA Houston, TX
No-Build
Milwaukee, WI Columbus, OH
In addition to these primary sites, several other cities were contacted during
the course of the study, including Denver, CO and Seattle, WA.
The second part of Phase I involved developing and refining research
questions for data collection. An essential component of this task is an
assessment of the capacity of existing information to address partic~lar
3
4
research questions and decisions about collection of new information.
Research questions were categorized according to four basic elements
economic, political, social, and operational. The economic element focuses on
the cost-effectiveness of the proposed fixed guideway alternative.
Undoubtedly, economy in the use of resources is a principal criterion for
selecting among alternative systems. The political culture and environment of
an area, also, has important implications in selecting transit alternatives.
Perceptions of transit operators, politicians, and the public on appropriate
service levels and transit allocations is often critical to the success of
transit alternatives. The benefits of a good transit system extend beyond the
transit riders to merchants, developers, cultural institutions, and non
riders. These other social benefits, although often undefined, are important
in developing criteria for evaluating transit alternatives. Finally,
operational elements relate to the administrative feasibility and the
integration of the alternative system into the total network.
Information for the Phase II of the study was collected, primarily, from
two sources --published and un-published source data and interviews. Source
data includes information from census reports, transit system annual reports,
etc. Interviews were conducted with key persons involved in the evaluation of
fixed guideway systems.
Initial data collection focused on the overall urban environment,
including population and trends, service area population, development
densities and other important demographic data. This set the stage for
evaluating the context in which the transit authority operated. Data also was
collected on the transit authority, including the number of buses and fixed
guideway vehicles in operation, number and type of routes, total operating
costs and ridership. Finally, data was collected on the fixed guideway system
and the decision process.
The case study methodology used in this study facilitated the analysis of
data completed in Phase III of the project. The analysis focuses on
identifying key factors and criteria used by transit system authorities in
selecting among fixed-guideway alternatives. A second important element of
the analysis is to compare the criteria identified by officials as central to
•
5
the selection of an alternative with source data. Does the identified
criteria reflect the actual situation or circumstances?
Outl.ine of Case Studies and Summary
The next three sections of the report are organized as follows: Section
II - Light-Rail Cities, Section III - Transitway Cities, and Section IV - No
Build Cities. The discussion of light-rail rail transit covers the cities of
Portland, Sacramento, San Diego, and San Jose (Santa Clara County. The
experiences of Houston and Los Angeles are reviewed in the section on
transitways. No-build cities are jurisdictions that opted not to construct a
fixed-guideway system, although they may have expanded their bus service as a
result of alternative analyses. This section includes Milwaukee and Columbus.
The final section summarizes the major findings of the report. It
presents traditional evaluation criteria and presents a model of the decision
process used by the cities in this study.
.. 6
•
SECTION II
LIGHT-RAIL TRANSIT CITIES
•
..
PORTLAND
Overview
The city of Portland, Oregon has a population of 387,866 persons (1980
census) . The Portland Standard Metropolitan Statistical Area, which extends
into Multnomah, Washington, and Clackamas counties, has an estimated
population of 1.25 million persons (1980 census) under the jurisdiction of
more than 40 governmental entities. The Tri-County Metropolitan
Transportation District (Tri-Met) is responsible for providing public
transportation in the tri-county area. The District currently operates the
regional bus system and Portland's light rail system, the Metropolitan Area
Express (MAX), which operates between downtown Portland and the City of
Gresham to the east.
Formed on October 1, 1969, Tri-Met is a publicly-owned, municipal
corporation creat~d to serve the transportation needs of 725 square miles of
the urban portions of Multnomah, Washington, and Clackamas counties.
Operating 26 light rail transit vehicles over one 15.1 mile LRT route and 546
buses (459 standard diesel and 87 articulated diesel buses) over 71 bus routes
totalling 770 miles, the District is currently accommodating 162,700 average
weekday boarding riders and 48,240,000 annual boarding riders.
Total revenue for the District in fiscal year 1988 is $86.4 million. Local
support in the form of a payroll tax of six-tenths of one percent, paid by
employers and independently employed persons, accounts for 60.2 percent of the
total revenue for FY88. The remaining portions of total revenue are operating
revenue (27.2 percent), federal operating assistance (4.8 percent), and other
forms of revenue (7.8 percent). Total passenger revenue and system cost for
FY88 are $21.2 million and $77.3 million respectively, resulting in a fare
recovery ratio of 27.4 percent. Additional Tri-Met information is presented
in Table Al of the Appendix.
Metropolitan Area Express
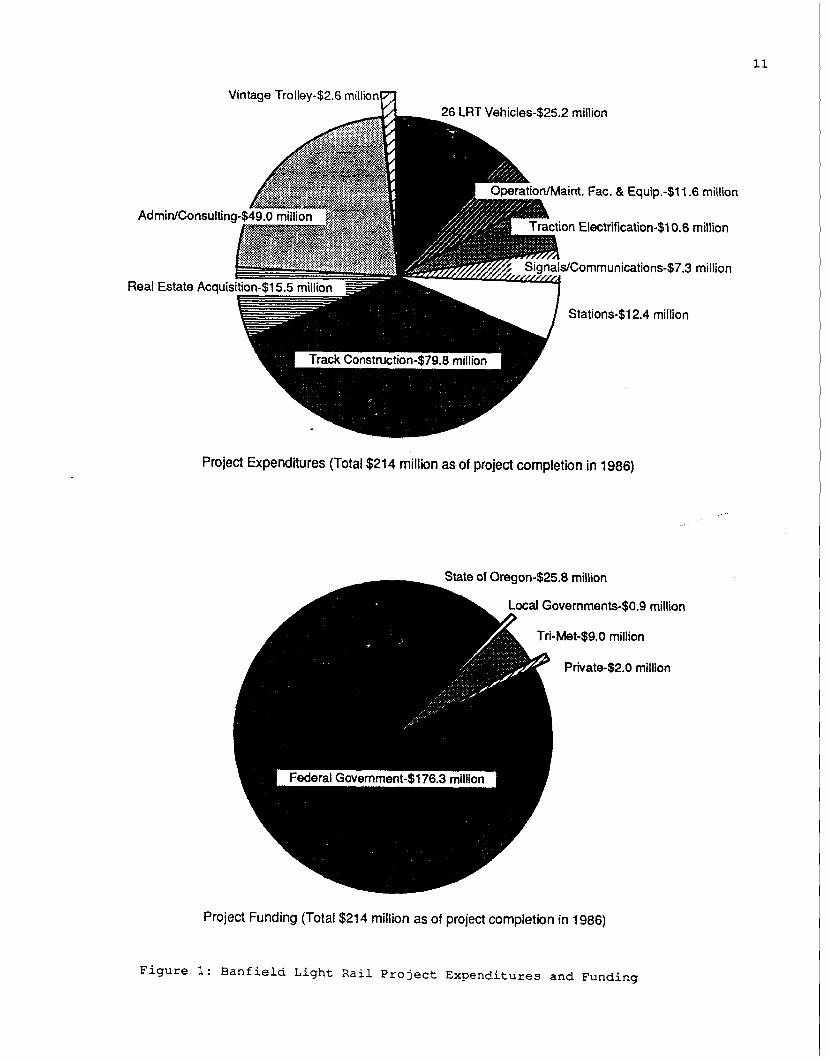
Following construction of Oregon's largest public works endeavor the
Metropolitan Area Express {MAX) opened for service September 8, 1986. The
entire $321.3 million project involved the construction of a 15.1 mile LRT
9
10
line and the reconstruction of a 4.3 mile section of the Banfield Freeway (I-
84) that parallels the MAX. The light rail portion of the project totalled
$214.1 million and included the cost of 26 LRT vehicles, an operations
facility, maintenance equipment, track construction and electrification,
station construction and amenities, real estate acquisition, and
administration/consulting fees (see Figure 1) . The U.S. Department of
Transportation provided $176.3 million (83 percent) of the necessary funds for
the LRT. The remaining 17 percent came from the following funding sources:
State of Oregon ($25,800,000), Tri-Met ($9,000,000), local governments
($900,000), and private corporations and individuals ($2,000,000) (see Figure
1) . Additional MAX information is presented in Table A2 of the Appendix.
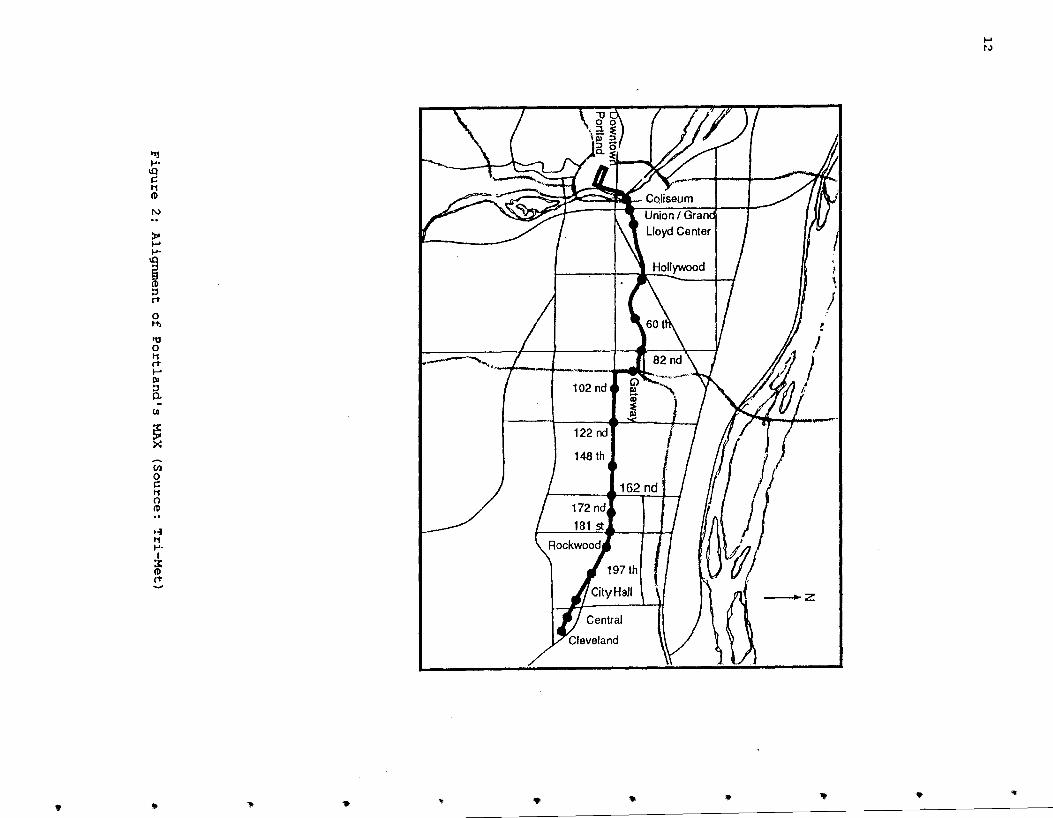
The Route
The 15.1 mile line, connecting downtown Portland with the suburban
community of Gresham (see Figure 2) runs entirely at-grade with approximately
63 percent of the line surface reserved, 36 percent grade separated, and 1
percent in mixed traffic (Ref 7) . The entire line is double tracked except ·
along a downtown loop-turn.
Beginning in downtown Portland, the line forms a 10 block long, 1 block
wide loop-turn intersecting the Portland Transit Mall. The MAX then passes
through the Yamhill and Skidmore Historic Districts, while paralleling the
Willamette River. Crossing the Willamette River, MAX exits the downtown area
and descends into Sullivan's Gulch and paralleling I-84 travels east for
approximately 4 miles. The line then turns south and parallels I-204 for
approximately 2 miles. Upon intersecting Burnside Street, the line again
turns east along Burnside Street for several miles until reaching 197th Street
where MAX enters the Portland Traction Company line. MAX then travels east
within the old railroad right-of-way to the community of Gresham.
In the downtown area, sidewalks were modified and different building
materials were used to delineate the transit line from pedestrian and auto
traffic. Also, for safety reasons, operating speeds in the downtown are
between 15 mph and 25 mph. Cobblestone was placed between the rail tracks to
preserve the historic character of the two downtown historic districts. Along
•
Vintage Trolley-$2.6 millio
Fac. & Equip.-$11.6 million
unications-$7.3 million
Stations-$12.4 million
Project Expenditures (Total $214 million as of project completion in 1986)
Local Governments-$0.9 million
Tri-Met-$9.0 million
Private-$2.0 million
Project Funding (Total $214 million as of project completion in 1986)
Figure 1: Banfield Light Rail Project Expenditures and Funding
11
(/)
0 c 11 0 CD
~ 11 ..... I
~ (1"
• •
..... t.J
13
the freeway section of the route, MAX vehicles operate on a completely grade
separated trackway, travelling at a maximum speed of 55 mph; however, upon
entering Burn~ide Street, the rail line becomes curb-~eparated from auto and
pedestrian traffic and the operating speed is reduced to 35 mph. During the
last three miles into Gresham, the rail vehicle enters an abandoned freight
rail alignment where operating speeds range from 35 mph to 55 mph.
Facilities and vehicles
Ground-breaking for the Ruby Junction Operations and Maintenance Center
located near the community of Gresham occurred on March 26, 1982 symbolically
marking the beginning of the construction phase.
stations were constructed along the transit
Eventually, twenty-seven
line at a total cost of
$12,433,000. Each of the brick, metal, and glass stations is equipped with
automatic ticket machines that validate and sell tickets, route and schedule
information and maps, telephones with free 911 access, and wayside wheelchair
lifts. Tri-Met is the first transit agency in the country to install wayside
lifts instead of on-board lifts citing such advantages as assured access,
improved reliability, ease of maintenance, and reduction of capital costs
since fewer wayside lifts are needed. The downtown stations are simple
curbside stops while the other ~tations feature contract vendors and
concessionaires offering such services as film developing, dry cleaning, shoe
repair, ne•1sstands, and boxed lunches.
Five of the MAX stations, which serve as transit centers to the Gateway
Transit Center and Gresham Transit Center, provide timed-transfer service with
Tri-Met 's bus system. The Gateway Transit Center is a major facility
operating 12 bus · lines and 330 free park-and-ride spaces. Five of the
stations, including Gateway, are combined with park-and-ride lots providing
1700 parking spaces.
Tri-Met began procuring LRT vehicles in January 1980 to take advantage of
potential cost savings that would result from inflation. Also, since the
vehicles were to be tested and stored at the Ruby Junction facility, Tri-Met
wanted to be certain that the vehicles arrived within a reasonable period of
time after the completion of the facility. The first LRT vehicle arrived in
14
April of 1984, approximately 8 months after the completion of the Ruby
Junction facility.
Today, Tri-Met operates 26 LRT vehicles. The vehicles were purchased from
the Canadian transit manufacturer Bombardier for $25,232,000 ($969,000 per LRT
with an expected life of 30 years) • The bi-directional, six-axled,
articulated vehicles, generally operating in two-car trains, are 88 feet in
length, 8 feet 8 inches wide and can carry a maximum of 160 passengers (76
seated passengers) .
Ridership
The DEIS ridership forecasts were initially done in 1978 using, basically,
the Urban Transportation Planning System (UTPS) generic model. The model
forecasted light rail riders~ip in the range of 40-45,000 riders per day for
1990. In 1980, the FEIS reported ridership for the preferred alternative at
42,500 riders per day in 1990. It is interesting to note that an additional
10 percent increment of ridership was included in the LRT ridership estimate
to account for the "elusive mystique" of rail transit's ridership generating
qualities, a factor that was later disallowed in the Sacramento Alternatives
Analysis process (Ref 14). As of 1987-88, the LRT system was averaging 19,600
riders per day -- only 46 percent of the 1980 estimate.
Tri-Met originally performed the forecasts to get the project moving. In
1985, the regional metropolitan planning organization (MPO), METRO, re-ran the
model and forecasted between 17-20,000 riders per day. According to one METRO
official, Tri-Met published these figures and then met with their operations,
planning, and public relations people to come up with what could be termed a
"low-ball" ridership estimate of 12,000 riders per day. When the system
opened with a ridership of 20,000 riders per day they were, therefore, a
"success story".
The model seemed to work satisfactorily since METRO's ridership estimate
and the actual ridership were the same. The problem with Tri-Met's original
estimates seems to stern from several areawide economic changes that affected
the base assumptions of the model. For example, gasoline prices, which were
originally estimated at 4 percent above CPI, were down from the forecasted
15
levels (with prices now at a 20 year low) . Another factor influencing the
model was an unexpected recession between 1980-85. Because of this
recession, population estimates were down from forecasted levels affecting
estimates of traffic volumes and the numbers of households and workers.
During the alternatives analysis process, LRT was compared with HOV lanes
as well as separated busways. Following UMTA guidelines, little bias towards
LRT was shown in the UTPS generic model (although an increment of 10 percent
additional ridership was eventually added to the modelling results to account
for the "elusive mystique" of rail transit) Using the generic model, there
were only two factors that varied between the LRT and busway alternatives.
For example, buses allow a higher frequency for the same volume, which as a
result, produces a higher bus ridership. It was assumed, however, that people
would walk farther to reach an LRT station (1/2 mile compared to 1/4 mile for
bus). Higher LRT ridership estimates would result from this assumption. As a
result of these two factors, the model produced very similar ridership
estimates for the two modes. I • The lower operat~ng costs per passenger of the light rail alternative
compared to any of the bus alternatives was the most important factor in Tri
Met' s decision to support the rail alt-ernative (Ref 8). This number, however,
is obviously influenced by the ridership estimate of the alternative. High
ridership estimates favor light rail in terms of operating costs because fewer
drivers are needed to handle the high demand. In Portland, predicted LRT
ridership of 42,500 in 1990, which was over-estimated by more than 50 percent,
favored the LRT alternative in terms of estimated operating costs. Reasons
for the over-estimation of ridership include: 1) an unexpected recession
which severely lowered the number of downtown workers, 2) gasoline prices did
not continue to rise as expected, and 3) the additional 10 percent ridership
increment allowed to account for the "elusive mystique" of rail transit.
Before operations began in September 1986, the number of average weekday
boarding riders was projected to be 17,000 riders per day with the number of
total boarding riders projected at 3,000,000 riders per year. After one year
of operation, the number of boarding riders was 19,900 riders per day and
7,230,000 riders per year yielding a respective increase of 17 percent and 141
16
percent. At the close of fiscal year 1988, MAX's average weekday ridership
was 19,600 boarding {unlinked trips)) rides per day with 15,600 originating
{linked trips) rides per day. Total boarding riders for FY88 was 6,600,000
riders per year.
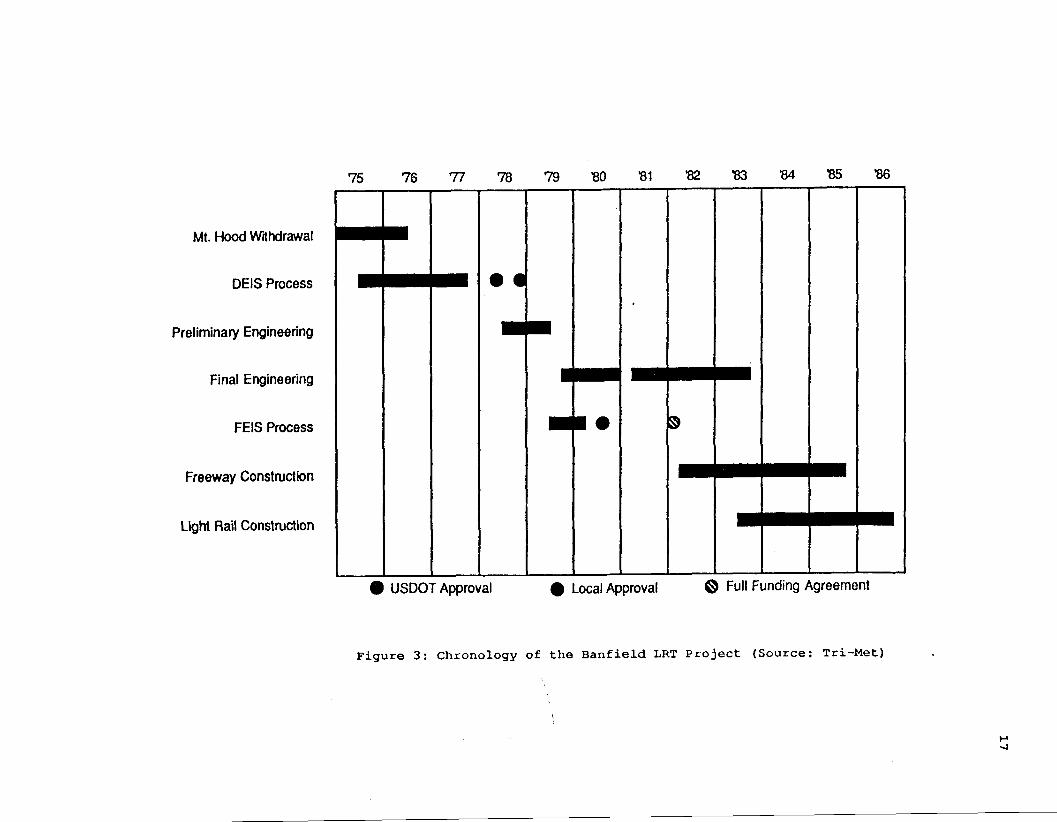
Historical Back~round•
Portland's LRT system has a very interesting and complex history {see Figure 3
for project chronology) . The Portland light rail system began as a project to
stop the construction of the proposed Mt. Hood Freeway that, if constructed,
would have required the removal of approximately one percent of Portland's
housing stock. As a result of strong public sentiments, Portland's newly
elected mayor, Neil Goldschmidt, assembled an in-house technical staff to
review transportation alternatives to meet the transportation needs of the
city and region. While procedural difficulties and legal entanglements
stalled the completion of the Final Environmental Impact Statement {FEIS) for
the Mt. Hood Freeway, Goldschmidt assembled a coalition of state and local
officials willing to examine various transportation alternatives. -A·
Governor's Task Force {GTF), appointed by Governor Tom McCall and chaired by
Goldschmidt, was created for the purpose of examining the feasibility of
transit as an option to more freeways in the region. Major products of the
GTF were a technical report justifying transit improvements within the region
and a recommendation to strengthen the technical capability of the Columbia
Region Association of Governments {CRAG), the regional Council of Governments.
In 1972 every local government within the Portland metropolitan area was
required by state law to participate in CRAG. Upon formation in 1969, CRAG
assumed the responsibility for the regional transportation plan and increased
its technical capabilities. As a result of GTF recommendation and the strong
technical expertise of the city's Planning Bureau {a result of Goldschmidt's
commitment to a regional transit system and the preservation of
• This section summarizes some of the information contained in the research reports: "Urban Decision Making for Transportation Investments: Portland's Light Rail Transit System" and "Urban Intergovernmental Transportation Decision-Making Systems: Portland's Investment in Light Rail Transit".
75 76 77 78 79 '80 '81 '82 '83 '84 '85 '86
Mt. Hood Wnhclrawal
DEIS Process •• Preliminary Engineering
Final Engineering
FEIS Process J.. ~
Freeway Construction
Light Rail Construction
• USDOT Approval e Local Approval 0 Full Funding Agreement
Figure 3: Chronology of the Banfield LRT Project (Source: Tri-Met)
18
neighborhoods), CRAG and Portland city planners assumed the responsibility for
evaluating regional transit alternatives.
After exploring alternatives, the county and city governments voted to
withdraw the Mt. Hood Freeway project under provisions of the Federal-Aid
Highway Act of 1973. The withdrawal process allowed an urban area, with the
consent of the local governments, governor, FHWA and UMTA, substitute mass
transit projects for withdrawn eligible segments of planned urban Interstate.
The trade-in process was modified by the Federal Highway Act of 1976 to allow
for the substitution of alternate highway, transit, or a combination of
highway/transit projects. At that time, the technical resources required to
justify the withdrawal of the Mt. Hood Freeway existed; however, the necessary
political consensus were lacking.
Building consensus for the Mt. Hood withdrawal required two steps. First,
at the insistence of Goldschmidt, Governor McCall replaced the entire Tri-Met
Board of Directors with a Board that did not embrace a bus-only philosophy.
Secondly, Goldschmidt had to mollify Governor McCall's uneasiness over
withdrawing the freeway project. Up to this point, few areas had participated-
in the trade-in process. As a result, the governor was wary of potential
political embarrassments resulting from the loss of construction jobs and
problems resulting from the lack of a subst~tute transit plan. Also, the
Governor wanted the support of the Oregon Department of Transportation (ODOT),
an agency that was clearly against the withdrawal. The support of ODOT
depended on Glenn Jackson, Chairman of the Oregon Transportation Commission
and "father" of the state's highway system and the support of Jackson depended
on the construction of an outerbelt freeway, I-205, opposed by the county
commissioners. After some political negotiations on the part of Goldschmidt,
the county commissioners withdrew their opposition to the I-205 segment. The
resulting deal involved the states inclusion of some form of fixed-guideway
within the I-205 alignment and the relocation of an existing jail with FHWA
highway funds. The county then agreed to rebuild the existing east-west
Banfield Freeway. With all political parties satisfied and the support of
ODOT, Governor McCall agreed to support the withdrawal in October 1974.
However, McCall left office in January 1975 and was succeeded by Robert
19
Straub, a close personal friend of Goldschmidt. With the persuasion of
Goldschmidt and Gerry Drummond, Chairman of the Board for Tri-Met, Straub
agreed to support the withdrawal. The formal request for withdrawal was
signed by Straub and submitted to the Secretary of Transportation in June
1975.
At this time, the region did not have a transit substitution project and,
subsequently, needed flexibility in the trade-in process to aid in building a
regional consensus. In June 197 6, after much lobbying on the part of
Portland, Congress amended the Federal Aid Highway Act to allow for an
elimination of the June 1981 deadline to begin construction, increased
availability of funding based on the latest estimates of the cost to complete
the Interstate system, and the extension of withdrawal funds to be used on
localized highway proj~cts. These three provisions provided the necessary
flexibility to negotiate a workable transportation solution for the region.
The Mt. Hood withdrawal was approved by the Secretary of Transportation in
June 1976. The state and Portland metropolitan area were now authorized to
use the withdrawn funds, amounting to $191.2 million, for alternative highway
and transit projects. A total of 140 transit and highway projects were funded
throughout the region with the bulk of the money being spent in three major
transit corridors.
After studying the three corridors in more detail, the Banfield corridor
was identified as the region's top priority corridor to replace the withdrawn
Mt. Hood Freeway project. The reasons included the meeting of a political
obligation to Glenn Jackson, the availability of an established eastside
freeway corridor, and political pressure to build in the vicinity of the
withdrawn project.
The next step involved an alternatives analysis and the preparation of the
draft environmental impact statement (DEIS) for the Banfield corridor. In
1975, an LRT option had been included in initial DEIS work, but in 1976, the
concept was abandoned on the grounds of technical infeasibility. However, in
1977, LRT was included in the DEIS process after the completion of an LRT
feasibility study by Tri-Met followed by over 100 meetings with citizens
groups and local jurisdictions for the purpose of promoting LRT as a viable
22
would not be adequate to cover the local matching funds requirement. Duncan
was persuaded to support the state's funding of $16 million when Tri-Met
agreed to provide an additional $10-million necessary to meet the new estimate
of required local funds.
With the approval of the local funding agreement, the FEIS was begun in
September 1979, completed in June 1980, and approved by U.S. DOT in July 1980.
A letter of intent was signed by Goldschmidt, the newly appointed U.S.
Secretary of Transportation, on December 20, 1980 after Congressional funding
approval was obtained. However, upon entering office in 1981, President
Ronald Reagan brought the project to a standstill with his ban on new rail
starts. A new federal funding agreement was needed.
As a solution, Tri-Met proposed the reallocation of $7 6 million in
Interstate transfer funds, wh~ch were earmarked for the Westside corridor, to
the Banfield corridor. In return, Portland would accept the reallocated funds
on a cash-flow basis, thereby minimizing the initial capital demands. The
U.S. DOT would then issue a Letter of Intent promising $76 million in non-rail
transit improvements to the Westside corridor. Senator Mark Hatfield,
Chairman of the Senate Appropriations Committee, was instrumental in
negotiating this final funding agreement.
A full funding agreement was received from UMTA Administrator Arthur Teele
on March 26, 1982 at the ground-breaking ceremony for the Ruby Junction
Maintenance Facility. Construction was completed during the summer of 1986
with revenue service beginning on September 8, 1986. The LRT portion of the
Banfield project was completed within the $214.1 million final budget
(although initial planning in 1977 indicated the project would cost
approximately $143 million) .
Economics was a critical factor in the selection of light rail but not in
the expected way. Economics was critical in that supporters of light rail had
to weave through a variety of funding mechanisms and alternatives as well as
mobilize political support to free up otherwise unavailable funds. The light
rail system could not have been built without federal and state funding. The
principal supporters of light rail worked vigorously to identify and develop
alternative methods for funding the project.
•
•
•
•
•
•
-
-
23
In addition to project cost and funding, economic issues include impacts on
development, the regional economy, etc. For example, during the decision
process, Portland was experiencing unprecedented growth; however, during the
construction phase the area was experiencing a major slump (1980-85) . Thus,
this large, capital intensive project was critical to the area.
The LRT also impacted local development. A Transit Station Area Planning
Program (TSAP) was begun to promote joint development opportunities emerging
from a LRT line. The major results of the TSAP program were the evaluation
and planning of the station area development potential, promotion of
public/private development, and reinforcement of the LRT line through public
sector investments within the vicinity of the LRT stations (Ref 1). This
resulted in the relocation of a planned station to coincide with the location
of Lloyd Center, a major mixed-use development located approximately three
miles from the Portland CBD.
When LRT line began revenue service in September 1986, private development
within the corridor totaled over $214 million. Today, $300 million is
presently scheduled for or under construction. According to Tri-Met, the-key
to the positive developmental impacts was the location of the transit line.
Instead of locating the line along the fringes of development areas as was
done in other cities, the MAX line was located in the middle of key transit
areas (Ref 4) .
In terms of cost, real estate acquisition was not a major issue because the
MAX line runs predominantly on-street, along public property. The only
portion of the line that is unique to rail is the five-mile portion of the
line paralleling the Banfield Freeway.
however, created some problems with
The widening of Burnside Street,
residents along the section. The
-construction of the MAX line required the development of county-owned land
that for years had been used by approximately 500 of the residents residents
along Burnside .
Further, energy issues were also important factor in the decision process.
Due to the abundance of hydropower in the Northwest, electricity is relatively
cheap form of energy making the electrically powered LRT line an attractive
28
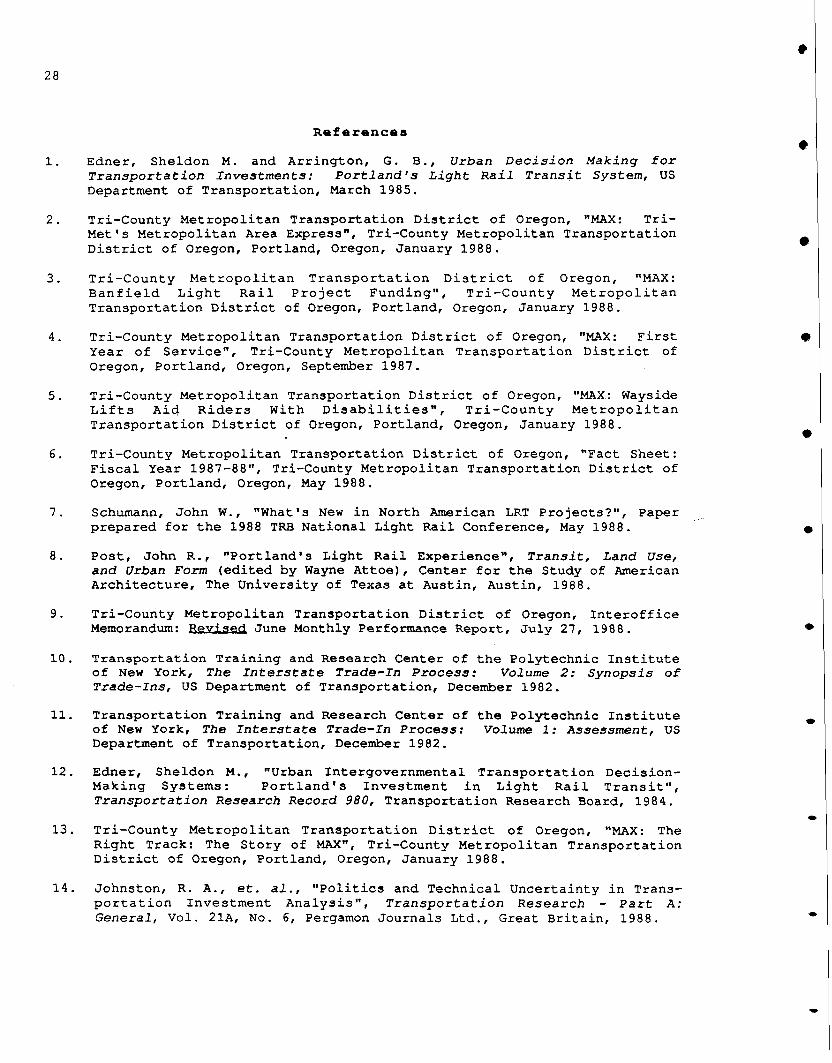
References
1. Edner, Sheldon M. and Arrington, G. B., Urban Decision Making for Transportation Investments: Portland's Light Rail Transit System, US Department of Transportation, March 1985.
2. Tri-County Metropolitan Transportation District of Oregon, "MAX: TriMet's Metropolitan Area Express", Tri-County Metropolitan Transportation District of Oregon, Portland, Oregon, January 1988.
3. Tri-County Metropolitan Transportation District of Oregon, "MAX:
4.
5.
Banfield Light Rail Project Funding", Tri-County Metropolitan Transportation District of Oregon, Portland, Oregon, January 1988.
Tri-County Metropolitan Transportation District of Oregon, "MAX: First Year of Service", Tri-County Metropolitan Transportation District of Oregon, Portland, Oregon, September 1987.
Tri-County Metropolitan Transportation District of Oregon, "MAX: Wayside Lifts Aiq Riders With Disabilities", Tri-County Metropolitan Transportation District of Oregon, Portland, Oregon, January 1988.
6. Tri-County Metropolitan Transportation District of Oregon, "Fact Sheet:
7.
Fiscal Year 1987-88", Tri-County Metropolitan Transportation District of Oregon, Portland, Oregon, May 1988.
Schumann, John W., "What's New in North American LRT Projects?", Paper prepared for the 1988 TRB National Light Rail Conference, May 1988.
8. Post, John R., "Portland's Light Rail Experience", Transit, Land Use, and Urban Form (edited by Wayne Attoe), Center for the Study of American Architecture, The University of Texas at Austin, Austin, 1988.
9. Tri-County Metropolitan Transportation District of Oregon, Interoffice Memorandum: Reyised June Monthly Performance Report, July 27, 1988.
10. Transportation Training and Research Center of the Polytechnic Institute of New York, The Interstate Trade-In Process: Volume 2: Synopsis of Trade-Ins, US Department of Transportation, December 1982.
11. Transportation Training and Research Center of the Polytechnic Institute of New York, The Interstate Trade-In Process: Volume 1: Assessment, US Department of Transportation, December 1982.
12. Edner, Sheldon M., "Urban Intergovernmental Transportation Decision-Making Systems: Portland's Investment in Light Rail Transit", Transportation Research Record 980, Transportation Research Board, 1984.
13. Tri-County Metropolitan Transportation District of Oregon, "MAX: The Right Track: The Story of MAX", Tri-County Metropolitan Transportation District of Oregon, Portland, Oregon, January 1988.
14. Johnston, R. A., et. al., "Politics and Technical Uncertainty in Transportation Investment Analysis", Transportation Research - Part A: General, Vol. 21A, No. 6, Pergamon Journals Ltd., Great Britain, 1988.
•
•
•
•
•
•
•
-
-
..
SACRAMENTO
Overview
The city of Sacramento, the capital of California and the fourth largest
metropolitan area in the state, is located approximately 90 miles to the
northeast of San Francisco. Contained within Sacramento County, the
Sacramento central business district (CBD) lies to the southeast of the
intersection of the Sacramento and American Rivers and west of the Sierra
Nevada foothills. The 1986 population of Sacramento is estimated at 324,000
persons while the population of the Sacramento metropolitan area is
approximately 905,500 persons (Ref 1).
The Sacramento Regional Transit District (RT) operates two light rail
transit lines in corridors extending to the northeast (I-80 Corridor) and east
(Folsom Corridor) from the CBD. The combined area of the two corridors was
the study area for Sacramento's alternatives analysis process which was
conducted during the early 1980's.
Since World War II, suburban development has occurred in and betweenthese
two corridors primarily because of crash and noise impact zones established by
two local Air Force bases as well as the need to retain prime agricultural
land. More recent development, however, has been occurring outside this wedge
with development spreading to the agricultural lands south and north of the
CBD. By the year 2000, the area should be more evenly developed around the
CBD (Ref 2) .
In 1979, the population of the two corridors was approximately 500,000
persons which comprised about two-thirds of the population of the entire
Sacramento Urbanized Area (743, 000 persons) (Ref 3). Population density in
the combined area is low. A 1982 UMTA estimate forecasts density at less than
3,000 persons per square mile by the year 2000 (Ref 2).
During the alternatives analysis process of the late 1970's, the Sacramento
CBD provided jobs for 78, 000 people with State government accounting for
approximately 25 percent of the work force. The CBD nonresidential floorspace
totaled approximately 12 million square feet.
The Sacramento Regional Transit District began operations on April 1, 1973
as the primary p=ovider of fixed-route public transit service in the
29
30
Sacramento metropolitan area. The RT Board of Directors consists of seven
appointed members, four from the city and three from the county. The RT
service area covers 340 square miles and contains approximately 905, 500
persons. RT operates 200 buses over 76 bus routes totaling 843 one-way route
miles. The district also owns 26 LRT vehicles operating over two nine-mile
LRT lines. In FY88, the district boarded over 15 million total riders and
57,000 riders per weekday.
Total FY88 revenue and expenses for the district were $36.1 million and
$34. 6 million, respectively. With passenger revenues amounting to $8.7
million, approximately 25 percent of the total expenses incurred by RT was
paid through the farebox.
In June 1988, RT adopted their current short-range transit plan, "FY 1989
Update: Transit Plan 1986-19~0"(Ref 4). According to the plan, the financial
outlook for the district during the period 1989 - 1993 is not encouraging
because of reductions in state and federal funding and the lack of secure
local funding sources; however, in November 1988 Sacramento voters approved a
1/2 percent sales tax of which RT will receive 35 percent. Until this time,
RT has been able to avoid reductions in service through various cost
containment methods.
The FY89 RT operating budget is $34.5 million with 53 percent of that total
going to wages.
approximately
Total operating revenue for FY89 is expected to comprise
2 6. 8 percent of the $34.5 million with passenger fares
accounting for 97 percent of the operating revenue. Total non-operating
revenue accounts for the remaining 7 3. 2 percent of the FY8 9 budget with
federal and state sources supplying 9. 3 percent and 63. 3 percent of the
budget, respectively, and the remaining 0.6 percent scheduled to come from
other sources. Additional RT data is presented in Table A1 of the Appendix.
R.'l' Metro*
The Sacramento Light Rail Starter Line Project, a six year project from
design to completion, brought an 18.3 mile LRT system to the Sacramento
metropolitan area with the September 5, 1987 opening of the nine-mile Folsom
Line in the Folsom (or U.S. 50) Corridor. The Northeast Line, which is
* All material from Ref 1 unless otherwise noted.
31
located in the I-80 Corridor, began revenue service on March 12, 1987. At
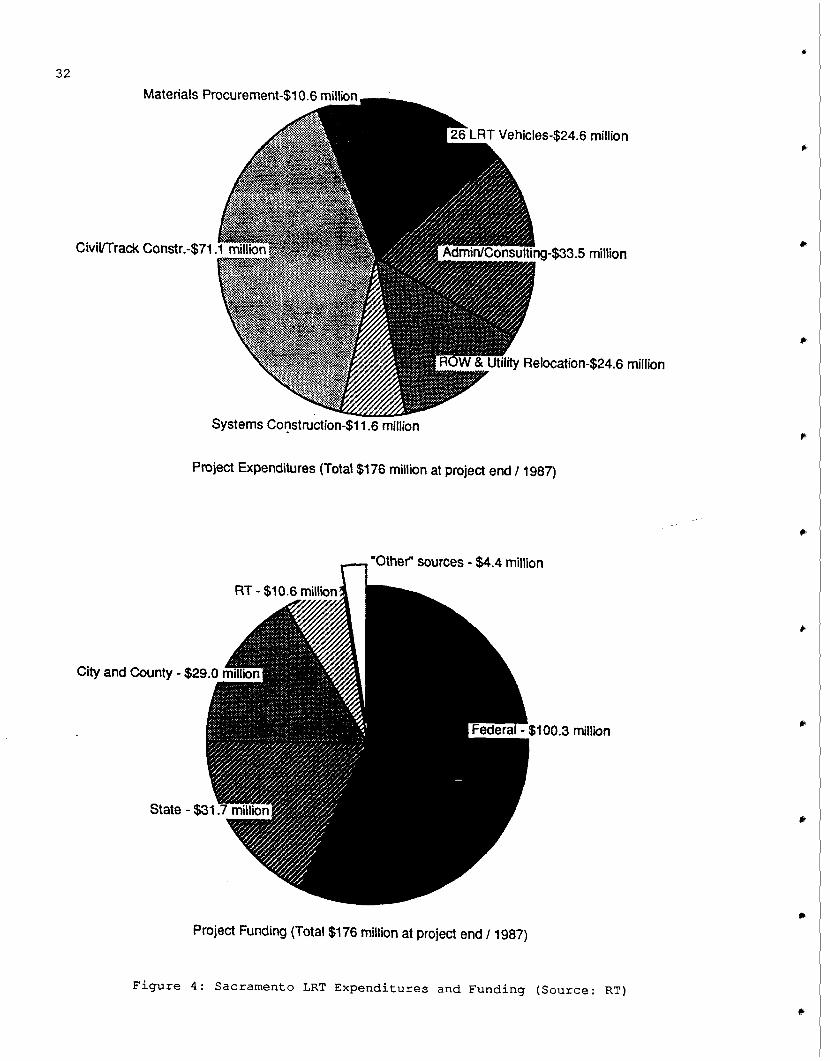
project end in 1987, the primarily single-track facility cost $176 million or
$9.6 million per mile. The total cost, detailed in Figure 4, includes the
cost of 26 light rail vehicles, equipment, land, administration, construction,
and an operations and maintenance facility. The primary funding source for
the $176 million Light Rail Starter Line Project was the federal government
which supplied 57 percent of the project capital. Additional funding sources
were: State (18 percent), City and County (16.5 percent), RT (6 percent), and
"other" sources (2.5 percent). Funding sources are illustrated in Figure 4.
Additional RT Metro information is presented in Table A2 of the Appendix.
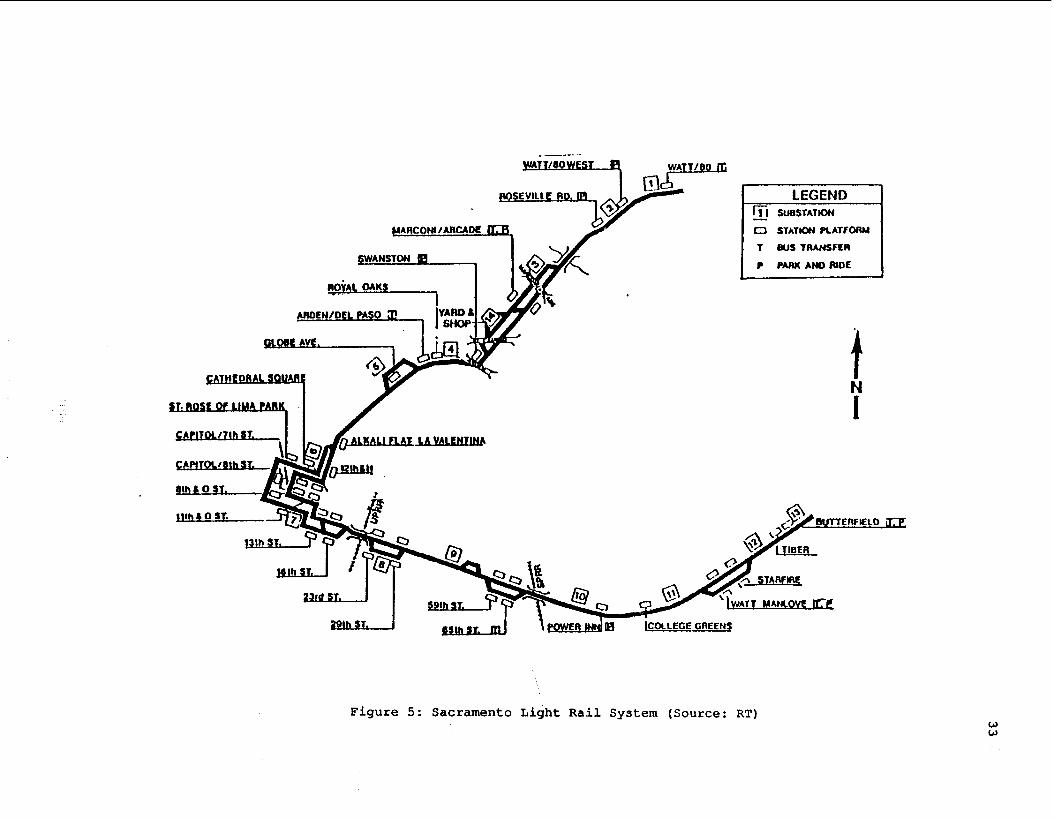
The Route
The Northeast and Folsom Lines both begin in Central City (downtown
Sacramento) with each line extending approximately nine miles into
Sacramento's suburbs (see Figure 5). The line is predominantly single-track
with 40 percent of the route double-tracked to provide for maintenance of
scheduled headways. The routes use unused railroad and/or unused fre~way
right-of-way except in the downtown portion where the vehicles operate on city
streets. The line is characterized as 32 percent grade separated, 58 percent
surface reserved, and 10 percent mixed-traffic (Ref 5).
In downtown Sacramento, or Central City, both lines share sections of track
forming a "loop" of four blocks in length and one block in width. The
northern and southe~n one-block portions of this "loop" intersect the five
block long "K" Street and "O" Street Malls, respectively.
The five-block long "K" Street Mall, initially constructed in the early
1970's, was reconstructed as part of the LRT project at a cost of
approximately $2 million. The reconstruction, which included improvements
such as new trees, brick pavement, new lighting, benches, and outdoor eating
areas, is seen as a positive improvement to a controversial pedestrian mall
that was perceived as a disappointment to many citizens and downtown
merchants. The five-block long- "0" Street Mall was planned in 1977; however,
no work was subsequently started. The construction of the LRT line in
downtown Sacramento, provided the impetus in completing this $1.6 million
mall.
"' 32
CiviVTrack Constr.-$71
Relocation-$24.6 million
Systems Cor:tstruction-$11.6 million
Project Expenditures (Total $176 million at project end /1987)
·other" sources - $4.4 million
00.3 million
Project Funding (Total $176 million at project end /1987)
Figure 4: Sacramento LRT Expenditures and Funding (Source: RT)
!II! I 0 ST.
1111!! 0 ST.
ROYAl. OAKS ; ..
AROEN/DEL PASO jJ!
AVC.
/'\
LEGEND fli SUBSTATION
Cl STATION PlATfORM
I BUS TRAHSffR
f' PAAK ANO RIDE
t N
I
""" STARf!R!
"I WAIT MANlOYf !Ct!
Figure 5: Sacramento Light Rail System (Source: RT) w w
4
34
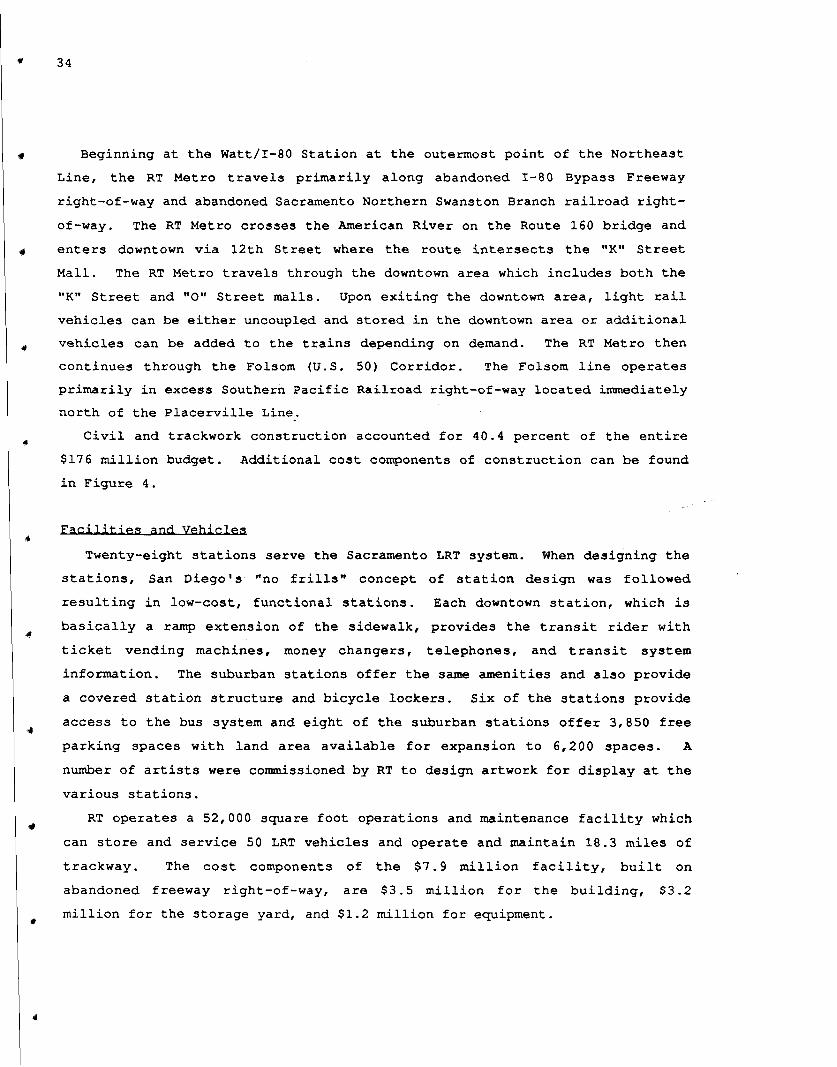
Beginning at the Watt/I-80 Station at the outermost point of the Northeast
Line, the RT Metro travels primarily along abandoned I-80 Bypass Freeway
right-of-way and abandoned Sacramento Northern Swanston Branch railroad right
of-way. The RT Metro crosses the American River on the Route 160 bridge and
enters downtown via 12th Street where the route intersects the "K" Street
Mall. The RT Metro travels through the downtown area which includes both the
"K" Street and "O" Street malls. Upon exiting the downtown area, light rail
vehicles can be either uncoupled and stored in the downtown area or additional
vehicles can be added to the trains depending on demand. The RT Metro then
continues through the Folsom (U.S. 50) Corridor. The Folsom line operates
primarily in excess Southern Pacific Railroad right-of-way located immediately
north of the Placerville Line.
Civil and trackwork construction accounted for 40.4 percent of the entire
$176 million budget. Additional cost components of construction can be found
in Figure 4.
Facilities and Yehicles
Twenty-eight stations serve the Sacramento LRT system. When designing the
stations, San Diego's "no frills" concept of station design was followed
resulting in low-cost, functional stations. Each downtown station, which is
basically a ramp extension of the sidewalk, provides the transit rider with
ticket vending machines, money changers, telephones, and transit system
information. The suburban stations offer the same amenities and also provide
a covered station structure and bicycle lockers. Six of the stations provide
access to the bus system and eight of the suburban stations offer 3,850 free
parking spaces with land area available for expansion to 6,200 spaces. A
number of artists were commissioned by RT to design artwork for display at the
various stations.
RT operates a 52,000 square foot operations and maintenance facility which
can store and service 50 LRT vehicles and operate and maintain 18.3 miles of
trackway. The cost components of the $7.9 million facility, built on
abandoned freeway right-of-way, are $3.5 million for the building, $3.2
million for the storage yard, and $1.2 million for equipment.
35
RT currently operates a fleet of 26 Siemens/Duwag U2A light rail vehicles
and has plans to order six additional vehicles during FY89. The double-ended,
six-axled, articulated vehicles have a seating capacity of 64 persons. The 26
vehicles cost approximately $24.6 million in 1984 ($945,000 per vehicle). The
first vehicle was unveiled November 25, 1986.
Ridership
According to the DEIS projection, HOV daily ridership (115,000 systemwide
daily transit trips and 67,000 daily busway person trips) was superior to LRT
person trips}. UMTA, however, objected to the projected LRT ridership
estimates as being unrealistically high. The Sacramento Transit Development
Agency (STDA) disagree~ with UMTA's assertion, however, the expected LRT daily
ridership was reduced to 20,500 in the FEIS.
It was, however, the perception of many local officials that the "elusive
mystique" of rail transit's ability to attract patronage was ignored and
disallowed during the technical evaluation. UMTA disallowed the use d: an
arbitrary 10 percent increment of ridership to account for the intangible
ridership attracting quality of LRT -- a factor that was allowed in the
Portland modelling process (Ref 2).
In FY88, RT Metro boarded over 3.1 million riders. The average number of
weekday boarding riders on the LRT system was approximately 12,900 riders. On
a typical Saturday, RT Metro boarded an average of 3,200 riders, about 25
percent of the number of average weekday boarding riders. Current daily
ridership, however, is below the levels forecasted in the Sacramento Light
Rail Project Final Environmental Impact Report which predicted daily 1988
ridership at 20,500 riders.
Historical Back~round*
Interest in developing a light rail system in Sacramento arose partly as a
result of the actions of several citizens groups with a common desire to
r Information in this section is primarily drawn from Refs 2 and 6 unless otherwise noted.
36
eliminate proposed construction of several state freeway routes. These anti
freeway community groups, who later formed the nucleus of the Modern Transit
Society (MTS), an extremely active, pro-transit (especially rail)
organization, effectively pressured the Sacramento County Board of Supervisors
into dropping the freeway projects.
In May 1975, the County Board of Supervisors appointed the North-East
Transportation Task Force (NETTF) to advise the Supervisors on the disposal of
the abandoned freeway right-of-way. The NETTF conducted a study of the
transportation needs of northeast Sacramento and released a report of their
findings, The Northeast Area Transportation Study, in August 1976. Among
their recommendations was the withdrawal of a proposed section of Interstate
Highway, the 5.2 mile I-80 Bypass, and the investigation of the feasibility of
constructing light rail transit using withdrawn Interstate funds. MTS members
were very active on the NETTF.
In 1976,. the City of Sacramento began to voice support for the construction
of light rail. The support stemmed from an MTS paper presenting the
development of a no-frills historic trolley loop in downtown Sacramento. As a
result of the MTS effort, the City Council agreed to fund, in conjunction with
the Sacramento Regional Area Planning Commission (SRAPC), a more detailed
study of the trolley concept. The 1977 "Historic Trolley - Sacramento:
Feasibility Study" concluded that the trolley concept was feasible and
warranted further study. The trolley was gaining a wide range of support when
the passage of Proposition 13 in June 1978 caused the project to be suspended.
In August 1978, the issue of light rail was revived when Adriana Gianturco,
as Director of the California Department of Transportation (Caltrans), offered
to fund a portion of a light rail feasibility study of the U.S. 50 (Folsom)
Corridor. Caltran's decision to support LRT was undoubtedly influenced by
Governor Jerry Brown and key state representatives who were basically pro
transit and anti-highway. Because of growing local support for LRT, the City
of Sacramento agreed to accept the Caltrans proposal. RT also approved of the
study and was designated lead agency. Completed in April 1980, the "Folsom
Corridor Rail Transit Feasibility Study" concluded that light rail transit
would be feasible and more easily implemented than other options studied
including HOV facilities. The study was endorsed by the city and county in
•
•
37
May 1980.
Also in 1978, Caltrans, with the assistance of various pro-transit groups,
convinced Sacramento Area Council of Governmentments (SACOG) and the City of
Sacramento to study the potential for the withdrawal of the I-80 Bypass
segment and the feasibility for transit alternatives in the I-80 Corridor.
The "I-80 Multi-Modal Corridor Study", completed in July 1979, recommended the
bypass segment be withdrawn and suggested the need for major transportation
improvements; however, no specific alternatives were specified.
On August 28, 1979, the Sacramento City Council voted to drop plans for
construction of the I-80 Bypass after much lobbying by MTS, Caltrans, and
other pro-transit groups and individuals. On January 11, 1980, Governor Jerry
Brown and the mayor of Sacramento, Phil Isenberg, requested from UMTA and FHWA
a transfer of funds frpm the I-80 Bypass to an unspecified transit project.
UMTA and FHWA approved the transfer of funds in May 1980. Upon learning of
the transfer approval, the preparation of the Draft Environmental Impact
Statement (DEIS) for the I-80 corridor study was initiated.
Coinciding with the commencement of the I-80 corridor DEIS preparation was
the endorsement of the state-supported U.S. 50 (Folsom) corridor study. Upon
recommendation by Gianturco, the Sacramento City Council included the U.S. 50
corridor in the alternatives analysis process for the I-80 corridor.
Completed in April 1981, the DEIS analyzed a total of 10 alternatives in
the I-80 and Folsom corridors. The alternatives ranged from a "no-build"
alternative to either TSM (transportation systems management), HOV, or LRT in
either corridor or both corridors. In June 1981, SACOG produced the UMTA
required "Preferred Alternative Report" in which LRT in both the I-80 and
Folsom corridors was the selected alternative. On June 16, 1981, the city
council endorsed the report as did the county supervisors and RT Board of
Directors.
According to the DEIS, funding sources were intended to be federal
Interstate transfer monies ($98.5 million) and State monies ($25.9 million).
The remaining $6.6 million of the $131 million budget would be borne by local
means (Ref 2). In July 1984, an $18 million cost overrun was disclosed
resulting in RT assuming project responsibility from the Sacramento Transit
Development Agency (STDA), the local agency created in March 1981 to implement
38
the LRT system.
During the preparation of the FEIS and negotiation of funding commitments
from UMTA and the California Transportation Commission (CTC), a number of
objections to the preferred alternative were voiced by staff members of SACOG,
UMTA, and CTC. Staff members questioned the need for such a high dollar
fixed-guideway system in Sacramento, discovered deficiencies in the design of
the fixed-guideway, and criticized the DEIS process and results. The public,
however, continued to overwhelmingly support LRT.
Although UMTA and CTC objected to the project, funding was not withheld.
UMTA could not withhold Interstate transfer funds because the local area from
which Interstate funds are withdrawn is entitled to the funding. The only
recourse available to UMTA was to refuse to provide Sacramento with any
additional capital beyond the. $100 million that Sacramento was to receive from
the Interstate transfer. State funding was approved by CTC because the
State's portion was much smaller in proportion to the federal funding. (The
CTC did not want to be responsible for losing such a large federal grant by
withholding such a relatively low investment.) It was, however, stated that
additional state money would not be made available by CTC. According to R. A.
Johnston et al. (Ref 2): "The issue of concern here is not federal funding
allocation procedures, however, but rather the overwheLming local political
support which was at odds with the CTC and UMTA technical evaluations."
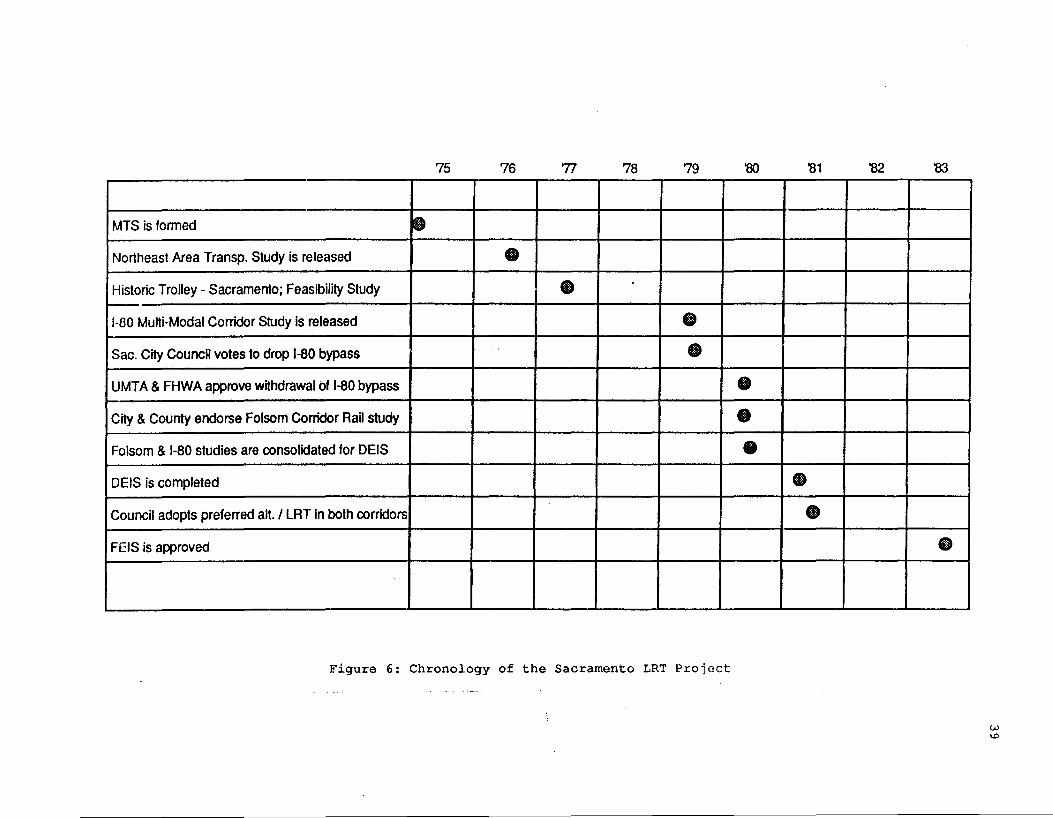
The Final Environmental Impact Statement (FEIS) was approved in August
1983. There was little change between the DEIS and the FEIS with respect to
the comments and objections that were noted previously. A complete project
chronology is shown in Figure 6.
According to the DEIS, the LRT project would cost $87.7 million (1980
dollars). This figure was modified to $112.7 million (1981 dollars) in the
June 1981 "Preferred Alternatives Report." In September 1983, the CTC
approved the LRT project for $131 million. A number of cost overruns
encountered during the engineering design and construction phases eventually
brought the project total to $176 million (1987 dollars). Local sources were
intended to supply approximately five percent of the $131 million project.
Because of the cost overruns, however, the local share increased to 25 percent
of the project total at completion in 1987 (see Figure 4) .
•
75 76 77 78 79 '80 '81 '82 '83
MTS is formed ~ Northeast Area Transp. Study is released • Historic Trolley - Sacramento; Feasibility Study • -· 1-80 Multi-Modal Corridor Study is released • Sac. City Council votes to drop 1-80 bypass • UMTA & FHWA approve w~hdrawal of l-80 bypass • City & County endorse Folsom Corridor Rail study • Folsom & 1-80 studies are consolidated for DEIS • DEIS is completed • Council adopts preferred alt. I LRT in both corridors • FEIS is approved •
Figure 6: Chronology of the Sacramento LRT Project
40
Concl.usion
According to the DEIS, year 2000 Operation and Maintenance costs were the
only major criteria in which the LRT alternative was superior. The LRT
alternative was inferior to the HOV alternative in almost every technical
criteria. Interestingly, lower operations and maintenance costs are given as
the primary reason for supporting LRT by local officials. LRT would have
fared even worse in the evaluation if the study had not been biased in favor
of LRT. For example, the factor used to annualize HOV operating costs was too
high. HOV' s annualizing factor of 322 would be acceptable for local bus
service but not for express bus service operating only during weekdays. If
the factor is changed to 290~ the same factor used for LRT, the operating and
maintenance cost of the HOV alternative become lower than the cost for the LRT
alternative (Ref 2) .
The CTC also asserted that the estimated LRT 1986 operating cost of $4.74
million was too low because San Diego, with fewer vehicles, a shorter line,
actual ridership 55 percent of that estimated for Sacramento, and a frugal
reputation, had a 1983 operating budget of only $4.5 million. LRT
administration costs were also considered too low. The projected FY86 LRT
operating budget attributed only 6.75 percent of the budget to administration;
however, the average administration portion of the budget for all LRT
operators running between 25 and 49 vehicles is 20.2 percent. The CTC also
noted an understatement of labor costs for the LRT option (Ref 2) .
As shown below, ten year capital costs for the projects also favored
projects other than LRT (Ref 3) .
Alternative
LRT HOV TSM
Based on these factors, it become fairly Capital Costs !millions 1980$)
$232 $182 $136.5
obvious that local decision makers were determined to bring light rail to
Sacramento either with or without a favorable technical analysis.
The line-haul portions of the system were primarily constructed on
abandoned Interstate and railroad right-of-way. In the downtown, the LRT
,.
41
lines were built within public right-of-way. While the right-of-way was
relatively inexpensive, the routes are inefficiently located along the
periphery of the dense population between I-80 and U.S. 50.
According to R.A. Johnston et al. (Ref 2), the use of this right-of-way was
another indication of cost cutting that threatened the design of the entire
project. An additional indication of skimping is in the decision to construct
a primarily single-tracked LRT system. (Sacramento was forced to design the
LRT system with the knowledge that all funding beyond the federal and state
contributions would be provided by local means.) Operation on the single
tracked facility could be adversely affected or completely halted if a train
fails to operate strictly to schedule (i.e. excessive dwell time at a station,
train malfunction, conflict with motor vehicles) . Also, the minimum
attainabl~ headway of 1? minutes also provides a fairly low level of service.
A primary factor behind Sacramento's selection of LRT is the broad public
support that LRT enjoyed throughout the entire decision process. The local
community, including public officials, believed that the ability of rail
transit to focus and guide urban development is an important characterist~c of
rail transit which is not considered in the technical evaluation. Local
officials argue that because of the permanence of rail, LRT has a tendency to
attract developers and potential employers to the LRT line and station
locations. HOV and buses, which are not necessarily a fixed-service, do not
have the same attractive quality as LRT. Additionally, since the system was
primarily constructed within abandoned Interstate and railroad rights-of-way,
the effects of construction on businesses and housing were minimal -- only
eight residential dwellings and three business were removed (Ref 2) .
Especially instrumental in bringing LRT to Sacramento was the Modern
Transit Society (MTS) which conducted planning studies, remained active on
various committees and study teams, and lobbied individual decision makers and
groups. Before the DEIS was released, the MTS along with an RT sponsored
Community Task Force for LRT launched a major campaign to build broad
community support for LRT. The community was nearly unanimous that LRT should
be built in both corridors. The RT Board and SACOG unanimously supported the
LRT alternative as did 10 of 11 members of the study's policy committee and
eight of nine City Council members. Indicative of the broad support was
42
support from the 80,000 member Central Labor Council, 46 community
organizations, and a comment by the president of the Sacramento Board of
Realtors that support for the LRT option was probably the first issue that his
organization and the Sierra Club ever agreed upon (Ref 6) .
The availability of state and federal funding is perceived as an important
factor in the local decision to select LRT. If HOV was selected, the area
would forego approximately $25 million in state funding reserved for
construction of _rail transit. Local players also believed that Sacramento
should opt for LRT because future funding probably would not be available for
LRT and that HOV could, and probably would, be built in the future on an
incremental basis (Ref 2).
Sacramento wanted LRT from the beginning and continued its support
thrOU<;Jhout the decision proc.ess. It was a uniform belief among all local
decision makers interviewed by R.A. Johnston et al. (Ref 2) that LRT was
technically comparable to HOV. Key local decision makers, however, believed
that the UMTA technical evaluation process and state and federal • transportation agency staffs were biased against LRT. It was also generally -
perceived at the local level that the technical evaluation did not give enough
weight to the less quantifiable positive effects of rail transit such as
improved environmental quality (reduction in noise and diesel exhaust),
superior ridership-generating qualities of LRT, and the ability of I:.RT to
focus and guide urban growth (Ref 2) . The perceived lower operating costs of
LRT were cited by local officials as an important reason to select LRT.
In conclusion, Sacramento desired a light rail system throughout the entire
study process. The technical analyses did not generally support LRT as the
best alternative, however, the LRT alternative was selected as the preferred
alternative because of a strong political and public preference for LRT.
* Every local official and planner interviewed by R.A. Johnston et al. (Ref 2) believed that the technical process was inherently biased against rail because not enough weight is given to LRT's superior environmental effects such as reduced freeway noise and diesel exhaust. Also, it was believed the staffs of the federal and state transportation agency's were biased against rail.
2. Johnston, R.A., et al., "Politics and Technical Uncertainty in Transportation Investment Analysis, Transportation Research - Part A: General, Vol 21A, No. 6, Pergamon Journals Ltd, Great Britain, 1988.
3. Urban Mass Transportation Administration and Sacramento Area Council of Governments, Draft Alternatives Analysis/Environmental Impact Statement/Environmental Impact Report on Prospective Interstate Substitution Transportation Improvements in North-East Sacramento, California, April 1981.
5. Schumann, John w., "What's New in North American LRT Projects?", Paper Prepared for the 1988 TRB National Light Rail Conference, May 1988.
6. Schumann, John W. and Nelson, Robert W., "Building Consensus for Light Rail: A Tale of Two Cities", Light Rail Transit: Planning, Design, and Implementation, Special Report 195, Transportation Research Board, 1982.
44
•
SAN DIEGO
Overview
San Diego County lies in the southwestern-most corner of the United States.
In 1980, the population of the 4,200 square mile county, bounded on the south
by the Republic of Mexico and on the west by the Pacific ocean, was
approximately 1. 86 million persons with an average county-wide population
density of 450 persons per square mile. Between 1970 and 1980, San Diego
County experienced a 3. 2 percent per year growth rate, the fifth fastest
growing metropolitan area in the country. (Growth rates for California and the
nation were 1.7 percent per year and 1.1 percent per year, respectively.) (Ref
3)
The urbanized area .lies within the western one-third of the county while
the remaining two-thirds, which consists primarily of desert and mountains, is
relatively less populated. The most densely populated portion of the county,
which includes the City of San Diego, lies within the southern portion of the
urbanized area. In 1980, the average population density of the southern
porti-:>n of the county was 1, 350 persons per square mile. Bordering the
southern boundary of the urbanized area is the Republic of Mexico and, more
specifically, Tijuana with a 1980 population of over 700,000 persons (Ref 3).
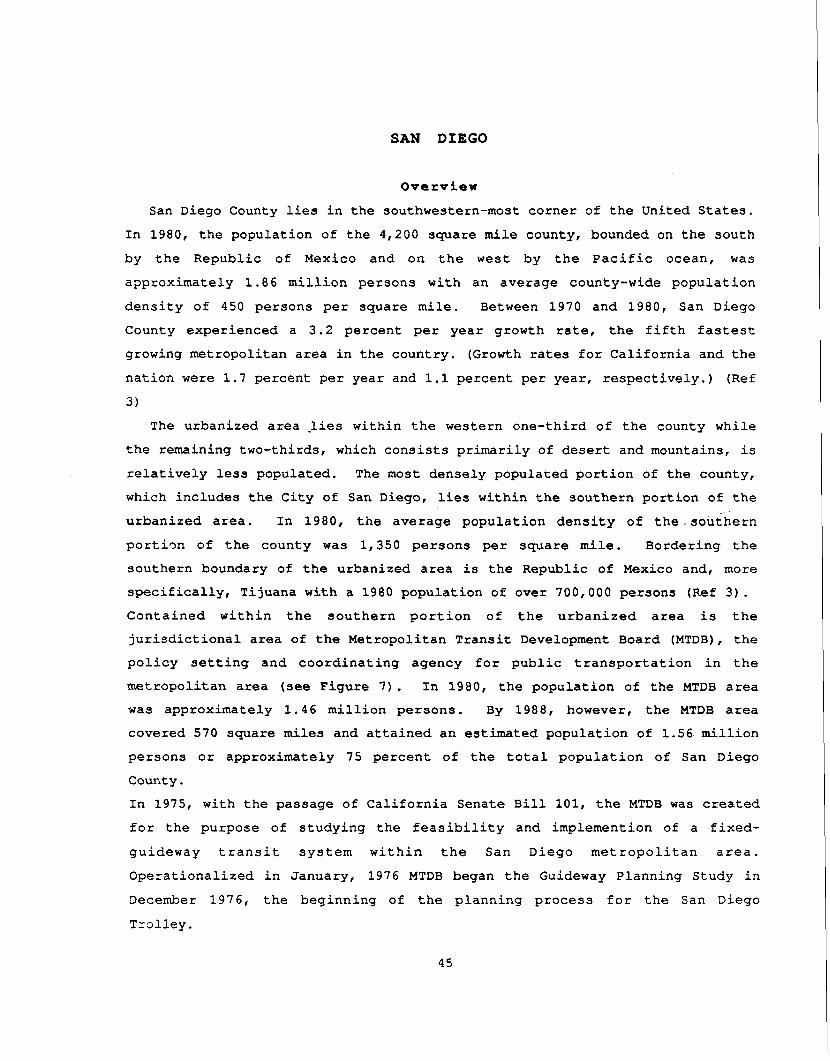
Contained within the southern portion of the urbanized area is the
jurisdictional area of the Metropolitan Transit Development Board (MTDB), the
policy setting and coordinating agency for public transportation in the
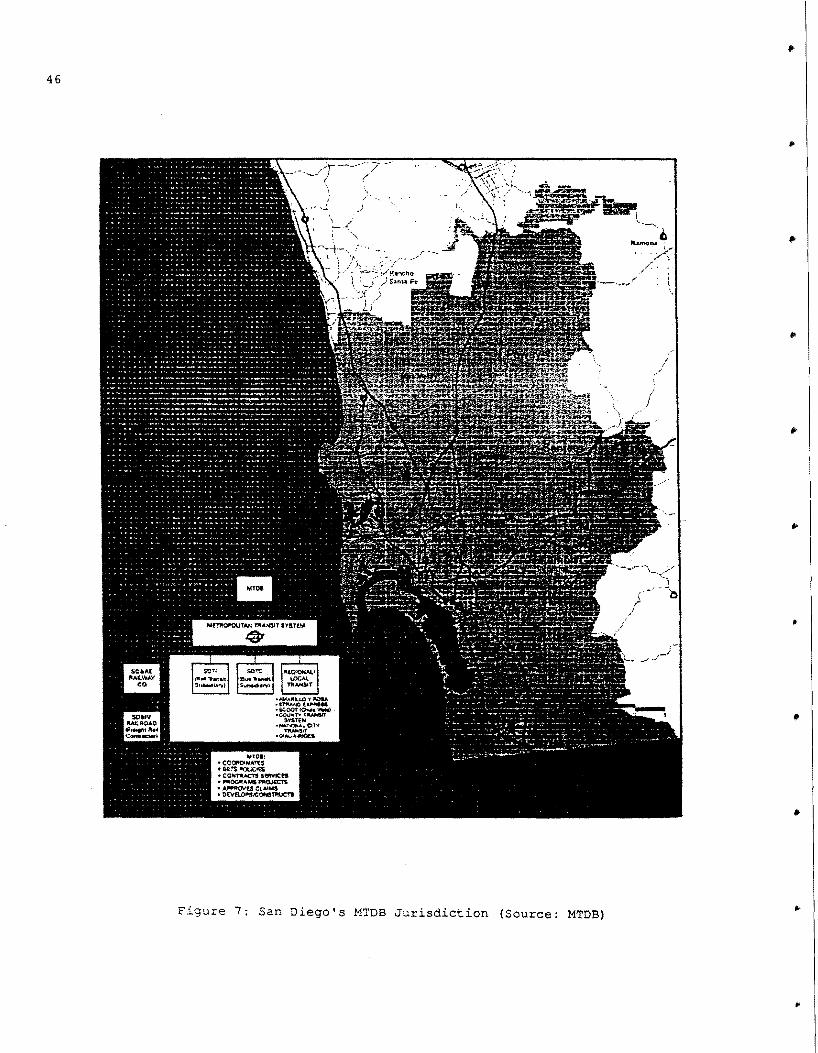
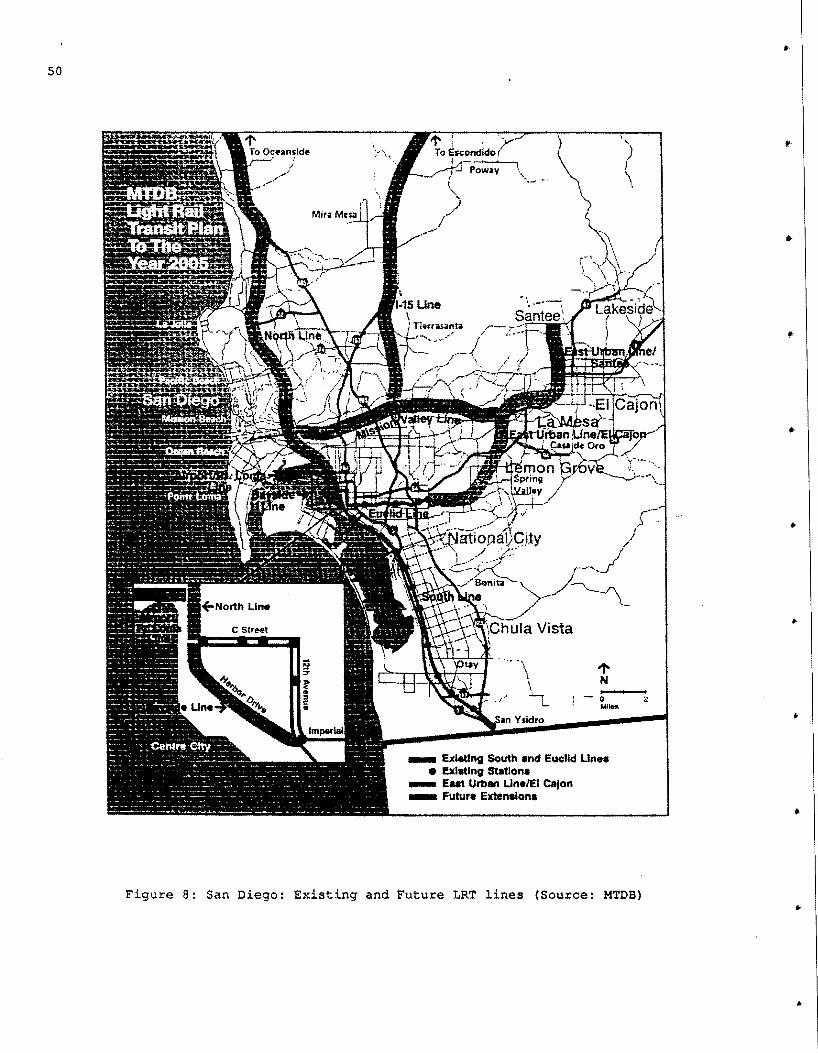
metropolitan area (see Figure 7) . In 1980, the population of the MTDB area
was approximately 1. 46 million persons. By 1988, however, the MTDB area
covered 570 square miles and attained an estimated population of 1.56 million
persons or approximately 75 percent of the total population of San Diego
County.
In 1975, with the passage of California Senate Bill 101, the MTDB was created
for the purpose of studying the feasibility and implemention of a fixed
guideway transit system within the San Diego metropolitan area.
Operationalized in January, 1976 MTDB began the Guideway Planning Study in
December 1976, the beginning of the planning process for the San Diego
T::-olley.
45
46
Figure 7: San Diego's MTDB Jurisdiction (Source: MTDB)
"
47
The MTD Board of Directors, originally containing 8 members, expanded to 15
members in 1984. Membership consists of 4 members appointed from the San
Diego City Council, orne member appointed from each of the area city councils
(Chula Vista, Coronado, El Cajon, Imperial Beach, La Mesa, Lemon Grove,
National City, Poway, and Santee), one member appointed by the San Diego
County Board of Supervisors, and one member appointed by the Governor of
California representing the state and serving as Board Chairman.
The MTDB area currently serves 1.56 million persons in a 570 square mile
region. Responsibilities include:
• light rail transit development, 1
• updating the Short Range Transit Plan,
• preparation and updating the area's Transportation Improvement Program (TIP) which details upcoming MTDB area transit services and capital projects,
administration of Transit Development Act (TDA) and State Transit Assistance (STA) funds to transit operators,
• provision of transit service,
• and coordination of the various transit operators.
As ~~ntioned previously, one responsibility of MTDB is provision of transit
service and coordination for the MTDB area. The area is currently served by
seven fixed-route operators and ten dial-a-ride operators (by contract) with
five of the seven fixed route operators and all the dial-a-ride operators
independently owned transit service providers. MTDB owns the assets of San
Diego Trolley, Inc. (SDTI), the San Diego Transit Corporation (SDTC), and the
San Diego & Arizona Eastern Railway Co. (SD&AE) -- a railroad with 108 miles
of track right-of-way.
In an effort to create a unified transit system, the Metropolitan Transit
System (MTS) was created by MTDB in July 1985. MTS is a symbolic federation
of transit providers created to enhance the public's perception of a unified
transit system. Each MTS provider is identified by an MTS logo signifying to
the rider that the transit system is fully coordinated (i.e. coordinated
schedules, fares, transfers, etc.).
48
In FY88, MTS fixed-route providers operated 363 buses and 30 LRT vehicles
over 865 miles of bus routes and 20.4 miles of LRT lines. The combined fixed
route ridership was 39.4 million boarding riders with LRT serving 9.3 million
or 24 percent of the fixed-route boarding riders. The fare recovery ratio for
all fixed-route riders is approximately 46 percent. The largest transit
service providers, accounting for 89 percent of the total MTDB area ridership,
are San Diego Transit and San Diego Trolley with annual hoardings of 25.8
million and 9.3 million, respectively.
Primary funding for MTDB are from operating income (passenger fares,
charter income, advertising, etc.), Transit Development Act (TDA) monies
provided through a one-quarter percent statewide retail sales tax, State
Transit Assistance (STA) funds generated by a state gasoline sales tax, and
federal assistance. During fY88, the seven MTDB area fixed-route operators
received $25.7 million in fare revenue and $28.4 million in subsidies for a
total of $54.1 million in revenues. Additional MTDB data is presented in
Table A1 of the Appendix.
The San Diego Trolley*
In December, 1976, the MTDB began the first phaseof an 18-month Guideway
Planning Project study. Phase 1 involved the evaluation of candidate
corridors based on the Regional Transportation Plan while Phase 2 of the
study, beginning in April 1977, involved additional screening of corridors,
the selection of the preferred corridor, and the evaluation of transit
alternatives within the chosen corridor. As a result of the project study,
the South Bay corridor was selected.
The South Bay corridor, extending southward from Centre City San Diego to
the Mexican Border, impacts approximately 38 square miles (24,000 acres). In
1980, the primary land uses in the corridor were residential (31.2 percent),
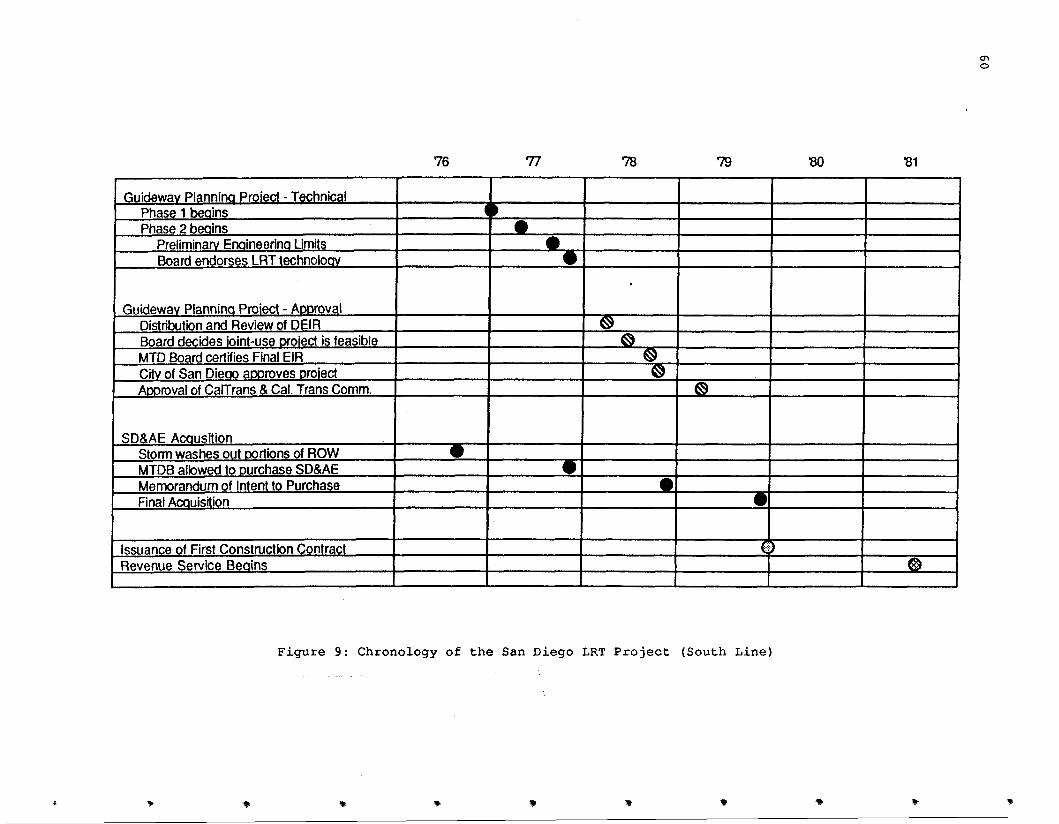
Guidewav Plannina Proiect - Aooroval Distribution and Review of DEIR ~ Board decides ioint-use oroiect is feasible ~·
MTD Board certifies Final EIR ~ Citv of San Dieao aooroves oroiect ~ Aooroval of CarTrans & Cal. Trans Comm. ~
SD&AE Acausition Stann washes out oortions of ROW • MTDB allowed to ourchase SD&AE • Memorandum of Intent to Purchase • Final Acauisition •
Issuance of First Construction Contract Q}
Revenue Service Beains
Figure 9: Chronology of the San Piego LRT Project (South Line)
• •
'80
•
'81
0
0'1 0
61
approximately 25 percent more expensive than the estimated cost of $68.5
million for single-track rail facilities, vehicles, and land. After
completion of Phase II construction in 1983 (double-tracking and 10 additional
vehicles), the total cost of the project was $116.6 million. Although the
planning estimate of $116.8 million and the final cost of $116.6 million
appear very close, it should be noted that the initial planning estimate
includes all capital costs for bus and rail facilities constructed between
initiation of construction and 1995, while the actual total of $116.6 million
is the cost of the rail facility at completion of construction in 1983.
The acquisition of the SD&AE rail line was a key factor in the decision to
implement light rail and also was an important factor in the selection of the
South Bay Corridor. Once the corridor was selected, rail became a highly
viable alternative because the infrastructure was basically in-place in two
major corridors in the region. The relatively inexpensive SD&AE acquisition
(108 miles of rail line for $18.1 million (1979$) was also important because
the MTDB enabling legislation and the policies later adopted by the MTD Board
required the selected guideway technology to be low cost.
With the MTDB restricted to developing a rail system, the primary decisions
made during the Guideway Planning Project were the type of rail transit
technology to be tested (light rail, heavy rail, or automated small vehicle
transit), identification of the corridor in which the alternatives
(alternatives consisted of light rail in combination with various all-bus
networks) would be evaluated and eventually implemented, and the selection of
the preferred alternative. While the reasons cited by the MTD Board for
selecting the light rail mode are given in the text, the ultimate selection of
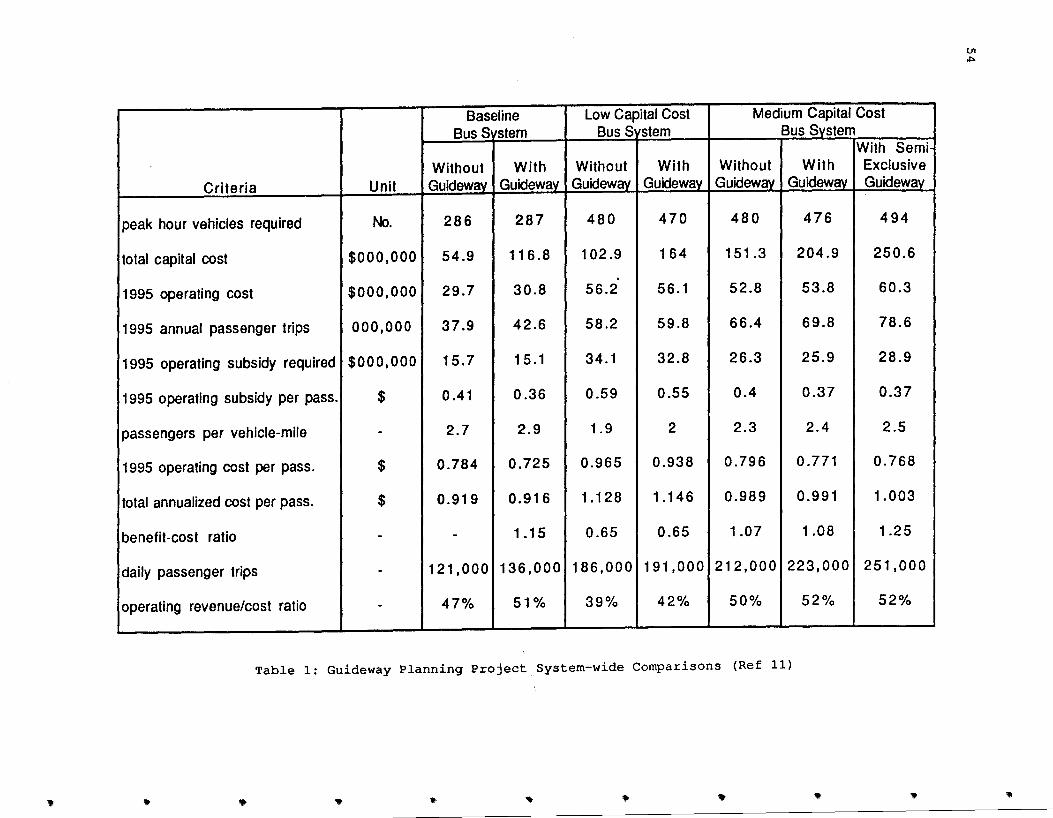
the "Baseline Bus System with Guideway" alternative was a straightforward
choice based on the alternative's technical superiority over the other
alternatives in almost every category (see Table 1) .
Within the context of this report, the ultimate choice of a light rail
system in San Diego was not a choice of light rail versus busway but a choice
between light rail versus other rail technologies (as well as a choice between
light rail in combination with various all-bus alternatives) . The choice to
implement rail was, in effect, made when the legislature created the MTDB, an
agency with the primary purpose of implementing a rail system.
62
References
1. Wahl, Dennis J., "San Diego Light Rail Update", San Diego: Metropolitan Transit Development Board, April 1988.
2. San Diego Association of Governments, "Light Rail Implementation", San Diego: San Diego Association of Governments, February 1984.
3. San Diego Association of Governments, Trenda Before the San Diego Trolley, San Diego: San Diego Association of Governments, July 1982.
4. Metropolitan Transit Development Board (fact sheets): "San Diego Trolley Light Rail Vehicle", September 1987; "Metropolitan Transit Development Board", March 1988; "The San Diego Trolley South Line and Euclid Line Summary", March 1988; "East Line Light Rail Transit to El Cajon", May 1988.
5. Metropolitan Transit Development Board, Metropolitan San Diego Short Range Transit Plan FY 1989-1993, · San Diego: Metropolitan Transit Development Board, Septe~er 1988.
6. Schumann, John W., "What's New in North American LRT Projects?", Paper Prepared for the 1988 TRB National Light Rail Conference, May 1988.
7.
8.
Robenhymer, Robert, "The San Diego Trolley", Tranait, Land Uae, & Urban Form (edited by Wayne Attoe), Austin: Center for the Study of American Architecture, The University of Texas at Austin, 1988.
Bauer, Arthur E., "LRT Development: State Perspective", Light Transit: Planning, Design, and Implementation, Special Report Transportation Research Board, 1982.
Rail 195,
9. Thorpe, Richard D., MTDB, "Construction of the San Diego Light Rail System in an Era of Fiscal Constraint", San Diego: Metropolitan Transit Development Board, March 1982.
10. Coil, John A., "The San Diego Light Rail Story", San Diego: Metropolitan Transit Development Board, July 1980.
11. Bechtel Incorporated, "Final Report: Guideway Planning Project", Task Report No. 19, June 1978.
•
•
SAN JOSE
(Santa Clara County)
Overview
Located at the southern tip of the San Francisco Bay, Santa Clara County
has a 1988 population of approximately 1.4 million persons. The City of San
Jose (pop. 637,000), 44 miles southwest of San Francisco, is located in the
northern part of the county known as Silicon Valley, a major electronics and
high technology area. Santa Clara County is currently constructing a 20.3
mile light rail line extending from the sprawling industrial parks of Silicon
Valley, through the San Jose CBD, to the populated residential areas south of
the CBD.
When transportation .alternatives for the San Jose area were studied in the
late 1970's and early 1980's, the area was experiencing major growth from the
evolution of Silicon Valley. Experiencing the heaviest growth was the 16 mile
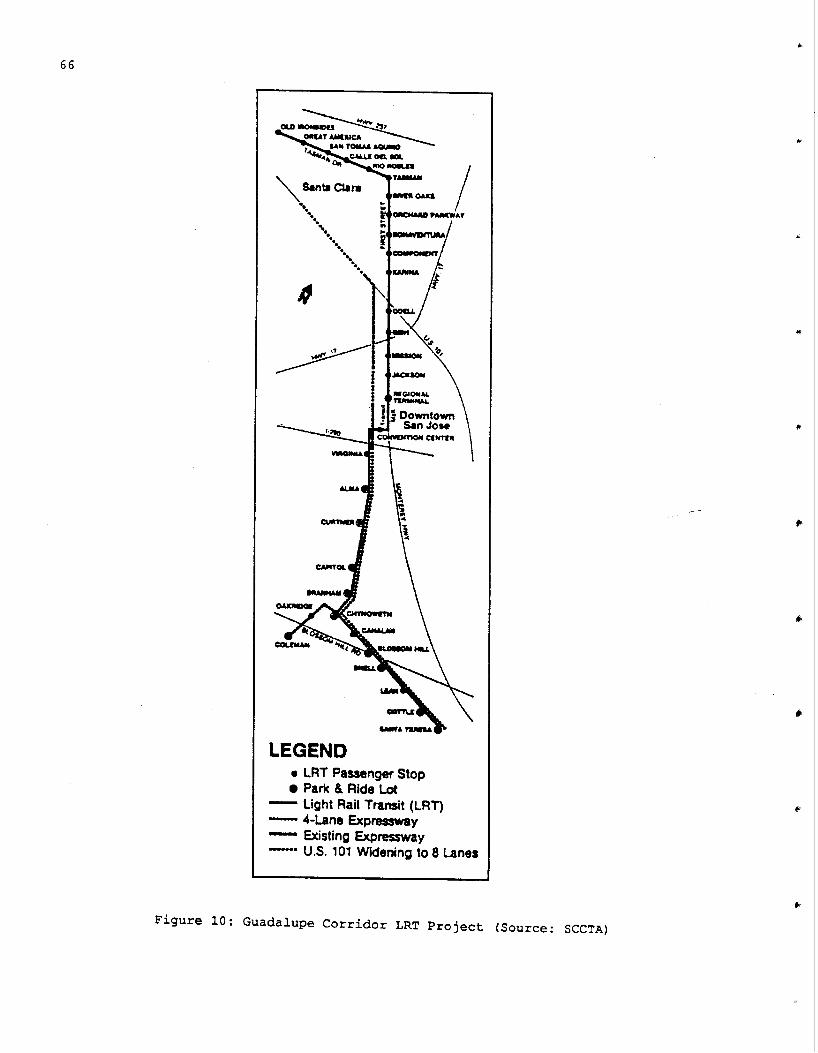
long, five mile wide Guadalupe Corridor which will eventually accommodate San
Jose's LRT system upon completion in 1991.
In 1975, population of the Guadalupe Corridor totaled 360,000. According
to the Guadalupe Corridor Preferred Alternative Report (Ref 1), the population
of the corridor is expected to grow to 420,000 by 1990, a 17 percent increase.
During the same 15 year period, however, the number of jobs within the
corridor are to increase by 105 percent from 187,000 to 383,000. As a result
of the expected growth, the number of person trips within the corridor are
forecasted to increase over 50 percent of the 197 5 demand of 1. 2 million
trips. Between 1980 and 1990, 80 percent of all manufacturing jobs locating
within Santa Clara County are expected to locate in the Guadalupe Corridor.
A large portion of the transportation needs of Santa Clara County are
provided by the County. The Santa Clara County Transportation Agency (SCCTA)
is comprised of ten divisions with responsibilities ranging from planning,
operating, and maintaining the county-wide bus system to managing and
operating the county's three general aviation airports. The County is also
responsible for the administration and operation of the area's light rail
system. The remaining Transportation Agency departments are: Administration,
63
64
Design and Construction, Fiscal Resources, Human Resources Development,
Marketing, Roads Operations, and Planning and Property (Ref 2).
The SCCTA provides transit service in a 326 square mile service area
populated by over 1.43 million persons. Bus service is provided by 526 buses
operating over 77 routes. The total bus system consists of over 1,396 one-way
miles of bus route. The agency is also operating 50 light rail vehicles over
the northern one-half of the planned 20.3 mile system. The southern portion
of the system is under construction and scheduled for operation in mid-1991.
As of the close of FY88, the transit system boarded over 35.2 million
transit riders, an average of 118,432 weekday boarding riders. The total FY88
expenses and revenue for the bus and rail divisions of the Transportation
Agency was $114.3 million and $156.5 million, respectively. Passenger revenue
of $11.34 million covered ~pproximately 10 percent of the total transit
expenses. Additional SCCTA data is presented in Table Al of the Appendix.
Primary operating revenue for the transit system is supplied through a one-
half cent local transit sales tax. Additional funding is provided by state
gas tax monies and federal formula monies.
The Guadal.upe Corridor Light R.ail. System
In 1981, the Guadalupe Corridor Draft Environmental Impact Statement (DEIS)
was completed resulting in the selection of light rail, expressway, and
bicycle facility components as the preferred alternative. As reported in
December 1981, the total capital cost of the alternative was estimated at $277
million (1980$) with the light rail, expressway, and bicycle components
accounting for approximately $187 million, $89 million, and $1 million,
respectively (Ref 1) .
As the project progressed from preliminary engineering through final
design, the anticipated costs and construction time continued to increase
because of major scope changes. The initial system was planned to be
relatively simple; however, as the project developed, local politicians began
to ask for additional improvements. For example, costly noise abatement walls
not originally included in the project were added. Also, the southern portion
of the LRT line, which was expected to operate within the right-of-way of an
expressway, was completely redesigned after the expressway segment was
65
unexpectedly upgraded to freeway standards. The conversion of the highway
facility from expressway to freeway required substantial addi-tional costs for
the re-design of the LRT system in the median sections as well as the capital
costs required for more elaborate station and pedestrian access facilities
(i.e. crosswalks, escalators, etc.).
Several unforeseen problems also resulted in cost overruns and schedule
delays. For example, the discovery of an ancient Indian burial ground in the
LRT right-of-way created schedule delays and cost increases as measures were
taken to exhume, catalogue, and relocate the remains. Additional construction
delays were incurred by both the freeway and LRT project when a lawsuit forced
the redesign of a critical highway interchange just as construction was to
begin (Ref 4) .
Because of major r~visions in the project scope and several schedule
delays, the estimated cost to complete the LRT system a~ of October 1988 is
$556.1 million dollars for the LRT portion alone. The 1988 estimate also
includes the cost of a $44.6 million downtown transit mall, not included as a
component of the preferred alternative, and an additional $15 million in
escrow pending litigation between the county and utility company regarding the
cost of relocating utilities. By project completion, the following agencies
are expected to have contributed as follows: UMTA-$257.6 million (46 percent),
SCCTD-$191.1 million (34 percent), the State of California-$98.7 million (18
percent), and the City of San Jose-$8.7 million (2 percent). All local monies
(i.e. $8.7 million from San Jose) and a portion of UMTA and SCCTD monies were
used in the construction of the transit mall.
Upon completion in mid-1991, the agency will operate a 20.3 mile LRT system
between the Silicon Valley employment area, through the San Jose CBD, to the
residential areas south of the downtown (See Fi~~re 10) . A portion of the
northern section linking Silicon Valley with the San Jose CBD began revenue
service in mid-December 1987. It was June 1988, however, before the complete
northern portion of the line extending from the transit mall located in the
downtown San Jose to the Silicon Valley area north of the CBD was operational.
The southern 10 mile section, eventually extending to the residential areas
and major IBM employment center south of downtown, is under construction and
66
OI.D~h, ~~~~-~ 1 IAIOTOMAa~
~ .. ~~. c.u.l DG.-0.. --.a
"\_ S.ntll Clara .. ... .. .... .. ·· .. '· ··.
~ i I
LEGEND
-
• LRT Passenger Stop • Park & Ride Lot
- Light Rail Transit (LRT) - 4-Lane Expressway - Existing Expressway -· U.S. 101 Widening to 8 Lanes
scheduled to open in mid-1991. Additional Sacramento LRT data is presented in
Table A2 of the Appendix.
The Route
The LRT line, which is to extend from the Great America theme park in north
Santa Clara County to the primarily residential areas south of Santa Clara, is
completely at-grade. The northern portion of the system uses the median of
major arterials while the southern portion, which is currently under
construction, will operate primarily in the median of two state freeways being
constructed as a portion of the light rail/freeway/bicycle project.
Approximately 52 percent of the complete system will be surface reserved while
the remaining 48 percent will be grade-separated right-of-way (Ref 3) .
Beginning at the Great America theme park area, the light rail lines travel
along two arterial streets to the downtown San Jose transit mall. The $44.6
million transit mall, completed in mid-1988, provides for three transit stops
in each direction. Conceived as a means of increasing downtown development
and providing an attractive focal point for transit activities, the following
improYements were included: the planting of 500 mature sycamore trees,
decorative fountains, granite pavers, stainless steel and glass transit
shelters, and street furniture. The 10-block transit mall, forming a one mile
loop, is designed to accommodate light rail vehicles (LRV' s), antique
trolleys, buses, autos, and pedestrians.
After leaving the downtown transit mall, the line will enter the freeway
median of State Route 87 (under construction) and travel south to the
intersection of State Route 85 (under construction) where the line will split.
A portion of the line will continue to the west as a double-tracked facility
in the freeway median of State Route 85 serving residential areas, Santa
Teresa Hospital, and IBM's regional headquarters. The other portion, less
than a mile in length, will serve residential areas as a single-track facility
operating in a portion of the abandoned Lick Branch railroad right-of-way (Ref
1) •
Upon system completion, travel time from end-to-end will be approximately
55 minutes. Speeds on the mall are approximately 10 mph and along city
68
streets the LRV's operate at about 35 mph. Maximum speeds along the freeway
segments is 55 mph (Ref 4) •
Facilities and Vehicles
Thirty-three stations and stops complete with wayside lifts and ticket
vending machines will serve the LRT system upon completion in 1991. Passenger
stops along the north segment are primarily low-level platforms with canopies;
however, stations along the south segment of the freeway will be much more
elaborate. These stations will be equipped with elevators and escalators to
move people to the freeway median from adjacent park-and-ride lots providing
over 6000 free parking spaces. Originally, station designs called for a much
simpler south segment station design because transit patrons accessed median
stations by crossing the expressway at signalized intersections. When the
expressway was upgraded to a freeway, however, the pedestrians -had to be
completely removed from the freeway traffic by means of pedestrian walkways,
tunnels, or overpasses. These costly pedestrian grade separations were a
major factor in the LRT system's substantial cost increase over initial
estimates.
A $20 million maintenance and storage facility, dedicated in October 1986,
is designed to provide for the operation, storage, and maintenance of the
systems 50 LRV's (Ref 4).
SCCTA operates 50 light rail vehicles manufactured by Urban Transportation
Development Corporation (UTDC) . These six-axled, double-ended, single
articulated vehicles are 12 ft. 5 in. high, 8 ft. 8 in. wide, and 88 ft. 6 in.
long. The vehicles are designed to accommodate 165 passengers during the peak
period (75 seated and 90 standing) • Each vehicle is equipped to accommodate
two wheelchairs. The vehicles, which began arriving in April 1986, were
purchased for $940,000 per vehicle.
In addition to the 50 modern light rail vehicles, the system will-operate
six antique trolley cars in the downtown mall during off-peak hours. These
vintage vehicles, two of which were operated on San Jose streets between 1912
and 1934, are being restored by volunteers of the private, non-profit San Jose
Trolley Corporation (Ref 6) .
...
69
Ridersh~
The Preferred Alternative Report of 1981 forecasted 45,000 average weekday
riders in 1990. During preliminary engineering, however, the estimate was
revised to 40,000 average weekday riders, and again in 1986, private
consultants re-estimated ridership at 20,000 average weekday riders by the
year 2000, 55 percent less than the original estimate. This revised estimate
was a result of factors involving more plentiful and less expensive petroleum,
a slow down in development especially in the Silicon Valley area, and the
unanticipated funding of additional highway improvements.
As of August 1988, the completed north section of the system is
accommodating over 6200 average weekday riders. Ridership on this portion has
increased by over 600 percent since the north section was connected to the
downtown transit mall. Current ridership is higher than the consultants
estimate of 3000 to 5000 average weekday riders expected at completion of the
northern half of the project .
. Historical Background
Two studies conducted in the mid-1970's provided the impetus for additional
study of the Guadalupe Corridor and the eventual selection of the light
rail/expressway/bicycle facility alternative. In 1974, Santa Clara County
began the "Rapid Transit Development Project" where the economic and
environmental impacts of large-scale transit systems were analyzed in several
high demand corridors. As a means of achieving the project's high ridership
goal, the staged implementation of a medium-capacity, high-performance fixed
guideway system supported by an extensive bus collection system was
recommended. In another study completed in 1976, the feasibility of light
rail or bus transit alternatives in several. of the high demand corridors
identified in the 1974 study were analyzed. The State Highway 87 right-of-way
(Guadalupe Corridor) (which had been masterplanned along with the State
Highway 85 right-of-way since the late 1950's but never built) and a portion
of the Southern Pacific Railroad/Monterrey Highway corridor were designated as
the most feasible route with the greatest ridership potential .
• Primary reference for this section is Ref 7 unless otherwise noted.
70
The draft report of the Santa Clara Valley Corridor Evaluation Study
(SCVCE) was completed in 1978. The SCVCE study, which was actually Phase I
(system planning) of UMTA' s two-phase "Alternatives Analysis" process,
analyzed nine transportation alternatives and several 1990 land use scenarios.
A principal recommendation of the study was a detailed evaluation of
transportation alternatives in the Guadalupe Corridor.
The SCVCE 1979 final report, recommended State Route 85 and State Route 87
as primary corridors for transportation development. The report also
recommended acquisition of the remaining right-of-way property and subsequent
construction of a four-lane freeway spur within a portion of the right-of-way.
A detailed study of transportation options for the Guadalupe Corridor was also
recommended. The report recommendations were adopted by the Association of
Bay Area Governments (ABAG), Metropolitan Transportation Commission, County of
Santa Clara, and twelve of the fifteen cities and towns located in the county.
In 1980 and 1982, final environmental impact reports were prepared
documenting the potential effects of protecting the SH 85/SH 87 corridor from
future development. Additionally, the reports were intended to preserve the
right-of-way property for future transportation uses.
In 1981, the Guadalupe Corridor Draft Environmental Impact Statement was
completed. The report analyzed fourteen highway/transit alternatives ranging
from a null (do-nothing) alternative to busway/HOV and LRT alternatives. The
busway/HOV and LRT alternatives were analyzed both individually and in
combination with highway projects. Commuter rail alternatives were also
considered. In November 1981, the Light Rail/Expressway/Bicycle Facility
alternative was endorsed as the locally preferred alternative by the City of
San Jose, the City of Santa Clara, and the Santa Clara County Transit District
Board of Supervisors. Subsequently, support from the Guadalupe Corridor Board
of Control, the Metropolitan Transportation Commission, and the Guadalupe
Corridor Technical Advisory Committee was also received. The alternative also
received substantial support from the general public. Cal trans, however,
endorsed an exclusive light rail alternative, but in a letter to the Guadalupe
Corridor Board of Control, agreed to actively support the local decision (Ref
1) .
,
71
The availability of funding played an important role in the local decision
to support light rail. In 1976, county voters passed a 1/2 cent sales tax
establishing a tremendou.s reserve of capital for the transit district.
Additionally, state funding was made available for light rail because of the
extremely anti-highway, pro-transit influence of Governor Brown as well as a
restricted definition of fixed-guideway transit where busways were not legally
interpreted as fixed-guideway facilities. With the substantial reserve of
local monies, the federal portion was expected to be lower than the normal 80
percent. Initial estimates presented in the Preferred Alternative Report
estimated the capital funding shares at 50-70 percent federal, 20-36 percent
state, and 10-14 percent local (SCCTD) (Ref 1). Major scope changes and
schedule delays substantially increased the local funding portion and resulted
in the following funding breakdown (as of 10/88) : 46 percent UMTA, 18 percent
state, and 36 percent local.
Federal funding for the project was allocated by Congress against the
wishes of UMTA.** Local officials perceived that UMTA believed the technical
process was being slanted in favor of LRT. Several times UMTA questioned the
capital intensiveness of the busway project. Local officials believe they
adequately addressed UMTA's questions. UMTA, however, was never completely
satisfied.
According to the 1981 Preferred Alternative Report (Ref 1), initial capital
costs (1980$) cf the busway and LRT would be approximately $100 million and
$187 million, respectively, making the LRT system approximately 87 percent
more capital intensive than the busway. With the inclusion of operating and
maintenance costs, the annualized costs and annualized benefits become:
Bus way
LRT
Annualized Costs
$13.0 million
$17.7 million
Annualized Benefits
$21. 9 million
$23.9 million
Benefits/Costs
1. 68
1.35
Although LRT was more costly, local support of the LRT system was unaffected.
Based on the annualized data presented above, it was stated in the Preferred
** There was strong congressional support for the project. One local source stated: "Our Congressmen went out on a limb to support (the locally preferred alternative) and felt o.k. doing so because of the universal support at the local level."
72
Alternative Report that "both alternatives were good investment choices."( Ref
1, p 27)
Light rail experienced strong community support throughout the process. On
October 7, 1981 at a public hearing, 14 of the 21 speakers (67 percent) and 26
of 30 (87 percent) written statements received were in favor of light rail as
an independent alternative or in combination with an expressway. The Modern
Transit Society (MTS) was very vocal in supportive of light rail as the only
alternative - no busway or freeway included in the alternative. According to
a local source, the only other substantial support was for the construction of
highway facilities. A strong bicycle society was also very vocal in the
process. These highway and bicycle proponents were instrumental in obtaining
the expressway and bicycle lane provisions in combination with the LRT
alternative.
There were a number of local individuals very active in support of light
rail. According to a local source, the choice of light rail was a "foregone
conclusion" in the minds of many of the local politicians. These politicians
perceived light rail as an investment in the future and our progeny. It was
the opinion of another key local official that San Jose is "blessed with
political leaders who have a clear vision of the future they would like to see
happen in the county and they have remained in office for 10-15 years - a very
stable and constant political base." This local official then adds: "The
technical factors have been important but secondary to this vision."
Conclusion
From the mid-1970's to the early 1980's, the San Jose area was booming
economically. Growth was occurring at a phenomenal rate throughout the
Guadalupe corridor and, especially, north of downtown San Jose in the Silicon
Valley area. The area was anticipated to continue to prosper into the 1990's;
however, area growth slowed considerably. Because of the projections of high
growth and the resulting mid-1980's building boom, there was a three year
surplus of office space.
The anticipated high growth of the Silicon Valley played an important role
in the justification of light rail. When the technical analyses were being
prepared, it was assumed that the area would continue to grow substantially.
•
..
73
This growth assumption, along with several other assumptions that have since
proven to be inaccurate, resulted in a DEIS ridership estimate of
approximately 45,000 riders per day in the year 1990 for both the busway and
LRT. {In 1986, a revised estimate using new assumptions resulted in a year
2000 estimate of 20,000 riders per day less than half of the original
estimate.) Although the two fixed-guideway alternatives were comparable in
terms of ridership, the fact that the ridership value was high provided local
officials with an additional reason to justify light rail. It was the local
opinion that, because of high ridership, the operating costs associated with
light rail would be lower due to the need for fewer vehicle operators.
The transit district has received negative press because of cost increases
and schedule delays; however, transportation is still perceived as the number
one issue in the entire county (far above crime and housing) . Polls have also
shown that the community continues to desire rail transit.
The availability of land in the corridor was an important factor in the
decision to implement some form of fixe~-guideway. In the southern portion of
the project approximately 10 miles of freeway corridor had been masterplarined
since the late 1950's. This availability of undeveloped land, much of which
was already state or county owned property, prompted several earlier planning
studies that ultimately led to the Guadalupe Corridor study. It was a local
opinion, however, that the availability of land did not present an advantage
of LRT over bu~way since both modes required the same amount of real estate.
Key cost-effectiveness analysis information for the Expressway/Busway and
Expressway/LRT alternatives as presented in the Preferred Alternative Report
are as follows {discount rate of 5 percent, year 1990 estimates, 1980$) :
Busway/Expwy 1) annualized total cost per pass. 1.38
2) incremental annualized cost per incremental pass. 1.29
3) operation and maintenance {O&M) subsidy per pass. 0.75
4) avg. 1990 O&M cost per pass. 1.21
5) incremental annualized O&M cost per incremental pas. 0.36
LRT/Expwy 1.45
1.88
0.70
1.17
0.17
Difference -4.8 %
-31.4 %
+7.1 %
+3.4 %
+112.0 %
74
The LRT alternative is superior to the busway alternative in only three of the
ten cost effectiveness measures, all relating to operations and maintenance
costs, presented in the Preferred Alternative Report average 19 90
operations and maintenance cost per passenger, annualized operations and
maintenance cost per passenger, and incremental operations and maintenance
cost per incremental passenger. Additionally, according to local sources, the
rising costs and uncertain future availability of petroleum was an important
factor in the decision to support light rail. It was estimated at the time of
the DEIS that the local electricity supplier generated approximately 40
percent of their electricity by hydroelectric means (Ref 1) .
It was the local opinion that both alternatives were economically
comparable. A statement taken from the Preferred Alternative Report, however,
emphasized the superiority o~ LRT in the operations and maintenance cost per
passenger category by implying future LRT operations and maintenance costs may
decrease beyond the 1990 estimate because "these cost-per-passenger costs,
however, are only for a single point in time, 1990, and do not consider any
future growth in transit ridership and resulting operating and maintenance
costs beyond 1990" (Ref 1, p. B-22).
The decision to implement a light rail system in San Jose was primarily a
local political decision made, in effect, prior to the results of the
technical study. It was a local perception, however, that the technical study
served a secondary function -- justifying LRT over busway based on the opinion
that LRT was comparable to busway, not superior. In the eyes of many local
officials, the LRT investment was an investment in the future of the city.
LRT received broad local political and public support throughout the
decision process. Several pro-LRT members of the County Board of Supervisors
also served on the County Transit District Board of Supervisors and the Board
of Control for the Guadalupe Corridor Alternatives Analysis creating a strong
base of political support for LRT. Several groups such as the MTS were very
vocal in support of LRT alternatives while, on the other hand, community
support for busways was somewhat non-existent (although there was substantial
support for the construction of highways) . Because of the somewhat universal
support among the local constituency, Congressional support of the project was
strong and the project was funded against the wishes of UMTA staff. This
•
75
strong base of public support and the local politicians pro-rail philosophy
were the instrumental factors in deciding to implement LRT.
The local pro-LRT political position was bolstered by the results of the
technical analysis. Although capital costs for the LRT system were
substantially higher, the total costs, which included operations and
maintenance costs, indicated that both alternatives were "good investment
choices". Also, ridership among the two alternatives was essentially equal;
however, the fact that the estimate was "high" tended to favor LRT over busway
because of potentially lower operations and maintenance costs per person.
This comparability of modes tended to, in effect, support the ultimate
decision for LRT because the political and community support was present.
The LRT decision would probably have been more difficult if the results of
the technical report tended to overwhelmingly support busway. The ridership
estimates were made under the inaccurate assumption that fuel prices would
continue to increase and that growth would continue at a high rate. Also, as
a result of a state appropriation, the expressway segment of the preferred
alternative was later upgraded to freeway standards -- dramatically increasing
the capacity of an overcrowded highway system. If these new trends and the
additional capacity of the highway system were taken into consideration,
anticipated LRT ridership would have been lower and, as a result, the ultimate
selection of light rail transit would have been much more difficult to obtain.
A statement made by a local official best sums up the San Jose light rail
decision process:
"Certainly, our decision to build a light rail system could not be justified on an immediate economic payback requirement. It was by far the most expensive alternative in terms of capital costs. It's initial ridership expectations were marginal at best. But local political leaders were convinced, rightfully or wrongfully, that only light rail would give them the kind of future quality environment and land use pattern they wanted to see happen. And there was a realization that we're probably building this system for our children and grandchildren. But future generations would look back and thank us for the foresight and vision we had."
76
References
1. Santa Clara County Transit District, Guadalupe Corridor Preferred Alternative Report, Santa Clara County, December 1981.
2. Santa Clara County Transportation Agency, Santa Clara County Transportation: Perfoomance Report - FY 1988 Annual Edition, August 31, 1988.
3. Schumann, John W., "What's New in North American LRT Projects?", Paper prepared for the 1988 TRB National Light Rail Conference, May 1988.
4. Transportation Research Board, "San Jose Guadalupe Corridor Under Construction -- North Segment to Open in December 1987", LRT News, Vol. 3, No. 2, Transportation Research Board, November 1987.
5. Santa Clara County Transportation Agency, Fact Sheet Light Rail Transit System & Fact Sheet - Light Rail Vehicles, Spring 1988.
6. Judy McCusker, "San Jose Shows the Way", Railway Age, Vol. 187, No. 8, New York, August 1986.
7. Santa Clara County Transit District, "Guadalupe Corridor Briefing Booklet", June 1983.
SECTION III
TRANSITWAY CITIES
HOUSTON
Overview
The development of the transitway system was a result of the need to
improve mobility in the
increasing by 50 percent
rapidly growing Houston area. With population
between 1970 and 1983, Houston grew more rapidly
than any city in the United States. Associated with this growth and
increasing mobility problem between 1970 and 1983 are a 100 percent increase
in the number of dwelling units, a 107 percent increase in employment, a 348
percent increase in office space, a 104 percent increase in the number of
vehicle registrations, and a 141 percent increase in freeway vehicle miles
travelled (Ref 1). Generally, the transitway was perceived as a cost
effective way to increase the people carrying capacity of the congested
Houston freeways.
The Houston Metropolitan Transit Authority of Harris County, or METRO, is
the transportation provider for the city of Houston and 14 neighboring cities
and towns. The jurisdiction covers a 1,275 square mile area including most of
Harris County. METRO was created in 1978 when Harris County voters opted to
fund the transit district with a one percent sales tax.
As of FY 1988, METRO is operating 1,807 buses over 105 routes; 59 local
Each of the five Houston transitways are reversible, single-lane, barrier
protected facilities located within the median of existing freeways. Of the
four operating transitways, the Katy, Gulf, and Northwest transitways allow
buses, vanpools, and carpools of two or more persons. The North Freeway
Transitway allows only buses and vanpools. Park-and-ride lots are connected
directly to the transitways by ramps. Additional Houston transitway data is
presented in Table A4 of the Appendix.
Historical Background
In the early 1970s, Houston began experiencing very high levels of congestion
along the city's radial freeways. Limitations of right-of-way and the
prohibitive cost of inc.reasing freeway capacity by means of additional lanes
indicated that some form of transit might help alleviate congestion and
increase the capacity of ~he corridors. In 1969, it was envisioned by the
Texas State Department of Highways and Public Transportation (SDHPT) that the
construction of a barrier-separated, high-occupancy vehicle lane along-the
Gulf Freeway would be a quicker, more cost-effective means of achieving
increased capacity rather than construction of additional freeway lanes.
Although the Gulf Freeway transitway was proposed in 1969, serious planning
of the facility did not begin until the late 1970s and early 1980s. A primary
factor in the eventual approval of the project, as well as the approval of an
additional transitway located within the Katy Freeway corridor, was the
scheduled rehabilitation of the Gulf and Katy Freeways whereby, during the
reconstruction process, the freeways could be modified to accommodate
transitways. Another selling point for the construction of the transitways
was that additional right-of-way was not necessary.
When METRO took over operation of the transit system in 1979, METRO staff
envisioned a heavy rail system as a means of
congestion problems. In June 1983, however,
reducing Houston's growing
voters soundly rejected the
building of a heavy rail line which was to be constructed along the Southwest
Freeway. The citizens of Houston were unwilling to support a heavy rail
system because it was perceived that few people would be served by the costly
rail system. Also, the ?Ublic generally had a low · l'inion of METRO. For
84
example, the agency was perceived as unwisely spending money by hiring an
excessive number of consultants, and as uncaring and unresponsive in
following-up on promises made in the late 1970s during the agency's formation.
Prior to the formation of METRO, UMTA agreed to fund the construction of a
contraflow demonstration project in the North Freeway corridor. Project
construction began in February 1978. The North Freeway contraflow lane was
considered a success with bus and vanpool patrons achieving an average daily
travel time savings of 15 minutes and passenger utilization growing from 1,450
person-trips to 4,600 person-trips per peak period during the first year of
operation (Ref 3). Daily ridership increased from 2,900 daily passengers to
16,500 daily passengers during the period September 1979 to September 1983.
The contraflow lane, however, was only an interim solution. Several studies
indicated that in 1985 or e~rlier, off-peak travel demand would increase to
the point that the contraflow lane would detrimentally affect off-peak traffic
operati~ns. Study findings offered the following options: 1) continue the
contraflow lane for an indefinite period, 2) discontinue the contraflow lane
without replacement, or 3) replace the contraflow lane with a transitway (Ref
3) . Benefit/cost analyses indicated construction of a transitway was the best
of the three alternatives.
In 1982, SDHPT and METRO agreed to develop a transitway within the median
of the North Freeway as a portion of a project to rehabilitate the North
Freeway. Several reasons given for the conversion of the contraflow lane to a
transitway include: l) the success of an established high occupancy vehicle
lane in the form of the North Freeway contraflow lane, 2) the natural
evolution of a transitway system resulting from extensive planning and
development of the Gulf and Katy transitways, and 3) the failed rail
referendum indicating the voters mandate against the development of a heavy
rail system. Operation of Phase 1 of the transitway began in November 1984
(Ref 3) .
The failure of the 1983 rail referendum had a direct effect on the
development of transitways within the Northwest and Southwest freeway
corridors. With the overwhelming defeat of the rail project, the agency was
left without a transit project. As congestion grew worse and the agency's
poor image deteriorated even further, METRO had to devise a quick solution.
..
•
85
In addition, a quick solution was necessary because METRO was about to lose
federal discretionary funds earmarked for the rail project. The Northwest and
Southwest Freeway transitways evolved as an alternative transit project rather
naturally because Houston was currently heavily involved in developing
transitways along the Gulf, Katy, and North freeways and had developed a
strong working relationship with SDHPT. The Northwest and Southwest projects
were similar to the other projects in that construction of the transitways
would coincide with the rehabilitation of the freeways and additional right
of-way would not be needed.
The public's low opinion of the newly formed METRO was somewhat indirectly
responsible for the eventual development of transitways in the North,
Southwest, and Northwest freeway corridors. The public was dissatisfied with
the fledgling agency b~cause of unwise spending for consultants as well as
studies which produced few results. It was also perceived that the agency was
failing to deliver on promises made during the agency's formation. Because of
the voters lack of faith in METRO, METRO's planned heavy rail system was
rejected leaving transitways as the only alternative for the freeway
corridors.
The North Freeway Transitway is being perceived publicly as a success
because of high utilization by buses and vanpools. Initial low usage on the
Katy Transit way resulted in a public outcry. In an attempt to increase
transitway utilization, carpools of four or more persons were allowed to use
the transitway. Utilization, however, remained insufficient so the agency
allowed three or more person, followed later by two or more person, carpools.
Now, the public seems more satisfied because people see the transitway being
used.
Today the agency maintains a more positive image within the community.
Both local service and commuter service has improved greatly since the early
1980s. For example, approximately 50 percent of the downtown destination
along the North Freeway corridor arrives by way of the transitway. As a
result, downtown employment has been enhanced because people feel they have a
dependable trip along the transitway.
86
Conclusion
The potential use of a transitway along the Gulf Freeway was first
envisioned in 1969. Because of the infeasibility of adding additional lanes
within the restricted rights-of-way, the single-lane, barrier-separated
transitway was viewed as a potential solution that would increase capacity of
Houston's congested freeway corridors.
The decision to construct the Gulf, Katy, and North Freeway transitways was
made during the economic boom of the late 1970s and early 1980s. The decision
to develop the Northwest and Southwest transitways, however, were made during
the economic downturn of 1984-85. During the boom periods, the transitways
were touted as effective methods for reducing congestion problems along the
freeways; however, during the economic downturn, a major selling point for
transitways were their cost-e~fectiveness.
The development of transitways along the Gulf and Katy freeways, as well as
the other transitways, was a result of the need to increase the capacity of
the corridor within restricted right-of-way. An important selling point for
the initial transitways approved for the Gulf and Katy freeways (as well as
for the North, Northwest, and Southwest transitways) was that the transitways
would be constructed in conjunction with the scheduled rehabilitation of the
freeways. A lower transitway construction cost could, therefore, be realized.
The support and cooperation of the Texas SDHPT has been instrumental in
development of the transitways.
Federal support has been very positive. Congressional and UMTA support for
the program has been excellent to the point that the Northwest and Southwest
freeway transitway projects have been funded approximately 60 percent with
federal discretionary grants involving congressional appropriations. Although
federal support has been excellent, it is of the opinion of a key local
individual that if Houston was denied federal funding, the Transit Authority
or SDHPT would have found a way to continue the building program.
After the approval of the Gulf and Katy transitways, the remaining
transitways evolved rather naturally because of SDHPT and METRO's new
transitway philosophy. The development of a high-occupancy vehicle lane in
the North Freeway corridor was natural because of the success of the North
Freeway contraflow lane. Also, when Houston voters rejected METRO's proposed
87
heavy rail project in 1983, transitways remained the only viable alternative
for increasing capacity within the remaining corridors. The decision to
implement transitways within the Northwest and Southwest freeway corridors was
made rather quickly so that federal discretionary funds would not be lost on
the grounds that Houston no longer had a transit alternative.
Bob Lanier, Chairman of the Board for Houston METRO, has been instrumental
in the development of transitways. As chairman of the Texas State Highways
and Public Transportation Commission, Lanier strongly advocated the
development of transitways as a cost effective means for increasing corridor
capacity. Support for METRO's efforts were enhanced through the formation of
an ad-hoc "Super-Group" consisting of the mayor, county judge, a member of the
Texas State Highway and Public Transportation Commission, chamber of commerce,
and METRO.
88
References
1. Butler, John R., "Why Transitways?", Proceedings of the Second National Conference on High-Occupancy Vehicle Lanes and Transitways, Houston, Texas, October 25-28, 1987.
2. Metropolitan Transit Authority of Harris County, "Briefing on METRO Transitway Projects, Metropolitan Transit Authority of Harris County, August 1988.
3. Kuo, Nana M., "The North Freeway Transitway: Year of Barrier-Separated Operation", Texas Research Report 339-9, February 1987.
Evaluation of the First Transportation Institute
LOS Al-1GELES
Overview
The southern California city of Los Angeles is located on the coast of the
Pacific Ocean approximately 130 miles north of the Mexican border. The Los
Angeles urbanized area, which covers 464.7 square miles, has a 1980 population
of 3.0 million persons yielding a non-weighted population density of 6,385
persons per square mile (Ref 1) • Los Angeles County, which contains the city
of Los Angeles and many smaller communities, had a 1980 population of 7.5
million persons.
Transportation service to the City of Los Angeles and the 81 communities
located throughout the 7.5 million persons Los Angeles County and neighboring
":Ounties is provided _by the Southern California Rapid Transit District
(SCRTD) . SCRTD, the third largest transit authority in United States,
operates a bus fleet of 2, 577 buses over 240 bus routes and a 10.9 mile
transitway for total route mileage of 2,630 miles (Ref 2). Total ridership
for FY87 was 436.5 million boarding riders with a weekday average of-- 1. 4
:nillion riders.
Total FY87 revenue for the transit district was $490.1 million, less than
the reported expenses of $500.5 million (excluding depreciation and loss on
disposition of buses) . The overall net loss when including bus depreciation
and a June 29, 1986 change in the method of accounting for insurance liability
claims was $42.3 million. Operating revenue of $200.9 million comprised 41
percent of the total FY87 revenue with passenger revenue ($189.3 million)
accounting for 94 percent of operating revenue. Passenger revenue covered 38
percent of the total SCRTD revenue in FY87. Additional SCRTC data is
presented in Table A3 of the Appendix.
The El Monte Busway
Description
The El Monte Busway is a 10.9 mile, two-way transitway operating along I-10
(San Bernardino Freeway) between the community of El Monte to east of downtown
Los Angeles (see Figure 13). The $60 million facility (in 1972 dollars)
89
D
ENTRANCE ONLY 1 WEST OF SANTA ANITA AVE 2 DEL MAR AVE BUSWAY ON RAMP
EXIT ONLY SANTA ANA FWY SOUTHBCU4D ~PAST lONG BEACH FWY
HOlLYWOOD ,:111
MISSION AD· HOt..LYWOOO FWY
~ :r u
"' w Ill
6 MISSION RD ENTRANCE ONLY 7 WEST OF LONG BEACH FWY
EXIT ONLY @ DEL MAR AVE ·auSWAY OFF RAMP @ EAST OF ROSEMEAD BLVD
BERNARDINO .._,,.,_~~ [l t«lNTE
BUS STATIO,.
-CARPOOLS (l OR MORE PEOPLE)
---NOT OPEN TO CARPOOLS
Figure 13: Los Angeles El Monte Busway (Source: CalTrans)
•
\D 0
91
opened to buses in January 1973 and to carpools of three or more persons in
October 1976 (Ref 3).
Beginning at the western extreme, the transitway operates along a separate
alignment paralleling the westbound freeway lanes. After several miles, the
westbound transitway lane crosses over the eastbound transitway lane and
enters the freeway median for the remaining seven miles. While operating in
the median, the 17 foot wide transitway lane and freeway are separated by a
10 foot shoulder and candlestick delineators. At the eastern extreme of the
transitway, carpools enter the freeway while buses either enter the freeway or
continue along a short extension ending at the El Monte Station.
Two on-line stations and one off-line station serve the El Monte
Transitway. The two on-line stations are located along the westerly segment
of the transitway at the Los Angeles County Hospital and at California State
University at Los Angeles. A pedestrian bridge provides patron access to on
line station platforms. The El Monte off-line station, a unique 160 foot
diameter circular structure, is a major transit center providing a large park
and-ride facility as well as timed transfer service to local bus lines·-
In 1988, the transitway accommodated approximately 22,000 transit riders per
day (two-way) while total transitway passenger ridership (including carpools
and vanpools) was approximately 41,000 riders per day (two-way). In
comparison with total two-way passenger volumes along the transitway and
freeway, approximately 38 percent of the total peak hour passenger volume and
30 percent of the peak period passenger volume operate on the transitway (Ref
1) . A $21 million, one-mile extension connecting the busway with downtown Los
Angeles is scheduled to be completed in early 1989. Additional El Monte
Busway data is presented in Table AS of the Appendix.
Historical Background
In the 1950s, the private transportation carriers of the Los Angeles region
amalgamated into public ownership under the Metropolitan Transportation
Authority (MTA) later becoming the Southern California Rapid Transit District
(SCRTD) . The conversion to the SCRTD in 1964 was conditioned by a mandate to
develop a rapid transit system for the Los Angeles area (Ref 4) .
92
It was not until the late 1960s that SCRTD planners and engineers
considered constructing an exclusive express bus facility in the congested San
Bernardino Freeway corridor (Ref 5) . This corridor was selected as the busway
sight primarily because of the need for a transportation improvement in the
corridor and the presence of an infrequently used Southern Pacific railroad
line operating just north of the freeway and in the wide freeway median. The
railway right-of-way was made available after 18 months of negotiation between
SCRTD, Southern Pacific, the Public Utilities Commission, and other affected
governmental entities.
The project was funded by the Federal Highway Administration (FHWA), Urban
Mass Transportation Administration (UMTA), California Department of
Transportation (Caltrans), SCRTD, and the Southern Pacific Rail Co. The
project, approximately 65 percent FHWA funded, became the first project of its
kind to be granted federal highway funds. Prior to the funding agreement,
FHWA Administrator Frank Turner personally visited the site. This high level
involvement was instrumental in making federal Interstate funds available for
transitways within a basically completed stretch of Interstate highway.
Conclusion
The decision to construct a busway in the San Bernardino corridor was based
almost entirely on the availability of federal funding and adequate right-of
way rather than the result of transportation planning studies or analyses that
have been required in recent years. In the words of a knowledgeable
participant in the development of the El Monte Busway: "The El Monte Busway
was not the result of an in depth study, addressing a broad range of policy
issues. Rather, the project was a response to an opportunity created by the
availability of right of way. Admittedly, the San Bernardino Freeway has long
been congested during peak periods of travel and was a reasonable candidate
for a busway." Also, " . the availa-bility of funding and real estate
(right of way) were the determining factors in the implementation of the El
Monte Busway."
93
:R.afarences
1. Christiansen, Dennis L., "Alternative Mass Transportation Technologies Technical Data", Texas Transportation Institute Research Report 339-4, Texas A&M University, December 1985.
2. METRO Magazine, "METRO's 100 Largest Transit Bus Fleets", Vol. 84, No. 5, September I October 1988.
3. Klusza, Ron, "The Los Angeles Experience", Proceedings of the Second National Conference on High-Occupancy Vehicle Lanes and Transitways, Houston, Texas, October 25-28, 1987 (edited by: Ann Lancaster and Timothy Lomax, Texas Transportation Institute, Texas A&M University)
4. Leonard, G.B., "The El Monte Bus way: Rapid Transit in Los Angeles", Presented at the Institute of Transportation Engineers Canada Conference, April 23, 1981.
5. McDonald, George L., "The Success of the El Monte-Los Angeles Busway", Transit Journal, V9l. 1, No. 2, May 1975.
94
..
•
SECTION IV
NO-BUILD CITIES
•
COLUMBUS
Overview
The City of Columbus (1980 population of 564,871), the capital of Ohio, is
located in Franklin County near the center of the State. The Central Ohio
Transit Authority (COTA) comprises a 512 square mile service area and a
service area population of approximately 895,000 persons.
At the close of FY87, COTA maintained a 342 vehicle bus fleet
transporting 17.3 million boarding riders during the year.
ridership during this period totalled 67,300 boarding riders.
Average weekday
In FY87, total COTA revenue was $19.3 million and expenses totaled $34.8
million (excluding depreciation on assets). Passenger revenue ($6.0 million)
covered approximately 17 percent of the Transit Authority's $34.8 million
expenses. With depreciation ( $5.4 million) included in the Transit
Authority's total expenses, the district ended FY87 with a $2 0. 9 million
deficit.* Additional COTA information is presented in Table A6 of the
Appendix.
Summary of the J'i:z:ed-Guidaway Decision Process**
Since the mid-1970s, the Columbus metropolitan region has conducted several
transportation otudies examining the feasibility of a fixed-guideway transit
system emphasizing transportation improvements in Columbus' North Corridor, an
area experiencing rapid development and increasing congestion problems. Two
such studies, A Long-Range Plan for Transit (1970) and Mid-Range Transit
Development Concept for Central Ohio (1977), recommended the construction of a
busway along an existing railroad right-of-way in the North Corridor. In
response to the recommendations of "Mid-Range Transit Development Concept for
Central Ohio", as well as additional earlier studies recommending similar
* It should be noted that, because of striking vehicle operators and other union employees, COTA experienced a work stoppage between January 1 and February 9, 1987 .
** Information for this section was obtained from discussions with key COTA and MORPC personnel as well as the following reports: "North Corridor Transit: Solutions for the Future" and "COTA 2000 Long Range System Plan".
97
98
solutions, UMTA agreed in 1977 that additional study of the North Corridor was
warranted. The report was accepted in fulfillment of the Systems Planning
stage of the Alternatives Analysis process.
Four alternatives (Null or No-Action Alternative, TSM {Transportation
Systems Management), Busway, and Light Rail Transit) were ultimately studied
within the corridor. Early in the study process, however, UMTA disallowed
continued analysis of LRT with federal monies because the alternative was not
considered cost-effective (Ref 1) . It was argued locally, however, that LRT
should be included so that all available alternatives could be compared. As a
result, MORPC and COTA, with the assistance of a consultant, continued to
evaluate LRT with local funding. UMTA continued to disallow the inclusion of
the LRT alternative contending that a number of incorrect and inconsistent
study assumptions meant the LRT alternative could not even be accurately
compared with the other alternatives. Later in the study process, the busway
alternative also failed to pass UMTA's cost-effectiveness threshold criteria.
Capital Costs, Operating & Maintenance Costs, and Year 2000 Daily Ridership
estimates of the 1985 final planning report, "North Corridor Transit:
Solutions for the Future", are presented as follows:
Year 2000 Operations Capital Costs and Maintenance Daily Ridership
!in 1983 millions> !in 1983 millions) (Year 2000)
Base $22.6 $15.9 48,800
TSM $30.3 $17.8 52,800
Busway $76.1 $18.0 53,200
LRT $159.2 $26.7 58,800
Neither fixed-guideway alternative was cost-effective because ridership
estimates were too low in comparison to the anticipated capital expenditure.
Related to high capital costs was a decision early in the study process to
minimize neighborhood disruption and housing relocation. As a result,
railroad alignments were considered as the most probable alignments for the
fixed-guideway facilities; however, low residential densities within walking
distance to the railroad alignments translated into low ridership. An
additional barrier hindering ridership was created by an Interstate highway
•
99
paralleling the selected railroad alignment. The Busway Alternative (53,200
daily linked riders) generated only a one-percent increase in ridership as
compared to the TSM alternative (52,800 daily linked riders). Although the
LRT Alternative (58,800 daily linked riders) generated eleven percent higher
ridership than the TSM Alternative, local officials felt that the capital
spent on the LRT system would be disproportionately high compared to the
ridership produced.
In December 1985, the Mid-Ohio Regional Planning Commission (MORPC) and the
Central Ohio Transit Authority (COTA) released "North Corridor Transit:
Solutions for the Future" as documentation of the results of the alternatives
analysis. The report, however, did not recommend a specific alternative.
During the months before and after the December 1985 report, support for
the entire project was waning. Local political support began to falter
because federal funding did not appear to be forthcoming due to UMTA' s
dissatisfaction with both fixed-guideway alternatives. Also, unlike similar
sized cities of the Northeast, citizens of Columbus do not view transit as a
primary need. As a result, no official action was taken on a fixed-guideway
system and applications for fedaral funding assistance were discontinued. In
the words of one locally involved individual, the project "went out with a
whimper".
Fixed-guideway alternatives were again studied in the "COTA 2000 Long Range
Plan" completed in January 1988. During this study, each of the region's
eight travel corridors were screened for transit compatibility. Using a
generic fixed-guideway system operating under ideal conditions, each corridor
was tested and evaluated against a standard set of criteria. The results of
the initial screening indicated four corridors warranted additional study.
The next step of the study involved identification of fixed-guideway
technologies and their applicability to the Columbus region. Using subjective
judgment based on the general characteristics of the technologies and the
Columbus region, the following guideway technologies were screened: rapid
rail, LRT, monorail, Automated Ground Transport (AGT), Intermediate Capacity
Transit, suspended rail transit, exclusive busway, and HOV freeway lanes. The
guideway technology screening process indicated that LRT and AGT warranted
further study.
100
The LRT technology was tested in two corridors where railroad right-of-way
may be available. It was determined, however, that the LRT options were not
feasible because of low patronage estimates. A conclusion of the report
states that the existing rail lines hold little use as public transit
guideways because of a lack of high density residential areas and employment
centers necessary to generate sufficient ridership.
found for the AGT alternative.
Conclusion
Similar conclusions were
Beginning in the early 1980s, the Columbus region began planning for major
fixed-guideway transportation improvements in the region's North Corridor.
Study findings, however, indicated to UMTA that neither LRT or busway
alternatives were, at that time, feasible in the Columbus region. Local
support for the project was minimal because congestion was not extreme. It
was also stated by a local individual that Columbus, which experienced
substantial low-density growth following World War II, is very similar to the
Sunbelt cities of the southwestern United States with respect to the
difficulties of attracting transit patronage. As a result of the lack of
federal and community support, local politicians did not, according to one
local source, "take up the cause" and push for the implementation of the LRT
or busway alternatives. The project "fizzled out" during the three months
following the release of the 1985 planning report.
,
..
101
References
1. Mid-Ohio Regional Planning Commission and Central Ohio Transit Authority, "North Corridor Transit: Solutions for the Future", December 1985.
2. Mid-Ohio Regional Planning Commission, "COTA 2000 Long Range System Plan", January 1988.
102
•
..
MI:LWAOKEK
Overview
The City of Milwaukee, Wisconsin, which is located on the western shore of
Lake Michigan approximately 87 miles north of Chicago, has a 1980 population
of 636,000 persons. Approximately 66 percent of the population of Milwaukee
County (1980 population of 965,000) lives in the City of Milwaukee.
Transportation service for the Milwaukee metropolitan area is provided by the
Milwaukee County Transit System operated and managed through contract with
Milwaukee Transport Services, Inc.
As of December 1987, the Milwaukee County Transit System owned 553 buses
operating over 50 routes totalling 1,329 miles. The Transit System boarded
ave= 68.6 million rider~ during 1987 with total revenue and expenses amounting
to $64.52 million. Operating revenue of $30.14 million accounted for 47
percent of the Transit System's total revenue. Passenger revenue ($29.41
million) accounted for 45 percent of the System's total expenses in 1987.
Additional transit. system data is presented in Table A6 of the Appendix .
.. Summary of the rixad-Guideway Decision Process
Beginning in March 1979, the Southeastern Wisconsin Regional Planning
Commission (SEWRPC) conducted an areawide transportation study of
transportation needs in Milwaukee County and the surrounding area. The
project was jointly funded by Milwaukee County, the Wisconsin Department of
Transportation, and the Urban Mass Transportation Administration and guided by
a 21 member Advisory Committee.
Initial work involved the development and analysis of maximum extent system
plans for bus-on-freeway (express bus), exclusive busway, light rail transit
(LRT), heavy rail transit, and commuter rail technologies as well as system
plans for four alternative futures -- moderate growth, centralized land use
* Information for this section was obtained from discussions with SEWRPC and UMTA personnel as well as the following documents: SEWRPC Newsletter, Vol. 21, No. 5, Sept-Oct 1981; SEWRPC Newsletter, Vol. 21, No. 6, Nov-Dec 1981; SEWRPC Newsletter, Vol. 27, No. 6, Nov-Dec 1987; and SEWRPC Community Assistance Planning Report Number 150, "A Rapid Transit Facility Plan for the Milwaukee North~.,est Corridor", January 1988.
103
104
(most optimistic); moderate growth, decentralized land use; stable or
declining growth, centralized land use; and stable or declining growth,
decentralized land use (most pessimistic) .
First stage analysis produced improved cost-effectiveness revisions to the
system plans and an initial screening of transit alternatives. The initial
analysis determined that a commuter rail system was only viable under the most
optimistic future and also found that a heavy rail system could not be
supported in the Milwaukee area because of high capital costs and under
utilization of the system's potential capacity.
Final analysis involved evaluation of the remaining technologies -- bus-on
freeway, busway, LRT, and commuter rail (analyzed under mod. growth - cent.
land use only) -- using final system plans under each of the four alternative
futures. The Advisory Commit~ee concluded that, under each of the four future
scenarios, the bus-on-freeway, busway, and LRT alternatives were very similar
in terms of ridership (each within a range of two percent), potential levels
of-service, operating and maintenance subsidy requirements, environmental
impacts, and systemwide energy consumption (LRT petroleum consumption 5 to 8
percent less than the busway plan and 8 to 11 percent less than the bus-on-• freeway plan) .
It was also concluded that the only measurable difference between the three
alternatives are total costs required for system implementation. Annual net
public cost for the bus-on-freeway system in each future scenario, including
capital costs and operation and maintenance costs, was between 14 percent and
21 percent lower than the busway plan. The LRT plan ranged between 7 and 10
percent more costly than the busway plan and 25 percent to 30 percent more
costly than the bus-on-freeway plan (Ref 1) .
Based on the study results, the bus-on-freeway plan was judged superior
because of the lower costs associated with the plan. The Advisory Committee,
however, believed that the LRT plan would dominate the bus-on-freeway plan if
the intangible benefits of LRT (especially the potential to influence land
development and redevelopment) were considered. Consequently, the Milwaukee
County Executive and Board of Supervisors requested a study to determine how
* Total fuel savings would amount to less than one percent of the total consumption of the Milwaukee area transportation system. (Ref 1)
..
•
105
express bus or LRT improvements would address transportation, land development
and redevelopment needs of northern Milwaukee County.
Initiated in September 1984, the Milwaukee Northwest Corridor Rapid Transit
Study evaluated six alternatives - three express bus alternatives and three
LRT alternatives. Under step one of the evaluation, the three express bus
alternatives and the three LRT alternatives were studied individually to
determine the best alternative from each of the two technologies. Step two
involved a comparative analysis of the best bus and best LRT alternatives.
An alignment utilizing an existing railroad line was selected as the best
of three LRT alternatives. A primary factor in its selection as the best LRT
alternative was a capital cost expected to be $3 to $4 million less expensive
than an alignment along West Fond du Lac Avenue; and from $13 to $14 million
less expensive than ap alignment along North Sherman Boulevard (Ref 2) .
Although less costly and less controversial, the railway alignment is less
accessible to patrons.
Public outcry against construction of an LRT line along Sherman Boulevard
or West Fond du Lac Avenue was also a factor in the decision to select- the
North 33rd Street railway corridor as the best LRT alignment. In areas near
the North Sherman Boulevard alignment, a division of the neighborhood by the
light rail line prompted strong neighborhood opposition. Similarly, the
business community strongly objected to the West Fond du Lac Avenue alignment
primarily because of anticipated problems related to the roadway widening
(i.e. construction inconveniences, loss of on-street parking, etc.).
In comparing the best LRT and express bus alternatives, express bus was
determined superior with respect to direct costs and benefits. Compared with
LRT, the express bus alternative was expected to provide annual operating cost
savings of $2.1 million, an annual reduction in the operating deficit of $2.8
million, and a total capital cost savings of $166.7 million (Ref 2).
Throughout the process, UMTA maintained that the LRT system was not cost
effective and could not be justified over the express bus option. Both
alternatives, however, were similar with respect to levels of service and
transit ridership.
106
It was determined that LRT would have a substantial effect on development
along the LRT corridor. Corridor area development, however, would primarily
involve relocation of existing business rather than attracting new businesses.
On October 1, 1987, the Milwaukee County Board of Supervisors, as
recommended by the Advisory Committee, endorsed the planning report and the
best LRT and best express bus alternatives. The Board also endorsed
implementation of the express bus alternative. Key to the Board's decision to
select the best express bus alternative (and not select the best LRT
alternative) was federal support for a low-capital project and the non
controversial nature of the low-capital express bus alternative. The lack of
a current State program to provide transit system capital assistance was also
a local reason against implementation of the LRT alternative. The
implementation of the best LRT alternative does remain an option for the
future.
Concl.usi.on
An areawide transportation study conducted in the early 1980s examined the
feasibility of rapid transit (primarily express bus, busway, and light rail)
in the Milwaukee area. The results of the study basically indicated the three
transit alternatives were very similar for most of the criteria studied,
except capital costs, where the express bus alternative was clearly superior.
The Advisory committee recognized the express bus' financial superiority but
also believed intangible benefits of LRT (primarily LRT's enhancement of land
development and redevelopment) would make an LRT alternative competitive with
an express bus service.
An additional study, designed to account for the intangible effects of LRT,
was conducted to determine the feasibility of express bus and LRT in
Milwaukee's Northwest Corridor. In choosing between three LRT alignments to
be compared with the "best" of the three express bus alignments, two major
factors were important -- availability of railroad right-of-way and a less
controversial response from community and business factions.
In selecting the least controversial railroad alignment, the "best" LRT
alignment would generate less ridership because it was not as accessible to
,
107
transit patrons; however, the capital cost of constructing a facility within
railroad alignment was much less than the cost of the other two alignments.
Analyses indicated, as in the earlier study, that the express bus
alternative was superior to the best LRT alternative. Also, the LRT alignment
would promote business relocation rather than attract new businesses. Local
support for the LRT alternative from the community and local politicians was
neutral and federal support for the more capital intensive LRT project was
4. Southeastern Wisconsin Regional Planning Commission, "A Rapid Transit Facility Plan for the Milwaukee Northwest Corridor", Community Assistance Planning Report Number 150, January 1988.
SECTION V
SUMMARY AND CONCLUSIONS
:Introduction
As indicated at the beginning of this report, one of the principal
objectives was to identify critical evaluation criteria for selecting fixed
guideway systems. It was hoped that a series of threshold values could guide
decision makers in the selection of fixed-guideway alternatives. The first
part of this section reviews traditional evaluation criteria as documented by
transit analysts and researchers. The second part presents findings and
conclusions based on the case studies presented earlier. Generally, the CTR
research team has found that cities do not use a set of criteria in making a
decision to proceed or not proceed with a fixed-guideway system. Decision
making is a process influenced by a variety of factors. Based on the case
studies, a model of the decision process was developed. From this model, it
is possible .to identify factors critical to the selection of fixed-guideway
alternatives.
Traditional Evaluation Criteria
In the widely referenced Urban Rail in America: An Exploration of Criteria
for Fixed-Guideway Transit (1982, Indiana University Press) by Boris S.
Pushkarev, Jeffrey M. Zupan, and Robert s. Cumella, the authors develop a set
of threshold criteria at which fixed-guideway rail facilities become
potentially feasible. Based on construction costs of 20 fixed-guideway
facilities and associated passenger usage, a median construction cost of
$1,250 (1977$) per weekday passenger-mile was determined to provide an
indication of the value which public decision-makers put on fixed-guideway
facilities. Assuming a $1,250 per weekday passenger-mile investment
criterion, the following light rail consideration criterion were devised*:
1. Very-low capital (approx. $5 million construction cost per mile in 1977$), at-grade, min~um construction- 4,000 weekday passenger-miles per line-mile.
2. More adequate (approx. $9 million construction cost per mile in 1977$), 2/3 grade and 1/3 cut & fill - 7,200 weekday passenger-miles per linemile.
* It is important to note that these figures are in 1977 dollars. Accordingly, comparisons with these figures should be adjusted or qualified.
111
112
3. Substantial construction (approx. $17 million construction cost per mile in 1977$), 1/5 in tunnel with rest above ground - 13,600 weekday passenger-miles per line-mile.
After reviewing the decision histories of six cities choosing to ~plement
fixed-guideway transit systems and two cities choosing otherwise, it has been
determined that threshold values or criteria are not generally used in the
fixed-guideway decision process. It has also been found that threshold values
or criteria cannot be accurately contrived from the planning or operation of a
facility because the decision is so heavily affected by issues other than the
findings of the alternatives analysis. Also, upon preliminary engineering or
after several years of facility operation, study findings are frequently found
to be inaccurate. For example, Table 2 illustrates capital cost and ridership
planning estimates in comparison with actual values incurred after
construction or several years of operation. Without correcting for the
effects of inflation, it can be seen that LRT capital costs were
underestimated between 26 percent to 174 percent in each of the four cases
studied. It is also seen that ridership planning estimates are quite- - ·
different than actual current patronage. The San Diego South Line, with a
planning estimate of 28,000 riders per day in 1995 and actual ridership of
23,000 riders per day in 1988, appears to be "on-line" in terms of ridership;
however, it must be remembered that the South Line LRT facility is now a
double-track line offering much higher capacity and level of service than the
single-track facility that was originally planned and operated.
Mode~ Of Decision Making
A conceptual model of decision making was .derived from an analysis of the
case studies. The findings indicate that evaluation of fixed-guideway systems
is not a decision based on a set of criteria but rather is a complex
interactive process. The basic components of the model, illustrated in Figure
14, are comprised of issues, actors, and ult~ately decision. Issues are
those factors affecting and influencing the actors. Actors are those persons,
individually or collectively, actually making or strongly influencing the
decision to implement (or not implement) a light rail system, transitway, or
other transit facility improvement.
,.
Capital Cost Capital Cost LRT System Estimate Actual * Capital Cost Ridership Ridership
Year Opened ($ million) ($ million) % change** Estimate Actual (as of 1988)
San Diego (South Line, phase I) 1981 68.4 - (1978$) 86 26% 28,000 (in 1995) 23,000
Santa Clara I San Jose 1987 187 - (1980$) 511.5 174% 45,000 (in 1990) 6,200
Notes: * - Capital expenditures at opening of project. ** - % change in capital costs does not account for the effects of inflation
Portland - Estimates are from August 1980 FEIS
Sacramento - Estimates are from DEIS Additional Cost Estimates- $112.7 (1981$) from Preferred Alternative Report Additional Ridership Estimate - 20,500 riders per day in 1988 (FEIS)
San Diego - Cost Estimate represents capital expenses between 1978 and 1995 (represented in constant 1978$). Cost Estimates taken from Preferred Alternative Report. Actual costs based on Phase I construction (includes SD&AE acquisition, single track, 14 vehicles, and construction)
Santa Clara I San Jose - Only 112 of system open as of June 1988. Actual Capital Cost is actually the November 1988 estimate to complete the light rail project. Cost Estimate from 1981 Preferred Alternative Report
Table 2: Comparison of Estimated and Actual Capital Costs and Ridership for LRT Case Studies ...... ...... w
LRT
Transit way
No-Build
Other
Figure 14: Fixed-Guidway Decision Model
" • ...
115
Issues are defined as either social, systemic, or funding related. Social
issues are those factors influencing the fixed-guideway decision that are
primarily external to the planning and direct operation of the fixed-guideway
facility. For example, the following may be considered as social issues:
potential for economic development, land-use impacts (i.e. removal of housing
or businesses), energy issues, and the current or anticipated state of the
regional economy. On the other hand, systemic issues are the direct results
of the planning study which affect decision making. Primary systemic issues
are usually estimates of capital cost, ridership, and operating costs.
Funding issues pertain to the availability of funding and the resulting
effects on the fixed-guideway decision.
Actors are categori~ed as public, local officials, and institutions. The
public is primarily the general population or constituency of a governmental
jurisdiction as well as organizations such as special interest groups and
community groups. Local officials, which are those persons primarily involved
in the selection of the locally preferred alternative, are usually elected
officials at the city and county level as well as transit Board members.
Institutions are the federal and state funding agencies such as UMTA, FHWA,
and the various state transportation departments and transportation
commissions.
The various issues affect actors differently. Social issues primarily
influence the desires and perceptions of the public and local officials who
would directly benefit (or not benefit) from the implementation of a fixed
guideway system; however, institutions, which are seldom interested in social
issues, primarily base their decision to support a project on systemic issues.
For example, in each of the three federally funded LRT case study projects as
well as the two "no-build" cities, UMTA did not support the construction of a
fixed-guideway facility because the capital costs, operating costs, and/or
ridership estimates (systemic issues), along with other factors, did not
justify LRT over another alternative.
The availability of Funding affects the local level (public and local
officials) as well as the institutions that control or make recommendations
concerning the allotment of funds. Although the availability of funding is
116
important in the local decision to commit to a major investment, the local
decision-makers have frequently proceeded with the decision to pursue LRT
without the support of UMTA. Federal funding is later obtained through
Congressional appropriations.
Interaction among actors is especially strong at the local level. Seldom
have local officials made a decision to support or not support a major capital
investment without the support of their constituency. On the other hand,
local officials can also be effective in molding public opinion through the
news media and community meetings. Interaction among institutions and local
officials (and their agents or staff) is common throughout the project
planning stages.
Issues
Systemic issues are those issues which generally pertain to the results of
the technical study. Primary systemic issues are usually: ridership, capital
costs, and operating costs.
For each LRT case study, actual light rail patronage appears to be lagging
behind the ridership planning estimates which are dependent on a specified
target year (See Table 2) . These higher planning estimates usually justified
LRT over the other alternatives primarily in one or two ways: outright
superiority in terms of ridership and/or lower operating costs. In Portland,
a high ridership estimate was strongly influenced by a ten percent rail
"mystique" factor, anticipated high gasoline prices (which did not come
about), and an unexpected recession that severely lowered anticipated
population levels. Similar economic conditions in other cities resulted in a
high ridership estimate for the LRT alternative.
In San Jose, the ridership estimates for both the busway and LRT
alternatives were similar; however, the fact that the number was high tended
to justify LRT over busway in terms of lower operating costs. Lower operating
costs result from the need for fewer train operators, as compared to the
number of bus operators, required to handle higher loads. Also, the LRT
alternative was found to be superior to the busway alternative in only three
of the ten cost-effective measures presented in the Preferred Alternative
Report. All three measures were various operating and maintenance costs on a
117
per passenger basis. In Sacramento, operating costs were the only criteria in
which LRT was judged to be superior. This factor was promoted heavily by
local officials. The results, however, were based on study assumptions which,
in conjunction with high ridership estimates, yielded overly optimistic
values.
In each of the LRT cities, the capital costs of the completed facility was
underestimated (See Table 2) Also, in both Sacramento and San Jose, the
busway alternative was less expensive than the LRT alternative; however, San
Jose promoted light rail by indicating that both alternatives were good
investment choices. In Columbus and Milwaukee, LRT capital costs were higher
than the other alternatives. The availability of right-of-way has been
important in bringing down the capital costs as well as promoting the
feasibility of implementing a fixed-guideway facility; however, in the cases
studied, right-of-way availability did not necessarily promote the
implementation of one form of fixed-guideway over the other.
Social issues are those issues which affect the fixed-guideway decision
process but are primarily external to the study. These issues are commonly
related to the economy, environment, or overall identity of the region.
The ability of LRT to focus and guide urban development was an issue touted
by several cities including Portland and Sacramento. Also, the potential
developmental impacts of LRT in Milwaukee was a primary reason for continued
study of the feasibility of LRT in the Northwest Corridor even though initial
studies indicated that LRT was not feasible due to excessive capital costs.
UMTA did not support these local contentions.
Potential impacts on properties has been an important issue. In Portland,
for example, public revolt against the construction of the Mt. Hood Freeway
which would remove one-percent of the housing stock was a major impetus in
mobilizing the effort to search for alternative forms of transportation. In
Milwaukee, business and neighborhood group objections to two proposed LRT
alignments that would either remove on-street parking or divide established
neighborhoods led to the selection of a "best" LRT alignment that was inferior
in terms of generating ridership.
Potential detrimental environmental impacts of buses has been an important
issue in several instances. In Portland, City support for the busway began to
118
decline when it was determined that the downtown transit mall would be
inundated by almost twice as many peak hour buses than the facility was
designed to handle. Noise and air pollution would be extreme. In Sacramento,
it was a local perception that not enough consideration was given to the
superior environmental effects of LRT.
Energy issues have been a major consideration in the development of each of
the four LRT systems. The decisions to implement the LRT systems were
generally made during the late 1970s and early 1980s, a period when the
availability and price of fossil fuels was questionable. Because of these
uncertainties, the electrically powered LRT systems were more attractive in
the eyes of the local decision makers and general public.
Freeway congestion has been a major issue that has sparked the need for
transit improvements. In Ho~ston, for example, the North Freeway contraflow
lane and the transitway system was constructed as a solution to the heavy
congestion resulting from rapid growth in the metropolitan area.
The intangible benefits of rail has frequently been touted as an issue that
should be considered when conducting a study of transit alternatives. For·
example, Portland included a 10 percent increment of additional riders that
would be attracted by the "mystique" of riding a rail vehicle; however, UMTA
disallowed Sacramento the use of the same factor. Milwaukee cited the
intangible benefits of rail such as the ability to enhance land development as
the primary reason to continue studying the express bus and LRT alternatives.
The current and anticipated areawide economy has an effect on the local
desire to invest in a fixed-guideway system. In San Jose, for example,
Silicon Valley was growing at a high rate in the late 1970s and was expected
to continue to "boom" into the 1990s. As a result of the expected growth,
high ridership estimates tended to justify LRT over buses because of potential
savings due to lower expected operating costs.
Funding
The model identifies funding as another important issue in the decision
process. In truth, availability of funding ultimately determines whether a
fixed-guideway system will be built. The funding can come from a variety of
sources, but traditionally involves about 80 percent federal, 13 percent
119
state, and 7 percent local. However, there are many examples of local transit
authorities using other funding approaches. San Diego, for example, wanting
to avoid certain regulations and requirements, did not pursue UMTA funding
support.
The funding issue and its interplay with the different actors is
demonstrated in the Sacramento case study. During and following the
evaluation process, UMTA voiced opposition to the LRT alternative, arguing the
high costs and low ridership could not justify the implementation of LRT.
Local officials, however, overcame UMTA objections by generating congressional .
support. Local and state officials lobbied Capital Hill to support funding of
their LRT. Resulting legislation by-passed UMTA objections forcing UMTA to
relinquish funds for the LRT project.
Actors
The second part of the model focuses on the actors involved in the decision
making process. Generally speaking, the public are the citizens, individually
and collectively, of a community or jurisdiction. Their importance as actors
are demonstrated in a number of the case studies. In Houston, for example,
propositions for heavy rail were soundly rejected by voters, forcing Houston
Metro to consider other less expensive alternatives.
Included in the public category also are business, special interest and
community groups. The impetus for LRT in Sacramento began with the Modern
Transit Society (MTS), a pro-transit organization. This special interest
group was formed from a number of community groups opposed to construction of
new freeway routes in Sacramento. MTS effectively pressured the Sacramento
County Board of Supervisors to abandon new freeway construction in several
areas and assisted in the North-East Transportation Task Force efforts
culminating in a recommendation for examining the feasibility of light-rail.
At the other extreme, neighborhood groups along the North Sherman Boulevard in
Milwaukee effectively voiced strong opposition to a proposed rail-line.
Business groups fearing patron inconveniences due to construction and loss of
on-street parking, similarly opposed a rail alignment along West Fond du Lac
Avenue.
120
The public is a critical actor in the decision process for fixed-guideway
and other transit alternatives. The case study analysis indicates that when
public support was lacking, fixed-guideway systems were not developed, and
where support was strong, fixed-guideway systems were implemented.
The second group of actors involved in the decision process are local
officials. Local officials are the persons, boards, or other entities
responsible for conducting or coordinating transit planning and alternatives
studies, approving or disapproving transit plans, determining funding sources,
etc. Public officials are the elected or appointed agents of the community.
The importance of local officials and the range of their influence is shown
in the historical background of each of the case studies. For example, Neil
Goldschmidt, first as Mayor and later as Transportation Secretary, was
instrumental in the develo~ment of the MAX. Without his efforts it is
unlikely that the MAX would be in operation today.
The final group of actors important in the decision model are institutions.
This group consists of federal and state officials, including the UMTA, FHWA,
the Congress, state transportation commissions and departments, and governors~
UMTA is an important actor in that they control distribution of important
financial resources for transit systems. In nearly every case study, UMTA
played a role, positive or negative, in the decision to build or not build a
fixed-guideway system.
Likewise, state officials influenced the decision process. California
Governor Jerry Brown's pro-transit views, were instrumental in making state
transit funds available for light-rail transit systems. Similarly, the
support of Governor Straub of Oregon and his decision to support the
withdrawal of freeway funds and their transfer to a fixed-guideway project was
critical to the development of the MAX.
The model indicates that in addition to being influenced by issues, the
actors also are influenced by each other. This is to say the public can
influence public officials and institutions, local officials can influence
institutions and the public, and institutions can likewise influence the
public and local officials. None of the actors operate separately, but
instead operate in a complex inter-relationship. As noted earlier, the
decision to move forward with LRT in Sacramento was influenced significantly
121
by the MTS. Local officials were motivated by the activities of this public
group and their perception of strong community support for rail transit.
Likewise local officials were influenced by the Governor's office and his
decision to offer funding for a light-rail feasibility study.
Summary and Conc1usion
The model reveals that the activities and interaction of the actors,
particularly the public and local officials, is a critical stage in the
evaluation of fixed-guideway systems. The interplay of these groups is
political. In fact, the interaction between the different groups is the
nature of the political process. Prior to the decision of committal or non
committal to a fixed-guideway system, these groups are guided by a range of
social and systemic issues, both perceived and actual.
At some point, the principal advocates of a fixed-guideway system -- one of
the three actors, generally the public or local officials perceive
significant social or community benefits to a fixed-guideway system. In some
instances, the benefits are in response to immediate needs, i.e.,. traffic
congestion, and in other instances the benefits are seen in the future.
Regardless, particular actors become motivated to support a fixed-guideway
system. Generally, this motivation is translated into transit studies,
mobility plans, corridor impact studies, etc. During this process systemic
issues assume greater importance. Capital and operating costs and projected
ridership values influence to a large degree the availability of funding,
especially federal funds.
Systemic issues guide primarily the institutions in their decision making.
The dotted line in the model indicates that systemic issues impact local
officials and the public to some degree. Local officia1s recognize that the
systemic issues determine, in large part, the availability of funding. This
is particularly true in the Portland example, where original ridership
estimates were overly optimistic then after receiving funding, were re
estimated at a very low level. After the first year of operation actual
ridership was reported as exceeding projections, though far below the original
estimates used in the analysis of fixed-guideway alternatives. Additionally,
systemic issues are important when they are related to other social benefits.
122
Regardless, the decision to support a fixed-guideway system is generally made
prior to estimates of ridership and system costs.
Likewise social issues influence the institutions, although for UMTA,
generally they are not evaluated as important decision criteria. UMTA focuses
on the systemic issues.
Based on the model and the analysis of case studies, several important
conclusions can be drawn:
1. The decision to commit to fixed-guideway systems is often determined by perceived social benefits that may or may not result, and is frequently not the product of an objective analysis of alternatives.
2. Public support for a fixed-guideway system is critical. This support is generally developed during the process of analyzing fixed-guideway alternatives. Lack of support or strong opposition generally results in a "no-build" situation . .
3. Funding availability ultimately determines whether the fixed-guideway system is approved. In instances where local support was strong, barriers to federal support were overcome and in situations where funding was readily available, the public was inclined to support.
4. There is not a set of critical threshold values that officials use in selecting transit alternatives, including no-build scenarios. Instead, the decision process is dominated by political interaction among local, state, and federal officials guided by social benefits and systemic issues to influence funding for transit alternatives.
•
,,
APPENDIX
124
The Appendix contains tables of additional case study information. Table
Al contains transit system information for each of the LRT case studies while
Table A2 contains information specific to each LRT system. Table A3 contains
information pertaining to the Houston and Los Angeles transit systems while
Tables A4 and AS contain information specific to the Houston transitways and
El Monte Busway, respectively. The final table, Table A6, relays systemwide
information for the "no-build" cities, Columbus and Milwaukee.
125
Portland Sacramento San Di9Qo Santa Clara GENERAL --transit operator Tri-Met SRTD MTDB* County Transit --service area Population 1,245,000 905,500 1 ,560,000 1 ,432,000 --service area (sq. miles) 725 340 570 326 ROUTE INFORMATION --number of routes (bus I LRT) 71 I 1 76 I 2 55 I 2 7 711 --total one-way miles (bus I LRT) 770 I 15.1 843 I 18.3 865 I 20.4 1396120.3 VEHICLES --number of buses 594 200 363 526 --number of rail vehicles 26 26 30 50 RIDERSHIP --avg. weekday boarding riders 162,700 56,957 137,261 118,432 --avg. Saturday boarding riders 76,400 21,561 not available --annual boarding riders 48,240,000 15,052,000 39,359,000 35,220,000 OPERATIONAL (annual data) --total revenue ($-million) 86.40 36.14 54.05** 156.53 --operating revenue ($-million) 23.52 9.21 not available 11.34 --passenger revenue ($-million) 21.12 8.73 25.66 11.34 --total expenses ($-million) 77.28 34.56 55.21 114.30 --pass. rev. I total expenses (%) 27 25 46 1 0 --total expense ($) I boarding rider 1.60 2.30 1.40 3.24 --total expense ($) I vehicle mile 3.54 4.25 3.44 4.96 --total revenue hours 1 '169,460 470,520 1,069,655 1,390,000 --total vehicle hours 1,545,456 522,240 1 '123,400 1,534,980 --total revenue miles 18,960,000 6,853,950 15,213,476 19,500,000 --total vehicle miles 21,840,000 8,131,800 16,071,500 23,054,441 --rev. hrs I vehicle hrs (%) 75.7 90.1 95.2 90.6 --rev. miles I vehicle miles (%) 86.8 84.3 94.7 84.6 --vehicle miles I vehicle 37,632 36,000 41,208 40,024 --vehicle hours I vehicle 2,664 2,316 2,859 2,665 --boarding riders I revenue mile 2.54 2.20 2.59 1.81
* only MTDB fixed-route operators are represented •• total fare revenue and government subsidy for all MTDB fixed-route operators
Table A 1: Systemwide Statistics and Information for LRT Case Studies (FY 1988)
126
Portland Sacramento San Diego Santa Clara ++ GENERAL [line1 I line2 (total)] -name of LRT system MAX Metro Trolley Guad. Corridor LRT LINE INFORMATION -number of lines 1 2 2 1 -date of revenue service Sept. 86 Mar 87 I Sept 87 July 81 I Mar 86 1st seg. - Dec 87 -line names MAX N.E. I Folsom South I Euclid Guad. Corridor LRT -total one-way mileage 15.1 18.3 15.9 I 6.2 (20.4) 20.3 -project total cost ($-million) 214.0 176.0 116.6 I 33.6 511.5 ## -cost ($-million) I mile 14.2 9.6 7.3 I 7.5 25.2 ##
-number of stations 27 28 18 I 10 (22)* 33 VEHICLES -number of LRT vehicles 26 26 24 I 6 (30)# 50 -cost I LRT veh. ($-million) 0.969 0.945 0.85 to 1.1 0.94 RIDERSHIP -avg. wkdy. boarding riders 19,.600 12,876 29,000 6,200 -avg. Sat. boarding riders 19,800 3,181 30,000 -annual boarding riders 6,600,000 3,116,000 9,280,616 360,000 OPERATIONAL (annual data) -fare revenue ($-million) 3.20 1.74 7.16 + -operating cost ($-million) 5.46 6.81 8.28 11.40 -fare recovery ratio (%) 59 26 86 + -oprtng. cost $ I brdng. rider 0.82 2.18 0.89 + -oprtng. cost $ I psgr. car mile 3.25 7.08 3.82 + -passenger car revenue hours 87,456 47,000 116,000 + -total passenger car hours 110,808 53,658 119,300 + -passenger car revenue miles 1,661,520 936,104 2,100,000 + -total passenger car miles 1 ,680,000 961,523 2,170,000 + -rev. hrs I total hrs (%) 78.9 87.6 97.2 + -rev. miles I total miles (%) 98.9 97.4 96.8 + -passenger car miles I vehicle 64,620 36,981 72,333 + -passenger car hours I vehicle 4,260 2,064 3,977 + -brdng. riders I revenue mile 3.97 3.33 4.42 +
* South and Euclid lines share 1. 7 miles of common track and six stations in Centre City. # 41 additional vehicles on order ## (11188 cost estimate) $44.6 million transit mall not included; $15 million in escrow is included. + Since the system is in start-up this data would be meaningless. ++ As of June 1988, only 1/2 of the system is operational.
Table A2: LRT Statistics and Information (FY 1988)
•
••
••
c;e.ERAL
--transit operator --service area Population --service area (sq. miles) ROUTE INFORMATION --number of transitways --total transitway mileage --total number of routes --total route mileage NUtJBER OF BUSES RIDERSHIP --avg. weekday boarding riders --annual boarding rideFs OPERATIONAL (annual data) --total revenue ($-million) --operating revenue ($-million) --passenger revenue ($-million) --total expenses ($-million) --pass. rev. I total expenses (%) --total expense ($) I boarding rider --total expense ($) I vehicle mile --total revenue hours --total vehicle hours --total revenue miles --total vehicle miles --rev. hrs I vehicle hrs (%) --rev. miles I vehicle miles (%) --vehicle miles I vehicle --vehicle hours I vehicle --boarding riders I revenue mile
Houston (FY 1988)
Metro
1,275
4 with 1 under design 36.6 in operation *
1 05
1,807
263,785 76,252,000
277.91 35.13 33.40
243.07 14
3.19 6.58
1,990,000 2,348,000
29,897,000 36,955,000
84.8 80.9
20,450 1,300 2.55
Los Angeles (FY 1987)
SCRTD
2,280
1
10.9 240
4,992 2,630
1,395,000 436,507,000
490.1 200.9 189.3 500.5
38 1.15 4.64
7,256,000 7,876,000 92,662,000 107,780,000
92.1 86.0
40,980 2,990 4.71
* As of Aug. 1988, the total constructed and planned system is 75.5 miles.
Table A3: Systemwide Statistics and Information for Transitway Case Studies
1988 Transit Ridership (passengers per day) 22,000 1988 Total passenger daily ridership
(including carpools and vanpools) 41,000
Farebox recovery (avg of the 19 bus 31% lines using the transitway)
Table AS: El Monte Busway Information (Source: SCRTD)
130
GENERAL --transit operator --service area Population --service area (sq. miles) ROUTE INFORMATION --total number of routes --total route mileage NUtvi3ER OF BUSES RIDERSHIP --avg. weekday boarding riders --annual boarding riders OPERATIONAL (annual data) --total revenue ($-million) . --operating revenue ($-million) --passenger revenue ($-million) --total expenses ($-million) --pass. rev. I total expenses (%) --total expense ($) I boarding rider --total expense ($) I vehicle mile --total revenue hours --total vehicle hours --total revenue miles --total vehicle miles --rev. hrs I vehicle hrs (%) --rev. miles I vehicle miles (%) --vehicle miles I vehicle --vehicle hours I vehicle --boarding riders I revenue mile
Columbus *
COTA 895,000
513
63
342
67,300 17,357,000
19.3 6.5 6.0
34.8 1 7
2.00 3.61
696,171 704,851
9,548,730 9,649,505
98.8 99.0
28,215 2,060 1.82
• Work stoppage from January 1, 1987 to February 9,1987.
Milwaukee
Mil. County Transit Syst. 965,000
50 1,329 553
not available 68,640,000
64.52 30.14 29.41 64.52
45 0.94 3.45
1,450,000 1,552,000 16,773,000 18,683,000
93.4 89.8
33,785 2,806 4.09
Table AS: Systemwide Statistics and Information for "No-Build" Case Studies (FY 1987)