Page 1
Louisiana State University Louisiana State University
LSU Digital Commons LSU Digital Commons
Faculty Publications Department of Oceanography & Coastal Sciences
2018
The Deepwater Horizon Oil Spill And Gulf Of Mexico Shelf Hypoxia The Deepwater Horizon Oil Spill And Gulf Of Mexico Shelf Hypoxia
Nancy N. Rabalais Louisiana State Univ, Dept Oceanog & Coastal Sci, [email protected]
Leslie M. Smith [email protected]
R. Eugene Turner [email protected]
Follow this and additional works at: https://digitalcommons.lsu.edu/oceanography_coastal_pubs
Recommended Citation Recommended Citation Rabalais, N. N., Smith, L. M., & Turner, R. (2018). The Deepwater Horizon Oil Spill And Gulf Of Mexico Shelf Hypoxia. Continental Shelf Research, 152, 98-107. https://doi.org/10.1016/j.csr.2017.11.007
This Article is brought to you for free and open access by the Department of Oceanography & Coastal Sciences at LSU Digital Commons. It has been accepted for inclusion in Faculty Publications by an authorized administrator of LSU Digital Commons. For more information, please contact [email protected] .
Page 2
See discussions, stats, and author profiles for this publication at: https://www.researchgate.net/publication/321246160
The Deepwater Horizon Oil Spill and Gulf of Mexico Shelf Hypoxia
Article in Continental Shelf Research · November 2017
DOI: 10.1016/j.csr.2017.11.007
CITATIONS
15READS
173
3 authors, including:
Some of the authors of this publication are also working on these related projects:
Microphytobenthos in the northern Gulf of Mexico View project
The Effects of Oil Contamination on Marshes in Louisiana View project
N. N. Rabalais
Louisiana State University
247 PUBLICATIONS 21,764 CITATIONS
SEE PROFILE
Robert Eugene Turner
Louisiana State University
303 PUBLICATIONS 23,389 CITATIONS
SEE PROFILE
All content following this page was uploaded by N. N. Rabalais on 29 May 2018.
The user has requested enhancement of the downloaded file.
Page 3
Author’s Accepted Manuscript
T he Deepwater Horizon Oil Spill and Gulf ofMexico Shelf Hypoxia
Nancy N. Rabalais, Leslie M. Smith, R. EugeneTurner
PII: S0278-4343(17)30273-XDOI: https://doi.org/10.1016/j.csr.2017.11.007Reference: CSR3700
To appear in: Continental Shelf Research
Received date: 23 May 2017Revised date: 19 November 2017Accepted date: 20 November 2017
Cite this article as: Nancy N. Rabalais, Leslie M. Smith and R. Eugene Turner,T h e Deepwater Horizon Oil Spill and Gulf of Mexico Shelf Hypoxia,Continental Shelf Research, https://doi.org/10.1016/j.csr.2017.11.007
This is a PDF file of an unedited manuscript that has been accepted forpublication. As a service to our customers we are providing this early version ofthe manuscript. The manuscript will undergo copyediting, typesetting, andreview of the resulting galley proof before it is published in its final citable form.Please note that during the production process errors may be discovered whichcould affect the content, and all legal disclaimers that apply to the journal pertain.
www.elsevier.com/locate/csr
Page 4
1
The Deepwater Horizon Oil Spill and Gulf of Mexico Shelf Hypoxia
Nancy N. Rabalais1,2
, Leslie M. Smith3, and R. Eugene Turner
4
1Louisiana State University, Department of Oceanography and Coastal Sciences, Baton Rouge,
LA 70803
2Louisiana Universities Marine Consortium, 8124 Hwy. 56, Chauvin, LA 70344
3Your Ocean Consulting, LLC, 9924 Rainbow Dr, Knoxville, TN 37922
4Louisiana State University, Department of Oceanography and Coastal Sciences, Baton Rouge,
LA 70803
[email protected]
[email protected]
[email protected]
Abstract
The oil/water/dispersant mixture from the 2010 Deepwater Horizon oil spill was juxtaposed on
the Louisiana continental shelf with the annual development of oxygen-depleted bottom waters.
There was uncertainty whether the oil from the spill might worsen the extent or severity of the
seasonal hypoxic area formation in 2010. The surface and bottom water hydrocarbons in May
were elevated compared to in June and July, while the bottom-water dissolved oxygen
concentrations were higher in May and June compared to in July. The degradation of oil in the
water column or sediments was not known. The results of an empirical orthogonal functions
(EOF) analysis of the progression of hypoxia development in May, June and July 2010, and an
analysis of conditions in July compared to a 27-year background database, indicated no
difference in oxygen concentrations for May, June or July 2010, with or without oil data
included, nor any difference in July 2010 compared to other years. The analysis instead indicated
that, in all years compared, the hypoxic area increased with higher river discharge, higher nitrate-
N load, an easterly (westward) wind and reduced wind speed. Although the analyses did not
demonstrate that the oil spill affected, or did not affect, the size of the 2010 hypoxic zone, there
was evidence that the 2010 hypoxia season did not differ from the long-term record.
Page 5
2
INTRODUCTION
Multiple stressors, including the riverine input of nutrients from the Mississippi River Basin,
affect the northern Gulf of Mexico continental shelf off Louisiana, Texas and Mississippi. These
stressors are expressed as noxious algal blooms in surface waters, low dissolved oxygen
conditions in bottom waters (Rabalais et al., 2007a), and an eroding delta and associated coastal
land loss occurring at an alarming rate (Couvillion et al., 2011). Increasing nitrogen and
phosphorus loads from the Mississippi River Basin exacerbate the low oxygen conditions on the
inner to mid continental shelf (Rabalais et al., 2007a, Turner et al., 2012). The 50% reduction of
suspended sediments in the last century, along with intrusive human activities in the deltaic
plain, result in a delta unable to keep up with sea-level rise (Blum and Roberts, 2009). These
features occurred within an area of extensive onshore and offshore oil and gas development and
collided with the oil/dispersant/water mixture from the Deepwater Horizon oil spill in the spring
and summer of 2010.
Hypoxia (defined as dissolved oxygen concentration equal to or less than 2 mg l-1
) on the
northern Gulf of Mexico continental shelf has been monitored systematically since 1985 (with
the exception of 1989 and 2016; Rabalais et al., 2007a). The mechanisms driving the inter-
annual variation are well established (Justić et al., 2002, 2007; Rabalais et al. 2007a), and
hypoxia dynamics and distribution can be modeled and predicted with a high level of accuracy
(Turner et al., 2012; Justić and Wang, 2014). The development of hypoxia on the Louisiana shelf
in 2010 was consistent with the long-term seasonal cycle of higher nitrate-N load in spring,
higher river discharge in spring and summer, subsequently higher phytoplankton biomass, and
then respiration-driven reduction in dissolved oxygen below a strong pycnocline.
The development of hypoxia and its distribution over the continental shelf west of the
Mississippi River delta coincided both spatially and temporally with the progression of oil
residue from the Deepwater Horizon oil spill across the shelf and its movement onshore and
along shore (Figure 1). The release of 5 million barrels (or 210 million gallons) (McNutt et al.,
2011) from the Macondo well at a depth of approximately 1500 m (Lubchenco et al., 2012) over
nearly three months followed the Deepwater Horizon well explosion on April 20, 2010. The
Page 6
3
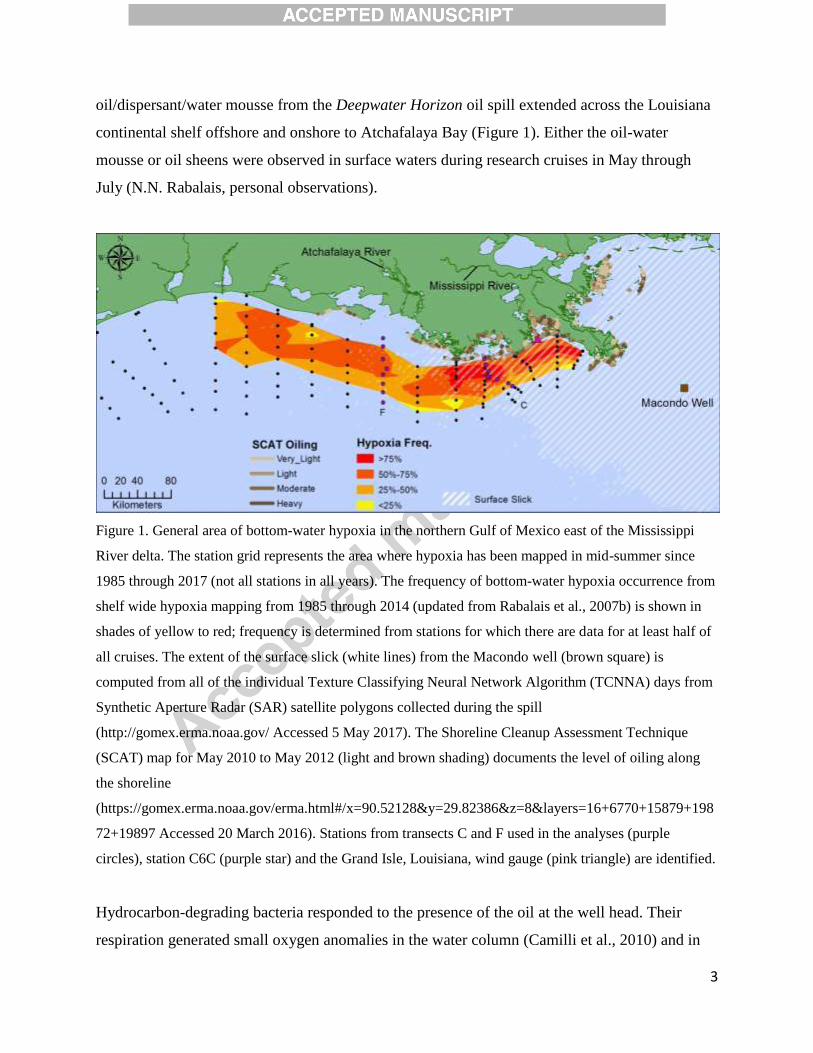
oil/dispersant/water mousse from the Deepwater Horizon oil spill extended across the Louisiana
continental shelf offshore and onshore to Atchafalaya Bay (Figure 1). Either the oil-water
mousse or oil sheens were observed in surface waters during research cruises in May through
July (N.N. Rabalais, personal observations).
Figure 1. General area of bottom-water hypoxia in the northern Gulf of Mexico east of the Mississippi
River delta. The station grid represents the area where hypoxia has been mapped in mid-summer since
1985 through 2017 (not all stations in all years). The frequency of bottom-water hypoxia occurrence from
shelf wide hypoxia mapping from 1985 through 2014 (updated from Rabalais et al., 2007b) is shown in
shades of yellow to red; frequency is determined from stations for which there are data for at least half of
all cruises. The extent of the surface slick (white lines) from the Macondo well (brown square) is
computed from all of the individual Texture Classifying Neural Network Algorithm (TCNNA) days from
Synthetic Aperture Radar (SAR) satellite polygons collected during the spill
(http://gomex.erma.noaa.gov/ Accessed 5 May 2017). The Shoreline Cleanup Assessment Technique
(SCAT) map for May 2010 to May 2012 (light and brown shading) documents the level of oiling along
the shoreline
(https://gomex.erma.noaa.gov/erma.html#/x=90.52128&y=29.82386&z=8&layers=16+6770+15879+198
72+19897 Accessed 20 March 2016). Stations from transects C and F used in the analyses (purple
circles), station C6C (purple star) and the Grand Isle, Louisiana, wind gauge (pink triangle) are identified.
Hydrocarbon-degrading bacteria responded to the presence of the oil at the well head. Their
respiration generated small oxygen anomalies in the water column (Camilli et al., 2010) and in
Page 7
4
areas down-plume from the well head at 1200 m (Du and Kessler, 2012). The permanent oxygen
minimum layer at 400 to 800 m in the Gulf of Mexico (Rabalais et al., 2002) was “re-
discovered” and was thought to potentially affect continental shelf hypoxia (Du and Kessler,
2012), but this was not the case given the earlier described mid-water oxygen minimum layer
(Rabalais et al., 2002). Neither the oxygen anomalies nor the oxygen minimum layer approached
dissolved oxygen concentrations as low as those associated with the continental shelf hypoxia.
There were scintillating observations of a possible oil degradation signal in bottom waters in the
Louisiana bight west of the Mississippi River during a July 2010 cruise that were manifested by
a significant deviation from all other years in the relationship between apparent oxygen
utilization (AOU) and dissolved inorganic carbon (DIC) (Hu et al., 2016). There were also
suggestions from the popular press that, “the BP oil spill was making it even worse. But few
people paid much attention to this 25-year-long environmental disaster….” (Wallace, 2010).
Some conjectured that the presence of oil coincident with the usual distribution of hypoxia
(Figure 1) could affect the severity and distribution of summer hypoxia on the Louisiana
continental shelf in 2010 (e.g., Schmickle, 2010).
The exposure of the surface waters of the Louisiana shelf to residues of Deepwater Horizon
oil/dispersants is not well quantified, although it can be indirectly suggested from satellite
imagery of oil distributions (Figure 1). Knowledge of the flux of oil from the surface waters to
the seabed on the continental shelf where hypoxia forms is minimal. Sediment samples collected
in 2010 were in water depths greater than 200 m (Montagna, 2013). Sediments from the
continental shelf (13 to 83 m) collected in August 2011 were considered to be “relatively
uncontaminated” with very low, often undetectable, levels of oil (Balthis et al., 2011).
Therefore, we applied multivariate techniques to the data associated with the development and
distribution of low dissolved oxygen (DO) conditions in 2010, before, during and after the oil
spill, along with surface- and bottom-water hydrocarbon samples. These analyses provided
information as to whether the 2010 hypoxia during the oil spill in 2010 was anomalous in terms
of hypoxia distribution, areal extent, or driving mechanisms as compared to the historical
baseline data. Although such an analysis cannot assign cause, or no cause, of oil-mediated
Page 8
5
hypoxia, it can provide insight as to whether the events and circumstances can be seen as
correlated or associated.
METHODS
Study Area
The Louisiana and upper Texas shelf of the Gulf of Mexico has been sampled systematically in
mid-summer since 1985 (with the exception of 1989 and 2016) for the presence of hypoxia and
associated environmental factors. The sample area typically extends from the mouth of the
Mississippi River at Southwest Pass westward through the eastern Texas shelf (Figure 1).
Transects extend from 5-m water depth to as far offshore as necessary to delineate the
distribution of hypoxia, usually 30- to 40-m deep. The transects are routinely extended to
generate a more complete dataset for a 50- to 60-m depth contour. The C transect (Figure 1) is
located approximately 100 km west of the Mississippi River delta, and the F transect (Figure 1)
is located perpendicular to the boundary of Atchafalaya Bay and 250 km west of the Mississippi
River delta. Transects C and F were sampled in all spring and summer months of 2010 to
document the effects of the 2010 Mississippi River flood on hypoxia (purple circles in Figure 1).
Historically, transect C was monitored almost monthly for the period 1997 to 2011, and transect
F was sampled bimonthly during 2002 to 2011.
The typical mapping from the Mississippi River to the west was modified in 2010 because a
tropical storm passed through the eastern part of the study area at the time the cruise was to
begin, inhibiting the survey of the eastern area until the storm passed. Mapping began on July 25,
2010 off the Atchafalaya River at transect F (Figure 1), moved west, and then back towards
transects on the eastern part of the study area.
Field and Laboratory Methods
Research vessels, oceanographic and laboratory instrumentation, and analytical methods have
changed over the 30-y period that the shelf wide hypoxic area has been sampled, but consistent
Page 9
6
quality assurance/quality control has been applied to the data generated by the same principal
investigators. The more recent instrumentation and methods are described below. The data and
metadata can be accessed at the National Oceanic and Atmospheric Administration, National
Center for Environmental Information (formerly, the National Oceanographic Data Center).
Hydrographic data for most shelf wide cruises were obtained using the R/V Pelican SeaBird
SBE91+ CTD system (or equivalent for historic data), which included a SBE 43 dissolved
oxygen sensor along with sensors measuring conductivity, temperature, depth, as well as other
environmental parameters. The CTD unit included a 12-carousel rosette with 5-L Niskin bottles
and was deployed from 1.5 to 2 m below the surface to within 1.5 to 2 m of the bottom
depending on sea state and operator. A YSI 6820 (or equivalent for historic data) was deployed
separately at 0.5-m intervals to capture water quality data missed by the CTD rosette within 2 m
of the surface and within 2 m of the bottom. Prior to having access to the R/V Pelican for
monthly cruises, a YSI 6820 (or equivalent) was used to collect data at 1.0-m intervals, or at
more narrow intervals where gradients were steep. SeaBird data were post-processed with an
“align-CTD” protocol and reported at closest depth to 1-m intervals, or more frequently during
steep gradients. SeaBird sensors were maintained via routine factory calibration; YSI 6820
sensors were calibrated in-house per manufacturer specifications. Dissolved oxygen
concentration (mg l-1
) from both the SBE and YSI sensors were corrected as necessary with data
from Winkler titrations; salinity data were corrected with PortaSal (AutoSal equivalent for
historical) salinity determinations. Density (kg m-3
) was calculated from temperature, pressure
and corrected salinity measurements from the CTD unit. Stratification () was calculated as the
difference between surface and bottom density.
Surface and bottom water samples were collected and analyzed for chlorophyll, phaeopigments,
a suite of inorganic nutrients and hydrocarbons. Surface water samples were collected with a
surface bucket to capture the often steep salinity, chlorophyll biomass and nutrient characteristics
in the uppermost sea surface layer. Bottom water samples were collected using a 5-l Niskin
bottle deployed to capture bottom water as close to the sea floor as possible.
Chlorophyll and phaeopigment concentrations (g l-1
) were determined on replicate 10 to 100 ml
Page 10
7
water samples filtered through GF/F (0.7 micron) filters, fixed in 5 ml of DMSO/90% acetone
(40/60) solution, and extracted for at least 2 h. The solution was measured pre- and post-
acidification on a Turner Model 10 AU fluorometer.
Nutrient concentrations (µM) were determined from frozen (4 C), unfiltered water samples and
analyzed in the laboratory within two weeks using EPA methodology (353.2, 350.1, and 365.2)
on a Lachat auto-analyzer II system (8000 series) equipped with an autosampler (ASX-400
series). Ammonium concentration was determined using Lachat Instrument's QuikChem method
31-107-06-1-B.
Hydrocarbon water samples were analyzed by the Louisiana State University – Response and
Chemical Assessment Team (LSU-RCAT), which has been the primary chemical hazard
assessment and analytical support team for NOAA's Office of Response and Restoration.
Additionally, the team has analyzed samples from most spills in US Coast Guard jurisdictions
over the last 25-years, as well as characterizing a variety of samples of Macondo oil. Samples
were collected using accepted standard operating and QA/QC procedures to prevent
contamination and avoid sample degradation (Turner et al., 2014). The samples were analyzed
by GC/MS (gas chromatography/mass spectrometry) to identify the normal and branched
saturated hydrocarbons (from C10 to C35), the one- to five-ringed aromatic hydrocarbons and
their C1 to C4 alkyl homologs, and the hopane and sterane biomarkers. All GC/MS analyses
used an Agilent 7890A GC system configured with a 5% diphenyl/95% dimethyl polysiloxane
high-resolution capillary column (30 meter, 0.25 mm ID, 0.25-micron film) directly interfaced to
an Agilent 5975 inert XL MS detector system. The MS was operated in the Selective Ion
Monitoring (SIM) to maximize the detection of the target constituents unique to crude oil.
Surface and bottom water aromatics (ng l-1
) were used in this analysis.
The bottom-water area of hypoxia (km2) was determined by interpolating between sampling
locations and hand-contouring parallel to isobaths over a calibrated (planimeter) grid. Bottom
oxygen (mg l-1
) concentration data from the YSI 6820 were used for each sampling location. It
should be noted that, at times within the historical data, the bottom-water dissolved oxygen data
from the CTD and the hand-held YSI 6820 equivalent were not collected together. When only
Page 11
8
the CTD data were available, then its bottom-water oxygen values were adjusted to extend from
the CTD measured depth (roughly 2-m above the bottom) to a bottom depth more similar to the
YSI according to relationships between the dual CTD and YSI data (Obenour et al., 2013). If
these calculations changed any of the original spatially generated maps of N.N. Rabalais, then
the estimate of bottom-water hypoxia was re-calculated. The percentage difference of those not
changed and those changed over a 27-y period was 0.006%. Recalculated area estimates by N.N.
Rabalais were used in this analysis (http://www.gulfhypoxia.net).
Additional Parameters
Wind direction data were from the coastal NOAA National Data Buoy Center (NDBC) station on
Grand Isle, Louisiana (Figure 1). Data were available from station GDIL1 from 1990 to 2005
when the station received extensive damage during Hurricane Katrina, and station GSIL1
(replacement for damaged GDIL1) from 2005 to 2014 (NBDC http://www.ndbc.noaa.gov/). The
values of pre-dominant wind direction were calculated for the 2-wk period before the start of
each mid-summer cruise and for the duration of the cruise. Wind data were converted from
degree direction (e.g., 90o) to cardinal direction (e.g., E) for each day, with the most common
wind direction (mode) selected for each time period.
The average wind speed (m s-1
) data were collected from the same instruments as used for wind
direction. Before averaging, the wind speed values were calibrated to the standard height of 10 m
using the logarithmically varying wind profile equation (Mears et al., 2001). Average wind speed
data for the shelf wide cruise analyses included the two weeks prior to and during the cruise as a
unique data point for the analyses. Average wind speed for the transects C and F analyses were a
running average for the two weeks prior to each day of the three 2010 monthly cruises.
Average wind gust (m s-1
) data were collected from the same instruments as used for wind
direction and speed. Wind gusts were calculated from the maximum 5-second peak gust during
each measurement hour, averaged for each day over the period of two weeks prior to and during
the shelf wide cruises, from which the maximum wind gust value over the 3+-wk period was
Page 12
9
used. The values ranged from 4.4-18.2 m s-1
and provided a shelf wide indicator of how high
winds during a cruise could disrupt water column stratification.
Mississippi River nutrient load data for 1985-2014 were obtained from the US Geological
Survey (USGS, toxics.usgs.gov) long-term water quality stations at St. Francisville, Mississippi
(Mississippi River basin) and at Melville, Louisiana (Atchafalaya River basin, which includes
the combined flow from the Old River Control Structure outflow and the Red River). The loads
were estimated by USGS through the adjusted maximum likelihood estimation (AMLE) method
using the LOADEST program, and represented the total Mississippi-Atchafalaya basin load
delivered to the Gulf of Mexico in metric tons (https://toxics.usgs.gov/pubs/of-2007-
1080/sources.html). The nitrate load is reported as NO2+NO3 (metric tons as N) the ammonia
load, as NH3 (metric tons as N); and the orthophosphate load, as OrthoP (metric tons as P). The
load of NO3+NO2 is typically referred to as the ‘nitrate’ load, despite the inclusion of nitrite,
because the concentration of nitrite is minimal.
The river discharge (x 103 m
3 s
-1) data for 1985-2014 were obtained from the US Army Corps of
Engineers (rivergages.mvr.usace.army.mil) stations on the Mississippi River at Tarbert Landing,
MS (station 1100) and Atchafalaya River at Simmesport, LA (station 3405). Both stations are
downstream of the Old River Control Structure that diverts about one-third of the Mississippi
River flow to the Red River to form the Atchafalaya River. The sum of the two stations
represents the total discharge for the Mississippi-Atchafalaya River Basin. Average daily river
discharge data from June 15 to July 15, just prior to the late July shelf wide cruise were used in
the statistical analysis. It should be noted that May river discharge data are a component of the
May nutrient load calculation; as such, the data were not included as a parameter in this analysis.
June-July discharge data were included in the analysis in order to examine the influence of
continued discharge into the summer that would influence stratification.
Multivariate Statistical Analysis
The data were normalized and detrended to compare variables measured on different scales and
units. Correlation biplots were created using the empirical orthogonal function (EOF) analysis
Page 13
10
function in MATLAB 7.10.0 (R2010a) to determine relationships among environmental
variables, and between stations and years.
An empirical orthogonal function (EOF) analysis is a powerful statistical tool used to understand
the interactions within a complex system by examining them in terms of a smaller number of
prominent modes of variability (Hannachi et al., 2007). This technique is used widely in
oceanographic, atmospheric and climate analyses given the complexity of these systems
(Hannachi et al., 2007; Monahan et al., 2009). An EOF analysis can be viewed as synonymous
with a Principal Components Analysis (PCA) as both analyses transform a multivariate dataset
into a series of orthogonal basis functions. An EOF analysis differs from a PCA, however, in that
it is also able to tease apart the spatial and temporal patterns in the data (Hannachi et al., 2007).
This difference makes an EOF analysis preferable for long-term data covering a broad spatial
extent.
An EOF analysis of the historical data (n=27 y) was conducted using data from the mid-
summer shelf wide cruises collected from 1990 through 2014. The breadth of shelf wide
data that could represent processes involved in the shelf wide distribution of hypoxia was
limited. We used variables in the inter-annual comparison that would test against
“average” bottom-water area of hypoxia. These variables were restricted to those that
would characterize an area estimate, and not individual stations as in the monthly
comparison. The analysis did not cover the full extent of the historical data set (since 1985)
because of limited wind data and the missed sampling in 1989.
An analysis of monthly 2010 data included data from May, June and July for C and F transects.
An EOF analysis was conducted on surface and bottom water parameters both with and without
the inclusion of oil data. The parameters analyzed included bottom oxygen concentrations and
hypoxia-related environmental data - stratification, surface salinity, bottom ammonium, bottom
phaeopigments and average wind speed from two-weeks prior to sample date. Similar to
variables in the historical data analysis, the variables in the 2010 monthly analysis were selected
because they had been previously described as associated with the formation of hypoxia. The
surface salinity was included as an in situ indicator for the distribution of river discharge, the
Page 14
11
bottom-water phaeopigments as an indicator of dead phytoplankton biomass available for
respiration, and the bottom water ammonium data as an indicator of organic matter
remineralization under hypoxic conditions. Water column stratification and wind speed were
included because of their well-established relationship with hypoxia formation in the Gulf of
Mexico; they support the physical characteristics under which respiration and oxygen depletion
can occur, or because they re-aerate the water column to alleviate the symptoms of hypoxia
(Rabalais et al., 2007a). Stratification and surface salinity were both included because two
density layers in the late summer can be influenced by surface salinity and cooler, lower water
column temperatures (Rabalais et al., 2007a).
RESULTS
The size of the mapped hypoxic area in 2010 (Figure 2) was estimated at 18,400 km2, but was
larger than the 1985-2015 average of 13,752 km2 (Rabalais and Turner, 2015). Some
contributing factors to the smaller than expected size were the disruption of hypoxia due to
Tropical Storm Bonnie, and the lack of time to finish the western end of the survey area.
Figure 2. Bottom-water dissolved oxygen concentration for July 25-31, 2010. The hypoxic area is denoted by the
black contour line of 2 mg O2 l-1
. Contour map was created in ArcGIS v10.3.1 using the 3D Analyst Toolbox
Triangulated Irregular Network (TIN) interpolation method. The TIN method interpolates data between points by
creating a series of non-overlapping triangles and interpolating linearly along each edge. There was no closure of the
western boundary of hypoxia due to time limitations.
Page 15
12
The overall hypoxic area may have been more continuous along the shelf in the absence of the
tropical storm. Evidence of the storm’s effect can be observed in the high wave height data from
station C6C (=CSI-6, http://wavcis.csi.lsu) and from the re-aeration of the bottom water (Figure
3) at the time of the storm. Hypoxia was re-established on the eastern part of the study area, by
July 30, 2010 when those stations were sampled. The sampling nearer the Mississippi appears to
have been sufficiently delayed (5 days) to allow stratification to re-form and bottom oxygen to
decrease (Figure 3).
Figure 3. Continuous dissolved oxygen concentrations (mg l-1
) at station C6C (see Figure 2) from July 10 to August
10, 2010. YSI 6600 sondes were located near the surface (3 m), mid-water (11 m), and near the bottom (19 m). The
solid vertical line indicates when TS Bonnie passed over the station; the dashed line indicates station C6C sampling
date. (Rabalais et al. unpubl.)
Page 16
13
Comparison with the Long-Term Data
The estimated area of bottom-water hypoxia (1985-2014, n = 29) varied in parallel with the May
nitrate loading (R2 = 0.416, p < 0.001) from the Mississippi-Atchafalaya watershed and the June-
July river discharge (R2 = 0.185, p < 0.02) (Figure 4). Drought years, such as 2000, were
characterized by low discharge and nitrate loading and a small hypoxic area, while flood years,
such as 1993, with high discharge and nitrate loading, were characterized by a large hypoxic area
(Rabalais et al., 2007a). Anomalous years, such as 2003, were related to hurricane or tropical
storm events occurring within two weeks before the sampling cruise or during the cruise that de-
stratified the water column and re-aerated bottom waters.
Figure 4. Comparison of Mississippi-Atchafalaya May nitrate-N load (upper panel) and June-July river discharge
(lower panel), and hypoxic area for 1985 through 2014. The data for 2010 are identified by a lighter shade circle.
The results from the Empirical Orthogonal Functions (EOF) analysis indicated that, in general,
the hypoxic area increased with higher discharge, higher nutrient loads (nitrate and
orthophosphate), lower wind velocity before the cruise and an easterly (westward) (Figure 5).
Page 17
14
The June-July river discharge and May nutrient load were correlated along axes 1 and 2, which
collectively explained more than 75% of the variation in the data (Table 1). The year 2010 (light
gray dot with black outline) falls within the data cloud of other years within the 27-y data, and
aligns most closely to other years with high river discharge and easterly (westward) winds.
Anomalous years in the analysis were years known to have had droughts (2000 and 2012).
Figure 5. Empirical Orthogonal Function (EOF) biplot of hypoxic area and related variables as vectors (n = 8) for
1990-2014 (n = 27). Factors include and June 15 – July 15 river average daily discharge from the Mississippi-
Atchafalaya River watershed. May nitrate+nitrite (NOx), orthophosphate (P) and ammonium (NH3) loads, June 15 –
July 15 average daily discharge from the Mississippi-Atchafalaya watershed, and predominant wind direction, wind
speed and maximum wind gust within two weeks before and during the cruise. Note that larger magnitude wind
values on the plot indicate a westerly wind. Each axis represents the new composite dimension created in the
Page 18
15
analysis to view the data; the percentage represents the overall variation of the system captured by that axis. Axes
are ordered from most to least variance explained. Note, that within the biplot the element with the largest
magnitude for each axis is forced to be positive. All other signs for the axis are modified accordingly. Points that are
closer together are more similar than those farther away. Similarly, vectors with similar angles are more correlated.
Vectors pointing in opposite directions have a strong negative correlation. Vector length (EOF Loading) indicates
the strength of that factor in explaining the variation along each axis. Expansion coefficients are plotted as
individual data points and represent the transformed variable values for the given axis. Drought years are labeled.
Table 1. EOF loadings by axis for inter-annual shelf wide analysis. Variance explained by each axis is given in
parentheses. EOF loadings represent values derived from a correlation matrix along that axis. Numbers are
interpreted similarly to correlation coefficients where negative and positive values represent negative and positive
correlations, respectively. Values > ± 0.5 are considered strong and are in bold.
Axis 1
(37.3%)
Axis 2
(24.2%)
Axis 3
(16.2%)
May NOx Load -0.5522 0.0352 -0.0130
June-July River Discharge -0.2981 0.4104 0.4068
Predominant Wind Direction 0.0071 0.2761 -0.7066
Average Wind Velocity 0.1109 0.6374 0.0210
Maximum Wind Gust 0.1673 0.5286 0.2783
Hypoxic Area -0.3610 -0.1837 0.3170
May NH3 Load -0.3957 0.1848 -0.3918
May Ortho P Load -0.5282 0.0236 -0.0561
Conditions in May, June and July 2010 (transects C and F)
The bottom-water aromatic hydrocarbon concentrations were highest during the mid-May cruise,
which was approximately one month after the spill began (Figure 6). The concentrations were
sharply lower during the June cruise at most stations and again in July (Figure 6). Spatially, the
highest concentrations were observed at the offshore stations of transect C (C6C to C9), and
inshore portion of the F transect (F0 to F4). The dissolved oxygen concentrations for bottom
water were typically lower in May than in June, with bottom waters of transects C and F being
mostly hypoxic in July.
Page 19
16
Figure 6. Bottom-water aromatic hydrocarbon concentrations for transects C and F in May, June and July 2010
(upper panel) and bottom-water dissolved oxygen concentrations for the same months (lower panel).
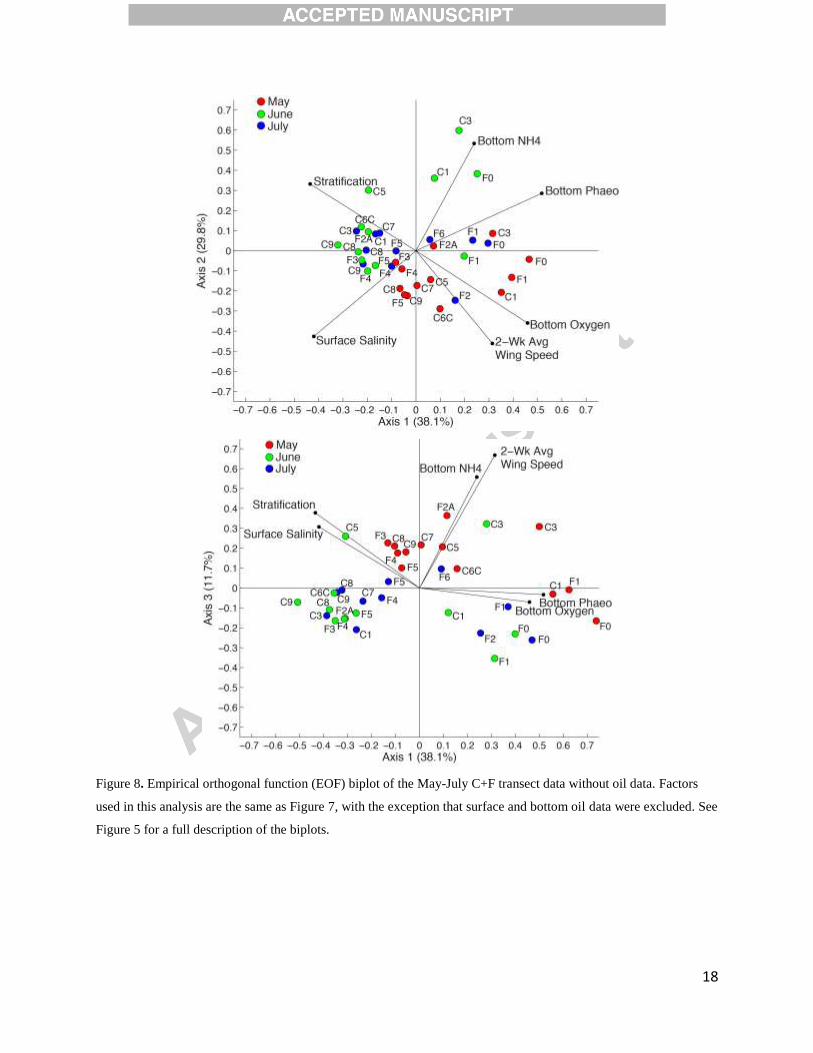
The EOF analyses for monthly 2010 data were conducted with and without oil data. The May
station data were distinctly separate from the June and July station data in the EOF analysis when
the oil data were included (Figure 7). Conversely, when the oil data were not included in the
analysis, the May station data were within the cloud of the other two months of data (Figure 8).
May station data were strongly and positively associated with wind speed and a correspondingly
negative association with stratification, indicating an aerated water column (Figure 8).
Irrespective of oil, the oxygen concentrations in June and July were correlated with stratification,
wind speed and surface salinity (Figures 7 and 8). These forcing factors paralleled the influence
of stratification on the overall hypoxic area observed for the 27-y data (Figure 5).
Page 20
17
Figure 7. Empirical Orthogonal Function (EOF) biplot of the May-July C+F transect data with oil included. Factors
include bottom-water oxygen, ammonium (NH4), phaeopigments and aromatic hydrocarbons, surface-water salinity
and aromatics, stratification and average wind speed for two weeks before the day of sampling. See Figure 5 for a
full description of the biplots.
Page 21
18
Figure 8. Empirical orthogonal function (EOF) biplot of the May-July C+F transect data without oil data. Factors
used in this analysis are the same as Figure 7, with the exception that surface and bottom oil data were excluded. See
Figure 5 for a full description of the biplots.
Page 22
19
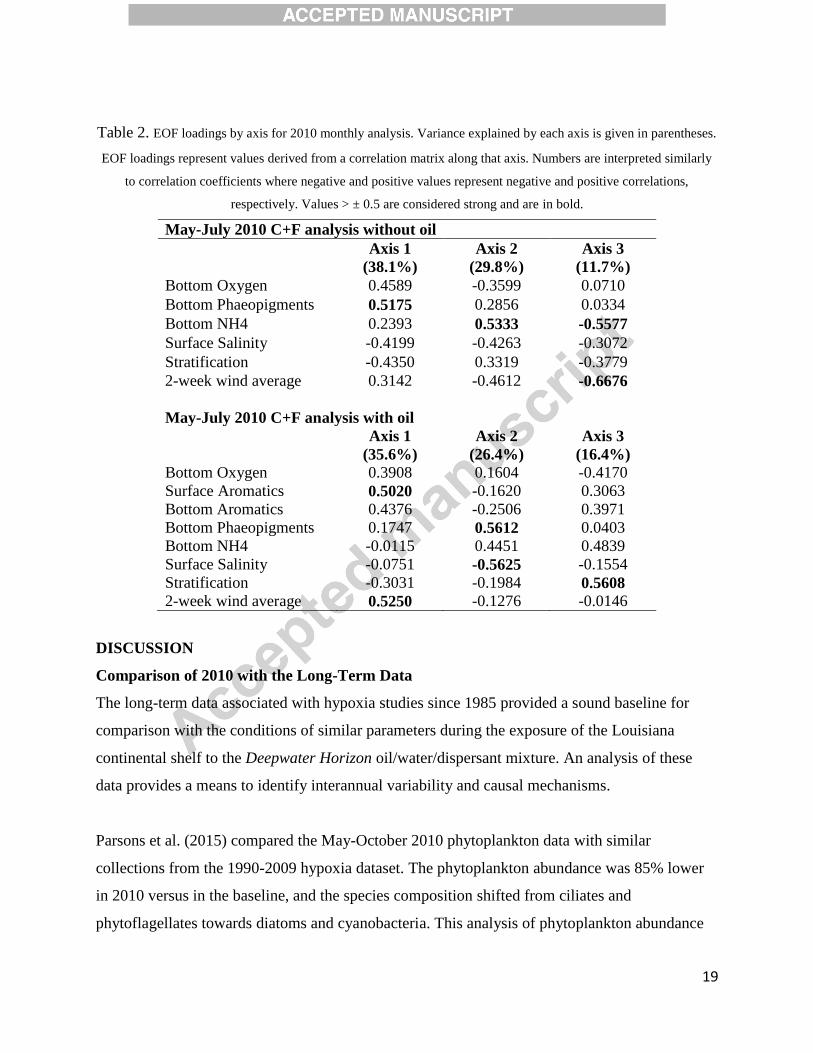
Table 2. EOF loadings by axis for 2010 monthly analysis. Variance explained by each axis is given in parentheses.
EOF loadings represent values derived from a correlation matrix along that axis. Numbers are interpreted similarly
to correlation coefficients where negative and positive values represent negative and positive correlations,
respectively. Values > ± 0.5 are considered strong and are in bold.
May-July 2010 C+F analysis without oil
Axis 1
(38.1%)
Axis 2
(29.8%)
Axis 3
(11.7%)
Bottom Oxygen 0.4589 -0.3599 0.0710
Bottom Phaeopigments 0.5175 0.2856 0.0334
Bottom NH4 0.2393 0.5333 -0.5577
Surface Salinity -0.4199 -0.4263 -0.3072
Stratification -0.4350 0.3319 -0.3779
2-week wind average 0.3142 -0.4612 -0.6676
May-July 2010 C+F analysis with oil
Axis 1
(35.6%)
Axis 2
(26.4%)
Axis 3
(16.4%)
Bottom Oxygen 0.3908 0.1604 -0.4170
Surface Aromatics 0.5020 -0.1620 0.3063
Bottom Aromatics 0.4376 -0.2506 0.3971
Bottom Phaeopigments 0.1747 0.5612 0.0403
Bottom NH4 -0.0115 0.4451 0.4839
Surface Salinity -0.0751 -0.5625 -0.1554
Stratification -0.3031 -0.1984 0.5608
2-week wind average 0.5250 -0.1276 -0.0146
DISCUSSION
Comparison of 2010 with the Long-Term Data
The long-term data associated with hypoxia studies since 1985 provided a sound baseline for
comparison with the conditions of similar parameters during the exposure of the Louisiana
continental shelf to the Deepwater Horizon oil/water/dispersant mixture. An analysis of these
data provides a means to identify interannual variability and causal mechanisms.
Parsons et al. (2015) compared the May-October 2010 phytoplankton data with similar
collections from the 1990-2009 hypoxia dataset. The phytoplankton abundance was 85% lower
in 2010 versus in the baseline, and the species composition shifted from ciliates and
phytoflagellates towards diatoms and cyanobacteria. This analysis of phytoplankton abundance
Page 23
20
and community composition data shows a difference in years, but with an inference for indirect
evidence suggesting that the Deepwater Horizon oil spill may have had an impact on Louisiana
coastal waters west of the Mississippi River. The shift from a ‘summer’ phytoplankton
community composition to a ‘spring’ phytoplankton composition in summer 2010 may reflect
conditions during the 2010 Mississippi River flood in summer that were more typical of a
‘spring’ condition over the longer term (Dortch et al., 2011). Additional toxicological studies
may help refine the field data.
In the case of our study of hypoxia, there was no adequate way to compare whole ecosystem
indicators through any manipulation. By comparing 27-y baseline data, however, we can state
that the area and conditions of hypoxia in the shadow of oiled continental shelf waters were
similar to other years, providing indirect evidence to suggest no impacts on hypoxia size. The
multivariate analysis of the historical data, including the 2010 data, identified similar factors in
all years associated with the area of hypoxic bottom waters. Overall, hypoxia on the Louisiana-
Texas shelf during the shelf wide survey of 2010 was as would be expected within the context of
the 27-y dataset, i.e., hypoxia developed during periods of stratification following spring
nutrient-enhanced organic matter flux of phytoplankton as cells or zooplankton fecal pellets to
the seabed (Rabalais et al., 2007b). The parameters responsible for 75% of the variation in the
data (axes 1 and 2) were: higher river discharge from 15 June to 15 July, approximating the
strength of stratification; higher May nutrient load, responsible for the amount of organic matter
flux that drives respiration and depletion of oxygen; and an easterly (westward) wind that pushes
the hypoxic water mass toward the west leading to a larger footprint for hypoxia (Cochrane and
Kelly, 1986; Rabalais et al., 2007a).
Oil Presence in 2010
Hydrocarbons, either as sheen or mousse, were observed by cruise participants in May, June and
July of 2010, and also quantified for surface and bottom waters. The stations furthest offshore
along transect C, closer to the Mississippi River delta and the observed oil plumes, had higher
concentrations of aromatic hydrocarbons than those closer to shore. Conversely, at the F transect
off the Atchafalaya River, the concentrations of aromatic hydrocarbons were higher closer to
shore. These distributions are similar to those modeled as oil was injected into the Louisiana
Page 24
21
bight and then became entrained in the alongshore Louisiana Coastal Current (Justić et al.
unpubl.). The aromatic hydrocarbon concentrations were highest in the bottom waters of the
shelf during May. This coincided with a time in which high winds prevailed and the water
column was well mixed – circumstances under which hypoxia does not form. Hydrocarbon
concentration dropped off sharply in July, a time of increasing stratification and decreasing
bottom oxygen concentrations. Results of Balthis et al. (2013) suggest that the flux of surface oil
to the seabed (where hypoxia is formed) was limited in these offshore shelf waters following the
spill, with sediments exhibiting normal background levels of PAHs and other hydrocarbons over
broad areas of the shelf including ones coinciding with the present study area.
Hu et al. (2016), sampled the inorganic chemistry of the water column concurrently with our
2010 shelf wide sampling and conjectured that the microbial metabolism of oil was the reason
for four stations (A5, A7, B9, C9) falling outside of the main relationship between AOU
(apparent oxygen utilization, mol kg-1
) and DIC (dissolved inorganic carbon, mol kg-1
)
according to organic matter reaction stoichiometry. There were, however, 81 other stations that
were consistent for the main AOU and DIC relationship for 2010 and four other years with July
data, similar to the long-term data for the continental shelf where hypoxia forms.
CONCLUSION
The multivariate analyses identified the representative and overall factors driving the formation
and maintenance of hypoxia in the Gulf of Mexico adjacent to the Mississippi River. We can be
confident, therefore, that 2010 indeed was not an anomalous year within the context of the
greater dataset (1990-2014). The size of hypoxia in summer 2010 was related to similar
processes – nitrogen loading, river discharge, wind direction, and the presence of a tropical
storm. This lack of difference in the 2010 oil spill hypoxia season may have been related to: (1)
the timing of the spill and diminishing hydrocarbon concentrations from May to July, (2)
insufficient oil exposure data and time series across the broad area of hypoxia, and (3) the
underlying mechanisms that fuel hypoxia – the river flow and nutrient load leading to organic
loading to the sea floor –overshadowed any impact of the remaining oil during July. We consider
the conditions of the hypoxic area during 2010 to be “business as usual.”
Page 25
22
The presence of the oil spill at a time when hypoxia develops drew public attention to more
water quality issues in the northern Gulf of Mexico than the oil spill. It is imperative that safety
controls and enhanced offshore oil development procedures prevent more serious oil spills from
deeper water production. It is also imperative that application of mitigation efforts within the
Mississippi River basin also work to reduce nitrogen loads and minimize hypoxia and its effects
on living resources. Finally, this analysis is only possible because of the long-term baseline data
stemming from a 30-year funded series of hypoxia studies in the northern Gulf of Mexico. Funds
for the hypoxia program and others like it are becoming rarer amid calls for better background
data to better define oil spill impacts. The opposite should be the case.
ACKNOWLEDGEMENTS
We thank all individuals who over 30 years have contributed to the success of shelf wide and
other hypoxia cruises. Data were collected with funding from multiple grants supporting hypoxia
studies from 1985 to 2015, primarily from the National Oceanographic and Atmospheric
Administration, Coastal Ocean Program and Center for Sponsored Coastal Ocean Research,
including the most recent grant numbers NA06OP0528 and NA09NOS4780204 to Louisiana
Universities Marine Consortium, and awards NA06OP0529 and NA09NOS4780230 to
Louisiana State University. Other data collections and analyses were supported in part by a grant
from The Gulf of Mexico Research Initiative, doi: 10.7266/N7JS9NCH, and doi:
10.7266/N7W66HP0. Chemical analyses were conducted by Edward B. Overton and staff,
Louisiana State University – Response and Chemical Assessment Team. The hypoxia data can
be found in the NOAA, National Center for Environmental Information (formerly National
Oceanographic Data Center) (accession numbers: 9800129, 0002033, 0020956, 0032050,
0039733, 0049435, 0060060, 0069471, 0099531, 00117436, 0129417, 0162101, 0162440,
0161219, 164298). Data specific to 2010 can be found at NODC Accession 0117436, also doi:
10.7266/N7W66HP0. The river discharge data for 1985-2014 were obtained from the US Army
Corps of Engineers (rivergages.mvr.usace.army.mil) stations on the Mississippi River at Tarbert
Landing, MS (station 1100) and Atchafalaya River at Simmesport, LA (station 3405).
Mississippi River nitrate, orthophosphate and ammonium load data for 1985-2014 were obtained
from the US Geological Survey (USGS, toxics.usgs.gov). Wind data were available from station
GDIL1 on Grand Isle, LA from 1990 to 2005 at [NOAA National Data Buoy Center (NDBC),
doi: gov.noaa.nodc:0117682]. Wind data were available from station GSIL1 (replacement for
damaged GDIL1) from 2005 to 2014 (NBDC http://www.ndbc.noaa.gov/).
Contributors
N. N. Rabalais and R. E. Turner have been Co-Principal Investigators of northern Gulf of
Hypoxia hypoxia studies from 1985 to present, designed the study, and provided all ‘hypoxia’
data. L.M. Smith collected all ancillary data, conducted the statistical analyses, and generated the
figures. They have collaboratively collected and analyzed all data. All authors have approved the
Page 26
23
final article. Neither NOAA nor GoMRI participated in the study design, analyses, and
interpretation of the data or development of the publication.
References
Balthis, W.L., J.L. Hyland, C. Cooksey, M.H. Fulton and E.F. Wirth. 2013. Ecological Condition of
Coastal Ocean Waters of the Western Gulf of Mexico: 2011. NOAA Technical Memorandum
NOS NCCOS 171, NOAA National Ocean Service, Charleston, SC 29412-9110. 63 pp.
http://aquaticcommons.org/14670/1/NOS%20NCCOS%20171.pdf Accessed 6 September
2017.
Blum, M.D. and H.H. Roberts. 2009. Drowning of the Mississippi Delta due to insufficent
sediment supply and global sea-level rise. Nature Geoscience 2, 488-491.
doi:10.1038/NGE0553.
Cochrane, J.D. and F.J. Kelly, Jr. 1986. Low-frequency circulation on the Texas-Louisiana shelf.
Journal of Geophysical Research 91(C9), 10645-10659.
Camilli, R., C.M. Reddy, D.R. Yoerger, B.A.S. Van Mooy, M.V. Jakuba, J.C. Kinsey, C.P.
McIntyre, S.P. Sylva and J.V. Maloney. 2010. Tracking hydrocarbon plume transport and
biodegradation at Deepwater Horizon. Science 330, 201-204.
Couvillion, B.R., J.A. Barras, G.D. Steyer, W. Sleavin, M. Fischer, H. Beck, N. Trahan, B.
Griffin and D. Heckman. 2011. Land area change in coastal Louisiana from 1932 to 2010:
US Geological Survey Scientific Investigations Map 3164, 12 p., scale 1:265,000, Pamphlet.
Dortch, Q., N.N. Rabalais, R.E. Turner and N.A. Qureshi. 2001. Impacts of hanging Si/N ratios
and phytoplankton species composition, pp. 37-48 in N.N. Rabalais and R.E. Turner (eds.),
Coastal Hypoxia: Consequences for Living Resources and Ecosystems. Coastal and
Estuarine Studies 58, American Geophysical Union, Washington, D.C.
Du, M. and J.D. Kessler. 2012. Assessment of the spatial and temporal variability of bulk
hydrocarbon respiration following the Deepwater Horizon oil spill. Environmental Science
and Technology 6, 10499−10507. dx.doi.org/10.1021/es301363k
Hannachi, A., I.T. Jolliffe and D.B. Stephenson. 2007. Empirical orthogonal functions and
related techniques in atmospheric science: A review. International Journal of Climatology 27,
1119–1152.
Page 27
24
Hu, X., W.-J. Cai, N.N. Rabalais and J. Xue. 2016. Coupled oxygen and dissolved inorganic
carbon dynamics in coastal ocean and its use as a potential indicator for detecting water
column oil degradation. Deep Sea Research Part II: Topical Studies in Oceanography 129,
311-318. http://dx.doi.org/10.1016/j.dsr2.2014.01.010
Justić, D. and L. Wang. 2014. Assessing temporal and spatial variability of hypoxia over the
inner Louisiana–upper Texas shelf: Application of an unstructured-grid three-dimensional
coupled hydrodynamic-water quality model. Continental Shelf Research 72, 163–179.
Justić, D., V.J. Bierman Jr., D. Scavia and R.D. Hetland. 2007. Forecasting Gulf’s hypoxia: The
next 50 years. Estuaries and Coasts 30, 791-801.
Justić, D., N.N. Rabalais and R.E. Turner. 2002. Modeling the impacts of decadal changes in
riverine nutrient fluxes on coastal eutrophication near the Mississippi River Delta. Ecological
Modeling 152, 33-46.
McNutt, M.K., R. Camilli, T.J. Crone, G.D. Guthrie, P.A. Hsiehe, T.B. Ryerson, A. Savas and F.
Shafferd. 2012. Review of flow rate estimates of the Deepwater Horizon oil spill.
Proceedings of the National Academy of Science, USA 109(50), 20,260-20,267.
doi:10.1073/pnas.1112139108.
Lubchenco, J.J., M.K. McNutt, G. Dreyfus, S.A. Murawski, D.M. Kennedy, P.T. Anastas, S. Chu
and T. Hunter. 2012. Science in support of the Deepwater Horizon response. Proceedings of
the National Academy of Science, USA, 109(50), 20,212–20,221.
doi/10.1073/pnas.1204729109.
Mears, C.A., D.K. Smith and F.J. Wentz. 2001. Comparison of special sensor microwave imager
and buoy-measured wind speeds from 1987 to 1997. Journal of Geophysical Research:
Oceans 106, 11719–11729.
Monahan, A.H., J.C. Fyfe, M.H.P. Ambaum, D.B. Stephenson and G.R. North. 2009. Empirical
orthogonal functions: The medium is the message. Journal of Climate 22, 6501–6514.
Montagna, P.A., J.G. Baguley, C. Cooksey, I. Hartwell, L.J. Hyde, J.L. Hyland, R.D. Kalke, L.
M. Kracker, M. Reuscher and A.C.E. Rhodes. 2013. Deep-sea benthic footprint of the
Deepwater Horizon blowout. PLoS ONE 8(8), e70540. doi:10.1371/journal.pone.0070540
Obenour, D. R., D. Scavia, N.N. Rabalais, R.E. Turner and A.M. Michalak. 2013. A
retrospective analysis of mid-summer hypoxic area and volume in the northern Gulf of
Page 28
25
Mexico, 1985-2011. Environmental Science and Technology 47, 9808-9815.
dx.doi.org/10.1021/es400983g
Parsons, M., W. Morrison, N.N. Rabalais and R.E. Turner. 2015. Phytoplankton and the
Macondo oil spill: A comparison of the 2010 phytoplankton assemblage to baseline
conditions on the Louisiana Shelf. Environmental Pollution 207, 152-160.
Rabalais, N. and R.E. Turner. 2010. 2010 Dead Zone – One of the Largest Ever. Louisiana
Universities Marine Consortium. Press Release, August 1, 2010.
http://www.gulfhypoxia.net/Research/Shelfwide%20Cruises/2010/PressRelease2010.pdf
Accessed 28 June 2016
Rabalais, N and R.E. Turner. 2015. 2015 Dead Zone – Press Release, Louisiana Universities
Marine Consortium.
http://www.gulfhypoxia.net/Research/Shelfwide%20Cruises/2015/PRESS_RELEASE_2015.
pdf Accessed 28 June 2016
Rabalais, N.N., R.E. Turner and D. Scavia. 2002. Beyond science into policy: Gulf of Mexico
hypoxia and the Mississippi River. BioScience 52, 129-142.
Rabalais, N.N., R.E. Turner, B.K. Sen Gupta, D.F. Boesch, P. Chapman and M.C. Murrell.
2007a. Hypoxia in the Northern Gulf of Mexico: Does the science support the plan to reduce,
mitigate, and control hypoxia? Estuaries and Coasts 30, 753–772.
Rabalais, N.N., R E. Turner, B.K. Sen Gupta, E. Platon and M.L. Parsons. 2007b. Sediments tell
the history of eutrophication and hypoxia in the northern Gulf of Mexico. Ecological
Applications 17(5) Supplement, S129-S143.
SCAT – The Shoreline Cleanup Assessment Technique map
https://gomex.erma.noaa.gov/erma.html#/x=90.52128&y=29.82386&z=8&layers=16+6770+
15879+19872+19897 Accessed 20 March 2016
Schmickle, S. 2010. “Scientists begin to assess how Gulf 'dead zone' and oil spill might interact.”
http://www.minnpost.com/scientificagenda/2010/05/20/18355 Accessed 20 Apr 2017
Turner, R.E., N.N. Rabalais and D. Justić. 2012. Predicting summer hypoxia in the northern Gulf
of Mexico: Redux. Marine Pollution Bulletin 64, 319–324.
Turner, R.E., E. B. Overton, B.M. Meyer, M.S. Miles and L. Hooper-Bui. 2014. Changes in the
concentration and relative abundance of alkanes and PAHs from the Deepwater Horizon
oiling of coastal marshes. Marine Pollution Bulletin 86, 291-297.
Page 29
26
Wallace, E. June 2010. “A Dead Zone Was Already in the Gulf” Times Picayune, New Orleans.
Highlights
The Deepwater Horizon oil spill coincided with summer hypoxia on the Louisiana continental
shelf.
The factors important in the dynamics of hypoxia during the summer of 2010 (spill year) did not
differ from those of other years.
The analysis did not prove or disprove effects of the oil spill on 2010 summer hypoxia.
View publication statsView publication stats