28
IRPP STUDY June 2020 | No. 77 The Demographics of Automation in Canada: Who Is at Risk? Marc Frenette and Kristyn Frank THE FUTURE OF SKILLS AND ADULT LEARNING

IRPP STUDY June 2020 | No. 77
The Demographics of Automation in Canada: Who Is at Risk?Marc Frenette and Kristyn Frank
THE FUTURE OF SKILLS AND ADULT LEARNING

ABOUT THIS STUDY
This study was published as part of The Future of Skills and Adult Learning re-search program, under the direction of Natalia Mishagina. The manuscript was copy- edited by Madelaine Drohan, proofreading was by Robyn Packard, edi-torial coordination was by Francesca Worrall, production was by Chantal Létourneau, and art direction was by Anne Tremblay.
Marc Frenette is a researcher at Statistics Canada. For over two decades he has been highlighting and explaining trends in various socio-economic areas, including post-secondary education, skills, immigration, social assistance and income inequal-ity. He spent two years at the Social Research and Demonstration Corporation as the lead researcher for two of Canada’s largest randomized field experiments in post- secondary access (Future to Discover and BC Avid). He holds a PhD in economics from the University of Nottingham (UK).
Kristyn Frank is a researcher at Statistics Canada. Her research focuses primarily on the skills and labour market outcomes of post-secondary graduates, and the social and economic integration of immigrants in Canada. Previously, she held a Social Sciences and Humanities Research Council postdoctoral fellowship at the University of Guelph and was a research analyst at the Higher Education Quality Council of Ontario. She holds a PhD in sociology from the University of Waterloo.
To cite this document:Frenette, Marc, and Kristyn Frank. 2020. The Demographics of Automation in Canada: Who Is at Risk? IRPP Study 77. Montreal: Institute for Research on Public Policy.
The opinions expressed in this study are those of the authors and do not necessarily reflect the views of the IRPP or its Board of Directors.
IRPP Study is a refereed monographic series that is published irregularly throughout the year. Each study is subject to rigorous internal and external peer review for academic soundness and policy relevance.
If you have questions about our publications, please contact [email protected]. If you would like to subscribe to our newsletter, IRPP News, please go to our website, at irpp.org.
Cover photo: Shutterstock.com.
ISSN 1920-9436 (Online) ISSN 1920-9428 (Print)

CONTENTS
Summary .................................................................................................................................2
Résumé ....................................................................................................................................3
Automation and Jobs ............................................................................................................5
Methods ..................................................................................................................................6
Who Is at Risk? ........................................................................................................................8
Conclusion ............................................................................................................................16
Appendix ..............................................................................................................................19
References ............................................................................................................................24

The Demographics of Automation in Canada: Who Is at Risk?
2
SUMMARY
The COVID-19 pandemic has exposed a new vulnerability among firms that rely on human labour. In order to comply with public health directives on physical distanc-ing, many businesses have had to completely shut down their operations for months. Others remained functional thanks to teleworking, which many intend to prolong and even adopt permanently. As experts contemplate the long-term repercussions of the pandemic on the economy, many expect firms to ramp up their adoption of new tech-nologies to better weather the post-pandemic recession and insulate themselves from future health crises.
Just a few years ago, policy-makers became concerned about the prospect of many job-related tasks being automated using advances in robotics and artificial intelli-gence and in particular about the projected job losses at the time. While we no longer expect entire jobs to disappear, new technologies may substantially transform jobs, forcing workers to adjust to new requirements and prompting governments to assist them in this process.
In this study, Statistics Canada researchers Marc Frenette and Kristyn Frank are break-ing new ground by examining the demographic and employment characteristics of workers facing a high risk of job transformation due to automation. To assess the potential impact of a new wave of automation on vulnerable workers, policy-makers need to know not only what jobs are at risk but also who holds these jobs. For instance, while we know that previous waves of robotization replaced low-skilled workers and enhanced the work of those with high skills, this time around there are fears it is high-skilled workers who are at risk, given the rise of new algorithms that are increasingly proficient at accomplishing complex cognitive tasks.
Consistent with the findings of previous research, Frenette and Frank show that, over-all, more than 10 percent of Canadian workers face a high risk of seeing their jobs transformed through automation – high risk being defined as a probability of 70 per-cent and higher. And close to 30 percent of workers face a 50-to-70 percent risk. What the authors underscore, however, is that the extent to which the automation risk varies is based on certain worker characteristics. For instance, more than a third of workers without a certificate, diploma or degree face a high risk of job transformation, com-pared with fewer than 4 percent for those with degrees. The probability of being at high risk also decreases significantly as employment income increases. Over a quarter of workers in the bottom decile of the income distribution are at high risk, whereas only 2 percent of workers in the top decile are. Also among the groups most exposed to job transformation are older workers (aged 55 and over), those with low literacy or numeracy proficiency, the part-time employed, those working in small firms, and in manufacturing, where about 27 percent workers are at high risk. The authors find no significant differences in the risk of job transformation on the basis of gender, immi-gration status, having a disability or being unionized.
The results from this study stand in sharp contrast with many observers’ expectations that the new technologies could adversely affect workers previously seen as immune to automation. It suggests that the workers at high risk of job transformation due to
automation, by and large, share the same characteristics as workers who have been susceptible to poor labour market outcomes in the past. Frenette and Frank say that more research is needed to better understand which characteristics can be interpret-ed as risk factors. Nevertheless, by shedding light on the differential effects of automa-tion on particular segments of the workforce, their study contributes to labour market policy development going forward.
RÉSUMÉ
La pandémie de COVID-19 a mis en évidence la vulnérabilité des entreprises qui dé-pendent du travail humain. Pour se conformer aux directives de distanciation phy-sique des autorités de santé publique, beaucoup ont dû fermer leurs portes pendant plusieurs mois. D’autres ont pu maintenir certaines activités grâce au télétravail, que plusieurs songent à prolonger et même à pérenniser. Tandis que les experts étudient les répercussions économiques à long terme de la pandémie, nombre d’observateurs prévoient que les entreprises accéléreront l’adoption de nouvelles technologies pour mieux affronter la récession attendue et se protéger de futures crises sanitaires.
Il y a quelques années, les décideurs ont commencé à s’inquiéter de l’automatisation de nombreuses tâches suscitée par les progrès de la robotique et de l’intelligence artificielle, et surtout des pertes d’emplois que laissaient entrevoir les projections ini-tiales. Mais si l’on n’envisage plus la disparition totale de certains métiers, les techno-logies continueront de transformer les emplois, obligeant les travailleurs à s’adapter à de nouvelles exigences et exhortant les gouvernements à leur venir en aide.
Les chercheurs de Statistique Canada Marc Frenette et Kristyn Frank innovent ici en exa-minant les caractéristiques démographiques et d’emploi des travailleurs qui risquent d’être fortement touchés par l’automatisation. Car pour mesurer l’impact d’une pro-chaine vague d’automatisation sur les travailleurs vulnérables, les décideurs doivent non seulement connaître les emplois menacés mais aussi ceux qui les occupent. Nous savons ainsi que les précédentes vagues de robotisation ont remplacé des salariés peu qualifiés et profité aux travailleurs spécialisés, mais certains craignent que ces travailleurs hautement qualifiés soient à leur tour menacés par des algorithmes qui exécutent de plus en plus efficacement des tâches cognitives complexes.
Corroborant des études antérieures, celle-ci montre que plus de 10 p. 100 des tra-vailleurs canadiens courent un risque élevé (probabilité d’au moins 70 p. 100) de voir leur emploi transformé par l’automatisation, près de 30 p. 100 courant un risque de 50 à 70 p. 100. Mais ce risque d’automatisation varie selon les caractéristiques des tra-vailleurs, soulignent les auteurs. Pour plus du tiers des salariés sans certificat ou diplôme d’études supérieures, par exemple, la transformation des emplois présente un risque élevé, alors que ce même risque ne touche que moins de 4 p. 100 des diplômés. Et cette probabilité de risque élevé diminue sensiblement avec l’augmentation du revenu d’emploi : plus du quart des travailleurs du décile inférieur de la répartition des revenus courent ainsi un risque élevé, contre seulement 2 p. 100 du décile supérieur. Et parmi
3
IRPP Study | June 2020
The Demographics of Automation in Canada: Who Is at Risk?
4
les groupes les plus menacés figurent les travailleurs âgés (55 ans et plus), ceux qui ont un faible niveau de littératie et de numératie, les employés à temps partiel ainsi que les salariés des petites entreprises et du secteur manufacturier, dont 27 p. 100 courent un risque élevé. Aucune différence notable ne s’observe toutefois selon le sexe, le statut d’immigration, la situation de handicap ou la présence syndicale.
Les conclusions de cette étude contrastent vivement avec les prédictions de nom-breux observateurs, selon qui les nouvelles technologies pourraient nuire à des travailleurs qu’on croyait à l’abri de l’automatisation. Elles indiquent plutôt que les tra-vailleurs fortement menacés par l’automatisation présentent globalement les mêmes caractéristiques que ceux qui risquaient déjà de se retrouver désavantagés sur le mar-ché du travail. Les auteurs estiment qu’il faut approfondir la recherche pour mieux comprendre quelles caractéristiques constituent des facteurs de risque. Toutefois, leur étude constitue un solide premier pas vers l’analyse des différents effets de l’au-tomatisation sur certains segments de la main-d’œuvre. Ce faisant, elle contribue à l’élaboration de meilleures politiques d’adaptation au marché du travail.
IRPP Study | June 2020
5
AUTOMATION AND JOBS
Recent advances in the development of driverless vehicles, robo-writers and comput-er-aided medical diagnostics have led many to speculate that new technologies will trigger widespread adoption of new forms of automation in the workplace, with major implications for jobs. As they see it, there may be little that humans do that cannot be replicated at a lower cost by robots or algorithms. These concerns may have been fur-ther fuelled by early estimates produced by Frey and Osborne (2013) suggesting that about half of all jobs in the United States could face a high risk of automation within 10 to 20 years. Although they were careful not to interpret their findings as job loss estimates, the same could not be said for the popular press.
Since then, conventional thinking on the topic of automation and related job loss has evolved considerably. First, the general recognition that jobs are made up of vari-ous tasks has led to changes in the standard methodology for estimating automation risk. In recent years, researchers have moved away from Frey and Osborne’s occupa-tion-based approach and adopted more task-based approaches (Arntz, Gregory and Zierahn 2016; Manyika et al. 2017). Second, whereas initial estimates of automation risk were generally interpreted as the risk of job loss, task-based approaches have underscored the point that jobs facing a high automation risk are not necessarily at risk of being lost. Humans will still be required to work with new technologies. Thus, the more recent interpretation of automation risk focuses on job transformation, rather than on job loss. Third, it is also more widely acknowledged that the process and the timing of adoption of new forms of automation are contingent on a host of factors beyond technological feasibility. There may be obstacles to overcome, such as firms’ financial capacity to acquire new technologies, legal constraints (will robots become licensed medical doctors?), institutional factors such as union contracts, as well as consumer acceptance (will the public accept driverless city buses?). The social and economic contexts also have a bearing. For example, the COVID-19 pandemic may prompt some firms to accelerate investments in automation-related technology to re-duce their reliance on human workers.
Regardless of the timelines involved, the potential for these new technologies to fundamentally transform labour markets has captured the attention of many policy- makers worldwide. They are particularly interested in gauging the potential impacts on groups of workers susceptible to adverse employment and earnings outcomes and what, if anything, this could mean for policy. While there is now ample research on the risk of occupations, jobs or tasks being affected by automation, little is known about the workers who hold these jobs. Given the targeted nature of many employ-ment-support programs, understanding who is at risk will inform discussions on policy development, both now and in the future.
This study seeks to advance our knowledge of automation risk in the Canadian work-place by examining which groups of workers face greater risk. It is likely that different types of workers will be affected as technology improves and more tasks are auto-mated. For instance, manual labourers were the workers most affected when the

The Demographics of Automation in Canada: Who Is at Risk?
6
earliest forms of technology were being implemented. But workers performing more cognitive tasks may be affected as digitization increasingly underpins most new forms of technological advancements.
To answer the main research question, our study builds on the work of Arntz, Gregory and Zierahn (2016) and applies a task-based approach to more recent Canadian data. Two earlier studies estimated the degree of automation risk for Canadian jobs. They were based either on the Frey and Osborne approach (Lamb 2016) or the slightly updated and modified version by Oschinski and Wyonch (2017). In line with Frey and Osborne’s estimates, the two studies concluded that a significant proportion of jobs are at a high risk of automation. Lamb estimated 42 percent. Oschinski and Wyonch estimated 35 percent. Using a more comprehensive list of tasks in their adjustment, Arntz, Gregory and Zierahn find a much lower estimate for Canada — at 9 percent.1 Our study, while similar to that of Arntz, Gregory and Zierahn in methodology, goes beyond estimating the proportion of jobs at risk and examines differences in the risk of job transformation due to automation across several worker and firm characteris-tics. These include workers’ age and education and the size of the firm they work for.
It is important to note that new technologies may create as many new opportunities for some workers as they remove for others. For example, previous research demon-strated that advances in digital technology in the 1980s and 1990s replaced certain jobs associated with routine calculations, such as bookkeepers. But these advances also created considerably more new jobs in areas that complement digital technology, such as computer programmers (Autor, Levy and Murnane 2003; Graetz and Michaels 2018). The focus of our study is on the risk — not necessarily of job loss, but of job transformation — for existing groups of workers. No attempts are made to estimate new job opportunities for these workers.
METHODS
We used an approach similar to that of Arntz, Gregory and Zierahn, who adjusted the initial automation risk estimates provided by Frey and Osborne in 2013. Frey and Osborne assigned a probability of automation over the next 10 or 20 years to occupa-tions in the 2010 US Standard Occupational Classification (SOC) on the basis of input from artificial intelligence experts.2 They first presented the experts with a subset of 70 occupations and their task descriptions from the Occupational Information Network (O*NET) database, and asked them, “Can the tasks of this job be sufficiently specified, conditional on the availability of big data, to be performed by state-of-the-art com-puter-controlled equipment?” They then modelled the probabilities of automation for the rest of the occupations on the basis of the experts’ responses. Frey and Osborne
1 Since it is more appropriate to interpret the findings in these studies as the risk of job transformation, as opposed to job loss, readers should be careful not to draw any comparisons to the more established litera-ture on the risk of job loss and post-displacement outcomes (Morissette and Qiu 2020; Morissette and Qiu 2020 forthcoming).
2 The methods are described in considerable detail in the jointly released study by Frenette and Frank (2020). Only a brief overview is provided here.
IRPP Study | June 2020
7
also used nine task variables that capture three skill categories they call “engineering bottlenecks to computerization”: perception and manipulation, creativity, and social intelligence. Using these probabilities, they calculated the share of the US workforce facing a high risk of automation, which they defined as a probability of 70 percent or higher.
Arntz, Gregory and Zierahn adjusted Frey and Osborne’s estimates to account for a more complete list of tasks (25 in total), as well as several individual and workplace characteristics available in the 2012 Programme for the International Assessment of Adult Competencies (PIAAC). Their estimates varied not only by occupation, but also by worker characteristics within occupations to the extent that tasks and other charac-teristics vary within occupations.
Our approach is similar, but not identical, to that of Arntz, Gregory and Zierahn. As a first step, we assigned Frey and Osborne’s automation risk probabilities to workers in the 2016 Longitudinal and International Study of Adults (LISA), on the basis of their occupations.3 To make Frey and Osborne’s data compatible with the Canadian data, we established a concordance between the 2010 SOC used in the United States and the 2011 National Occupational Classification (NOC) used in Canada, on the basis of the similarity of the occupational titles.4
Once we assigned the risk estimates to the NOC codes, we matched them to the 2016 LISA data file. The final sample was limited to paid workers aged 18 or above with valid responses for all the variables used in our analysis (these are described below). Self-employed workers were excluded.5 This resulted in a sample of 2,267 individuals.
Next, we adjusted the automation risk estimates from Frey and Osborne using the 25 task variables in LISA, which are almost identical to the ones used by Arntz, Gregory and Zierahn. Our approach differs from that of Arntz and her co-authors in that we adjusted the automation risk probabilities only for tasks, and not for individual and workplace characteristics. This provides a conceptually clear measure of automation risk based solely on technological feasibility.
We then estimated the automation-related risk of job transformation for various categor-ies of individual and workplace characteristics. Table A1 (see appendix) provides sample statistics for many of the variables used to derive these subsamples. They include sex, age, highest level of completed education, field of study (among post-secondary gradu-ates), literacy and numeracy scores, immigration and disability statuses, work hours, union membership or collective bargaining agreement coverage and firm size. We also break down the results by occupation, industry and percentile of employment income.
3 Frey and Osborne estimated automation probabilities using data from 2010. Arntz, Gregory, and Zierahn estimated adjusted automation probabilities using data from 2012.
4 The efforts of Joe He in producing this concordance are greatly appreciated. 5 Self-employed individuals generally face a very low risk of automation (less than 2 percent). This is largely
because they are more likely to be involved in consulting services, which are still, for the most part, the domain of humans. More generally, self-employed workers may have more flexibility to leave (or avoid) occupations facing a high risk of automation.

The Demographics of Automation in Canada: Who Is at Risk?
8
Again, it should be noted that workers affected by automation are not necessarily facing job loss as an outcome. In many instances, new technology may change rather than eliminate their jobs. For example, it may help them achieve the same or new goals more efficiently. With repetitive tasks delegated to robots and com-puters, human employees can also spend more time performing tasks not yet achievable by technology alone. It is for these reasons that the risk we refer to in this study is the risk of job transformation related to automation. Thus, while it may be tempting to compare our results with those in previous literature on job dis-placement, it is important to keep in mind that our results refer to a very different type of outcome.
WHO IS AT RISK?
As figure 1 shows, the vast majority of Canadian workers face at least some risk of job transformation due to automation. The predicted risk is at least 10 percent for 98.2 percent of the paid workforce. However, only 10.6 percent of workers face a high risk of 70 percent or higher. This is the same threshold for high risk used by Frey and Osborne and Arntz, Gregory and Zierahn. About one-quarter, or 29.1 percent, of workers face a moderate risk of 50 to 70 percent.6
6 Arntz, Gregory, and Zierahn (2016) found 9 percent for Canada using 2012 data. When we estimated a model that was almost identical to theirs on the data we use (from 2016), our findings were virtually unchanged. Thus, differences between our findings and theirs are largely related to the timing of the data (i.e., changes in the occupational distribution of Canadian workers between 2012 and 2016).
Figure 1. Distribution of the predicted risk of job transformation due to automation, Canada, 2016
Source: Authors’ calculations based on Statistics Canada, Longitudinal and International Study of Adults (LISA), Wave 3 (2016). https://www.statcan.gc.ca/eng/survey/household/5144
0
20
40
60
80
100
90% or more
80% or more
70% or more
60% or more
50% or more
40% or more
30%or more
20% or more
10% or more
Predicted risk
%

IRPP Study | June 2020
9
The focus of this study is on the share of workers in different socio-demographic groups who face a high risk of job transformation from automation.7 It is important to note that the differences between groups do not represent risk factors, as we do not account for a broad spectrum of covariates. For example, the risk faced by younger and older workers may differ due, in part, to differences in other characteristics, such as educational attainment or even sex. We do not account for the combined effect of all of these other characteristics in our analysis. Identifying the broad (or uncondition-al) differences, as we do in this study, is a first step to understanding which workers are at risk. Future research based on these differences could delve deeper into under-standing the gaps identified here.
The subgroup analysis begins with occupations. Although other factors come into play, occupations largely determine automation risk and provide good context for the results to follow. As figure 2 indicates, the group with the greatest concentration of workers facing a high risk is office support occupations, at 35.7 percent, which is almost twice as high as any other occupation.8 This group mainly consists of various types of clerks and receptionists. It is followed by service supervisors and specialized service occupations, at 20 percent. This group includes food service supervisors, chefs, butchers, hairstylists, tailors and cobblers. The next group is workers in industrial, electrical and construction trades, at 19.7 percent. Also facing an above-average risk are sales representatives and salespersons in wholesale and retail trade, at 14.7 percent. Next in the list are service representatives and other customer and personal service occupations, at 13.7 percent. This group includes those providing food and beverage service and travel and accom-modation service, as well as security guards and customer service representatives. The share of workers facing a high risk in maintenance and equipment operation trades is 13.2 percent. Thus, workers facing an above-average risk of job transformation due to automation (overall, 10.6 percent of workers face a high risk) are concentrated in occu-pations associated with nonprofessional administrative functions or in various trades, ranging from personal services to heavy industrial work.
It should be noted that many of the personal service jobs listed above might entail having friendly conversations with customers, who may not accept a robot substitute for this task. It may be the case that the artificial intelligence experts involved in Frey and Osborne’s original work did not consider this implicit part of these jobs. They were only asked about the technical feasibility of automating the job, not the commercial viability of doing so. Furthermore, the 25 task variables used by Arntz, Gregory and Zierahn and in our study do not include a measure of conversing with customers (al-though other forms of communication are included in both studies, such as advising, making speeches, persuading and negotiating). If friendly conversations with a human service provider are indeed an important part of certain service jobs, then the risk faced by these workers may be lower than what is presented here.
7 Although it would also be informative to document the entire risk distribution for each type of worker, the present study focuses on documenting the share of workers in jobs facing a high risk of automation (in line with the literature). Future work could adopt a broader distributional approach in a more fulsome investiga-tion of the differences in the risks faced by various types of workers.
8 Figure 2 shows shares of workers at high risk by occupation, based on two-digit NOC 2011 codes, in des-cending order of risk. Only occupations with a sample size of 50 or more are shown.

10
Figu
re 2
. Est
imat
ed sh
are
of w
orke
rs fa
cing
a h
igh
risk
of jo
b tra
nsfo
rmat
ion
due
to a
utom
atio
n, b
y oc
cupa
tion,
Can
ada,
201
6
Sour
ce: A
utho
rs’ e
stim
ates
bas
ed o
n St
atist
ics C
anad
a, L
ongi
tudi
nal a
nd In
tern
atio
nal S
tudy
of A
dults
(LIS
A), W
ave
3 (2
016)
. http
s://
ww
w.st
atca
n.gc
.ca/
eng/
surv
ey/h
ouse
-ho
ld/5
144
Not
es: H
igh
risk
is de
fined
as a
70
perc
ent o
r hig
her p
roba
bilit
y of
job
trans
form
atio
n as
a re
sult
of a
utom
atio
n. O
ccup
atio
ns a
re b
ased
on
two-
digi
t cod
es fr
om th
e N
atio
nal
Occ
upat
iona
l Cla
ssifi
catio
n 20
11. S
ome
occu
patio
ns a
re n
ot sh
own
due
to sm
all s
ampl
e siz
e.
05
1015
2025
3035
40
Prof
essio
nal o
ccup
atio
ns in
law
and
soci
al, c
omm
unity
and
gov
ernm
ent s
ervi
ces
Prof
essio
nal o
ccup
atio
ns in
edu
catio
n se
rvic
es
Spec
ializ
ed m
iddl
e-m
anag
emen
t occ
upat
ions
in a
dmin
istra
tive,
fina
ncia
l and
bus
ines
s, an
d co
mm
unic
atio
n se
rvic
es (e
xcep
t bro
adca
stin
g)
Prof
essio
nal o
ccup
atio
ns in
bus
ines
s and
fina
nce
Prof
essio
nal o
ccup
atio
ns in
nat
ural
and
app
lied
scie
nces
Reta
il sa
les s
uper
viso
rs a
nd sp
ecia
lized
sale
s sup
ervi
sors
Tech
nica
l occ
upat
ions
rela
ted
to n
atur
al a
nd a
pplie
d sc
ienc
es
Para
prof
essio
nal o
ccup
atio
ns in
lega
l, so
cial
, com
mun
ity a
nd e
duca
tion
serv
ices
Tech
nica
l occ
upat
ions
in h
ealth
Adm
inist
rativ
e an
d fin
anci
al su
perv
isors
and
adm
inist
rativ
e oc
cupa
tions
Mai
nten
ance
and
equ
ipm
ent o
pera
tion
trade
s
Serv
ice
repr
esen
tativ
es a
nd o
ther
cus
tom
er a
nd p
erso
nal s
ervi
ce o
ccup
atio
ns
Sale
s rep
rese
ntat
ives
and
sale
sper
sons
— w
hole
sale
and
reta
il tra
de
Indu
stria
l, el
ectri
cal a
nd c
onst
ruct
ion
trade
s
Serv
ice
supe
rviso
rs a
nd sp
ecia
lized
serv
ice
occu
patio
ns
Offi
ce su
ppor
t occ
upat
ions
Perc
ent
IRPP Study | June 2020
11
At the other end of the spectrum are several occupations in which few workers face a high risk of job transformation. For professional occupations in law and so-cial, community and government services; education services; and specialized middle-management occupations in administrative services, financial and business services, and communications, the share is zero. Professional occupations in busi-ness and finance (0.8 percent) and in natural and applied sciences (0.9 percent) are also at low risk.
Table A2 shows the estimated share of workers at high risk of job transformation due to automation along various dimensions (some of these are shown in figures 3 to 7 to follow). Looking at the risk with respect to gender, men and women are equally likely to face a high risk (10.7 and 10.6 percent, respectively). This finding is interesting in that women are far more likely to be in office-support occupations, which face the highest risk. Indeed, 7.8 percent of women in the analytical sample worked in those types of jobs, compared with only 0.9 percent of men. Counterbalancing this to some extent is the fact that the occupational group facing the third-highest level of risk is industrial, electrical and construction trades, which is male-dominated (4.1 percent of men in the sample worked in such occupations, compared with only 0.3 percent of women).9
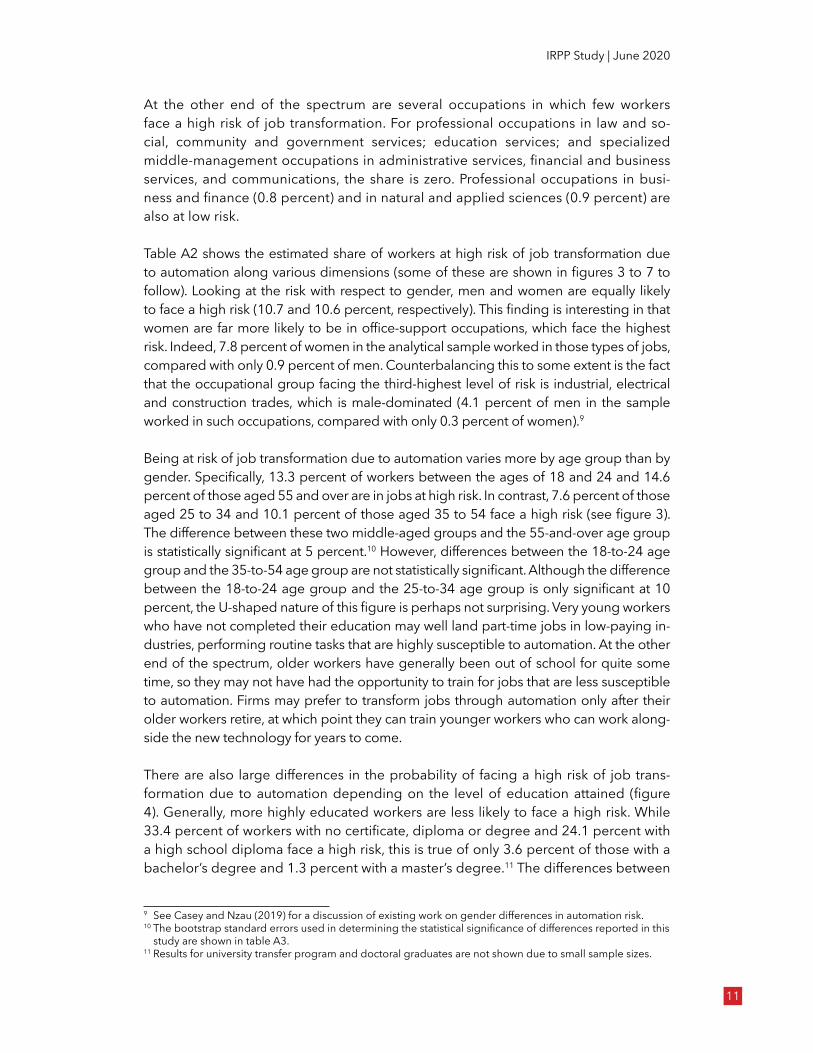
Being at risk of job transformation due to automation varies more by age group than by gender. Specifically, 13.3 percent of workers between the ages of 18 and 24 and 14.6 percent of those aged 55 and over are in jobs at high risk. In contrast, 7.6 percent of those aged 25 to 34 and 10.1 percent of those aged 35 to 54 face a high risk (see figure 3). The difference between these two middle-aged groups and the 55-and-over age group is statistically significant at 5 percent.10 However, differences between the 18-to-24 age group and the 35-to-54 age group are not statistically significant. Although the difference between the 18-to-24 age group and the 25-to-34 age group is only significant at 10 percent, the U-shaped nature of this figure is perhaps not surprising. Very young workers who have not completed their education may well land part-time jobs in low-paying in-dustries, performing routine tasks that are highly susceptible to automation. At the other end of the spectrum, older workers have generally been out of school for quite some time, so they may not have had the opportunity to train for jobs that are less susceptible to automation. Firms may prefer to transform jobs through automation only after their older workers retire, at which point they can train younger workers who can work along-side the new technology for years to come.
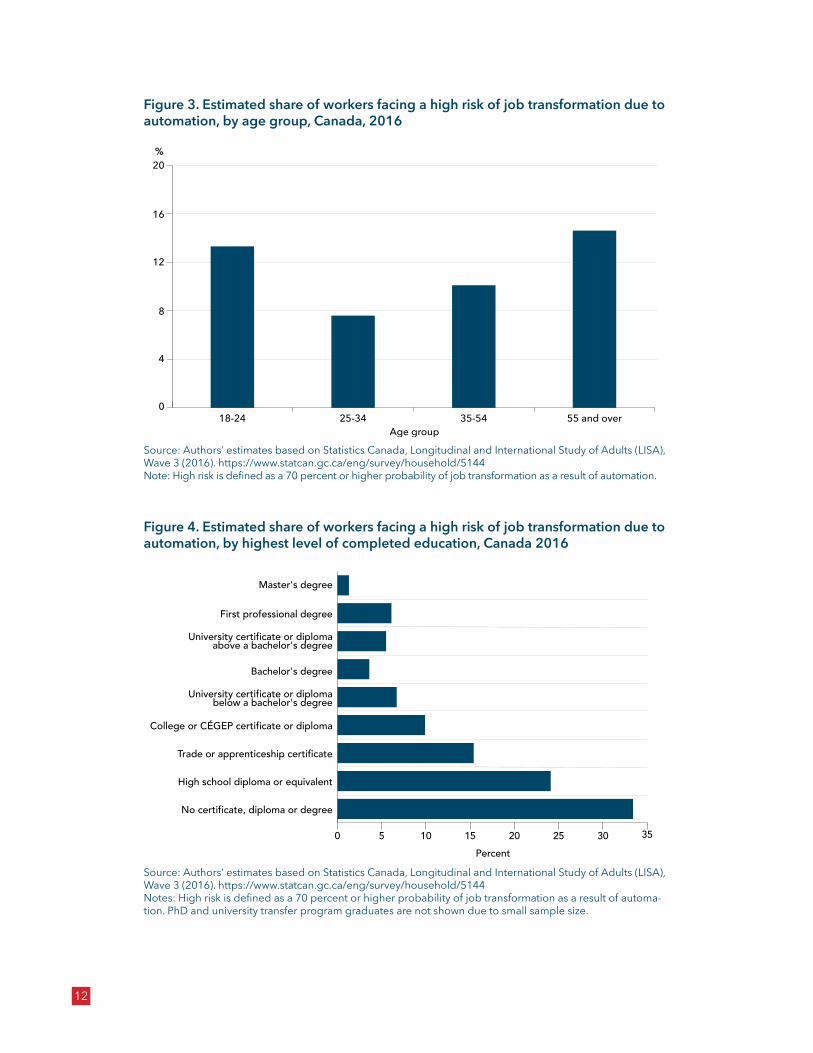
There are also large differences in the probability of facing a high risk of job trans-formation due to automation depending on the level of education attained (figure 4). Generally, more highly educated workers are less likely to face a high risk. While 33.4 percent of workers with no certificate, diploma or degree and 24.1 percent with a high school diploma face a high risk, this is true of only 3.6 percent of those with a bachelor’s degree and 1.3 percent with a master’s degree.11 The differences between
9 See Casey and Nzau (2019) for a discussion of existing work on gender differences in automation risk.10 The bootstrap standard errors used in determining the statistical significance of differences reported in this
study are shown in table A3.11 Results for university transfer program and doctoral graduates are not shown due to small sample sizes.
12
Figure 3. Estimated share of workers facing a high risk of job transformation due to automation, by age group, Canada, 2016
Source: Authors’ estimates based on Statistics Canada, Longitudinal and International Study of Adults (LISA), Wave 3 (2016). https://www.statcan.gc.ca/eng/survey/household/5144Note: High risk is defined as a 70 percent or higher probability of job transformation as a result of automation.
Age group
%
0
4
8
12
16
20
55 and over35-5425-3418-24
Figure 4. Estimated share of workers facing a high risk of job transformation due to automation, by highest level of completed education, Canada 2016
Source: Authors’ estimates based on Statistics Canada, Longitudinal and International Study of Adults (LISA), Wave 3 (2016). https://www.statcan.gc.ca/eng/survey/household/5144Notes: High risk is defined as a 70 percent or higher probability of job transformation as a result of automa-tion. PhD and university transfer program graduates are not shown due to small sample size.
0 5 10 15 20 25 30 35
No certificate, diploma or degree
High school diploma or equivalent
Trade or apprenticeship certificate
College or CÉGEP certificate or diploma
University certificate or diplomabelow a bachelor's degree
Bachelor's degree
University certificate or diplomaabove a bachelor's degree
First professional degree
Master's degree
Highest completed level
Percent

IRPP Study | June 2020
13
individuals with a high school diploma or less and those with a bachelor’s or a master’s degree are statistically significant at 0.1 percent. Highly educated workers are more likely to be employed in professional occupations such as teachers, accountants and lawyers. As we have shown, workers in these occupations face a lower risk of job trans-formation due to automation (see figure 2).
Although some results could be generated by field of study, this was limited by small sample sizes (fewer than 50 in certain cases; see table A2 in the appendix). Nevertheless, some interesting insights emerge. For example, among those with post-secondary certificates or diplomas, mathematics, computer and information sciences graduates; and personal, protective and transportation services graduates are the least likely to face a high risk of job transformation due to automation (under 7 percent). At the opposite end of the spectrum, business, management and public administration graduates; and graduates in health and related fields are the most likely to face a high risk (over 12 percent).
Among workers with a post-secondary degree,12 those least likely to be at high risk are graduates of education (1 percent); health and related fields (1.8 percent); and business, management and public administration (2.2 percent). Graduates of physical and life sciences and technologies (4.7 percent) and the humanities (4.6 percent) are the most likely to be at high risk. Note, however, that graduates from every discipline that could be examined at the post-secondary level face a lower risk than average.
Another interesting finding is that graduates in business, management and public admin-istration and those in health and related fields face the highest risk if they hold a post-sec-ondary certificate or a diploma but the lowest risk if they hold a post-secondary degree. This might reflect differences in the share who land jobs related to their education. It could also reflect differences in the types of jobs that are related to the programs. For example, college business programs include office administration. This is part of the office-sup-port-occupations category, which ranks highest in automation risk (see figure 2).13
Literacy and numeracy are also important factors in the risk of job transformation due to automation.14 Since both are so highly correlated with the level of educational attainment,
12 Note that the vast majority of post-secondary degree holders obtained their credentials from a university rather than a college bachelor’s degree program (Frenette 2019).
13 Due to sample size limitations, it is not possible to examine the risk of automation for most detailed categories of occupations. However, it is possible to do so using the automatability index created by Frey and Osborne (2013). While this index is not adjusted for a broad range of tasks, it is calculated for a large set of very specific occupations (702 in total), given that it is constructed from the relatively large Quarterly Census of Employment and Wages. The index suggests that many occupations associated with college business programs, such as office administration, bookkeeping and financial service sales, face a very high risk of automation. Colleges also offer several health-related programs that face an above-average risk according to the index. These include veterinary assistant, dental hygienist and dental assistant.
14 Note that a subsample of the respondents to the PIAAC was selected to participate in the LISA. Therefore, their scores in literacy and numeracy tests that were assessed by the PIAAC are also available in the LISA data set. For both measures, the maximum score was 500. From these scores, individuals are given a pro-ficiency level, ranging from five to less than one. In the analysis to follow, individuals are grouped into two categories: those with a proficiency level of three or above (corresponding to a score of 276 or above) and those with a proficiency level below three.

The Demographics of Automation in Canada: Who Is at Risk?
14
the risk is reported by level of education (table A3). For all three educational levels (no post-secondary qualifications, post-secondary certificate or diploma and post-secondary degree), those with a literacy or numeracy proficiency level of three or above (out of a maximum level of five) are considerably less likely to face a high risk of job transformation due to automation than those with lower proficiency levels, although the results are not always statistically significant. Specifically, higher levels of numeracy are associated with a lower risk among holders of a post-secondary certificate, diploma or degree, and higher levels of literacy are associated with a lower risk among those with no post-secondary credentials and those with a post-secondary certificate or diploma.
The probability of job transformation is reported in table A3 by immigration status, disability status and union membership (or coverage by a collective bargaining agree-ment). The differences in the share of workers at high risk between these categories are small and are not statistically significant at the 10 percent level.
The other work-related characteristics shown in table A3 reveal some interesting dif-ferences. For example, 25.7 percent of part-time workers face a high risk of job trans-formation due to automation, compared with only 8.7 percent among full-time work-ers. The difference is significant at the 0.1 percent level.
Workers facing a high automation risk are more likely to earn low employment in-come. Over one-quarter (26.8 percent) of those in the bottom 10 percent of the
Figure 5. Estimated share of workers facing a high risk of job transformation due to automation, by percentile of employment income, Canada, 2016
Source: Authors’ estimates based on Statistics Canada, Longitudinal and International Study of Adults (LISA), Wave 3 (2016). https://www.statcan.gc.ca/eng/survey/household/5144Note: High risk is defined as a 70 percent or higher probability of job transformation as a result of automation.
%
0
6
12
18
24
30
90th or above 75th to below 90th
50th to below 75th
25th to below 50th
10th to below 25th
Below 10th
Percentile
IRPP Study | June 2020
15
income distribution face a high risk. In contrast, only 2.1 percent of workers in the top 10 percent of the income distribution face a high risk. In fact, as employment income increases, the probability of facing a high risk of job transformation due to automation systematically decreases (figure 5). All differences between those in the bottom 10 percent of the distribution and the other groups are statistically signifi-cant at the 1 percent level, except for those in the second bottom group (between the 10th and 25th percentiles of the distribution). In that case, the difference is sta-tistically significant at the 5 percent level.
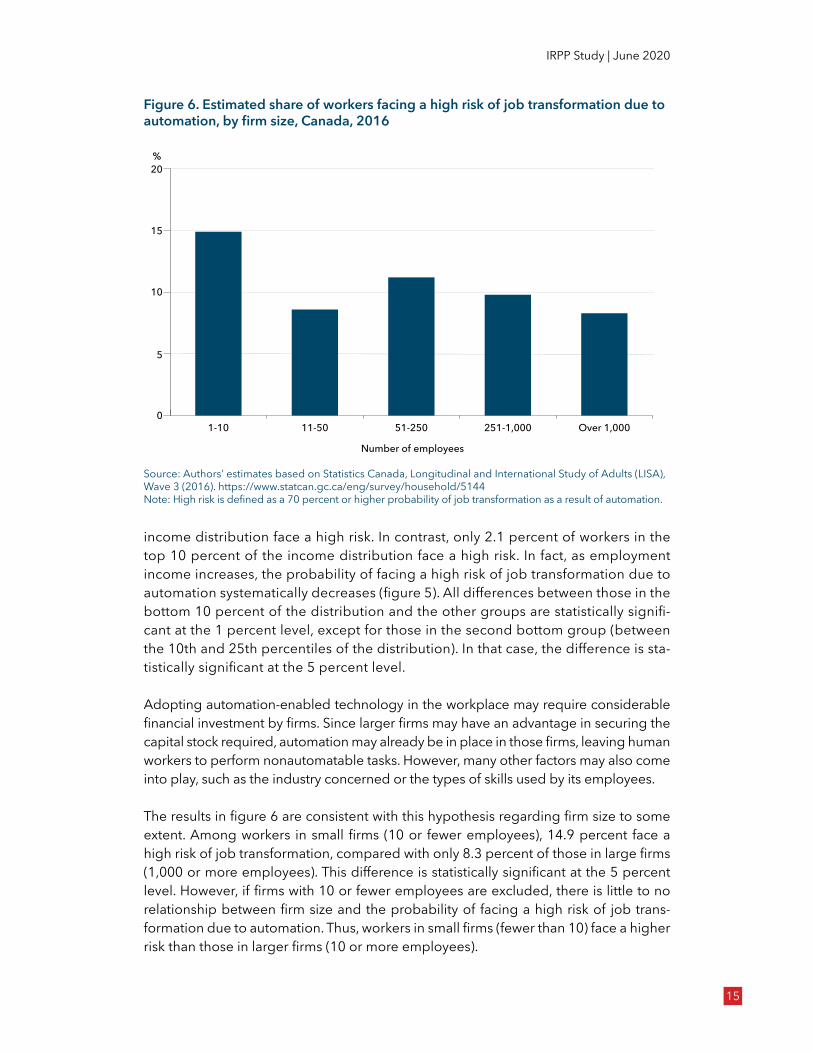
Adopting automation-enabled technology in the workplace may require considerable financial investment by firms. Since larger firms may have an advantage in securing the capital stock required, automation may already be in place in those firms, leaving human workers to perform nonautomatable tasks. However, many other factors may also come into play, such as the industry concerned or the types of skills used by its employees.
The results in figure 6 are consistent with this hypothesis regarding firm size to some extent. Among workers in small firms (10 or fewer employees), 14.9 percent face a high risk of job transformation, compared with only 8.3 percent of those in large firms (1,000 or more employees). This difference is statistically significant at the 5 percent level. However, if firms with 10 or fewer employees are excluded, there is little to no relationship between firm size and the probability of facing a high risk of job trans-formation due to automation. Thus, workers in small firms (fewer than 10) face a higher risk than those in larger firms (10 or more employees).
Figure 6. Estimated share of workers facing a high risk of job transformation due to automation, by firm size, Canada, 2016
Source: Authors’ estimates based on Statistics Canada, Longitudinal and International Study of Adults (LISA), Wave 3 (2016). https://www.statcan.gc.ca/eng/survey/household/5144Note: High risk is defined as a 70 percent or higher probability of job transformation as a result of automation.
%
0
5
10
15
20
Over 1,000251-1,00051-25011-501-10
Number of employees

The Demographics of Automation in Canada: Who Is at Risk?
16
The differences in the share of workers in various industries facing a high risk of job transformation are also considerable (figure 7). For example, 26.6 percent of manu-facturing workers face a high risk, making them the most exposed to automation risk. This is considerably more than the share of workers at risk in all other industries and is statistically significant at the 5 percent level. The next highest proportion of workers at risk is in accommodation and food services at 15.4 percent (which is significantly different from that in manufacturing at the 10 percent level). At the opposite end of the spectrum are several sectors in which fewer than 5 percent of workers face a high risk of job transformation. These are information and cultural industries (2.8 percent); public administration (3.7 percent); educational services (4.2 percent); and finance and insurance, real estate and rental (4.8 percent).
CONCLUSION
New technologies have the potential to affect industries and jobs that were thought to be immune to automation. This has led some observers to predict these technolo-gies will have a greater negative impact on workers than previously experienced. The early forms of robotization disproportionately affected low- and middle-skill workers by taking over routine physical tasks. But new algorithms are expected to have an impact on high-skill professionals like radiologists and lawyers by automating fairly complex cognitive tasks. Moreover, new technologies may affect some workers more
Figure 7. Estimated share of workers facing a high risk of job transformation due to automation, by industry, Canada, 2016
Source: Authors’ estimates based on Statistics Canada, Longitudinal and International Study of Adults (LISA), Wave 3 (2016). https://www.statcan.gc.ca/eng/survey/household/5144Note: High risk is defined as a 70 percent or higher probability of job transformation as a result of automation.
0 5 10 15 20 25 30
Information and cultural industries
Public administration
Educational services
Finance and insurance, real estateand rental
Other services
Professional, scientific and technical services
Construction
Health care and social assistance
Wholesale and retail trade
Transportation and warehousing
Accomodation and food services
Manufacturing
Percent
IRPP Study | June 2020
17
than others if they transform occupations predominantly held by a particular demo-graphic group, such as truck drivers who are mostly men.
While extensive research has estimated the number and types of jobs that could be affected by new technological advances, little is known about the workers who hold these jobs. Understanding who is at risk can shed more light on the nature of antici-pated labour market transformations and help inform policy development. So, who are the workers more at risk this time around and are some groups of workers more at risk than others?
The goal of this study was to identify the characteristics of Canadian workers facing a high risk of job transformation due to automation. We used an approach similar to the one developed by Frey and Osborne (2013) and refined by Arntz, Gregory and Zierahn (2016). Using 2016 data (the most recent Canadian data available), we find that 10.6 percent of Canadian workers face a high risk of job transformation due to automation (a probability of 70 percent or higher), with another 29.1 percent facing a moderate risk (a probability of 50 to 70 percent). The groups most at risk of job trans-formation include older workers (aged 55 and over), those with no post-secondary education, those with low literacy or numeracy proficiency and those earning a low income. By and large, these are the same groups that are vulnerable to unfavourable labour market conditions and are the focus of targeted labour market policies. Other workers who are more exposed to a high risk are those employed part time and those working in small firms and in the manufacturing sector. We find no significant differ-ences in the risk of job transformation on the basis of gender, immigration status, having a disability or being unionized.
When interpreting these findings, it is important to keep in mind that the automation risk estimates reported in this study represent the overall, or unconditional, risk faced by workers with varying characteristics. Therefore, workers’ characteristics associat-ed with high risk should not be interpreted as risk factors. To illustrate, our research showed that part-time workers are more likely to be at a high risk of job transforma-tion than full-time workers. But having part-time work is not necessarily a risk factor in itself, because the risk may be due to workers’ ages or education. While this study has taken a first look at the demographic characteristics of workers at risk, explaining these group differences would be a worthwhile avenue for future research.
Moreover, since the estimates of risk of job transformation we have presented are based solely on the technical feasibility of adoption, it is far from clear how our re-sults relate to the risk of job loss. While some jobs may be fully automatable from a technical point of view, firms could still face financial, legal or societal constraints that might slow the adoption of new technologies and thus limit job loss. The COVID-19 pandemic could have the opposite effect. Some businesses may respond by investing more heavily in new technologies in an effort to reduce the reliance on human work-ers in case of future pandemics. A useful next step for research would be to estimate the extent to which workers classified as being at risk of job transformation were subsequently displaced from their jobs.

The Demographics of Automation in Canada: Who Is at Risk?
18
Finally, as they have in the past, new technologies also generate new employment opportunities, both by creating new jobs and by modifying existing ones. These new opportunities may mitigate any negative effects of automation. Further re-search is needed to investigate the role played by advances in artificial intelligence and other new technologies in creating new occupations, shifting the task compos-itions of existing occupations and changing the nature of tasks performed by work-ers. Such research would also help inform policy development related to labour market adjustment.
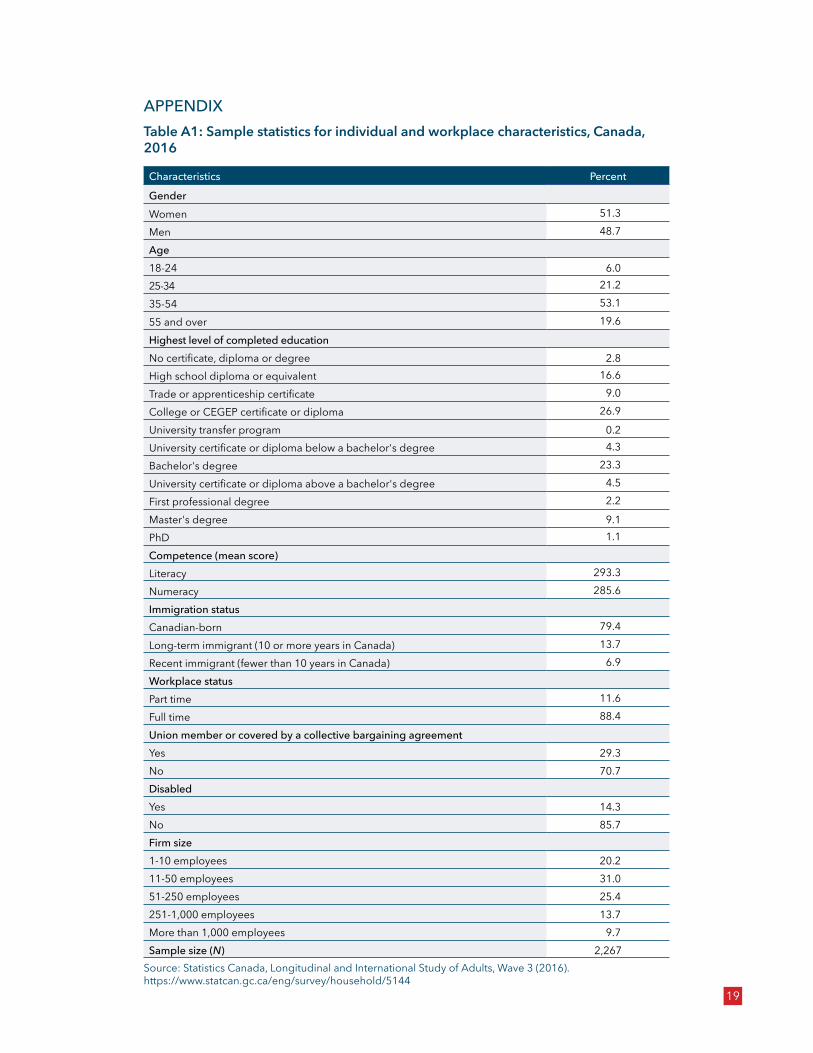
19
APPENDIXTable A1: Sample statistics for individual and workplace characteristics, Canada, 2016
Source: Statistics Canada, Longitudinal and International Study of Adults, Wave 3 (2016). https://www.statcan.gc.ca/eng/survey/household/5144
Characteristics Percent
Gender Women 51.3
Men 48.7
Age18-24 6.025-34 21.2
35-54 53.1
55 and over 19.6
Highest level of completed education No certificate, diploma or degree 2.8High school diploma or equivalent 16.6
Trade or apprenticeship certificate 9.0
College or CEGEP certificate or diploma 26.9
University transfer program 0.2University certificate or diploma below a bachelor's degree 4.3
Bachelor's degree 23.3
University certificate or diploma above a bachelor's degree 4.5
First professional degree 2.2
Master's degree 9.1PhD 1.1
Competence (mean score)Literacy 293.3
Numeracy 285.6
Immigration statusCanadian-born 79.4
Long-term immigrant (10 or more years in Canada) 13.7
Recent immigrant (fewer than 10 years in Canada) 6.9
Workplace statusPart time 11.6
Full time 88.4
Union member or covered by a collective bargaining agreement Yes 29.3No 70.7Disabled Yes 14.3No 85.7Firm size 1-10 employees 20.211-50 employees 31.051-250 employees 25.4251-1,000 employees 13.7More than 1,000 employees 9.7Sample size (N) 2,267

20
Table A2: Estimated share of workers facing a high risk of job transformation due to automation, by occupation, Canada, 2016
Source: Authors’ estimates based on Statistics Canada, Longitudinal and International Study of Adults (LISA), Wave 3 (2016). https://www.statcan.gc.ca/eng/survey/household/5144Notes: Standard errors were obtained using bootstrapping, a computational resampling technique. High risk is defined as a 70 percent or higher probability of job transformation due to automation.
Occupation Percent Standard errorOffice-support occupations 35.7 6.1Service supervisors and specialized service occupations 20.0 7.8Industrial, electrical and construction trades 19.7 7.9Sales representatives and salespersons — wholesale and retail trade 14.7 4.1Service representatives and other customer and personal service occupations 13.7 4.1
Maintenance and equipment operation trades 13.2 4.8Administrative and financial supervisors and administrative occupations 11.3 2.6
Technical occupations in health 8.2 3.4Paraprofessional occupations in legal, social, community and edu-cation services 6.4 3.2
Technical occupations related to natural and applied sciences 4.4 2.0Retail sales supervisors and specialized sales supervisors 1.8 1.3Professional occupations in natural and applied sciences 0.9 0.9Professional occupations in business and finance 0.8 0.7Specialized middle-management occupations in administrative, financial, business, and communication services (except broadcasting) 0.0 0.0
Professional occupations in education services 0.0 0.0Professional occupations in law and social, community and government services 0.0 0.0

21
Table A3: Estimated share of workers facing a high risk of job transformation due to automation, selected characteristics, Canada, 2016
Individual or workplace characteristic Percent Standard errorSex Male 10.7 1.2Female 10.6 1.1Age 18-24 13.3 2.925-34 7.6 1.435-54 10.1 1.155 and over 14.6 2.0Highest level of completed education No certificate, diploma or degree 33.4 7.5High school diploma or equivalent 24.1 2.9Trade or apprenticeship certificate 15.4 2.7College or CEGEP certificate or diploma 9.9 1.5University transfer program — —University certificate or diploma below a bachelor's degree 6.7 2.6Bachelor's degree 3.6 0.7University certificate or diploma above a bachelor's degree 5.5 3.3First professional degree 6.1 3.5Master's degree 1.3 1.0PhD — —Field of study (post-secondary certificate or diploma holders) Personal improvement — —Education — —Visual and performing arts, and communications technologies — —Humanities — —Social and behavioural sciences and law 10.0 4.3Business, management and public administration 13.2 2.6Physical and life sciences and technologies — —Mathematics, computer and information sciences 3.1 2.0Architecture, engineering, and related technologies 9.6 2.1Agriculture, natural resources and conservation — —Health and related fields 12.9 4.4Personal, protective and transportation services 6.6 3.0Other/not stated — —Field of study (post-secondary-degree holders) Personal improvement — —Education 1.0 0.8Visual and performing arts, and communications technologies — —Humanities 4.6 2.2Social and behavioural sciences and law 3.9 1.6Business, management and public administration 2.2 1.0Physical and life sciences and technologies 4.7 2.6Mathematics, computer and information sciences — —
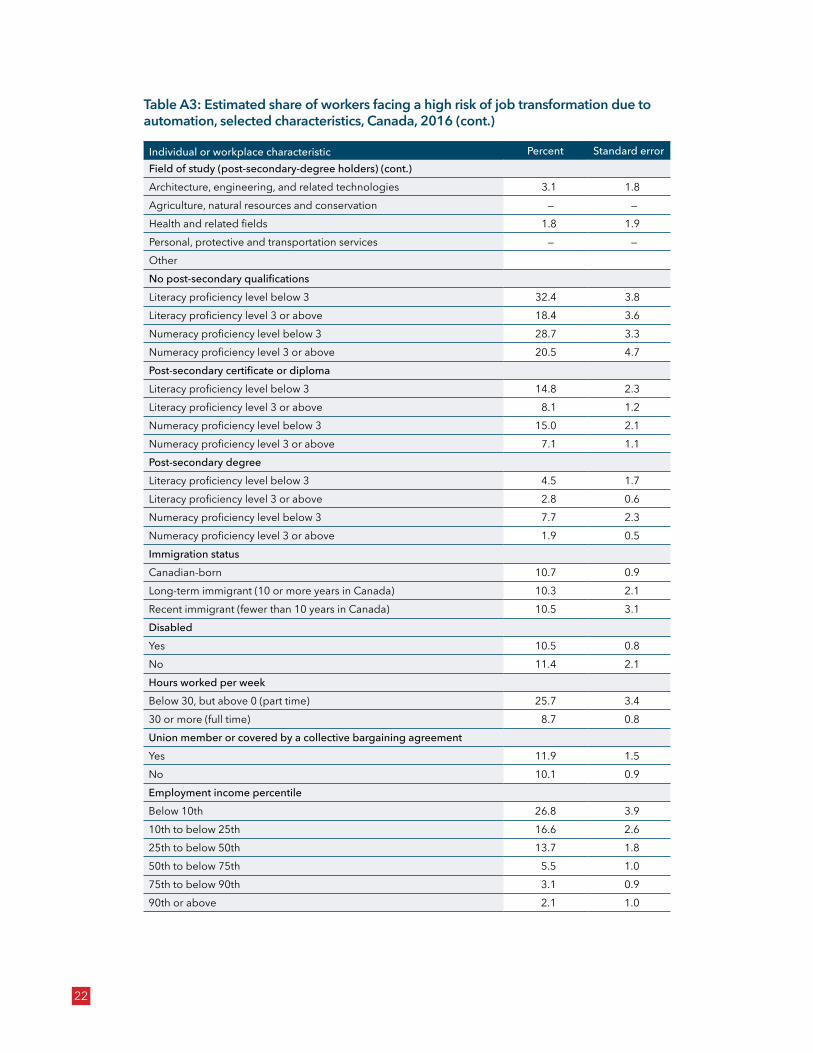
22
Table A3: Estimated share of workers facing a high risk of job transformation due to automation, selected characteristics, Canada, 2016 (cont.)
Individual or workplace characteristic Percent Standard errorField of study (post-secondary-degree holders) (cont.)Architecture, engineering, and related technologies 3.1 1.8Agriculture, natural resources and conservation — —Health and related fields 1.8 1.9Personal, protective and transportation services — —Other No post-secondary qualifications Literacy proficiency level below 3 32.4 3.8Literacy proficiency level 3 or above 18.4 3.6Numeracy proficiency level below 3 28.7 3.3Numeracy proficiency level 3 or above 20.5 4.7Post-secondary certificate or diploma Literacy proficiency level below 3 14.8 2.3Literacy proficiency level 3 or above 8.1 1.2Numeracy proficiency level below 3 15.0 2.1Numeracy proficiency level 3 or above 7.1 1.1Post-secondary degree Literacy proficiency level below 3 4.5 1.7Literacy proficiency level 3 or above 2.8 0.6Numeracy proficiency level below 3 7.7 2.3Numeracy proficiency level 3 or above 1.9 0.5Immigration status Canadian-born 10.7 0.9Long-term immigrant (10 or more years in Canada) 10.3 2.1Recent immigrant (fewer than 10 years in Canada) 10.5 3.1Disabled Yes 10.5 0.8No 11.4 2.1Hours worked per week Below 30, but above 0 (part time) 25.7 3.430 or more (full time) 8.7 0.8Union member or covered by a collective bargaining agreement Yes 11.9 1.5No 10.1 0.9Employment income percentile Below 10th 26.8 3.910th to below 25th 16.6 2.625th to below 50th 13.7 1.850th to below 75th 5.5 1.075th to below 90th 3.1 0.990th or above 2.1 1.0
23
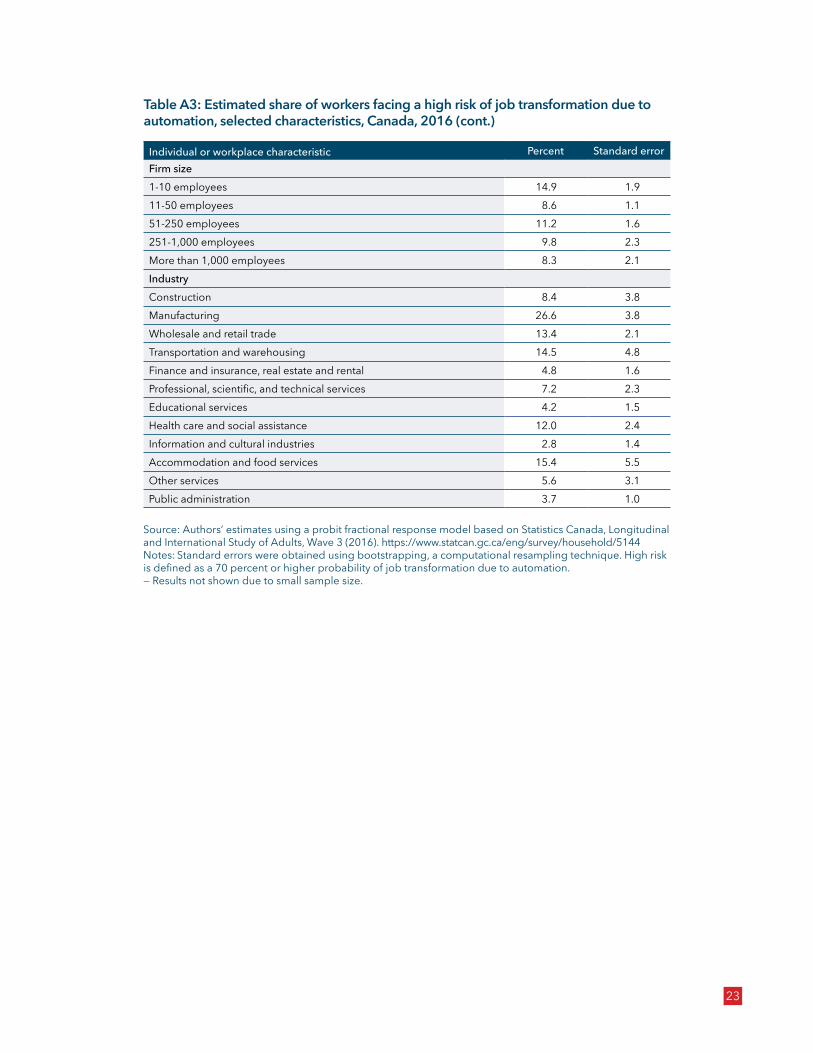
Table A3: Estimated share of workers facing a high risk of job transformation due to automation, selected characteristics, Canada, 2016 (cont.)
Individual or workplace characteristic Percent Standard errorFirm size 1-10 employees 14.9 1.911-50 employees 8.6 1.151-250 employees 11.2 1.6251-1,000 employees 9.8 2.3More than 1,000 employees 8.3 2.1Industry Construction 8.4 3.8Manufacturing 26.6 3.8Wholesale and retail trade 13.4 2.1Transportation and warehousing 14.5 4.8Finance and insurance, real estate and rental 4.8 1.6Professional, scientific, and technical services 7.2 2.3Educational services 4.2 1.5Health care and social assistance 12.0 2.4Information and cultural industries 2.8 1.4Accommodation and food services 15.4 5.5Other services 5.6 3.1Public administration 3.7 1.0
Source: Authors’ estimates using a probit fractional response model based on Statistics Canada, Longitudinal and International Study of Adults, Wave 3 (2016). https://www.statcan.gc.ca/eng/survey/household/5144Notes: Standard errors were obtained using bootstrapping, a computational resampling technique. High risk is defined as a 70 percent or higher probability of job transformation due to automation.— Results not shown due to small sample size.
The Demographics of Automation in Canada: Who Is at Risk?
24
REFERENCES
Arntz, M., T. Gregory, and U. Zierahn. 2016. The Risk of Automation for Jobs in OECD countries: A Comparative Analysis. OECD Social, Employment and Migration Working Paper 189. Paris: OECD Publishing. https://doi.org/10.1787/5jlz9h56dvq7-en
Autor, D., H. Levy, and R. Murnane. 2003. “The Skill Content of Recent Technological Change: An Empirical Exploration.” The Quarterly Journal of Economics. 118 (4): 1279-1333. https://eco-nomics.mit.edu/files/11574
Casey, M., and S. Nzau, The Differing Impact of Automation on Men and Women’s Work. Brook-ings Up Front (Washington: Brookings Institution, 2019), https://www.brookings.edu/blog/up-front/2019/09/11/the-differing-impact-of-automation-on-men-and-womens-work/
Frenette, M. 2019. Obtaining a Bachelor’s Degree from a College: Earnings Outlook and Pros-pects for Graduate Studies. Analytical Studies Branch Research Paper 428. Ottawa: Statistics Canada. https://www150.statcan.gc.ca/n1/pub/11f0019m/11f0019m2019016-eng.htm
Frenette, M., and K. Frank. 2020. Automation and Job Transformation in Canada: Who’s at Risk? Analytical Studies Branch Research Paper Series. Catalogue no. 11F0019M no. 448. Ottawa: Statistics Canada.
Frey, C.B., and M.A. Osborne. 2013. “The Future of Employment: How Susceptible are Jobs to Com-puterisation?” Working paper, Oxford Martin School at the University of Oxford, September 17. https://www.oxfordmartin.ox.ac.uk/downloads/academic/future-of-employment.pdf
Graetz, G., and G. Michaels. 2018. “Robots at Work.” The Review of Economics and Statistics. 100 (5): 753-68. https://www.mitpressjournals.org/doi/pdf/10.1162/rest_a_00754
Lamb, C., 2016. “The Talented Mr. Robot.” Toronto: Brookfield Institute. https://brookfieldinsti-tute.ca/report/the-talented-mr-robot/
Manyika, J., M. Chui, M. Miremadi, et al. 2017. “A Future that Works: Automation, Employment, and Productivity.” McKinsey Global Institute. https://www.mckinsey.com/~/media/mckinsey/featured%20insights/Digital%20Disruption/Harnessing%20automation%20for%20a%20fu-ture%20that%20works/MGI-A-future-that-works-Full-report.ashx
Morissette, R., and T. H. Qiu. 2020. "Turbulence or Steady Course? Permanent Layoffs in Canada, 1978-2016." IRPP Study 76. Montreal: Institute for Research on Public Policy.
Morissette, R., and T. H. Qiu. Forthcoming. “Workers’ Responses to Job Loss: Evidence from Canada.” Montreal: Institute for Research on Public Policy.
Oschinski, M., and R. Wyonch. 2017. Future Shock? The Impact of Automation on Canada’s Labour Market. C.D. Howe Commentary 472. (Toronto: C.D. Howe Institute, 2017). https://www.cdhowe.org/sites/default/files/attachments/research_papers/mixed/Update_Commen-tary%20472%20web.pdf


Copyright belongs to the IRPP.To order or request permission to reprint, contact:
IRPP1470 Peel Street, Suite 200Montreal, Quebec H3A 1T1Telephone: 514-985-2461 Fax: 514-985-2559 [email protected]
Founded in 1972, the Institute for Research on Public Policy is an independent, national, bilingual, not-for-profit organization. The IRPP seeks to improve public policy in Canada by generating research, providing insight and informing debate on current and emerg-ing policy issues facing Canadians and their governments.
The Institute’s independence is assured by an endowment fund, to which federal and provincial governments and the private sector contributed in the early 1970s.
Fondé en 1972, l’Institut de recherche en politiques publiques est un organisme cana-dien indépendant, bilingue et sans but lucratif. Sa mission consiste à améliorer les poli-tiques publiques en produisant des recherches, en proposant de nouvelles idées et en éclairant les débats sur les grands enjeux publics auxquels font face les Canadiens et leurs gouvernements.
L’indépendance de l’Institut est assurée par un fonds de dotation établi au début des années 1970 grâce aux contributions des gouvernements fédéral et provinciaux ainsi que du secteur privé.


