THE DETERMINANTS OF BANK’S EFFICIENCY IN INDONESIA Astoeti Wahjoe Widiarti 1 Hermanto Siregar 2 Trias Andati This paper measures the efficiency of the banks using the intermediation approach and the Data Envelopment Analysis (DEA) on quarterly data of 108 conventional banks in Indonesia during the period of 2012Q1 to 2014Q4. The results shows that the Indonesian banking industry is inefficient in its intermediation function, which is in line with their financial indicators namely the total increasing asset, stable ROA of around 2-3%, and their Operating to Income Cost ratio of about 66-83%. Furthermore, we apply data panel estimation to estimate the determinant of this efficiency; the result shows the bank’s type, the Non-Performing Loan (NPL), the Loan to Deposit Ratio (LDR), the size of the bank, the Cost Efficiency Ratio (CER), and the Capital Adequacy Ratio (CAR); significantly affect the bank’s efficiency in Indonesia Abstract Keywords: Banking, efficiency, panel estimation, Indonesia. JEL Classification: G21, C23, D24 1 Astoeti Wahjoe Widiarti (corresponding author, [email protected]) is a researcher on Bank Indonesia; currently is assigned in OJK, and also graduate from Program Pascasarjana Manajemen dan Bisnis Institut Pertanian Bogor. The views on this paper are solely of the authors, and do not necessarily represent the views of Bank Indonesia or OJK. 2 Hermanto Siregar ([email protected]) and Trias Andati ([email protected]) are lecturers at Program Pascasarjana Manajemen dan Bisnis IPB.
Transcript
121The Determinants of Bank’s Efficiency In Indonesia
The DeTerminanTs of BanK’s efficiency in inDonesia
Astoeti Wahjoe Widiarti1
Hermanto Siregar2
Trias Andati
This paper measures the efficiency of the banks using the intermediation approach and the
Data Envelopment Analysis (DEA) on quarterly data of 108 conventional banks in Indonesia during the
period of 2012Q1 to 2014Q4. The results shows that the Indonesian banking industry is inefficient in its
intermediation function, which is in line with their financial indicators namely the total increasing asset,
stable ROA of around 2-3%, and their Operating to Income Cost ratio of about 66-83%. Furthermore, we
apply data panel estimation to estimate the determinant of this efficiency; the result shows the bank’s type,
the Non-Performing Loan (NPL), the Loan to Deposit Ratio (LDR), the size of the bank, the Cost Efficiency
Ratio (CER), and the Capital Adequacy Ratio (CAR); significantly affect the bank’s efficiency in Indonesia
abstract
Keywords: Banking, efficiency, panel estimation, Indonesia.
JEL Classification: G21, C23, D24
1 Astoeti Wahjoe Widiarti (corresponding author, [email protected]) is a researcher on Bank Indonesia; currently is assigned in OJK, and also graduate from Program Pascasarjana Manajemen dan Bisnis Institut Pertanian Bogor. The views on this paper are solely of the authors, and do not necessarily represent the views of Bank Indonesia or OJK.
2 Hermanto Siregar ([email protected]) and Trias Andati ([email protected]) are lecturers at Program Pascasarjana Manajemen dan Bisnis IPB.
122 Bulletin of Monetary, Economics and Banking, Volume 18, Number 2, October 2015
I. INTRODUCTION
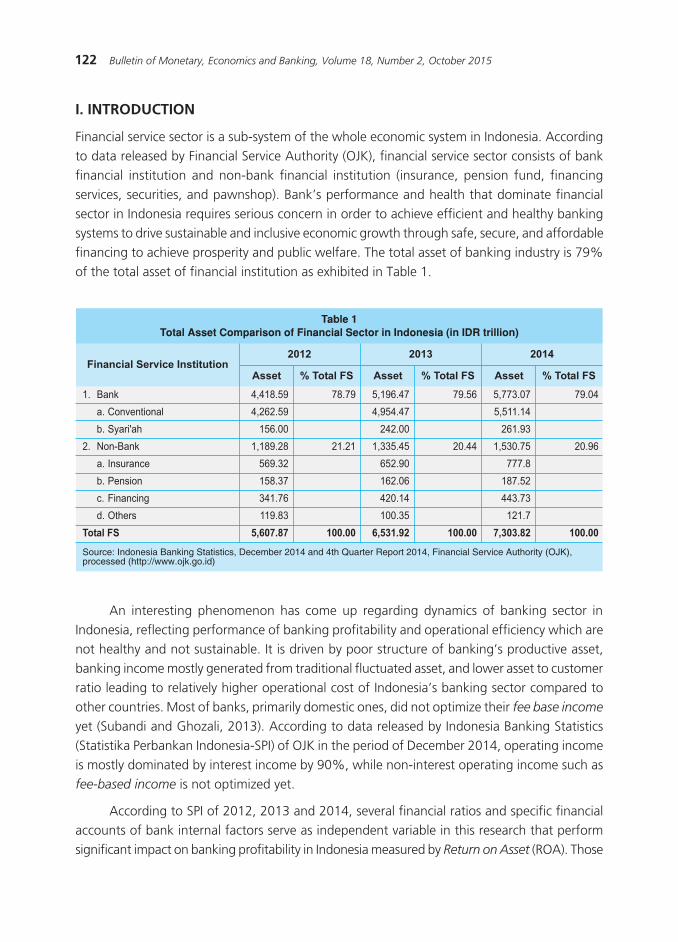
Financial service sector is a sub-system of the whole economic system in Indonesia. According to data released by Financial Service Authority (OJK), financial service sector consists of bank financial institution and non-bank financial institution (insurance, pension fund, financing services, securities, and pawnshop). Bank’s performance and health that dominate financial sector in Indonesia requires serious concern in order to achieve efficient and healthy banking systems to drive sustainable and inclusive economic growth through safe, secure, and affordable financing to achieve prosperity and public welfare. The total asset of banking industry is 79% of the total asset of financial institution as exhibited in Table 1.
An interesting phenomenon has come up regarding dynamics of banking sector in Indonesia, reflecting performance of banking profitability and operational efficiency which are not healthy and not sustainable. It is driven by poor structure of banking’s productive asset, banking income mostly generated from traditional fluctuated asset, and lower asset to customer ratio leading to relatively higher operational cost of Indonesia’s banking sector compared to other countries. Most of banks, primarily domestic ones, did not optimize their fee base income
yet (Subandi and Ghozali, 2013). According to data released by Indonesia Banking Statistics (Statistika Perbankan Indonesia-SPI) of OJK in the period of December 2014, operating income is mostly dominated by interest income by 90%, while non-interest operating income such as fee-based income is not optimized yet.
According to SPI of 2012, 2013 and 2014, several financial ratios and specific financial accounts of bank internal factors serve as independent variable in this research that perform significant impact on banking profitability in Indonesia measured by Return on Asset (ROA). Those
123The Determinants of Bank’s Efficiency In Indonesia
independent variables are Total Asset (Size), credit risk represented by Non-Performing Loan (NPL), required reserve represented by Capital Adequacy Ratio (CAR), liquidity represented by Loan to Deposit Ratio (LDR), income represented by Net Interest Margin (NIM), and operational cost to operational income ratio (BOPO). Composition of deposits or third party’s fund (Dana Pihak Ketiga-DEP) is exhibited in the following Table 2.
As exhibited in the above Table 2, it is seen that during the period of 2012 – 2014 State-owned Banks with the above 5% NIM, the above Rp. 1,500 trillion total asset, and BOPO by 70% have generated ROA by average 3.8%, while Foreign Banks with the only 3% NIM, total asset by Rp. 300 trillion, and BOPO by 80% have generated ROA by 3%. It indicates that Foreign Banks, with lower NIM and total asset compared to State-owned Banks, are able to generate almost the same level of ROA by 3%, compared to State-owned Banks by 3.8%. Indonesia’s banking NIM is relatively higher by 5.43% compared to other countries such as Philippines by 3.3%, Thailand by 2.6%, and Malaysia by 2.3%, and Singapore by 1.5%.
124 Bulletin of Monetary, Economics and Banking, Volume 18, Number 2, October 2015
The largest banking financing source comes from third party’s fund (Dana Pihak Ketiga - DPK) besides long-term financing source through the issuance of bonds and Medium Term
Note (MTN), supports in terms of capital (investment) from parent companies or foreign loan, and subordination loan mainly for foreign banks branch offices and mixed-banks (foreign and domestic private). The portion of deposits in DPK is the largest as interest rate offered is relatively higher than savings and time deposit. Deposits structure with the higher cost of interest significantly affects banking rentability (Banking Industry Profile Report Quarter II/2014, OJK)
Some of banks financial performance ratios shown in Table 2 are just part of financial performance assessment to support the analysis of the Bank’s Health Level (Tingkat Kesehatan Bank – TKS). Bank’s TKS has to be well-maintained or even to be continuously improved in order to keep public confidence on banks. Besides, Bank’s TKS is used as one of evaluation tools to overcome weaknesses and obstacles faced by banks, both in the form of corrective
actions by banks and supervisory actions by financial service authority (OJK). TKS is the output evaluation on banking risks and performance. Banks are mandated to maintain and/or improve the TKS by implementing the principle of prudent banking and risk management in running business activities. The coverage of TKS assessment includes risk profile factor (risk profile); Good
Corporate Governance (GCG); rentability (earnings); and capital. Banks with Composite Level 1 (Peringkat Komposit 1 – PK-1) reflects healthy banking condition in general so that they are considered to be able to face any negative and significant impacts from business dynamics and other external factors. Meanwhile banks with Composite Level 5 (PK-5) reflects banks’ condition which is considered not healthy so that they are assumed incapable of encountering negative impacts from changes of business dynamics and other external factors (Bank Indonesia Regulation No.13/1/PBI/2011 dated 5 January 2011 on Conventional Bank Health Assessment).
Efficiency is one of the important indicators to analyze a bank’s performance and also serves as the tool to improve the effectiveness of monetary policy. The ability to generate optimal output from the existing input is actually the expected performance from bank’s operation. When it is conducted efficiency measurement, bank is challenged to maximize output using the existing input, or to gain minimum input from certain level of output. By identifying input and output allocation, it can be further analyzed the trigger of inefficiency (Mansyur, 2012). Technical measurement of efficiency is limited to the technical and operational relationship during the process of converting input to be output. Berger and Humphrey (1997) argued that intermediation approach is the most appropriate one to evaluate performance of financial institutions in general since their characteristics as financial intermediation.
A number of prior researches about determinant of efficiency and its impact on profitability of banking industry have been conducted in several countries. A research about banking industry in Tunisia employing factors of overhead cost to total asset ratio, capital to total asset ratio, banks loan to total asset ratio, idle asset to total asset ratio (size), and macroeconomic factors such as inflation, interest rate, and GDP per capita argued that banks
125The Determinants of Bank’s Efficiency In Indonesia
with higher capital and NIM had positive and significant impact on profitability while macro indicators such as inflation and FDP per capita growth did not have significant impact on interest rate margin and profitability (Naceur, 2003).
Research about banking industry in Malaysia of Omar et al. (2006) observed productivity of Syari’ah banking industry using non-parametric Data Envelopment Analysis (DEA). The research does not that matter in improving bank’s efficiency. Nevertheless improvement from the technical aspects through technology utilization supported by employees’ knowledge and skills, it will drive more rapid growth of productivity. Syari’ah banks are considered to be less-efficient compared to commercial conventional banks. Furthermore Muda et al. (2013) observed determinants of profitability between domestic Syari’ah banks and foreign banks using DEA approach. It is concluded that determinants of domestic bank profitability are different from foreign banks. Significant factors for domestic banks are not relevant to foreign banks (they may be insignificant to foreign banks). Overhead cost ratio, loan ratio, technical efficiency, GDP growth rate, and bank’s size have significant effect on determining the level of domestic bank’s profitability while these factors are not significant on foreign banks. Sok-Gee (2011) argued that his research on banking industry in China using DEA approach concluded that foreign commercial banks are relatively more efficient followed by state-owned banks (BUMN) and private domestic banks.
Research on efficiency determinants and the impact on profitability were also conducted in Indonesia. Independent variables that had significant impact on profitability (represented by ROA) are bank size, bank type, NPL, CAR, LDR, Operating Cost, and NIM (Subandi and Ghozali, 2013), and they were subsequently added with variables of BOPO, growth of operating income (PLO), and credit growth (PK) by Suyono (2005). The research discussed about the comparison of financial performance among domestic banks, foreign banks, and mixed-banks using financial ratio proxies. Performance of foreign banks based on financial radio proxies does not always outperform mixed banks and domestic banks, vice versa. It indicates that each of public banks has the equal opportunity to outperform other public banks disregarding those banks are domestic banks, foreign banks, or mixed banks (Handayani, 2005). Compared to the group of Syari’ah banks of BUS and UUS, it is seen that BUS with higher total asset has higher efficiency than UUS whose lower total asset. Meanwhile, the second stage of the test using Tobit approach showed that total asset, type of banks of BUS and UUS, net operating income, the quality of loan had positive impact nevertheless it was not significant while capital adequacy ratio had negative but insignificant impact (Abidin and Endri, 2010).
Permatasari and Novitasari (2014) observed the impact of good corporate governance (GCG) on capital and bank’s performance in Indonesia. The result suggested that the implementation of GCG (indicated by self-assessment) could reduce the possibility of bank’s credit default as risk management becomes one of assessment points on self-assessment sheet, thus if the implementation of GCG runs accordingly, it will improve risk management as well.
126 Bulletin of Monetary, Economics and Banking, Volume 18, Number 2, October 2015
Besides, high commitment from top management and all staffs on the implementation of GCG can minimize the risk of negative impact of credit distribution. GCG composite index did not have significant impact on financial performance due to management action regarding credit distribution to the public. The management of bank applies prudent bank principles in leading to declining credit distribution. As the result, banks also suffer from the decline of profit.
Referring to the above research introduction, it is necessary to re-examine the impact of internal factors on efficiency and profitability of conventional banks within the last three years. The research is aimed to estimate the impact of internal factors on efficiency and profitability of banks (ROA). Banks operating more efficiently will be able to achieve healthy and sustainable profitability performance. Internal factors used as independent variable is also used to measure the level of bank’s health. Those variables are represented by bank size, bank type, credit risk represented by Non-Performing Loan (NPL), capital represented by Capital Adequacy Ratio
(CAR), liquidity represented by Loans to Deposit Ratio, operating cost to operating income ratio (BOPO), net margin represented by Net Interest margin (NIM), composition of deposits to total third party’s fund ratio (DEP), and corporate governance represented by Good Corporate
Governance (GCG). Research problem in this research is to measure the impact of internal factors on efficiency of banking industry in Indonesia. Besides this research will try to analyze whether efficiency level using non-parametric approach measured by DEA score and bank internal factor have significant impact on profitability of Indonesia’s banking industry measured by ROA.
The output of this research is expected to provide theoretical implication in improving efficiency theory and financial performance for banking industry; to provide managerial implication regarding management policy in driving up higher efficiency and profitability performance mainly for domestic banks; to be useful for regulators to formulate policies to improve efficiency, bank’s profitability, interest rate for third party’s fund and credit, and to prepare bank institutions in Indonesia to compete in MEA. Moreover, the research is also useful for public to decide which bank they consider proper to save their excess fund and to be source of financing.
II. THEORY
Bank is a business entity that collects surplus funds from public in the form of savings and distributes it to public who are deficit in the form of credit and other forms to improve living standard of the public (UU RI No. 10/1998 on Banking). Banking is all aspects regarding bank including institution, business activities, and process in doing all its business activities. Banking industry in Indonesia run its operation based democratic economy using prudent principles that aim to elevate national development in order to improve equality, economic growth, and national stability to achieve prosperity for the public. Bank is a business entity that collects surplus funds from public in the form of savings and distributes it to public who are deficit in the form of credit and other forms to improve living standard of the public.
127The Determinants of Bank’s Efficiency In Indonesia
According to Indonesia’s Banking Statistics Quarter IV 2014, the classification of commercial banks of 119 banks is divided into 4 State-Owned Banks, 38 Domestic Private Foreign Exchange Banks, 29 Domestic Private Non-Foreign Exchange Banks, 26 Local Banks, 12 Mixed Banks, and 10 Foreign Banks. Out of 119 banks there are 108 conventional banks. Based on the ownership, banks are divided into 3 groups which are national banks, foreign banks, and mixed banks. The national banks consist of State-Owned Banks, Domestic Private Foreign Exchange Banks, Domestic Private Non-Foreign Exchange Banks, Local Banks, while foreign banks are Foreign Banks Office Branch (Kantor Cabang Bank Asing – KCBA).
Definition of foreign bank branch office from SK DIR No.32/37/KEP/DIR on The Requirements and Procedures of Opening Branch Office, Supporting Branch Office, and Bank’s Representative Overseas is branch office of a bank located overseas established and subject to foreign constitution in which the head office is located overseas that is directly and indirectly responsible to the head office and is located in Indonesia.
According to PBI No.14/26/PBI/2012 on Business Activities and Office Network Based On Bank’s Core Capital and the Letter of BI No. 15/6/DPNP 8 March 2013 on Business Activities of Commercial Banks Based On Core Capital, Classification of Commercial Banks based on the Business Activities is classified into 4 (four) BOOKS. The higher the core capital of the banks, the higher the BOOK of the bank and the broader the coverage of business activities that bank can precede. BOOK 1 is the bank with core capital by equal to or less than Rp. 1.000.000.000.000,00 (one trillion Rupiah); BOOK 2 is the bank with core capital by at least Rp. 1.000.000.000.000,00 (one trillion Rupiah) to Rp. 5.000.000.000.000,00 (five trillion Rupiah); BOOK 3 is the bank with core capital by at least Rp. 5.000.000.000.000,00 (five trillion Rupiah) to Rp. 30.000.000.000.000,00 (thirty trillion Rupiah); and Book 4 is the bank with core capital by at least Rp. 30.000.000.000.000,00 (thirty trillion Rupiah).
According to the expert of management and economics i.e. Hasibuan (1994) defined that efficiency is the best comparison between input and output, cost and benefit, between implementation output and resources. The point is to gain optimum output with the limited resources. According to Supriyono (2007), efficiency is when a unit works properly so that the goal will be achieved. Based on the economic theory, there are two definitions of efficiency (Ascarya and Yumanita, 2005). Economic efficiency has a macroeconomic perspective while technical efficiency has a microeconomic perspective. Measurement of technical efficiency is limited to technical relationships and operations during the process of converting input to output. Meanwhile in economic efficiency, price is not considered as given since it may be affected by macro policy (Sarjana, 1999).
Haddad et al. (2003) stated that determinations of input and output from a bank used asset approach (deposits as input). It is considered that it would ease next researches on banking efficiencies, as well as comparing the result of this research to other prior researches. Besides, banks also serve to be financial institution that collect funds from surplus unit and convert it
128 Bulletin of Monetary, Economics and Banking, Volume 18, Number 2, October 2015
to credit distributed ti deficit unit. In other words, it is said as bank serves to run intermediaries function. If deposits is measured as output, the deposits services will be imposed to bank’s customer in the form paying interest rate below market rate (Certificate of Bank Indonesia, SBI) rather than setting it with certain price as fee and services.
According to Kurnia (2004), measurement of banking efficiency consists of two approaches which are production and intermediation. In production approach, bank is considered as unit of economic activities that operates business to produce output of savings service to saving customers or to produce lending service to lending customers using all input the banks possessed. Meanwhile according to intermediation approach, bank is considered as unit of economic activities that transform all kinds of collected funds into loans. The consequence of these two approaches is the way the banks treat savings. In production approach, savings is considered as output since savings is service produced through banking activities. While in the intermediation approach, savings is considered as input since banks will transfer savings into any productive assets mainly loans. According to Kwan (2002) intermediation approach is frequently used in the research of bank’s efficiency as it includes interest expenditure by half or two third of bank’s total cost. Siamat (2005) mentioned that bank’s profitability is measured by ROA and ROE. Stanton et al (2000) argued that determinants of profitability can be divided into internal determinants which are factors controlled by banks management, and the second one is external determinants which are macroeconomic and bank-specific industry.
Measurement of banking efficiency can be done using various methods. It can be grouped into two main factors which are parametric and non-parametric methods. Both of these methods are aimed to estimate frontiers representing best practices from a system. The frontiers estimated are used as benchmark to compare a company to others. In parametric approach, measurement is conducted using stochastic econometric modelling and to try to omit any effect of inefficiency. There are three econometric parametric approaches which are (1) Stochastic Frontier Approach (SFA); 2) Thick Frontier Approach (TFA); and 3) Distribution-Free
Approach (DFA). Meanwhile non-parametric approach with Nonparametric Linear Programming
Approach conducts non-parametric using no stochastic approach and tends to “combine” disturbance and inefficiency. This argument is constructed based on findings and observations from population and evaluated relative efficiency on the observed units. This approach is known as Data Envelopment Analysis (DEA).
The benefit of using DEA approach is that the approach does not meet explicit specification from a form of function and just requires little structures to construct the efficient frontiers. According to Rusydiana and Devi (2013), a weakness that might come up is “self-identifier” and “near self-identifier”.
Subandi and Ghozali (2013) argued that the difference between these two approaches is that parametric approach used to identify relationship between input and output requires accurate information on input price and sufficient simple as well as requiring proper form of
129The Determinants of Bank’s Efficiency In Indonesia
function of the frontier and structure from an on sided error (if needed). Meanwhile non-parametric approach does not require too much information as well as the assumption and required samples. Other main differences are that the parametric approach includes random
error on the frontier while DEA does not require so.
According to Ascarya and Yumanita (2005), substantial differences among the three approaches in measuring efficiency performance is in terms of assumptions that shapes curve or the efficient frontier, treatment on random error, and inefficiency distribution of random
error. Other substantial differences are that parametric approach includes random error on the frontier; meanwhile DEA approach does not include random error. As the consequence, DEA approach is not able to measure factors of price differences among regions, regulation differences, behavior of data, extreme observations, and other inefficiency factors. As the result, non-parametric approach can be used to measure efficiency more generally. The weakness of DEA approach is that one outlier can significantly affect measurement of efficiency of each company (Haddad et al., 2003).
According to Abidin and Endri (2010), DEA method is a non-parametric frontier using linear program model to measure the comparison of output and input ratio of all units in a population. The goal of DEA method is to measure efficiency level of Decision Making Unit (DMU i.e. bank) relative to the similar banks when all these units are on or below its efficient frontier curve. Thus the method is used to evaluate efficiency relative to several objects (performance benchmarking).
Berger and Young (1997) measured the relationship between quality of credit, cost efficiency, and bank’s capital in the United States. The result showed that credit default led to an increase in operating cost or a decline in cost efficiency as bank spent cost of monitoring and billing upon NPL. Banks with low quality of credit are required to provide reserve leading to decline in capital. This research also measured determining factors of low quality of credit leading to NPL that are external factors of economic policy, while internal factors are lack of credit distribution, inefficient portfolio management, credit analysis, collateral valuation, and moral hazard.
Naceur (2003) examined determining factors of profitability on banking industry in Tunisia. It is divided into two substantial categories which are internal determinants (liquidity, capital adequacy, and management cost) and external determinants (ownership, firm size, and economic condition). Findings of the research expressed that efficient management of cost is one of the most significant determinants of banks in obtaining high profitability. Economic condition such as inflation would have positive impact on profitability. The higher the interest rate, the lower the bank’s profitability is.
Profitability of foreign banks is much better than domestic ones. Several factors that drive this performance are (a) capital from foreign investors reduces fiscal cost of bank restructuring (Tang et al., 2000); (b) foreign banks have higher experience in managing risk and better
130 Bulletin of Monetary, Economics and Banking, Volume 18, Number 2, October 2015
corporate governance that make foreign banks more efficient (Bonin et al., 2005); (c) the presence of foreign banks increases competition that drive banks to reduce cost and improve efficiency (Claessens et al., 2001). Moreover, domestic banks gain technology transfer developed by foreign banks.
Prasnanugraha (2007) argued that based on the result of t test, it is seen that NPL, NIM, and BOPO have partial impact n ROA while CAR and LDR do not have partial effect. ROA was quite high even though NPL was relatively high as wee in that year. The average NPL was still below maximum level set by regulator by 4.14% thus ROA was considered to remain high.
Research on the impact of financial ratio on financial performance was also conducted by Prananugraha (2007). Statistical analysis in the research is multiple linear regressions that measure the effect of independent variables (CAR, NPL, LDR, BOPO, and NIM) on dependent variables (ROA). The effect magnitude of independent variables (CAR, NPL, LDR, BOPO, and NIM) on dependent variables (dividend payout ratio) can be simultaneously calculated through multiple regression equation using SPSS program. Variables of CAR, NPL, LDR, BOPO, and NIM have simultaneous effect on ROA. Meanwhile CAR and LDR do not have partial effect on ROA while NPL, BOPO, and NIM have partial impact n ROA.
Warganegara (2011) conducted analysis on efficiency determinant of NIM in banking industry during the period of 2006 – 2009. According to the analysis, banking industry in Indonesia is considered inefficient compared to other banking industries in South East Asia. Relatively high NIM becomes burden for the economy with the high intermediation cost. NIM is affected by market power, bank’s quality management, bank’s size, and NPL policy.
Suyono (2005) conducted analysis of the impact of determinant of financial ratios of CAR, BOPO, NIM, LDR, operating income growth (PLO), and credit growth (PK) on ROA. It is seen that CAR, BOPO, NIM, LDR, NPL, PLO, and PK have significant impact on ROA. CAR and LDR respectively have positive and significant impact on ROA while BOPO has negative and significant impact on ROA. Furthermore NIM, NPL, PLO, and PK do not have significant impact on ROA.
III. METHODOLOGY
Population of this research is conventional banks in Indonesia during the period of 2012 to 2014, consisting of 108 banks. Those banks are respectively grouped into 4 State-owned Banks, 39 Foreign Exchange Domestic Banks, 23 Non-Foreign Exchange Domestic Banks, 26 BPD, 6 mixed banks, and 10 KCBA (branch offices of foreign banks). Period of observation is data of quarter 3 (Q1.2012 – Q4. 2014). The research employs secondary data of bank’s financial data accessed from Indonesia Banking Statistics and Publication Report of period 2012, 2013, and 2014. The research consists of 2 stages which are 1) efficiency measurement using intermediation approach; and 2) estimation of factor model that has significant impact which are internal factors of bank on efficiency as exhibited below
131The Determinants of Bank’s Efficiency In Indonesia
Determinants of internal factor include size, type, NPL, CAR, LDR, BOPO, NIM, DEP, and GCG. They are explained as follow:
1. According PBI No. 14/15/PBI/2012 dated 24 October 2012 on Asset Assessment of Commercial Banks, it is mentioned that asset consists of productive asset and non-productive asset. Productive asset is funds allocation of banks to gain return in the form of credit and other securities, inter-bank placements of acceptance claim, securities claim that is purchased and commitment of reselling the securities, derivative claim, inclusion, transaction of administrative account, and provision of other funds similar to quoted earlier. Meanwhile non-productive asset are those that have potential lost in the form of taken over collateral, abandoned property, inter-office account, and suspense account.
2. Classification of commercial banks based on Indonesia Banking Statistics published by OJK consists of 4 State-owned Banks, 38 Foreign Exchange Banks, 29 Non-Foreign Exchange
132 Bulletin of Monetary, Economics and Banking, Volume 18, Number 2, October 2015
Banks, 26 Local Banks (BPD), 12 Mixed Banks, and 10 Foreign Banks. Based on the ownership, bank is classified into three groups which are State-owned Banks, Foreign Exchange Banks, Non-Foreign Exchange Banks, Local Banks (BPD), while foreign banks consists of Branch Office of Foreign Banks (KCBA). In this research, type of banks is divided into 6 groups which are (1) State-owned Banks; (2) Mixed Banks; (3) Foreign Exchange Banks; (4) Non-Foreign Exchange Banks; (5) Local Banks (BPD); and (6) Branch Office of Foreign Banks (KCBA).
3. NPL or credit default, which is the ratio that shows quality of commercial bank’s asset, is measured using NPL Gross and NPL Netto. According to PBI No.14/15/PBI/2012 dated 24 October 2012 on the Asset Assessment of Commercial Banks is provision of funds or claims similar to it agreed upon the deal of borrowings between banks and other parties that requires debtor to settle the debt at maturity date with imposing interest rate including: (1) overdraft; a negative balance on time deposit account of customers failed to be settled at maturity; (2) taking over claim within the period of factoring activities; and (3) taking over or purchasing credit from other parties.
4. According to PBI No.15/12/PBI/2013 dated 12 December 2013 CAR is the Minimum Required Capital of Commercial Banks. In order to create health banking system and be able to develop as well as competing both domestically and internationally, banks need to improve the ability to mitigate risks caused by crisis and/or high growth of banking’s credit. In order to improve the ability to mitigate risks, it is needed improvement on quality and quantity of bank’s capital based on international standard mentioning that improvement of capital quality is conducted through some adjustments on components requirements and bank’s capital instrument, as well as adjustments on capital ratios. In order to enhance quantity of capital, banks need to provide additional capital above the minimum required capital adjusted to risk profile that serve as buffer when economic and financial crisis occurs which negatively affects financial system stability.
5. Loan to Deposit Ratio, abbreviated as LDR, is credit ratio distributed to the third party in Rupiah and foreign exchange which does not include credit to other banks, to third party’s fund including time deposit, savings, and deposits in Rupiah and foreign exchange which does not include inter-bank funds. Liquid asset management has to consider trade-
off between liquidity and profitability (liquidity vs earning trade-off). According to SE BI No.13/30/DPNP dated 16 December 2011 on the third revision of SE BI No.3/30/DPNP dated 14 Decembers 2001 on Monthly Financial Report of Commercial Bank and Specific Report delivered to Bank Indonesia, it is mentioned that LDR is the comparison between credit to third party’s fund.
6. BOPO of operational efficiency ratio is the ratio that expresses comparison between operating cost and operating income (Riyadi, 2004). According to SE BI No.15/7/DPNP dated 8 March 2013, it is decided that benchmark of BOPO for commercial banks classified into BOOK 1 is up to 85%, BOOK II is 78 – 80%, BOOK III is 70 – 75%, and BOOK IV is 60 – 65%.
133The Determinants of Bank’s Efficiency In Indonesia
7. Cost efficiency ratio (CER) is the ratio used to measure how much non-interest rate cost spent by a bank to generate net interest income and other non-interest income (Timothy and Scott, 2000). Non-interest expense or frequently called as overhead cost consists of allowance for losses upon productive and non-productive assets, labor cost, employee allowance, as well as administration and general costs (electricity, telephone, building rents, transportation, maintenance, etc.). Meanwhile non-interest income consists of commission income and non-credit provisions, transfer income, check disapproval and intercity, gains from foreign exchange transaction, and other non-credit bank’s service income. Non-interest income is frequently called as fee-based income.
8. Third party’s fund consists of time deposit, Savings, and Deposits. Definition of each of them is mentioned in SE BI No.2/19/DSM dated 3 October 2000 on Monthly Report of Commercial Banks.
9. According to SE BI No.6/23/DPNP dated 31 Mei 2004 on Assessment System of Bank’s Health, it is mentioned that NIM (Net Interest Margin) is the comparison between net interest income and the average of productive assets.
10. The implementation of GCG in banking industry must always refer to the 5 basic principles which are (1) transparency which is the openness of relevant and material information access as well as the openness during the process of decision making; (2) accountability which is the clarity of functions and responsibility of bank’s organizations so that the implementation of GCG will run effectively; (3) responsibility which is the conformity between management of banks and laws; (4) independency which is professional banking management without any interference of other parties; and (5) fairness which is the equality in fulfilling rights of stakeholders that emerge upon agreement and laws.
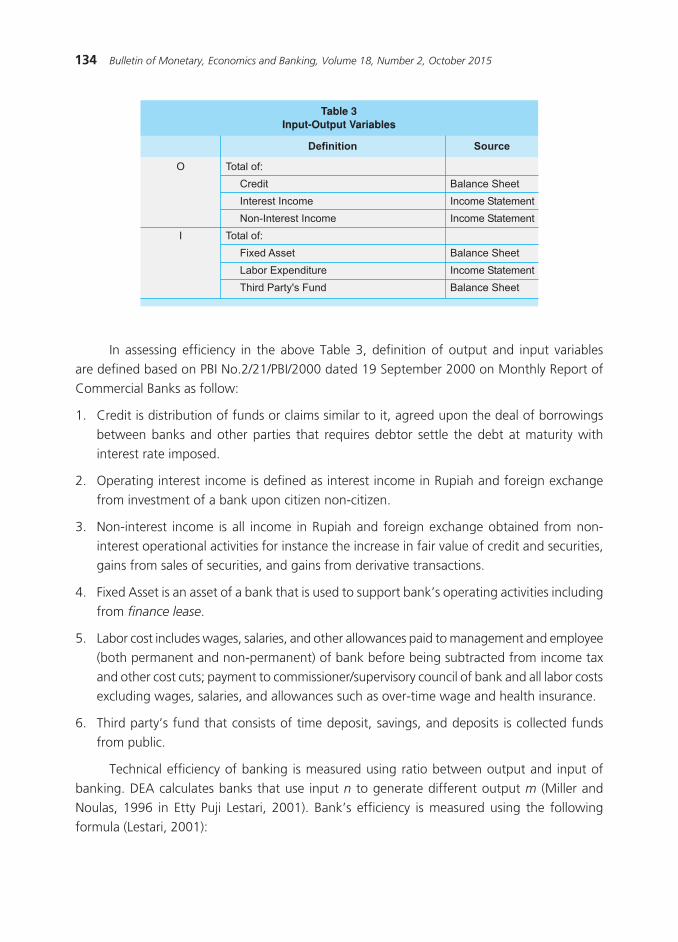
The first stage of this research is to measure efficiency using DEA method which is to compare input and output variables using intermediation approach considering that banking is intermediation institution that distributes funds from surplus units to deficit units in the form of credit to drive domestic economic growth. DEA consists of 1 output (O) and 1 input (I), which is respectively the total of the following accounts:
134 Bulletin of Monetary, Economics and Banking, Volume 18, Number 2, October 2015
In assessing efficiency in the above Table 3, definition of output and input variables are defined based on PBI No.2/21/PBI/2000 dated 19 September 2000 on Monthly Report of Commercial Banks as follow:
1. Credit is distribution of funds or claims similar to it, agreed upon the deal of borrowings between banks and other parties that requires debtor settle the debt at maturity with interest rate imposed.
2. Operating interest income is defined as interest income in Rupiah and foreign exchange from investment of a bank upon citizen non-citizen.
3. Non-interest income is all income in Rupiah and foreign exchange obtained from non-interest operational activities for instance the increase in fair value of credit and securities, gains from sales of securities, and gains from derivative transactions.
4. Fixed Asset is an asset of a bank that is used to support bank’s operating activities including from finance lease.
5. Labor cost includes wages, salaries, and other allowances paid to management and employee (both permanent and non-permanent) of bank before being subtracted from income tax and other cost cuts; payment to commissioner/supervisory council of bank and all labor costs excluding wages, salaries, and allowances such as over-time wage and health insurance.
6. Third party’s fund that consists of time deposit, savings, and deposits is collected funds from public.
Technical efficiency of banking is measured using ratio between output and input of banking. DEA calculates banks that use input n to generate different output m (Miller and Noulas, 1996 in Etty Puji Lestari, 2001). Bank’s efficiency is measured using the following formula (Lestari, 2001):
�����������������������������
����������
���������
� ������
� ���������������
� ������������������
���������
� ���������
� ����������������
� ������������������
������
�
�
�������������
����������������
����������������
�������������
����������������
�������������
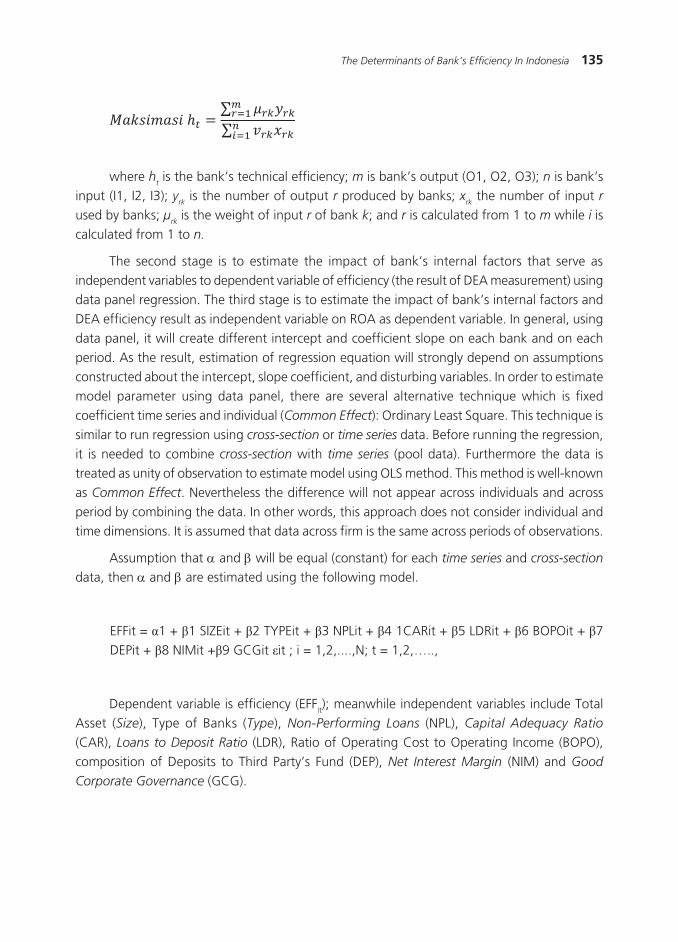
135The Determinants of Bank’s Efficiency In Indonesia
where ht is the bank’s technical efficiency; m is bank’s output (O1, O2, O3); n is bank’s
input (I1, I2, I3); yrk is the number of output r produced by banks; x
rk the number of input r
used by banks; µrk is the weight of input r of bank k; and r is calculated from 1 to m while i is
calculated from 1 to n.
The second stage is to estimate the impact of bank’s internal factors that serve as independent variables to dependent variable of efficiency (the result of DEA measurement) using data panel regression. The third stage is to estimate the impact of bank’s internal factors and DEA efficiency result as independent variable on ROA as dependent variable. In general, using data panel, it will create different intercept and coefficient slope on each bank and on each period. As the result, estimation of regression equation will strongly depend on assumptions constructed about the intercept, slope coefficient, and disturbing variables. In order to estimate model parameter using data panel, there are several alternative technique which is fixed coefficient time series and individual (Common Effect): Ordinary Least Square. This technique is similar to run regression using cross-section or time series data. Before running the regression, it is needed to combine cross-section with time series (pool data). Furthermore the data is treated as unity of observation to estimate model using OLS method. This method is well-known as Common Effect. Nevertheless the difference will not appear across individuals and across period by combining the data. In other words, this approach does not consider individual and time dimensions. It is assumed that data across firm is the same across periods of observations.
Assumption that a and β will be equal (constant) for each time series and cross-section data, then a and β are estimated using the following model.
Dependent variable is efficiency (EFFit); meanwhile independent variables include Total Asset (Size), Type of Banks (Type), Non-Performing Loans (NPL), Capital Adequacy Ratio (CAR), Loans to Deposit Ratio (LDR), Ratio of Operating Cost to Operating Income (BOPO), composition of Deposits to Third Party’s Fund (DEP), Net Interest Margin (NIM) and Good
Corporate Governance (GCG).
∑∑
136 Bulletin of Monetary, Economics and Banking, Volume 18, Number 2, October 2015
IV. RESULT AND ANALYSIS
Efficiency score using DEA method is ranging between 0 and 1. Efficiency with score of 1 showed that the bank is the most efficient among the samples within certain periods, while efficiency score of other banks is relative to the more efficient bank. Bank with efficiency score closed to 0 reflects that the bank is inefficient (Mansyur, 2012).
In the Q4 2012, there is only 1 bank with efficiency score by 1 (Domestic Foreign Exchange Bank) and there are 6 banks that have efficiency score by 0.76 – 0.99 while other 101 banks have efficiency score lower than 0.75. In Q4 2013, there is 1 state-owned bank that has efficiency score by 1 and there are 2 foreign exchange banks with efficiency score by 0.76 – 0.99, while the other 105 banks have efficiency score below 0.75. In Q4.2014 there is are no banks that have efficiency score by 1, and there are only 6 banks that have efficiency score by 0.76 – 0.99 while the other 102 banks have efficiency score below 0.75. The result of efficiency measurement for the overall 108 banks is exhibited in Table 4.
Based on the result of efficiency measurement, it is seen that banking in Indonesia is considered inefficient within 3 years of research periods which is in accordance with bank’s internal factors such as financial indicators that bank’s asset in 2014 (Rp. 7,303.82 trillion) has
137The Determinants of Bank’s Efficiency In Indonesia
increased higher compared to 2013 (Rp. 6,531.92 trillion) and 2012 (Rp. 5,607.87 trillion). Nevertheless ROA tends to be stable by 2% to 3%’ NIM of banking in Indonesia is relatively higher by 5.49% (2012), 4.88% (2013), and 4.23% (2014) compared to other countries such as Philippines by 3.3%, Thailand by 2.6%, Malaysia by 2.3%, and Singapore by 1.5%, while BOPO of banking industry in Indonesia is approximately 66% to 83%.
Estimation Result of the Impact of Factors on Efficiency
Based the estimation of internal factors model, determinant of efficiency is exhibited as follow:
������������������������������������� �� �������
��������
�
����
����
���
����
���
����
���
���
���
���
�� ����
���� ������ ����
����������� ���
���� ������ ��
������ ������
�� ��� ���
������ ��� ����
����������� ���������� � ��������� �����
���������
��������
���������
���������
��������
���������
���������
���������
��������
���������
���������
��������
��������
��������
���������
���������
���������
��������
��������
��������
��������
��������
��������
��������
��������
��������
��������
��������
��������
���������������
����������������
� � ��������������
������������
����������������
�������� ��� ��
���������
���������
����������
����������
���������
����������
���������
���������
��������
���������
����������
������
������
������
������
������
������
������
������
������
������
������
��������
��������
���������
���������
���������
��������
According to the above estimation in Table 5, it can be interpreted that the regression output generates lower R-squared by 0.147780. It shows that independent variables can only explain efficiency by 14.77% while the rest 85.23% bank’s efficiency is explained by other factors that are not observe in this research.
The impact of bank size proxied by total asset on technical efficiency is shown by β1 = 0.032349 which means bank size has positive impact with probability below 0.05%. It shows that bank size has significant impact on technical efficiency of domestic banks. Furthermore
138 Bulletin of Monetary, Economics and Banking, Volume 18, Number 2, October 2015
banks with larger asset have infrastructure in the form resource, information technology; sufficient organizational structure that supports bank’s operating activities. The banks are also supported by office network laid in all areas, various and complex banking products so that the banks will be more efficient with specific input to generate output in the form of transaction service to the public, credit distribution and placements of productive assets to generate profit. Large banks tend to have comprehensive internal policy so that all operating activities of bank runs optimally and well-structured based on the respective authority. It is confirmed by the result of research that banks that have efficiency score closed to 1 are state-owned banks which are BRI and Bank Mandiri compared to other banks in Q4. 2014 by respectively Rp. 778.08 trillion and Rp. 757.04 trillion. In line with other previous studies, it is confirmed that banks with larger total asset tend to have higher efficiency compared to banks with relatively lower total asset. Boahene et al (2012) argued that large scale banks are better than small scale banks since banks with larger assets are able to manage the operations timely and it works on better economies of scale. Other researches expressed that bank size does not really matter to improve banking efficiency. Nevertheless, the improvement of technical aspects through high technology utilization equipped with knowledge and skills will generate higher productivity (Omar et al, 2006); factors of bank size, types of bank, capital adequacy ratio, loan to deposits ratio, operating cost, and net interest margin have significant impact on technical efficiency (Subandi and Ghozali, 2013). Nevertheless, there are several researches that contradict with the result of this research. Ataullah et al (2004) argued that efficiency tends to decline in the large banks group, public banks, as the bank’s organization tends to be complicated and political compared to smaller foreign private banks.
The impact of bank’s type, that consists of 6 groups of bank, on technical efficiency is shown by the coefficient β2 = -0.030435 with probability 0.0000. It means that bank’s type has significant impact on technical efficiency of domestic banking. Bank’s type consists of 6 categories which are (1) State-owned Banks, (2) Mixed Banks, (3) Foreign Exchange Domestic Banks, (4) Non-Foreign Exchange Domestic Banks, (5) BPD, and (6) Branch Offices of Foreign Banks (KCBA). The score is to attribute characteristics of the respective group of banks and cannot be interpreted as performance measurement. Coefficient of the impact of bank’s type on efficiency is -0.030435. It can be concluded that banks with the score closed to 1 is considered efficient. It is in line with the result of efficiency measurement using DEA expressing that banks with efficiency score closed to 1 are state-owned banks which are BRI and Bank Mandiri. The result confirms study of Handayani (2005) who argued that foreign banks performance regarding financial ratios proxy are not always superior compared to mixed banks and other domestic banks, vice versa. Each of public banks has the same opportunity to be superior compared to other public banks disregarding whether the bank is domestic ones, foreign ones, or mixed. Nevertheless, it contradicts with the prior researches of Kurnia (2004), Haddad et al. (2003), and Astiyah and Hausman (2006) expressing that foreign banks are more efficient.
139The Determinants of Bank’s Efficiency In Indonesia
The impact of gross NPL of banks on technical efficiency is shown by β3 = -0.008610 and probability by 0.0135. It means that gross NPL has significant and negative impact technical efficiency of domestic banks. Banks with high NPL will generate higher cost of reserve establishment of credit allowance. It will affect income and bank’s capital. Besides establishing reserve, banks also need more human capital on recovery and collection units that are responsible to manage credit so that NPL is expected to decline. If banks manage NPL below 5% following the regulation, then those banks are expected to be more efficient as collection and recovery
costs and the establishment of minimum required reserve are minimized to achieve higher efficiency. According to Berger and Mester (1997) and Kwan and Eisenbeis (1995), banks with higher efficiency tend to have lower NPL.
The impact of CAR on technical efficiency is explained by β4 = 0.002136 with profitability 0.0000. It shows that CAR has positive and significant on technical efficiency of domestic banks. CAR is the comparison between capital and Risk-Weighted Asset. It measures the extent to which bank’s capital to mitigate potential lost that might emerge from credit risk, interest rate risk, and liquidity risk. If the capital is assumed to be fixed and Risk-Weighted Asset increases, then it will decrease CAR. The increase in Risk-Weighted Asset has potential impact on the increase in credit while capital must be able to mitigate the risk that may emerge from them. The result of this research shows that CAR has positive and significant impact on bank’s efficiency which means the ability of bank’s capital to absorb the risks indicates that the banks are efficient. Prior research of Suyono (2005) argued that CAR has partial impact on ROA of commercial banks in Indonesia during the period of 2001 – 2003 with the level of significance by 5%. The same result is also suggested by Ghozali (2013) that factors of capital adequacy ratio significantly affect the technical efficiencies.
The impact of LDR on technical efficiency is explained by β5 = -0.000270 with probability by 0.0431. It shows that LDR has significant and negative impact on technical efficiency of domestic banks. LDR is one way to measure the extent to which a firm can generate liquidity. LDR is used to measure banking intermediation performance and serves as indicator of bank’s liquidity. The higher funds that serve as liquidity buffer and the higher the buffer compared to the required liquidity, the higher the probability of funds to be unproductive. It eventually leads to inefficiency. Besides serving as liquidity, LDR is also used to measure the role of bank as intermediation institution. The higher the LDR, the higher the quality of bank’s intermediation role. It is indicated by LDR ranging from 79% to 92%. Ongore and Kusa (2013) argued that capital adequacy, asset quality, and management efficiency have significant impact on financial performance of commercial banks in Kenya. Nevertheless it does not happen on liquidity. LDR has partial and significant impact n ROA of commercial banks in Indonesia during the period of 2001 – 2003 with level of significance of less than 5% (Suyono, 2005).
The impact of BOPO on bank’s technical efficiency is shown by β6= -0.000496 with probability of 0.4022. It indicates that BOPO has negative but insignificant impact on technical
140 Bulletin of Monetary, Economics and Banking, Volume 18, Number 2, October 2015
efficiency of domestic banks. BOPO is actually the ratio of all operating costs to operating revenue while efficiency is measured from the comparison between output (credit, interest income, and non-interest income) and input (fixed asset, inventories, labor cost, and third party’s fund). In BOPO ratio, operating costs serve as numerator while in measuring efficiency, operating costs serve as denominator. It eventually affects probability value of regression of BOPO on efficiency. The result contradicts with research of Berger and Mester (1997) expressing that the higher the cost, the lower the efficiency. Furthermore, research from Subandi and Ghozali (2013) showed that operating cost factors and net interest margin have significant impact on technical efficiency. Moreover, the result also contradicts with the theory that expresses the higher the BOPO, the higher the inefficiency of the bank. In order to solve the problem, it is conducted other analysis of efficiency ratio which is Cost Efficiency Ratio (CER). It is the ratio between overhead cost and income interest and fee-based income. Based the regression output regarding the impact of CER on efficiency, it is found that CER has significant impact on technical efficiency which is explained by β = -0.001177 with probability of 0.0001. This finding is in line with theory and prior researches expressing that the lower the expenses, the higher the efficiency bank could create.
The impact of DEP, representing composition of deposits on third party’s fund, on technical efficiency is explained by β7 = -0.008728 with probability of 0,7016 (higher than alpha 5%). It shows that the composition of deposits on third party’s fund has negative but insignificant impact on technical efficiency. The effect is insignificant as interest rate imposed applied for credit is market rate and banks do not impose special rate above deposits rate. Besides the insignificant impact is also caused by behavior of customer which is not sensitive on fluctuations of interest rate. The other reason is that public literacy on financial institution and financial products as well as the regulation set by OJK on October 2014 that interest rate is adjusted (restricted) based on types of BOOK the banks are grouped into. Prior researches on the impact of third party’s fund (Subandi and Ghozali, 2013) argued that ratio of deposits on loan has significant impact on technical efficiency.
The impact of NIM on technical efficiency is explained by β8 = 0.000347 with probability 0,8740 (higher than 5%). It shows that NIM has positive but insignificant impact on technical efficiency of domestic banking. NIM theoretically has negative impact on efficiency, which means the higher the NIM, the lower the efficiency. The insignificant impact occurred as NIM in Indonesia is relatively high thus the competition is not tight to determine NIM in banking industry. Prior researches (Aberu and Mendes, 2001) argued that NIM positively reacted to operating cost, but insignificant on earnings before tax.
The impact of GCG on technical efficiency is explained by β9 = -0.009772 with probability of 0,3366 (higher than 5%). It means that GCG has negative but insignificant impact on technical efficiency of domestic banking. The insignificant impact occurred as GCG score is made using self-assessment, thus it does not reflect the real GCG implemented by banks. The score of GCG
141The Determinants of Bank’s Efficiency In Indonesia
that reflects objective performance is conducted by financial service authority. The constraint of this research is that the GCG data from financial service authority cannot be published and cannot be used for this research. Prior researches by (Ongore and Kusa, 2013) concluded that management efficiency has significant impact on commercial bank in Kenya.
Of the nine independent variables, it can be concluded that the most dominant variable is bank size with regression coefficient by 0.032349 while the least dominant variable is LDR with regression coefficient by -0.000270.
V. CONCLUSION
According to the above findings, it can be concluded that:
1. Commercial banks are not fully efficient during the period of observation. In Q4.2012, banks with efficiency score of 1 consist of 1 Foreign Exchange Banks and there are only 6 banks that have efficiency score ranging from 0.76 to 0.99 while the other 101 banks have efficiency score by less than 0.75.
2. In Q4. 2013 banks that have efficiency score by 1 is 1 state owned-banks while there are 2 Foreign Exchange Banks that have efficiency score ranging from 0.76 – 0.99. Meanwhile, there are 105 banks that have efficiency score by less than 0.75.
3. In Q4. 2014, there are no banks that have efficiency score by 1 while there are 6 banks that have efficiency score ranging from 0.76 to 0.99. Meanwhile, there are 102 banks that have efficiency score by less than 0.75.
4. Internal factors, measured by DEA, that have negative and significant impact on technical efficiency are NPL, LDR, CER, and composition of deposits on third party’s fund (DPK). Meanwhile, the ones that have positive impact are CAR and NIM. Internal factors that do not have impact on technical efficiency are GCG.
According to the above findings, then banks need to concern more on their internal factors that have significant impact on efficiency. Those variables are bank size, bank’s type, NPL, CAR, and LDR. Banks can use the following strategies to:
1. Well-managing credit to maintain 5% of NPL by distributing credit using the principles of prudent-banking, preparing qualified human capital in charged to manage credit, restructuring credit that potential lost, not to distribute credit on any economic sectors that do not have positive prospect in the future, implementing risk tolerance and risk appetite to mitigate the risk of managing credit.
2. Improving capital capacity to drive bank’s operations efficiency. Banks that have met the requirements of BOOKS (BUKU) are expected to run their business activities efficiently. Complexity of banking business activities should be supported by minimum required capital as regulated in the classification of BOOKS (BUKU)
142 Bulletin of Monetary, Economics and Banking, Volume 18, Number 2, October 2015
3. Optimizing source of fund from third party’s fund to distribute in the form of credit by applying the principle of prudent-banking by emphasizing on the importance of human capital efficiency along with supporting infrastructure to achieve bank’s efficiency.
Moreover the research also provides policy implication such as OJK that serves as supervisory authority of banking industry can use the result of this research to formulate policies regarding supervisory actions. Policy series of OJK to implement restriction on interest rate based on BOOKS (BUKU) is considered appropriate to drive higher profitability and efficiency of banking industry. It is needed commitment from banking industry to comply and to publish the score of GCG based on facts to reflect objective performance as GCG does not have significant impact on efficiency.
By considering that efficiency measurement just uses intermediation approach and independent variables consist of bank’s internal factor, then there will be recommendations and suggestions for further research:
1. Adding macroeconomic factors in the analysis of efficiency level and its impact on profitability. Those variables are credit interest rate, inflation, economic growth, and foreign Exchange.
2. Analysis on the comparison between the efficiency of banking in Indonesia and South East Asia regions as well as conducting analysis on the comparison of Syari’ah banking and conventional banking.
3. Efficiency assessment can be completed by measuring efficiency using parametric methods. Besides it can be also conducted analysis on the comparison of result of efficiency assessment using parametric and non-parametric approach.
143The Determinants of Bank’s Efficiency In Indonesia
Abidin, Zaenal dan Endri, 2010, “Kinerja Efisiensi Teknis Bank Pembangunan Daerah: Pendekatan Data Envelopment Analysis (DEA)”, Jurnal Akuntansi dan Keuangan, hal. 21-29.
Abreu, Margarida dan Mendes, Victor, 2001, Commercial Bank Interest Margins and Profitability: Evidence for Some EU Countries. Pan-European Conference Jointly Organised by the IEFS-UK
& University of Macedonia Economic & Social Sciences, Thessaloniki, Greece, May:17-20.
Ascarya dan Yumanita, Diana, 2005, Bank Syariah: Gambaran Umum, Pusat Pendidikan dan Studi Kebanksentralan (PPSK) Bank Indonesia, Jakarta.
Astiyah, Siti dan Husman, Jardine A, 2006, “Fungsi Intermediasi dalam Efisiensi Perbankan di Indonesia: Derivasi Fungsi Profit”, Buletin Ekonomi Moneter dan Perbankan (Journal of Monetary Economics and Banking), Maret 2006, 8(4), hal.529-544.
Ataullah A, Cockerill T, Le H., 2004, Financial liberalization and bank efficiency: a comparative analysis of India and Pakistan. Applied Economics. 36(17):1915-1924.doi:10.1080/000368404200068638.
Berger, Allen N dan DeYoung, Robert, 1997, “Problem Loans and Cost Efficiency in Commercial Banks”, Journal of Banking & Finance, 21(6), hal.849-870.
Berger, Allen N dan Humphrey, David B., 1997, “Efficiency of Financial Institutions: International Survey and Directions for Future Research”, European Journal of Operational Research, 98(2), hal.175-212.
Berger, Allen N dan Mester, Loretta J., 1997, “Inside the Black Box: What Explains Differences in the Efficiencies of Financial Institutions?”, Journal of Banking & Finance, 21(7), hal.895-947.
Boahene, Samuel Hymore, Dasah, Julius dan Agyei, Samuel Kwaku, 2012, “Credit Risk and Profitability of Selected Banks in Ghana”, Research Journal of Finance and Accounting, 3(7), hal.6-14.
Bonin, John P, Hasan, Iftekhar dan Wachtel, Paul., 2005, “Bank Performance, Efficiency and Ownership in Transition Countries”, Journal of Banking & Finance, 29(1), hal.31-53.
Claessens, Stijn, Demirgüç-Kunt, Aslι dan Huizinga, Harry, 2001, “How Does Foreign Entry Affect Domestic Banking Markets?”, Journal of Banking & Finance, 25(5), hal.891-911.
Hadad, Muliaman D, Santoso, Wimboh, Ilyas, Dhaniel dan Mardanugraha, Eugenia, 2003, “Analisis Efisiensi Industri Perbankan Indonesia: Penggunaan Metode Nonparametrik Data Envelopment Analysis (DEA)”, Biro Stabilitas Sistem Keuangan Bank Indonesia. Research Paper, (7/5).
references
144 Bulletin of Monetary, Economics and Banking, Volume 18, Number 2, October 2015
Handayani, Puspita Sari, 2005, Analisis Perbandingan Kinerja Bank Nasional, Bank Campuran dan Bank Asing dengan Menggunakan Rasio Keuangan. [Tesis]. Semarang: Program Pasca Sarjana Universitas Diponegoro.
Hasibuan, Malayu SP, 1994, Manajemen Sumber Daya Manusia, Dasar dan Kunci Keberhasilan, Cetakan Keenam, CV. Haji Mas Agung, Jakarta.
Kurnia, Akhmad Syakir, 2004, “Mengukur Efisiensi Intermediasi Sebelas Bank Terbesar Indonesia dengan Pendekatan Data Envelopment Analysis (DEA)”, Jurnal Bisnis Strategi, 2004, 13, hal.126-139.
Lestari, Etty Puji, 2001, Efisiensi Teknik Perbankan di Indonesia Tahun 1995-1999: Aplikasi Data Enverlopment Analysis. [Thesis]. Universitas Gadjah Mada.
Mansyur, Fakhruddin, 2012, Analisis Perbandingan Efisiensi Bank Umum Syariah dan Bank Umum Konvensional di Indonesia Menggunakan Metode Stochastic Frontier Approach (SFA). UIN Sunan Kalijaga Yogyakarta.
Mester, Loretta J., 1997, “Measuring Efficiency at US Banks: Accounting for Heterogeneity is Important”, European Journal of Operational Research, 98(2), hal. 230-242.
Muda, Muhamad, Shaharuddin, Amir dan Embaya, Abdelhakim, 2013, “Comparative Analysis of Profitability Determinants of Domestic and Foreign Islamic Banks in Malaysia”, International Journal of Economics and Financial Issues, 3(3), hal.559-569.
Naceur, Samy Ben, 2003, “The Determinants of the Tunisian Banking Industry Profitability: Panel Evidence”, Universite Libre de Tunis Working Papers (ERF Research Fellow).
Omar, Mohd Azmi, Rahman, Abdul Rahim Abdul, Yusof, Rosylin Mohd, Majid, M Shabri Abd dan Rasid, 2006, MESM. “Efficiency of Commercial Banks in Malaysia”, Asian Academy of Management Journal of Accounting and Finance, 2(2), hal.19-42.
Ongore, Vincent Okoth dan Kusa, Gemechu Berhanu, 2013, “Determinants of Financial Performance of Commercial Banks in Kenya”, International Journal of Economics and Financial Issues, 3(1), hal.237-252.
Permatasari, Ika dan Novitasary, Retno, 2014, “Pengaruh Implementasi Good Corporate Governance terhadap Permodalan dan Kinerja Perbankan di Indonesia: Manajemen Risiko Sebagai Variabel Intervening”, Jurnal Ekonomi Kuantitatif Terapan, 7(1).
Prasnanugraha, Ponttie, 2007, Analisis Pengaruh Rasio-Rasio Keuangan terhadap Kinerja Bank Umum di Indonesia (Studi Empiris Bank-Bank Umum yang Beroperasi di Indonesia). [Skripsi]. Semarang: Universitas Diponegoro.
145The Determinants of Bank’s Efficiency In Indonesia
Roman, Angela dan Şargu, Alina Camelia, 2013, “Analysing the Financial Soundness of the Commercial Banks in Romania: an Approach Based on the Camels Framework”, Procedia Economics and Finance, 6, hal.703-712.
Rusydiana, Aam S dan Devi, Abrista, 2013, “Challenges in Developing Baitul Maal wat Tamwiil (BMT) in Indonesia using Analytic Network Process (ANP)”.
Sarjana I., 2014, “Pengaturan batas waktu pendaftaran jaminan fidusia pada undang-undang nomor 42 tahun 1999”, Jurnal Magister Hukum Udayana, 5(1).
Siamat, Dahlan, 2005, “Manajemen Lembaga Keuangan: Kebijakan Moneter & Perbankan-5/E”.
Sok-Gee, Chan, 2011, “Technical Efficiency of Commercial Banks in China: Decomposition into Pure Technical and Scale Efficiency”, International Journal of China Studies, 2(1), hal.27.
Stanton, AWB, Badger, C dan Sitzia, J. 2000, , “Non-invasive Assessment of the Lymphedematous Limb”, Lymphology, 33(3), hal.122-135.
Subandi dan Ghozali, Imam, 2013, “Determinan Efisiensi dan Dampaknya Terhadap Kinerja Profitabilitas Industri Perbankan di Indonesia”, Jurnal Keuangan dan Perbankan, 17(1), hal.123-135.
Supriyono, Edy, 2007, Penggunaan Pendekatan Service Gap untuk Pengukuran Pandangan Manajemen Berkenaan dengan Efektifitas Sistem Informasi Akuntansi Bank, pada Bank Pemerintah di Jawa Tengah. Diponegoro University.
Suyono, Agus, 2005, Analisis Rasio-Rasio Bank yang Berpengaruh terhadap Return on Asset (ROA). [Tesis]. Semarang: Universitas Diponegoro.
Tang, Helena, Zoli, Edda dan Klytchnikova, Irina, 2000, “Banking Crises in Transition Economies: Fiscal Costs and Related Issues”, World Bank Policy Research Working Paper, (2484).
Warganegara, Akmal Rangga Putra. 2011. Determinan Net Interest Margin Industri Perbankan Indonesia. [Tesis]. Jakarta (ID): Universitas Indonesia.
146 Bulletin of Monetary, Economics and Banking, Volume 18, Number 2, October 2015


![tworeal4u1@yahoo.com [mailto:tworeal4u1@yahoo.com]clkrep.lacity.org/onlinedocs/2015/15-1368_pc_01-25-16.pdf · From: Cameron Moore [mailto:kobys8@yahoo.com] Sent: Monday, January](https://static.documents.pub/doc/80x56/5e34bdff6a95ba262b2e2de7/tworeal4u1yahoocom-mailtotworeal4u1yahoocom-from-cameron-moore-mailtokobys8yahoocom.jpg)


![[XLS]inls.orginls.org/INLS-life-members-list-2016.xlsx · Web viewKhaniya M. nasnani76@yahoo.com FL Prakash prakashnepal7@yahoo.com Neupane Devraj devaneupane@yahoo.com Niraula Bimala](https://static.documents.pub/doc/80x56/5aed65b37f8b9ac36191c89f/xlsinls-viewkhaniya-m-nasnani76yahoocom-fl-prakash-prakashnepal7yahoocom.jpg)


