21
The Determinants of Market Interest Rates in Brazil Jose Franco Medeiros de Morais Washington DC, December 2008

The Determinants of Market Interest Rates in Brazil
Jose Franco Medeiros de Morais
Washington DC, December 2008
2
TABLE OF CONTENTS
1. Introduction 3
2. Determinants of Market Interest Rates 4
2.1 Closed Economy 4
2.2 Open Economy 12
3. The Term Structure of Interest Rates 16
4. Concluding Remarks 20
3
1. Introduction
According to economic models, equilibrium prices and quantities are
reached through the dynamic interaction between demand and supply. In the
capital markets , demand is given by borrowers, supply is given by lenders and
the price is represented by the interest rate. Besides being the capital market
clearing price, the level of interest rate is also a function of other economic
variables, such as inflation expectations and risk factors .
In most countries a short term interest rate is used as the monetary policy
tool, determined by the Central Bank according to its objective function, which is
usually a weight balance between inflation control and economic growth. This is
the case of Brazil, where the Central Bank formally adopts an inflation target
system in which the monetary policy tool is the Selic overnight rate, which is
currently targeted at 12.75%.
The aim of this paper is twofold. The first goal is to asses the determination
of the interest rates in Brazil, while the secondary objective is to show how the
term structure of interest rate has been affected by recent monetary policy
decisions on the overnight rate target.
Section 2 assesses the determinants of interest rates in Brazil according to
two different models. Section 2.1 considers a closed economy model in which
the nominal interest rate is formed by adding different types of risk premium to
the risk free real interest rate. Section 2.2, on the other hand, considers an open
economy and takes into account the interest rate differential in order to
4
establish a proxy for the risk premium. Both subsections present data based on
Brazilian government bonds and other financial instruments traded in either
domestic or international markets.
The relation between interest rate and time to maturity is given by the yield
curve and represents the term structure of interest rates. Section 3 briefly
describes yield curve theories and analyses how the yield curve in Brazil has
reacted to recent monetary policy decisions. Concluding remarks are presented
on section 4.
1. Determinants of Market Interest Rates
2.1 Closed Economy
Traditional economic models consider the market interest rate as a unique
rate which is the outcome from the interaction between demand and supply in
the capital markets. Nevertheless a microeconomic assessment of the capital
markets should also take into account other aspects such as the term structure
and the risk premium structure, which might affect either demand or supply side
of the market.
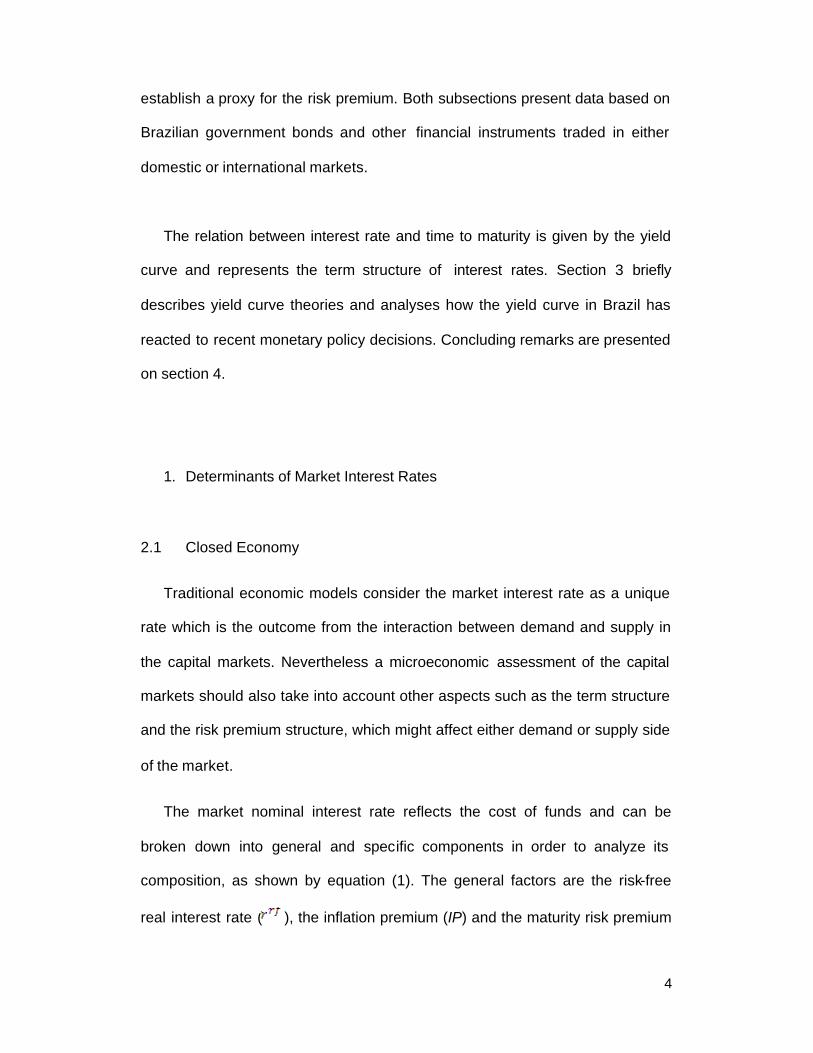
The market nominal interest rate reflects the cost of funds and can be
broken down into general and specific components in order to analyze its
composition, as shown by equation (1). The general factors are the risk-free
real interest rate ( ), the inflation premium (IP) and the maturity risk premium
5
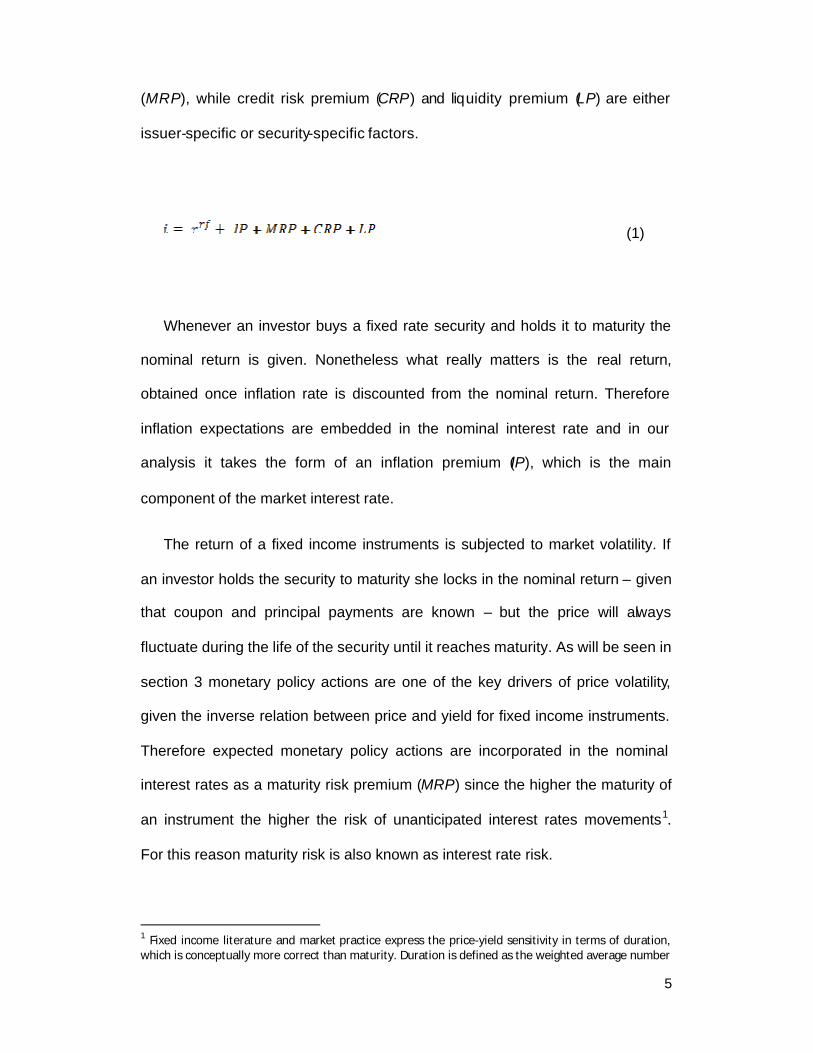
(MRP), while credit risk premium (CRP) and liquidity premium (LP) are either
issuer-specific or security-specific factors.
(1)
Whenever an investor buys a fixed rate security and holds it to maturity the
nominal return is given. Nonetheless what really matters is the real return,
obtained once inflation rate is discounted from the nominal return. Therefore
inflation expectations are embedded in the nominal interest rate and in our
analysis it takes the form of an inflation premium (IP), which is the main
component of the market interest rate.
The return of a fixed income instruments is subjected to market volatility. If
an investor holds the security to maturity she locks in the nominal return – given
that coupon and principal payments are known – but the price will always
fluctuate during the life of the security until it reaches maturity. As will be seen in
section 3 monetary policy actions are one of the key drivers of price volatility,
given the inverse relation between price and yield for fixed income instruments.
Therefore expected monetary policy actions are incorporated in the nominal
interest rates as a maturity risk premium (MRP) since the higher the maturity of
an instrument the higher the risk of unanticipated interest rates movements1.
For this reason maturity risk is also known as interest rate risk.
1 Fixed income literature and market practice express the price-yield sensitivity in terms of duration, which is conceptually more correct than maturity. Duration is defined as the weighted average number
6
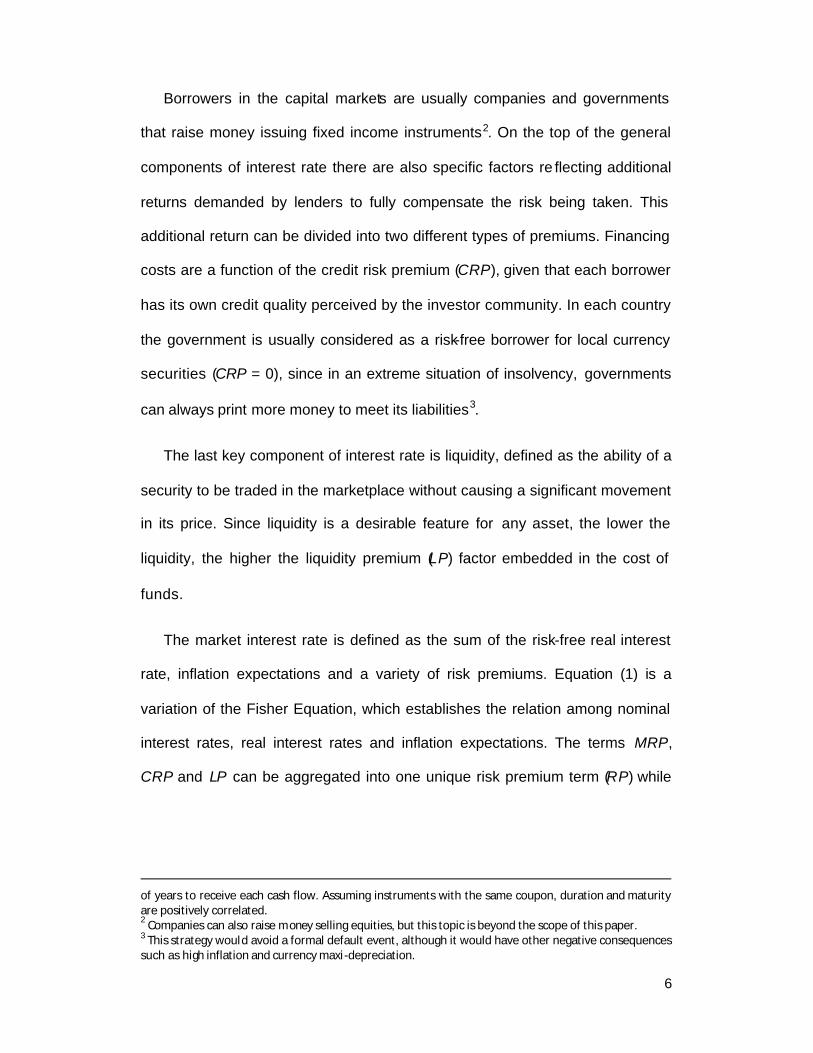
Borrowers in the capital markets are usually companies and governments
that raise money issuing fixed income instruments2. On the top of the general
components of interest rate there are also specific factors re flecting additional
returns demanded by lenders to fully compensate the risk being taken. This
additional return can be divided into two different types of premiums. Financing
costs are a function of the credit risk premium (CRP), given that each borrower
has its own credit quality perceived by the investor community. In each country
the government is usually considered as a risk-free borrower for local currency
securities (CRP = 0), since in an extreme situation of insolvency, governments
can always print more money to meet its liabilities3.
The last key component of interest rate is liquidity, defined as the ability of a
security to be traded in the marketplace without causing a significant movement
in its price. Since liquidity is a desirable feature for any asset, the lower the
liquidity, the higher the liquidity premium (LP) factor embedded in the cost of
funds.
The market interest rate is defined as the sum of the risk-free real interest
rate, inflation expectations and a variety of risk premiums. Equation (1) is a
variation of the Fisher Equation, which establishes the relation among nominal
interest rates, real interest rates and inflation expectations. The terms MRP,
CRP and LP can be aggregated into one unique risk premium term (RP) while
of years to receive each cash flow. Assuming instruments with the same coupon, duration and maturity are positively correlated. 2 Companies can also raise money selling equities, but this topic is beyond the scope of this paper. 3 This strategy would avoid a formal default event, although it would have other negative consequences such as high inflation and currency maxi-depreciation.
7
the inflation premium term, which reflects inflation expectations, can be
renamed , as shown in equation (2)4. The subscript t denotes time period.
(2)
Financial instruments issued on a regular basis and traded in the secondary
market can be used to estimate each term of the Fisher equation. The main
instruments issued by the National Treasury of Brazil in order to meet its
financing needs are LTN, NTN-F and NTN-B5. LTN and NTN-F are fixed rate
instruments, the difference being that the former is the Brazilian Treasury Bill
while the later is the Note with semi-annually coupon payments . Benchmark
tenors are 6, 12, 18 and 24 months for LTN and 3, 5 and 10 years for NTN-F.
NTN-B is an inflation protected instrument linked to the Consumer Price Index6.
It has several benchmark tenors, being 2045 the longest maturity.
Fixed rate bonds (LTN and NTN-F) can be used to derive the market
nominal interest rate i, while inflation protected bonds (NTN-B) provide a
metrics for the market real interest rate r. The risk premium term RP, which
incorporates both maturity and liquidity premia, can be derived as follows7. One
characteristic of Brazilian market is investor’s relative unwillingness to hold long
term fixed rate instruments, since most of them have high maturity – or interest
4 See Fischer (1930). 5 Ano ther important source of funds for the government, which is not part of the object of the analysis, is a floating rate note called LFT. 6 IPCA ( Indice de Preços ao Consumidor Amplo) . 7 Since the securities are Brazilian government bonds issued in the domestic market and denominated in the domestic currency, credit risk premium can be ignored.
8
rate – risk aversion. In order to minimize interest rate risk most investors hedge
their fixed rate positions through the interest rate future market, which happens
to be in general more liquid than the government bonds secondary market. DI is
the future interest rate contract traded in the Sao Paulo futures exchange BMF-
Bovespa8. Since LTN and NTN-F are traded at a premium to DI contracts, the
spread between the fixed rate bond and the DI future contract can be used as a
proxy for the term RP in equation (2).
Although expected inflation is not directly observable it can be implicitly
derived from the financial market, since fixed rate and inflation protected
instruments are tradable securities with reasonable liquidity, while a risk
premium proxy can be also observed from liquid financial instruments. Market
inflation expectations can be derived residually as shown by equation (3), where
the term is the market implicit inflation expectation, also known as
breakeven inflation, given that it is the inflation expectation that makes an
investor indifferent between holding a fixed rate note or an inflation protected
note of similar maturity9.
(3)
Brazilian financial market, particularly the government bonds market, allows
the decomposition of the nominal interest rates into its components r, pe and
8 DI contracts mature monthly in the four months following the trade and quarterly afterwards. 9 From a purely technical perspective duration would be a more appropriate metrics than maturity.

9
RP. Figure (1) shows each component of equation (3), considering the January
2010 LTN, the November 2009 NTN-B and the January 2010 DI future
contract10. The breakeven inflation can be interpreted as the annual inflation
implied by financial market instruments and consequently it can be considered
as the annual inflation rate expected by financial agents. It reflects the dynamics
between fixed rate and inflation protected instruments, which is driven by
inflation expectations and other domestic and international economic factors, as
well as by technical factors such as liquidity.
Figure 1: Components of the Fisher Equation Given By Financial
Instruments
Source: ANDIMA11
10 Although LTN and NTN-B maturities are not exactly the same, they are sufficiently close to each other and it does not compromise the analysis. Alternatively a synthetic instrument could be created by interpolation in order to match the exact maturity. 11 ANDIMA is the National Association of Financial Markets Institutions.

10
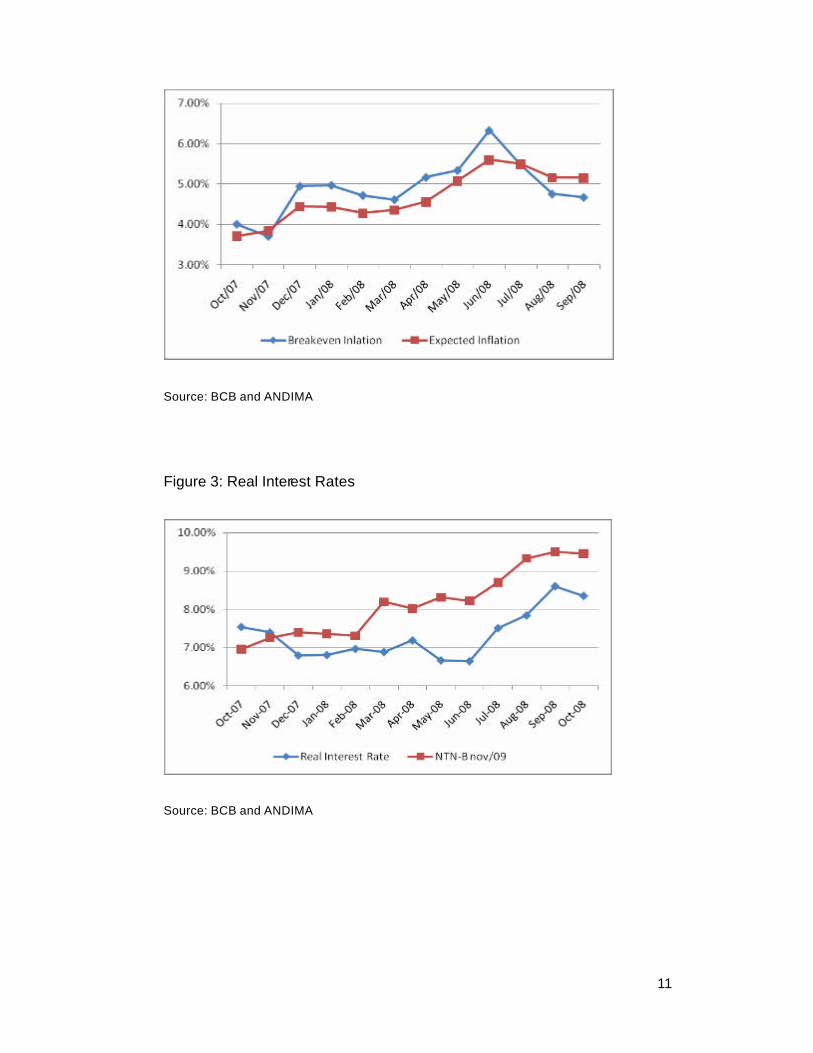
The breakeven inflation derived from financial instruments can be compared
to the inflation expected by financial institutions, which are compiled and
published by the Central Bank of Brazil on a regular basis 12. Figure (2) presents
both time series for the period between October 2007 and October 2008. As
expected there is a high correlation between them, although breakeven inflation
seems to move more sharply as opposed to expected inflation, which presents
a more smooth behavior. One possible explanation is that trading desks react
quickly and might sometimes overreact to new information, while economists
have a more conservative approach and take longer to incorporate new
information into their analysis. Anyway, discrepancies between breakeven
inflation and actual inflation expectations represent short term arbitrage
opportunities that are removed sooner or later, depending on how efficient
financial markets are. As a result there will necessarily be a long term
correlation between breakeven inflation and expected inflation.
Other interesting comparison to be made is between real interest rates
based on financial instruments and based on economist’s inflation expectations.
The former is given by the market yield of the inflation protected instrument,
while the later was calculated subtracting inflation expectations from the current
selic rate. As can be seen by figure (3), both series move in the same direction
and again financial market’s reaction seems to be more intense than
economist’s reaction.
Figure 2: Breakeven and Expected Inflation
12 The Focus Report is a periodic poll conducted by the Central Bank of Brazil in which the main financial institutions disclose their formal inflation expectations. The participation is voluntary and the Central Bank publishes not only the inflation expectations statistics, but also the top-five list, composed by the institutions with the highest track record of forecasts. The rationale behind that is to incentive institutions to provide its forecasts as accurately as possible.
11
Source: BCB and ANDIMA
Figure 3: Real Interest Rates
Source: BCB and ANDIMA
12
2.2 Open Economy
The Fisher equation is a useful tool for interest rates assessment given that
economic and financial agents are focused on real returns and therefore
discounting inflation expectations and eventual risk premium from the current
nominal interest rate makes a lot of sense. Nonetheless the closed economy
model restricts the analysis, for it does not incorporate international capital
flows, which is a consequence of international trading.
The objective of financial agents is to maximize returns , subject to a given
level or risk. Therefore the balance between return and risk, represented
respectively by interest rate differentials and exchange rate movements, will be
the key driver of international capital flows. Although the interest rate differential
is known at the beginning of the investment period, exchange rate movements
can either enhance or diminish returns, which are measured in the investor’s
own currency. No-arbitrage conditions in the financial markets guarantee that
the interest rate differential equals expected exchange rate variations, adjusted
by a risk premium term. In other words, under no-arbitrage equilibrium, the
expected rate of return on a domestic asset and the rate of return on a foreign
asset must be equivalent when converted to the same currency and adjusted
for risk. This relation is known as uncovered interest differential (UID), shown by
equation (4), where i represents the domestic interest rate, i* the international
interest rate, s the exchange rate and rp the risk premium. The last term is
country-specific and can be interpreted as any political, social or legal event that
could affect currency convertibility and restrict capital outflows. As usual, the
subscript t denotes time-period.
13
(4)
Besides the usual risk premium, UID implies a second type of risk given by
the uncertainty regarding the exchange rate path. In fact, if , as it
usually is, the expected return will differ from the actual return. In order to avoid
the exchange rate risk, institutional investors can hedge – or cover – the
currency risk via futures markets. By covering the exchange rate risk the
international capital flow relation becomes the covered interest differential
(CID), presented by equation (5). The term represents the future exchange
rate, agreed on period t to be settled on period t+j. Arbitrage conditions in the
international financial market guarantees that ,
otherwise it would be possible to make a profit without putting any amount of
capital upfront and without incurring any risk13.
(5)
13 I f , a US investor can borrow USD at the cost of ( ), buy BRL in the spot market and make an investment in Brazil yielding . At period t + j the proceeds will be
converted back to USD at the exchange rate , agreed previously at period t. The final profit will be
given by the differential . Arbitrage opportunities represent market inefficiencies and usually are immediately corrected. If the inequality holds for a longer period, there is certainly a country risk premium involved and the situation can no longer be described as an arbitrage risk-free opportunity.
14
The combination of interest rate differentials among countries and a
reasonable level of development in the derivatives markets provide quite a few
opportunities of covered carry trades, which is the investment strategy based on
borrowing in low interest rate currencies, such as JPY and USD, and investing
in high interest rate currencies, such as BRL and NZD. The return of such an
investment can be interpreted as the country risk premium, as shown by
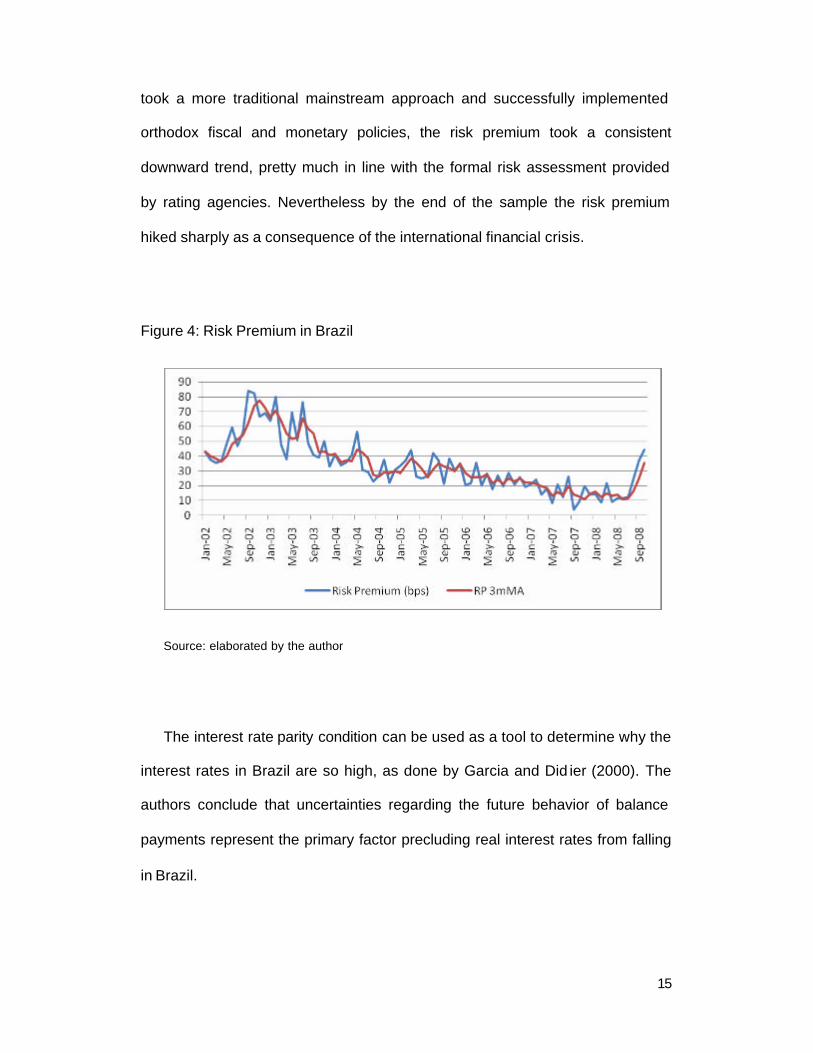
equation (6). Figure (4) presents an estimate of the risk premium in Brazil, as
described by equation (6), for the period comprised between January 2002 and
October 2008. This is a typical carry trade in which the initial loan was taken in
USD at the cost of the fed fund rate ( ) and used to buy BRL through the spot
FX market ( ). The return of such investment strategy is given by the Brazilian
selic rate ( ), which will be converted back to USD by the BMF-Bovespa one-
month future contract ( ). Since the investor is fully covered against
exchange rate movements, the only risk taken is considered country-specific,
such as political instability, capital controls and changes in the legal system.
(6)
Financial markets data can be extremely volatile, reflecting not only financial
agent’s usual overreaction, but also the lack of liquidity at some specific dates.
In order to avoid short term volatility in the long term analysis, the three-month
moving average smoothing factor is also plotted in figure (4). It can be seen that
during 2002 the risk premium increased dramatically in Brazil as a result of the
elections outcome, which empowered a leftist party. Once the new government
15
took a more traditional mainstream approach and successfully implemented
orthodox fiscal and monetary policies, the risk premium took a consistent
downward trend, pretty much in line with the formal risk assessment provided
by rating agencies. Nevertheless by the end of the sample the risk premium
hiked sharply as a consequence of the international financial crisis.
Figure 4: Risk Premium in Brazil
Source: elaborated by the author
The interest rate parity condition can be used as a tool to determine why the
interest rates in Brazil are so high, as done by Garcia and Did ier (2000). The
authors conclude that uncertainties regarding the future behavior of balance
payments represent the primary factor precluding real interest rates from falling
in Brazil.
16
2. The Term Structure of Interest Rates
The term structure of interest rates describes the relationship between short,
medium and long term rates at a given point in time. It is represented by the
yield curve and provides the primary source of price discovery for fixed income
instruments. The normal shape of the yield curve is upward sloping, which is
consistent with the risk assessment presented in section 2.1. In fact interest
rates reflect a composition of different types of risks and most of them are either
stable over time or positively correlated to time to maturity. The longer the
timeframe, the higher the market – or interest rate – risk, while credit risk is
assumed to be constant over time14. Therefore market expects to receive a
higher yield in order to compensate for the higher risk of long term instruments
and as a consequence the normal shape of the yield curve is considered to be
upward sloping.
The literature on yield curves considers at least three theories that attempt
to explain the term structure of interest rates. According to the Pure
Expectations Theory, no arbitrage conditions guarantee that long term interest
rate is a good predictor of the future short term interest rate. In other words, the
long term interest rate can be seen as a geometric mean of a series of short
term interest rate. The Liquidity Preference Theory states not only that the long
term interest rate reflects market expectations of the short term interest rate, but
also that lenders demand a risk premium in order to lock in the interest rate for
a longer period. Because of this term premium, the yield curve is supposed to
14 Credit risk could also be assumed to be positively correlated to time to maturity, since uncertainties regarding the capacity of solvency tend to be higher in the long term than in the short term.

17
be upward slopping. According to the Market Segmentation Theory, the investor
base is formed by different investors with different preferences over term to
maturity. Since there are fewer investors willing to hold long term instruments,
this sector of the curve is expected to offer higher yields. A more complete
analysis of term structure theories can be found on Fabozzi (2002).
The yield curve contains a fair amount of information, reflecting financial
markets expectations regarding inflation, monetary policy, fiscal policy, business
cycles and overall risk assessment. Longer term interest rates can also be
considered as the market expectations regarding the overnight interest rate to
be set by the monetary authority in the future. Therefore it is possible that under
certain conditions the yield curve presents alternative shapes that are not
upward sloping. A downward sloping yield curve indicates that the monetary
authority is expected to lower interest rates in the future, as a result of either
controlled inflation or poor growth prospects 15. The yield curve can also be flat,
signaling that interest rate is expected to be constant over time or reflecting a
lack of consensus regarding future actions of the monetary authority. Another
possibility is a combination of the three cases, since short and medium term
expectations can differ from long term expectations. A hump-shaped yield
curve, for instance, indicates that interest rates are likely to increase
momentarily in the medium term and decrease again in the long term.
15 An inverted yield curve in Brazil is usually a good signal, because it is associated with lack of inflationary pressure and consequently with a decreasing path for the domestic interest rate, which is excessively high relative to international standards. On the other hand an inverted yield curve in the US economy can be a bad signal because it usually reflects a decreasing path for interest rates due to poor growth expectations. In the US economy yield curve inversion has been historically a good indicator of future recession or at least poor economic activity.
18
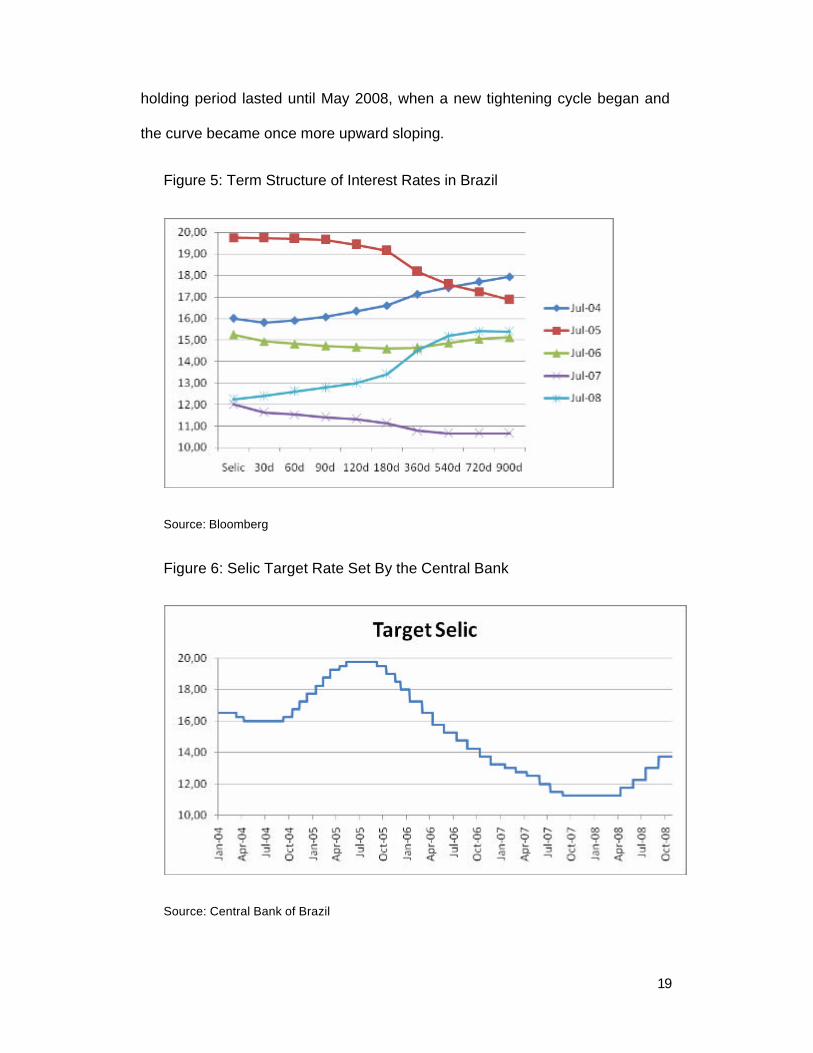
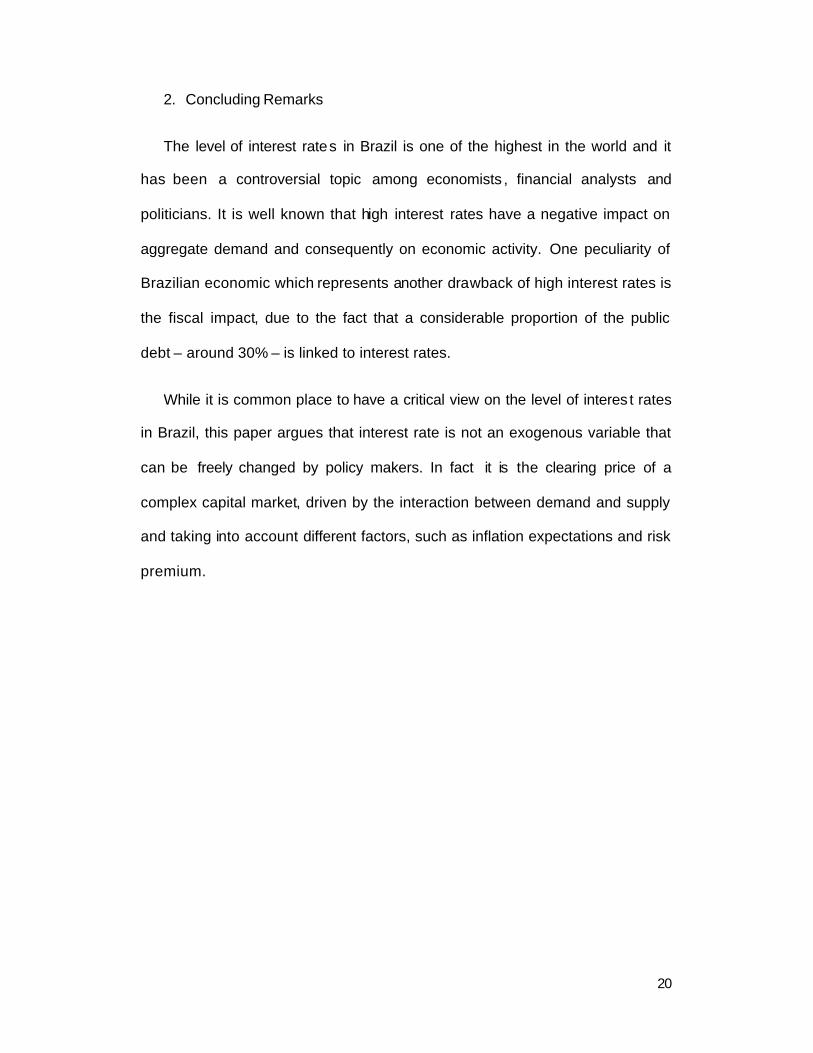
The yield curve in Brazil can be constructed using either government bonds
(LTN and NTN-F) or derivative instruments, such as interest rates future
contracts or interest rates swaps16. Figure (5) presents the yield curve based
upon swap contracts traded in BMF-Bovespa futures exchange at different
points in time, while figure (6) presents the selic rate established by the
COPOM committee at the Central Bank of Brazil17. The joint analysis of figures
(5) and (6) allows us to measure how well the yield curve in Brazil has been
acting as a predictor of the selic interest rate path. In July 2004 the yield curve
was hump-shaped, with the 30-day rate lower than the overnight rate and the
curve becoming upward sloping afterwards. In fact, in October 2004 the Central
Bank started a tightening cycle. In July 2005 the curve were relatively flat in the
short part and downward -sloping in the medium and short parts. The easing
cycle started three months later in October 2005. In July 2006 the curve was
hump-shaped again, signaling that market expected the then current easing
cycle to be short lived and to reach 14.75% at its minimum level. As a matter of
fact the easing cycle was longer and its intensity much higher than market
expectations at that time and the selic rate reached 11.75% in September 2007.
After being surprised the market adjusted its expectations and in July 2007 the
curve was once again fully inverted, with the long part of the curve at 10.75%.
Nevertheless the history shows that at that time markets were over-optimistic,
given that the easing cycle ended two months later, in September 2007. The
16 Interest rates futures are the DI contracts described in section 2.1, while interest rates swap is an agreement between two parties to exchange a stream of future interest rates payment on a principal amount. One party will pay a fixed interest rate and the other will pay a floating interest rate, which in Brazil will be given by the selic rate. 17 There are two reasons for building the yield curve upon swap contracts. The first is liquidity and the second is the fact that swap contracts have a fixed tenor, unlike DI contracts and government bonds that have the maturity date fixed and as a result the tenor decreases by one day on a daily basis.
19
holding period lasted until May 2008, when a new tightening cycle began and
the curve became once more upward sloping.
Figure 5: Term Structure of Interest Rates in Brazil
Source: Bloomberg
Figure 6: Selic Target Rate Set By the Central Bank
Source: Central Bank of Brazil
20
2. Concluding Remarks
The level of interest rates in Brazil is one of the highest in the world and it
has been a controversial topic among economists , financial analysts and
politicians. It is well known that high interest rates have a negative impact on
aggregate demand and consequently on economic activity. One peculiarity of
Brazilian economic which represents another drawback of high interest rates is
the fiscal impact, due to the fact that a considerable proportion of the public
debt – around 30% – is linked to interest rates.
While it is common place to have a critical view on the level of interes t rates
in Brazil, this paper argues that interest rate is not an exogenous variable that
can be freely changed by policy makers. In fact it is the clearing price of a
complex capital market, driven by the interaction between demand and supply
and taking into account different factors, such as inflation expectations and risk
premium.
21
References
Fabozzi, Frank (2002). Interest Rate, Term Structure and Valuation
Modeling. Wiley, 1st edition.
Fisher, Irving (1930). The Theory of Interest. The Macmillan Company.
Garcia, Marcio and Didier, Tatiana (2000). Very High Interest Rates and the
Cousin Risks: Brazil During the Real Plan. Pontifical Catholic University of Rio
de Janeiro (PUC – Rio), Discussion Paper n. 441.


