The Development and Decline of Hawaii's Skipjack Tuna Fishery CHRISTOFER H. BOGGS and BERT S. KIKKAWA Introduction Historically, the pole-and-line, live- bait fishery for skipjack tuna, Katsuwonus pelamis, was the largest commercial fishery in Hawaii. Annual pole-and-line landings of skipjack tuna exceeded 2,500 metric tons (t) or 5.5 million Ib from 1937 to 1973 (June, 1951; Yamashita, 1958; Uchida, 1976; Skillman, 1987; Kikkawa 1 ), except during World War II (1941--45). The record production of 7,400 t (16.3 mil- lion Ib) of all species landed in 1965 by the pole-and-line fishery was un- surpassed until 1991, when the Hawaii longline fishery landed 8,000 t (all spe- cies combined). Even so, at its largest, I Bert S. Kikkawa. An update of the skipjack tuna, Katsuwonus pelamis, baitboat fishery in Hawaii, 1971-83. Honolulu Lab., Southwest Fish. Sci. Cent., NMFS, 2570 Dole St., Hono- lulu, HI 96822-2396, unpub!. manuscr. ABSTRACT-The pole-and-line fishery for skipjack tuna, Katsuwonus pelamis, was the largest commercial fishery in Hawaii until its decline in the 1970's and 1980's. The development and decline of the fish- ery were strongly affected by fish avail- ability and marketing. A sustained drop in the availability of large fish in the mid- 1970's appears to have been due in part to a sustained environmental change. Avail- ability of largefish subsequently increased, but the fishery continued its decline owing to low profitability and lack of markets. The tuna cannery in Honolulu that fos- tered thefishery's expansion in the 1930's closed in 1984. Unless efforts to increase the marketfor skipjack tuna become effec- tive, landings will probably remain at cur- rent levels of about 1,000 metric tons per year. The existing pole-and-line fleet may continue to decline with age, and the local market may eventually be supplied by other fishing methods (e.g., trolling), by new ves- sels, or by imports. 55(2), 1993 the Hawaii skipjack tuna catch was small compared with the total Pacific catch of this species (ca. 870,000 t in 1990; IATTC, 1992; Hampton, In press). The Hawaii skipjack tuna fishery originally supplied only the local mar- ket for fresh and dried tuna. The fish- ery expanded in the 1900' s because the ready availability of skipjack tuna was sufficient to support a cannery which provided access to outside mar- kets. A sustained drop in the catch per unit effort (CPUE) of large (>6.8 kg, >15 Ib) skipjack tuna began in 1974. The decrease in CPUE was related to environmental changes affecting local fish availability (Mendelssohn 2 ; Boggs, 1988). Combined with increased fish- ing costs, market competition from other tuna products, and the 1984 clo- sure of the Hawaiian Tuna Packers, Ltd. cannery in Honolulu, these fac- tors caused a major decline in Hawaii's skipjack tuna fishery during the late 1970' sand 1980's (Boggs and Pooley, 1987; Hudgins and Pooley, 1987). The fishery has not recovered. Expanding fisheries for skipjack tuna throughout the Pacific (Forsbergh, 1980; IATTC, 1992; Hampton, In press) do not appear to have caused the decline in Hawaii's fishery (Boggs and Pooley, 1987; Kearney, 1987; Sibert, 1987), although further analyses may reveal negative impacts. Skipjack tuna are relatively impervious to overfish- ing (Boggs and Pooley, 1987; Hamp- ton, In press) due to widespread distri- bution and reproduction, rapid growth, early maturity (Matsumoto et aI., 1984), 2R. Mendelssohn. 1986. Environmental influ- ences on skipjack tuna availability. U.S. Dep. Commer., NOAA, Nat!. Mar. Fish. Serv., South- west Fish. Cent., Honolulu Lab., Southwest Fish. Cent. Admin. Rep. H-86-l3C, 14 p. and frequent spawning (Hunter et aI., 1986). Unlike populations of larger tuna species (Miyabe, In press; Suzuki, In press) and marlins (Suzuki, 1989), skipjack tuna appear to be underexploited (Kleiber et aI., 1983; Hampton, In press). The absence of regulation in Hawaii's skipjack tuna fishery contrasts with the management of Hawaii's fish- eries for other tunas and billfish (Boggs and Ito, 1993), and is justified by the apparent underexploitation of the stock and the declining size of the local fish- ery. This review describes the Hawaii skipjack tuna fishery, its development through the 1970' s, and subsequent decline. Research on factors contribut- ing to the decline are summarized and the fishery community's attempts at revitalization are described. Description and Historical Development In Hawaii, skipjack tuna, commonly called by its Hawaiian name "aku," is mostly caught by pole-and-line fishing (e.g., >99% through 1974, 72% in 1990). This method uses live bait thrown from a fishing vessel to stimu- late a surface school into a feeding frenzy. Fishing is then conducted fran- tically to take advantage of the limited time the school remains near the boat. The pole and line are of equal length (ca. 3 m) and are used with a barbless hook with feather skirts which is slapped against the water until a fish strikes. Then the fish is yanked into the vessel in one motion. The fish un- hooks when the line is slacked so that the process can be repeated. The authors are with the Honolulu Laboratory, Southwest Fisheries Science Center, National Marine Fisheries Service, NOAA, 2570 Dole Street, Honolulu, HI 96822-2396. 61
Transcript
The Development and Decline of Hawaii's Skipjack Tuna Fishery
CHRISTOFER H. BOGGS and BERT S. KIKKAWA
Introduction
Historically, the pole-and-line, livebait fishery for skipjack tuna, Katsuwonus pelamis, was the largest commercial fishery in Hawaii. Annual pole-and-line landings of skipjack tuna exceeded 2,500 metric tons (t) or 5.5 million Ib from 1937 to 1973 (June, 1951; Yamashita, 1958; Uchida, 1976; Skillman, 1987; Kikkawa1), except during World War II (1941--45). The record production of 7,400 t (16.3 million Ib) of all species landed in 1965 by the pole-and-line fishery was unsurpassed until 1991, when the Hawaii longline fishery landed 8,000 t (all species combined). Even so, at its largest,
I Bert S. Kikkawa. An update of the skipjack tuna, Katsuwonus pelamis, baitboat fishery in Hawaii, 1971-83. Honolulu Lab., Southwest Fish. Sci. Cent., NMFS, 2570 Dole St., Honolulu, HI 96822-2396, unpub!. manuscr.
ABSTRACT-The pole-and-line fishery for skipjack tuna, Katsuwonus pelamis, was the largest commercial fishery in Hawaii until its decline in the 1970's and 1980's. The development and decline of the fishery were strongly affected by fish availability and marketing. A sustained drop in the availability of large fish in the mid1970's appears to have been due in part to a sustained environmental change. Availability oflarge fish subsequently increased, but the fishery continued its decline owing to low profitability and lack of markets. The tuna cannery in Honolulu that fostered thefishery's expansion in the 1930's closed in 1984. Unless efforts to increase the marketfor skipjack tuna become effective, landings will probably remain at current levels of about 1,000 metric tons per year. The existing pole-and-line fleet may continue to decline with age, and the local market may eventually be supplied by other fishing methods (e.g., trolling), by new vessels, or by imports.
55(2), 1993
the Hawaii skipjack tuna catch was small compared with the total Pacific catch of this species (ca. 870,000 t in 1990; IATTC, 1992; Hampton, In press).
The Hawaii skipjack tuna fishery originally supplied only the local market for fresh and dried tuna. The fishery expanded in the 1900' s because the ready availability of skipjack tuna was sufficient to support a cannery which provided access to outside markets. A sustained drop in the catch per unit effort (CPUE) of large (>6.8 kg, >15 Ib) skipjack tuna began in 1974. The decrease in CPUE was related to environmental changes affecting local fish availability (Mendelssohn2; Boggs, 1988). Combined with increased fishing costs, market competition from other tuna products, and the 1984 closure of the Hawaiian Tuna Packers, Ltd. cannery in Honolulu, these factors caused a major decline in Hawaii's skipjack tuna fishery during the late 1970' sand 1980' s (Boggs and Pooley, 1987; Hudgins and Pooley, 1987). The fishery has not recovered.
Expanding fisheries for skipjack tuna throughout the Pacific (Forsbergh, 1980; IATTC, 1992; Hampton, In press) do not appear to have caused the decline in Hawaii's fishery (Boggs and Pooley, 1987; Kearney, 1987; Sibert, 1987), although further analyses may reveal negative impacts. Skipjack tuna are relatively impervious to overfishing (Boggs and Pooley, 1987; Hampton, In press) due to widespread distribution and reproduction, rapid growth, early maturity (Matsumoto et aI., 1984),
2R. Mendelssohn. 1986. Environmental influences on skipjack tuna availability. U.S. Dep. Commer., NOAA, Nat!. Mar. Fish. Serv., Southwest Fish. Cent., Honolulu Lab., Southwest Fish. Cent. Admin. Rep. H-86-l3C, 14 p.
and frequent spawning (Hunter et aI., 1986). Unlike populations of larger tuna species (Miyabe, In press; Suzuki, In press) and marlins (Suzuki, 1989), skipjack tuna appear to be underexploited (Kleiber et aI., 1983; Hampton, In press). The absence of regulation in Hawaii's skipjack tuna fishery contrasts with the management of Hawaii's fisheries for other tunas and billfish (Boggs and Ito, 1993), and is justified by the apparent underexploitation of the stock and the declining size of the local fishery.
This review describes the Hawaii skipjack tuna fishery, its development through the 1970' s, and subsequent decline. Research on factors contributing to the decline are summarized and the fishery community's attempts at revitalization are described.
Description and Historical Development
In Hawaii, skipjack tuna, commonly called by its Hawaiian name "aku," is mostly caught by pole-and-line fishing (e.g., >99% through 1974, 72% in 1990). This method uses live bait thrown from a fishing vessel to stimulate a surface school into a feeding frenzy. Fishing is then conducted frantically to take advantage of the limited time the school remains near the boat. The pole and line are of equal length (ca. 3 m) and are used with a barbless hook with feather skirts which is slapped against the water until a fish strikes. Then the fish is yanked into the vessel in one motion. The fish unhooks when the line is slacked so that the process can be repeated.
The authors are with the Honolulu Laboratory, Southwest Fisheries Science Center, National Marine Fisheries Service, NOAA, 2570 Dole Street, Honolulu, HI 96822-2396.
61
The bait most often used is the anchovy Encrasicholina purpureas, commonly called by its Hawaiian name "nehu." Each fishing vessel seines for bait in bays, harbors, and other sheltered waters, and the bait is not "hardened" for long-term transport or for use more than a few days after capture. The fishery is limited to areas close to the eight main Hawaiian Islands. Skipjack tuna are located by searching for bird flocks associated with surface schools. Fishing trips seldom last longer than a day, and most vessels return to port each night.
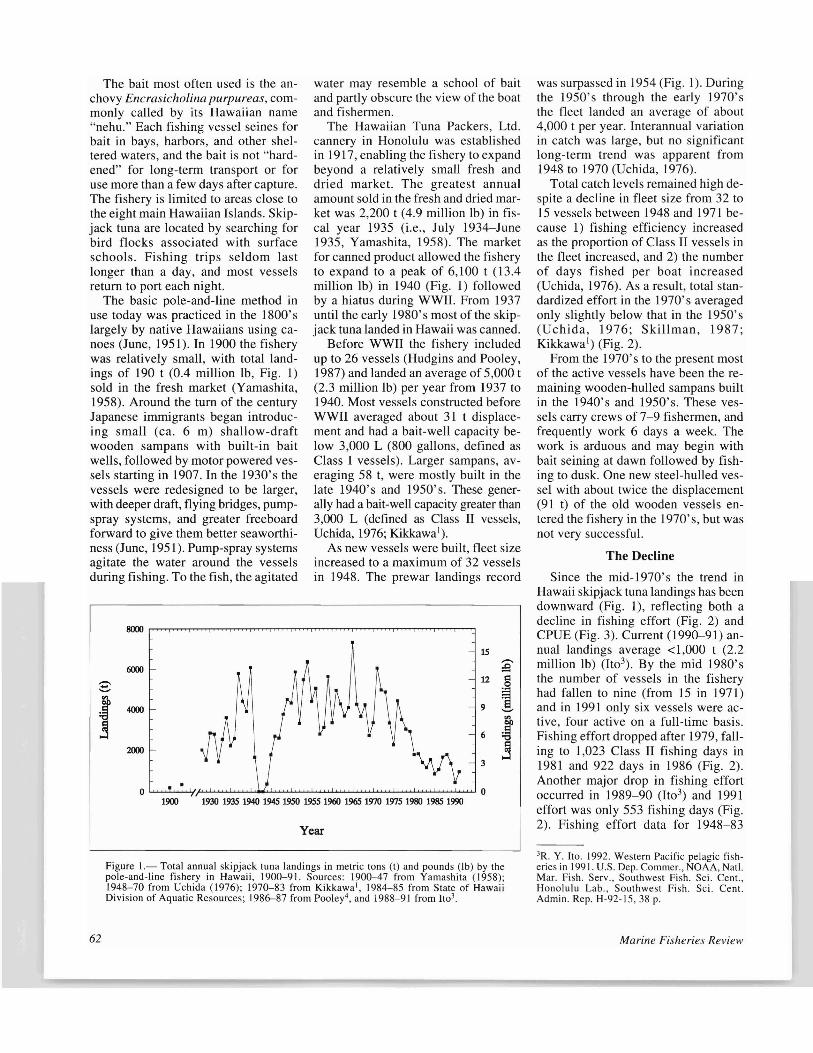
The basic pole-and-line method in use today was practiced in the 1800' s largely by native Hawaiians using canoes (June, 1951). In 1900 the fishery was relatively small, with total landings of 190 t (0.4 million Ib, Fig. 1) sold in the fresh market (Yamashita, 1958). Around the tum of the century Japanese immigrants began introducing small (ca. 6 m) shallow-draft wooden sampans with built-in bait wells, followed by motor powered vessels starting in 1907. In the 1930' s the vessels were redesigned to be larger, with deeper draft, flying bridges, pumpspray systems, and greater freeboard forward to give them better seaworthiness (June, 1951). Pump-spray systems agitate the water around the vessels during fishing. To the fish, the agitated
water may resemble a school of bait and partly obscure the view of the boat and fishermen.
The Hawaiian Tuna Packers, Ltd. cannery in Honolulu was established in 1917, enabling the fi shery to expand beyond a relatively small fresh and dried market. The greatest annual amount sold in the fresh and dried market was 2,200 t (4.9 million lb) in fiscal year 1935 (i.e., July 1934-June 1935, Yamashita, 1958). The market for canned product allowed the fishery to expand to a peak of 6,100 t (13.4 million Ib) in 1940 (Fig. 1) followed by a hiatus during WWII. From 1937 until the early 1980's most of the skipjack tuna landed in Hawaii was canned.
Before WWII the fishery included up to 26 vessels (Hudgins and Pooley, 1987) and landed an average of 5,000 t (2.3 million Ib) per year from 1937 to 1940. Most vessels constructed before WWII averaged about 31 t displacement and had a bait-well capacity below 3,000 L (800 gallons, defined as Class I vessels). Larger sampans, averaging 58 t, were mostly built in the late 1940's and 1950's. These generally had a bait-well capacity greater than 3,000 L (defined as Class II vessels, Uchida, 1976; Kikkawa l ).
As new vessels were built, fleet size increased to a maximum of 32 vessels in 1948. The prewar landings record
Figure 1.- Total annual skipjack tuna landings in metric tons (t) and pounds (lb) by the pole-and-line fishery in Hawaii, 1900-91. Sources: 1900-47 from Yamashita (1958); 1948-70 from Uchida (1976); 1970-83 from Kikkawa I, 1984-85 from State of Hawaii Division of Aquatic Resources; 1986-87 from Pooley4, and 1988-91 from It0 3
62
was surpassed in 1954 (Fig. I). During the 1950's through the early 1970's the fleet landed an average of about 4,000 t per year. Interannual variation in catch was large, but no significant long-term trend was apparent from 1948 to 1970 (Uchida, 1976).
Total catch levels remained high despite a decline in fleet size from 32 to 15 vessels between 1948 and 1971 because 1) fishing efficiency increased as the proportion of Class II vessels in the fleet increased, and 2) the number of days fished per boat increased (Uchida, 1976). As a result, total standardized effort in the 1970' s averaged only slightly below that in the 1950's (Uchida, 1976; Skillman, 1987; Kikkawa l ) (Fig. 2).
From the 1970's to the present most of the active vessels have been the remaining wooden-hulled sampans built in the 1940's and 1950's. These vessels carry crews of 7-9 fishermen, and frequently work 6 days a week. The work is arduous and may begin with bait seining at dawn followed by fishing to dusk. One new steel-hulled vessel with about twice the displacement (91 t) of the old wooden vessels entered the fishery in the 1970' s, but was not very successful.
The Decline
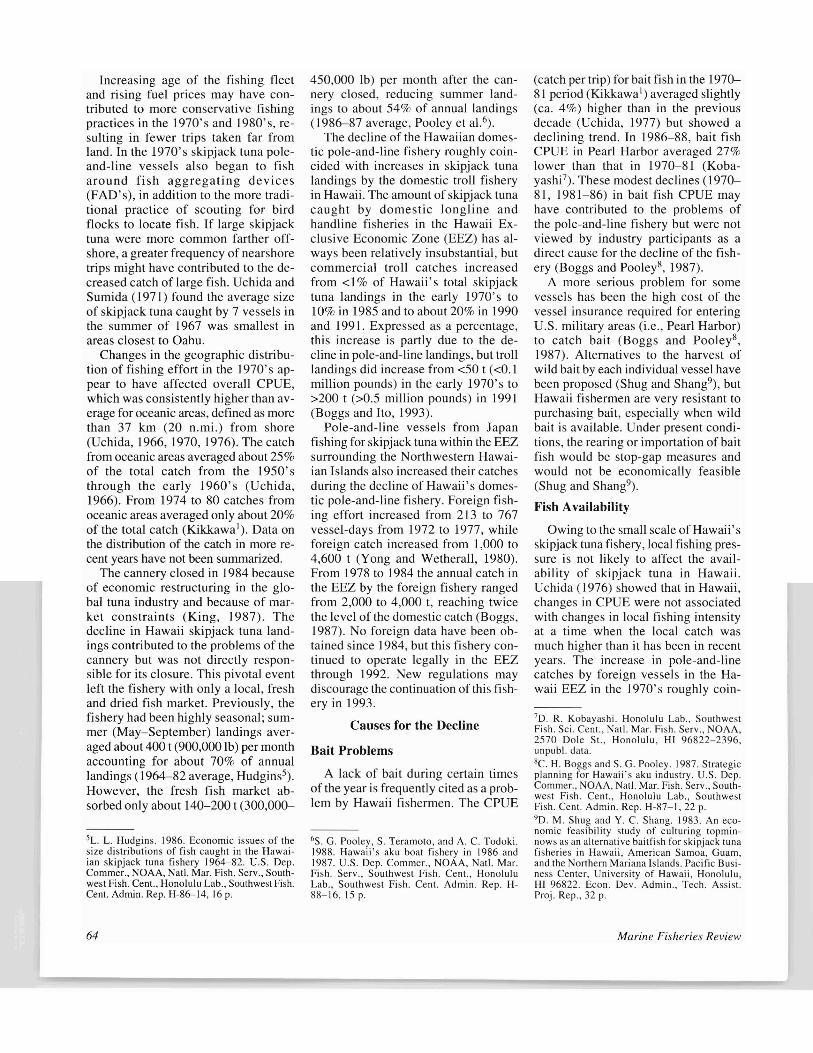
Since the mid-1970's the trend in Hawaii skipjack tuna landings has been downward (Fig. 1), reflecting both a decline in fishing effort (Fig. 2) and CPUE (Fig. 3). Current (1990-91) annual landings average <1,000 t (2.2 million Ib) (Ito3). By the mid 1980's the number of vessels in the fishery had fallen to nine (from 15 in 1971) and in 1991 only six vessels were active, four active on a full-time basis. Fishing effort dropped after 1979, falling to 1,023 Class II fishing days in 1981 and 922 days in 1986 (Fig. 2). Another major drop in fishing effort occurred in 1989-90 (It03) and 1991 effort was only 553 fishing days (Fig. 2). Fishing effort data for 1948-83
JR. Y. Ito. 1992. Western Pacific pelagic fisheries in 1991. U.S. Dep. Commer., NOAA, Natl. Mar. Fish. Serv., Southwest Fish. Sci. Cent., Honolulu Lab., Southwest Fish. Sci. Cent. Admin. Rep. H-92-15, 38 p.
Marine Fisheries Review
3IXXJ
2500 ,....., ~
"0 2000......, 1::;g 1500 4)
t>Il
] 1000
~ 500
1950 1955 1960 1965 1970 1975 1980 1985 1990
Year
4
.".. Total 8000
3 ,.....,,....., 6000
~
a ~ ~ ......, ......,
4000~ ~ ~ ~
2
2000
1950 19S5 1960 1965 1970 1975 1980 1985 1990
Year
the fleet also changed in the 1970's. At the height of the fishery in the 1950' s and 1960' s, several vessels were based on the islands of Hawaii and Maui, and sizable catches came from the northeast coasts of these islands (Uchida, 1970). In the 1970' sand 1980's most of the catch came from areas around Oahu, Kauai, Molokai, and Lanai (Kikkawa'). Presently all of the vessels work out of Kewalo Basin or Kaneohe Bay on Oahu.
Figure 2.- Total annual fishing effort (in days) by the Figure 3.- Annual skipjack tuna CPUE in metric tons (t) and pole-and-line fishery in Hawaii, 1948-91. Effort data for pounds (lb) per vessel per day for all sizes (total) and large fish 1948-83 and 1986-87 are standardized (Uchida, 1976; (>6.8 kg or 151b), 1948-91. Sources as given in Figures I and 4. Kikkawa l ). Sources as given in Figure I.
(Uchida, 1976; Kikkawa 1) and for 1986-87 (POOley4) were standardized (Fig. 2) to account for zero-catch trips and relative efficiency (Class I versus Class II). Data for 1984-85 and 1988-91 were summary statistics without the information required for standardization. The importance of standardization was minimal after 1987 because the 1988-91 data included zero-catch trips and contained primarily Class II fishing days.
Catch rates (CPUE in t1Class II fishing day) exhibited a declining trend in the 1970's and 1980's (Fig. 3). The high degree of interannual variability in CPUE was typical of geographically restricted surface fisheries for skipjack tuna, but the declining trend was unusual. In particular, the drop in CPUE for large (>6.8 kg, >15 Ib) skipjack tuna in 1974 was extreme and was sustained though 1987 (Fig. 3).
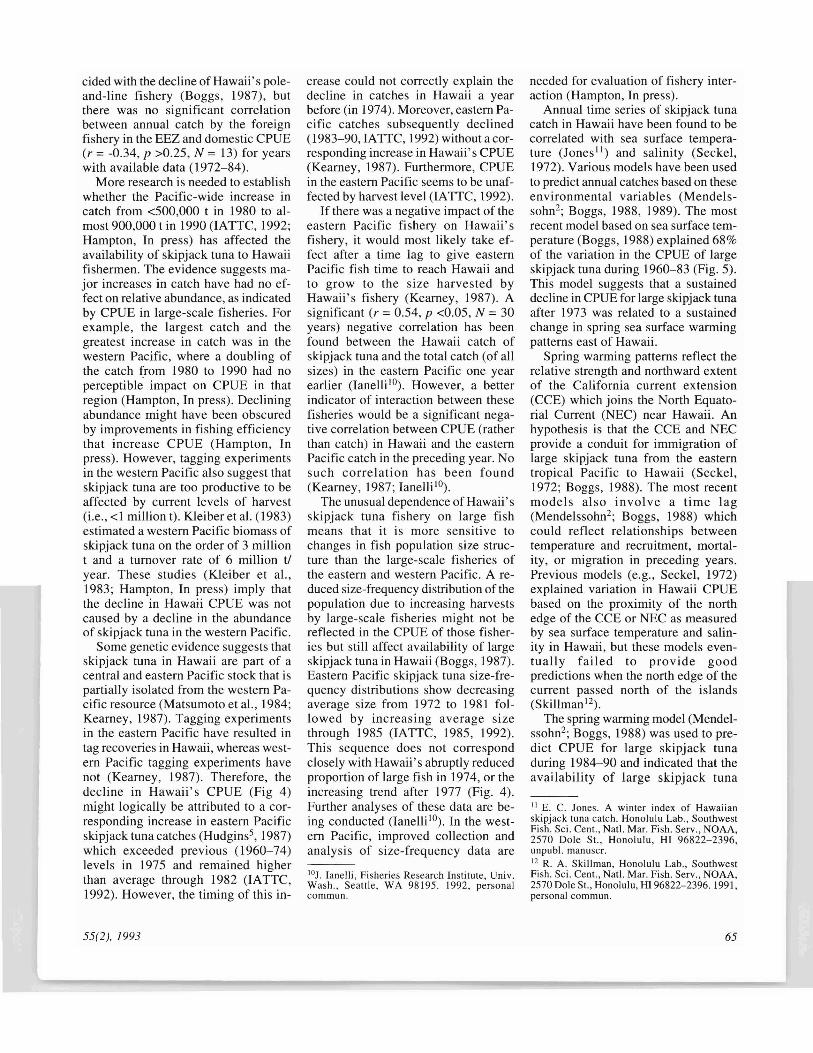
Large (>6.8 kg) skipjack tuna historically represented over 50% of the Hawaii landings by weight (Fig. 4). None of the world's major skipjack tuna fisheries depend on such large fish to supply the bulk of their catch. Large skipjack tuna command higher prices in both the fresh fish and cannery markets. From a high of over 80%
4S. G. Pooley. NMFS shore-side sampling program. Honolulu Lab., Southwest Fish. Sci. Cent., Nat!. Mar. Fish. Serv., NOAA, 2570 Dole St., Honolulu, HI 96822-2396, un pub!. data.
55(2), 1993
in 1972-73 the proportion of large fish in Hawaii landings fell to a low of 40% in 1974 and remained below 40% through 1977 (Fig. 4). Reduced landings of large fish resulted in a substantial decrease in profitability to the poleand-line fishery (Hudgins, 1987). The proportion of large fish in the catch has shown an upward trend since 1977 but has only exceeded 50% in a few years (1983, 1988, and 1991, Fig. 4).
The distribution of fishing effort by
1960 1965 1970 1975 1980 1985 1990
Year
~ 0.8
4)
i 0.6 .... 0
.~ 0.4
~ P:: 0.2
Figure 4.- The proportion of large (>6.8 kg or 15 Ib) fish in annual skipjack tuna landings by the pole-and-line fishery in Hawaii, 1960-91. Sources for size composition of catches: 1960-84 and 1986-87 from Poolel and 1988-91 from Ito3
63
Increasing age of the fishing fleet and rising fuel prices may have contributed to more conservative fishing practices in the 1970's and 1980's, resulting in fewer trips taken far from land. In the 1970' s skipjack tuna poleand-line vessels also began to fish around fish aggregating devices (FAD's), in addition to the more traditional practice of scouting for bird flocks to locate fish. If large skipjack tuna were more common farther offshore, a greater frequency of nearshore trips might have contributed to the decreased catch of large fish. Uchida and Sumida (1971) found the average size of skipjack tuna caught by 7 vessels in the summer of 1967 was smallest in areas closest to Oahu.
Changes in the geographic distribution of fishing effort in the 1970' s appear to have affected overall CPUE, which was consistently higher than average for oceanic areas, defined as more than 37 km (20 n.mi.) from shore (Uchida, 1966, 1970, 1976). The catch from oceanic areas averaged about 25% of the total catch from the 1950' s through the early 1960' s (Uchida, 1966). From 1974 to 80 catches from oceanic areas averaged only about 20% of the total catch (Kikkawa'). Data on the distribution of the catch in more recent years have not been summarized.
The cannery closed in 1984 because of economic restructuring in the global tuna industry and because of market constraints (King, 1987). The decline in Hawaii skipjack tuna landings contributed to the problems of the cannery but was not directly responsible for its closure. This pivotal event left the fishery with only a local, fresh and dried fish market. Previously, the fishery had been highly seasonal; summer (May-September) landings averaged about 400 t (900,000 Ib) per month accounting for about 70% of annual landings (1964-82 average, Hudgins5).
However, the fresh fish market absorbed only about 140-200 t (300,000
5L. L. Hudgins. 1986. Economic issues of the size distributions of fish caught in the Hawaiian skipjack tuna fishery 1964-82. U.S. Dep. Commer., NOAA, Natl. Mar. Fish. Serv., Southwest Fish. Cent., Honolulu Lab., Southwest Fish. Cent. Admin. Rep. H-86--14, 16 p.
450,000 Ib) per month after the cannery closed, reducing summer landings to about 54% of annual landings (1986-87 average, Pooley et aI.6).
The decline of the Hawaiian domestic pole-and-line fishery roughly coincided with increases in skipjack tuna landings by the domestic troll fishery in Hawaii. The amount of skipjack tuna caught by domestic longline and handline fisheries in the Hawaii Exclusive Economic Zone (EEZ) has always been relatively insubstantial, but commercial troll catches increased from <1 % of Hawaii's total skipjack tuna landings in the early 1970's to 10% in 1985 and to about 20% in 1990 and 1991. Expressed as a percentage, this increase is partly due to the decline in pole-and-line landings, but troll landings did increase from <50 t «0.1 million pounds) in the early 1970's to >200 t (>0.5 million pounds) in 1991 (Boggs and Ito, 1993).
Pole-and-line vessels from Japan fishing for skipjack tuna within the EEZ surrounding the Northwestern Hawaiian Islands also increased their catches during the decline of Hawaii's domestic pole-and-line fishery. Foreign fishing effort increased from 213 to 767 vessel-days from 1972 to 1977, while foreign catch increased from 1,000 to 4,600 t (Yong and Wetherall, 1980). From 1978 to 1984 the annual catch in the EEZ by the foreign fishery ranged from 2,000 to 4,000 t, reaching twice the level of the domestic catch (Boggs, 1987). No foreign data have been obtained since 1984, but this fishery continued to operate legally in the EEZ through 1992. New regulations may discourage the continuation of this fishery in 1993.
Causes for the Decline
Bait Problems
A lack of bait during certain times of the year is frequently cited as a problem by Hawaii fishermen. The CPUE
6S. G. Pooley, S. Teramoto, and A. C. Todoki. 1988. Hawaii's aku boat fishery in 1986 and 1987. U.S. Dep. Commer., NOAA, Natl. Mar. Fish. Serv., Southwest Fish. Cent., Honolulu Lab., Southwest Fish. Cent. Admin. Rep. H88-16, 15 p.
(catch per trip) for bait fish in the 197081 period (Kikkawa I) averaged slightly (ca. 4%) higher than in the previous decade (Uchida, 1977) but showed a declining trend. In 1986-88, bait fish CPUE in Pearl Harbor averaged 27% lower than that in 1970-81 (Kobayashi7). These modest declines (197081, 1981-86) in bait fish CPUE may have contributed to the problems of the pole-and-line fishery but were not viewed by industry participants as a direct cause for the decline of the fishery (Boggs and Pooley8, 1987).
A more serious problem for some vessels has been the high cost of the vessel insurance required for entering U.S. military areas (i.e., Pearl Harbor) to catch bait (Boggs and Pooley8,
1987). Alternatives to the harvest of wild bait by each individual vessel have been proposed (Shug and Shang9), but Hawaii fishermen are very resistant to purchasing bait, especially when wild bait is available. Under present conditions, the rearing or importation of bait fish would be stop-gap measures and would not be economically feasible (Shug and Shang9).
Fish Availability
Owing to the small scale of Hawaii's skipjack tuna fishery, local fishing pressure is not likely to affect the availability of skipjack tuna in Hawaii. Uchida (1976) showed that in Hawaii, changes in CPUE were not associated with changes in local fishing intensity at a time when the local catch was much higher than it has been in recent years. The increase in pole-and-line catches by foreign vessels in the Hawaii EEZ in the 1970' s roughly coin
7D. R. Kobayashi. Honolulu Lab., Southwest Fish. Sci. Cent., Natl. Mar. Fish. Serv., OAA, 2570 Dole St., Honolulu, HI 96822-2396, unpubl. data. 8e. H. Boggs and S. G. Pooley. 1987. Strategic planning for Hawaii's aku industry. U.S. Dep. Commer., NOAA, Natl. Mar. Fish. Serv., Southwest Fish. Cent., Honolulu Lab., Southwest Fish. Cent. Admin. Rep. H-87-1, 22 p. 9D. M. Shug and Y. e. Shang. 1983. An economic feasibility study of culturing topminnows as an alternative baitfish for skipjack tuna fisheries in Hawaii, American Samoa, Guam, and the Northern Mariana Islands. Pacific Business Center, University of Hawaii, Honolulu, HI 96822. Econ. Dev. Admin., Tech. Assist. Proj. Rep., 32 p.
Marine Fisheries Review 64
cided with the decline of Hawaii's poleand-line fishery (Boggs, 1987), but there was no significant correlation between annual catch by the foreign fishery in the EEZ and domestic CPUE (r = -0.34, P >0.25, N = 13) for years with available data (1972-84).
More research is needed to establish whether the Pacific-wide increase in catch from <500,000 t in 1980 to almost 900,000 t in 1990 (IATTC, 1992; Hampton, In press) has affected the availability of skipjack tuna to Hawaii fishermen. The evidence suggests major increases in catch have had no effect on relative abundance, as indicated by CPUE in large-scale fisheries. For example, the largest catch and the greatest increase in catch was in the western Pacific, where a doubling of the catch from 1980 to 1990 had no perceptible impact on CPUE in that region (Hampton, In press). Declining abundance might have been obscured by improvements in fishing efficiency that increase CPUE (Hampton, In press). However, tagging experiments in the western Pacific also suggest that skipjack tuna are too productive to be affected by current levels of harvest (i.e., <1 million t). Kleiber et al. (1983) estimated a western Pacific biomass of skipjack tuna on the order of 3 million t and a turnover rate of 6 million t/ year. These studies (Kleiber et aI., 1983; Hampton, In press) imply that the decline in Hawaii CPUE was not caused by a decline in the abundance of skipjack tuna in the western Pacific.
Some genetic evidence suggests that skipjack tuna in Hawaii are part of a central and eastern Pacific stock that is partially isolated from the western Pacific resource (Matsumoto et aI., 1984; Kearney, 1987). Tagging experiments in the eastern Pacific have resulted in tag recoveries in Hawaii, whereas western Pacific tagging experiments have not (Kearney, 1987). Therefore, the decline in Hawaii's CPUE (Fig 4) might logically be attributed to a corresponding increase in eastern Pacific skipjack tuna catches (Hudgins5, 1987) which exceeded previous (1960-74) levels in 1975 and remained higher than average through 1982 (lATTC, 1992). However, the timing of this in
55(2), 1993
crease could not correctly explain the decline in catches in Hawaii a year before (in 1974). Moreover, eastern Pacific catches subsequently declined (1983-90, IATIC, 1992) without a corresponding increase in Hawaii's CPUE (Kearney, 1987). Furthermore, CPUE in the eastern Pacific seems to be unaffected by harvest level (IATTC, 1992).
If there was a negative impact of the eastern Pacific fishery on Hawaii's fishery, it would most likely take effect after a time lag to give eastern Pacific fish time to reach Hawaii and to grow to the size harvested by Hawaii's fishery (Kearney, 1987). A significant (r =0.54, p <0.05, N =30 years) negative correlation has been found between the Hawaii catch of skipjack tuna and the total catch (of all sizes) in the eastern Pacific one year earlier (lanelli 10). However, a better indicator of interaction between these fisheries would be a significant negative correlation between CPUE (rather than catch) in Hawaii and the eastern Pacific catch in the preceding year. No such correlation has been found (Kearney, 1987; Ianelli 1o).
The unusual dependence of Hawaii's skipjack tuna fishery on large fish means that it is more sensitive to changes in fish population size structure than the large-scale fisheries of the eastern and western Pacific. A reduced size-frequency distribution of the population due to increasing harvests by large-scale fisheries might not be reflected in the CPUE of those fisheries but still affect availability of large skipjack tuna in Hawaii (Boggs, 1987). Eastern Pacific skipjack tuna size-frequency distributions show decreasing average size from 1972 to 1981 followed by increasing average size through 1985 (IATTC, 1985, 1992). This sequence does not correspond closely with Hawaii's abruptly reduced proportion of large fish in 1974, or the increasing trend after 1977 (Fig. 4). Further analyses of these data are being conducted (Ianelli 10). In the western Pacific, improved collection and analysis of size-frequency data are
10J. Ianelli, Fisheries Research Institute, Univ. Wash., Seallle, WA 98195. 1992, personal commun.
needed for evaluation of fishery interaction (Hampton, In press).
Annual time series of skipjack tuna catch in Hawaii have been found to be correlated with sea surface temperature (Jones 11) and salinity (Seckel, 1972). Various models have been used to predict annual catches based on these environmental variables (Mendelssohn2; Boggs, 1988, 1989). The most recent model based on sea surface temperature (Boggs, 1988) explained 68% of the variation in the CPUE of large skipjack tuna during 1960-83 (Fig. 5). This model suggests that a sustained decline in CPUE for large skipjack tuna after 1973 was related to a sustained change in spring sea surface warming patterns east of Hawaii.
Spring warming patterns reflect the relative strength and northward extent of the California current extension (CCE) which joins the North Equatorial Current (NEe) near Hawaii. An hypothesis is that the CCE and NEC provide a conduit for immigration of large skipjack tuna from the eastern tropical Pacific to Hawaii (Seckel, 1972; Boggs, 1988). The most recent models also involve a time lag (Mendelssohn2; Boggs, 1988) which could reflect relationships between temperature and recruitment, mortality, or migration in preceding years. Previous models (e.g., Seckel, 1972) explained variation in Hawaii CPUE based on the proximity of the north edge of the CCE or NEC as measured by sea surface temperature and salinity in Hawaii, but these models eventually failed to provide good predictions when the north edge of the current passed north of the islands (Skillman 12).
The spring warming model (Mendelssohn2; Boggs, 1988) was used to predict CPUE for large skipjack tuna during 1984-90 and indicated that the availability of large skipjack tuna
11 E. C. Jones. A winter index of Hawaiian skipjack tuna catch. Honolulu Lab., Southwest Fish. Sci. Cent., Natl. Mar. Fish. Serv., NOAA, 2570 Dole St., Honolulu, HI 96822-2396, unpubl. manuscr. 12 R. A. Skillman, Honolulu Lab., Southwest Fish. Sci. Cent., Natl. Mar. Fish. Serv., NOAA, 2570 Dole St., Honolulu, HI 96822-2396. 1991, personal commun.
65
4
- Predicted ,-...
i .. Observed3
~ '-'
2 ~ ;a g u
1
8000
~ :!2.
6000 :S '-'
4000 ~ ;a g u
2000
1960 1965 1970 1975 1980 1985 1990
Year
Figure 5.- Annual skipjack tuna CPUE in metric tons (t) and pounds (Ib) per vessel per day for large fish (>6.8 kg or 15 Ib), 1960-91, compared with CPUE predicted by an environmental model. Sources as given in Figures 1 and 4.
around Hawaii should have returned to pre-1974 levels after 1983 (Fig. 5). Although the proportion of large fish in the Hawaii catch returned to 196073 average levels in 1988 and 1991 (Fig. 4), the CPUE for large skipjack tuna in recent years has remained much lower than predicted (Fig. 5).
Three factors that may have contributed to lower-than-predicted CPUE after 1983 were 1) a self-imposed quota employed by vessels to avoid flooding a limited market, 2) reduced scouting and fishing closer to port, and 3) a change in the overall age structure of the population because of increased fishing pressure elsewhere in the Pacific. The first two factors are economic, and could result in reduced CPUE without any change in fish abundance. For example, CPUE is biased downwards by a self-imposed quota (factor 1) because measures of effort (days) and CPUE (catch per day) do not account for trips of less than a day when a quota is achieved early in the day. Increased fishing near shore (factor 2) would decrease CPUE because average CPUE is highest >37 km from shore (Uchida, 1966, 1970, 1976) and fish may be smaller than average near shore (Uchida and Sumida, 1971). Existing analyses do not indicate that the availability of large fish has been re
duced by the impacts of fishing on population age structure (factor 3) but further study is needed.
Economic Causes of the Decline
One economic factor in the continuing decline in total catches after 1974 (Fig. 1) was a negative correlation between catch and the price of fuel (Hudgins5). In a comparison of catches for 1982 with those for 1974, the decrease in annual catch attributable to fuel price increases was estimated to have reduced annual revenue by $1.3 million. Over this same period, a decrease in catch attributable to reduced CPUE and a low proportion of large fish in the catch (Fig. 4) were estimated to have reduced annual revenue by $1.0 and $0.36 million, respectively (Hudgins5). These losses represent over 50% of potential revenue; actual revenue was only $2.5 million in 1982 (Pooley et aI.6).
The mechanism by which fuel price increases affect the catch has not been documented, but the fuel price rise that began in 1973 did not immediately affect the total number of fishing days (Fig. 2). Perhaps expensive fuel and poor maintenance on some vessels result in restricted scouting for schools of fish and in fishing closer to land. Fishing around FAD's may increase
the proportion of small fish in the catch (Boggs and Pooley, 1987), but FAD fishing seems to be mostly a last resort when schools of larger fish cannot be located. Small fish landings increased in 1976 whereas FAD's were not fully deployed until 1980 (Hudgins5, 1987).
Declining profitability has played an important role in the decline of the fishery (Pooley, 1987). Low earnings since the 1960' s curtailed investment in new boats. Attempts to increase profits by selling more high-priced, fresh skipjack tuna faced market limitations even before the cannery closed. During 1970--85 the price per ton rose 45%, but costs rose 75% (after inflation). To offset fuel (200%) and insurance (390%) cost increases, the share of profit paid to crews was kept low, and repairs were postponed (Pooley, 1987). Poor maintenance resulted in frequent breakdowns and safety problems. Five vessels which sank during the 1980' s and 1990' s have not been replaced. Such problems may have influenced the fleet's fishing range, resulting in fewer fishing trips to more productive oceanic areas. Now, most of the vessels still remaining in the fleet are well maintained.
An increase in troll, handline, and longline landings of yellowfin and bigeye tunas during the 1970's and 1980's resulted in competition for the fresh tuna market, reducing the available market for skipjack tuna after the cannery closed. Although skipjack tuna is priced lower than yellowfin tuna (on average) and is appreciated by Hawaii residents in raw, cooked, and dried product forms, it is not widely accepted in the local restaurant (tourist) or export markets. In 1985 the average exvessel price for skipjack tuna was only $2.48/kg ($1.l3/1b), whereas the average price for yellowfin tuna was 26% higher. The price difference has increased along with prices, and in 1991 the average yellowfin tuna price of $4.98/kg ($2.26/1b) was 58% higher than the average skipjack tuna price. Yellowfin tuna can readily be sold to the restaurant market in Hawaii or exported, and it has a much longer shelf life than skipjack tuna. Yellowfin and bigeye tuna are preferred over skipjack tuna for sashimi in the export mar-
Marine Fisheries Review 66
kets. Flash-frozen skipjack and yellowfin tuna imported to Hawaii from Japan also competes with the Hawaii fishery for a share of the local market. The flash-frozen product is acceptable for sashimi, although it can be distinguished from fresh skipjack tuna.
The closure of the Honolulu tuna cannery in 1984 cost the skipjack tuna fishery an estimated $0.5 million (18%) in annual sales, and the loss would have been much worse had the fishery not already been so reduced (Hudgins, 1987). The most pronounced effect of the closure has been to discourage revitalization of the fishery. The lack of a cannery market is especially troublesome during the summer when the skipjack and yellowfin tuna fisheries reach peak production. As a result, pole-andline vessels occasionally experienced severe market competition and devastating price reductions in the 1980' s (Boggs and Pooley, 1987).
Self-imposed catch limits are now employed by Hawaii pole-and-line vessels to avoid flooding the limited freshfish market, especially on trips made during summer when fish are most available (Boggs, 1988, 1989). Incorporation of a monthly limit to landings with an environmental model (Boggs, 1988) produced more realistic predictions of CPUE and annual catch (Boggs, 1988, 1989). Since summer is also the season when large fish predominate in the catch, self-imposed quotas contribute to a lower proportion of large fish on an annual basis.
In summary, Hawaii's pole-and-line fishery was economically stressed throughout the 1970' sand 1980' s because of rising costs and reduced profitability (Pooley, 1987). Then from 1974-83 the availability of large fish declined because of environmental changes (Mendelssohn2; Boggs, 1988) and the fishery declined. Models based on environmental factors predict increased availability since 1983 but CPUE has remained low. Reasons for continuing low CPUE may include selfimposed quotas and fishing closer to shore than in the past. No clear evidence indicates that overfishing has had a negative impact in Hawaii or elsewhere in the Pacific. The fishery has
55(2), 1993
not recovered owing to continued high costs, low profits, and a limited market.
Remedies and Future Prospects
A workshop and a strategic planning process (Boggs and Pooley8,
1987) were conducted in Honolulu in 1986 to discuss causes of the fisheries decline and remedial actions. An expanded market and products with a long shelf life to absorb peak production during the summer were seen as the most important objectives for revitalizing the fishery. A group of investors purchased the cannery facility in 1985 with the intention of integrating it into a marine-oriented tourist center but the cannery has not reopened. Making tuna canning profitable in Hawaii would require promotion of specialty packs that appeal to tourists and local residents, because production of normal canned tuna in Hawaii is too expensive to compete on the world market (King, 1987).
The available evidence indicates that the skipjack tuna population can easily support an expanded fishery in Hawaii, although the fishery would remain vulnerable to an environmentally driven reduction in availability like that of 1974-83. Ifocean-wide fishing pressure has had an impact on availability, local (EEZ) management would not substantially ameliorate that impact because the local fishery is relatively small. Bait fish stocks would be the only resources that might require local management if the fishery were to expand. These stocks were sufficient in the 1970's to support three times the number of full-time vessels currently active. The modest decline of bait fish stocks (ca. 27%) since the 1970's might become a limiting factor if the fishery were to more than double its present size. If the profitability of the fishery increased, it might be able to support a bait fish culture industry (Shug and Shang9).
The future of the fishery depends primarily on the development of markets. The State of Hawaii has conducted market expansion projects and supported experiments to try and increase product shelf life, but these have not been very successful, in comparison with similar efforts in promoting other
species. Expansion of the market will likely require innovative product technology that can economically preserve summer catches for later sale or fishing technology that will permit increased catches during the season of low availability.
In 1986 Hudgins (1987) predicted that without new markets, economic competition would force all but 4 or 5 of the most efficient Hawaii skipjack tuna fishing vessels out of business. She predicted that these vessels would supply about 900 t (2 million Ib) of the skipjack tuna in the Hawaii fresh market at prices of $2.75-3.85 per kg ($1.25-1.75/1b). These predictions are almost exactly met by the number of vessels (6,4 full-time), landings (955 t, 2.1 million Ib), and average price ($2.87/kg, $1.30/lb) for skipjack tuna in 1991. Unless a larger market is developed, there is no reason to expect much expansion of Hawaii's skipjack tuna fishery in the near future. Thepole-and-line fleet may continue to decline with age and the local market may increasingly be supplied by imports and by Hawaii's commercial troll fishery.
Acknowledgments
We thank Shoji Teramoto and Russell Ito of the NMFS Honolulu Laboratory for collecting the data on catch, number of trips, and size composition of the catch for 1986-91. We also thank Sam Pooley, Richard Shomura, and Ray Sumida of the Honolulu Laboratory for helping to bring together the information needed for this review.
Literature Cited Boggs, C . H. 1987. Review of biological re
search on skipjack tuna. In Forces of change in Hawaii's aku (skipjack tuna) industry, 1986 workshop summary, p. SO-56. U.S. Dep. Commer., NOAA Tech. Memo. NMFSSWFC-72.
__~ . 1988. Forecasting skipjack tuna availability in Hawaii. Southwest Fish. Cent., Natl. Mar. Fish. Serv., La Jolla, CA 92038, Tuna Newsletter 91: 5-7.
_:-=-::-:-' 1989. Hawaii skipjack forecast for 1989 issued: Forecast predicts a catch rate of 2,200 large aku per boat, per day. Southwest Fish. Cent., Natl. Mar. Fish. Serv., La Jolla, CA 92038, Tuna Newsletter 94:4.
_,.----:----;:;- and R. Y. Ito. 1993. Hawaii's pelagic fisheries. Mar. Fish. Rev. 55(2):69-82.
_--;-_ and S. G. Pooley. 1987. Forces of change in Hawaii's aku (skipjack tuna) in
67
dustry, 1986 workshop summary. U.S. Dep. Commer., NOAA Tech. Memo. NMFSSWFC-72, 70 p.
Forsbergh, E. D. 1980. Synopsis of biological data on the skipjack tuna, Katsuwonus pelamis (Linnaeus, 1758), in the Pacific ocean. In W.H. Bayliff, (Editor), Synopses of biological data on eight species of scombrids, p. 295-360. Inter-Am. Trop. Tuna Comm., Spec. Rep. No.2.
Hampton, J. In press. A review of skipjack fishery interaction in the western and central Pacific Ocean. In R. S. Shomura, J. Majkowski, and S. Langi (Editors), Proceedings of the FAO expert consultation on interactions of Pacific tuna fisheries, Noumea, New Caledonia, 3-11 December 1991. Food & Agric. Organ., U.N., FAO Fish. Tech. Pap.
Hudgins, L. L. 1987. Economic prospects for Hawaii's skipjack tuna industry. In Forces of change in Hawaii's aku (skipjack tuna) industry, 1986 workshop summary, p. 3942. U.S. Dep. Commer., NOAA Tech. Memo. NMFS-SWFC-72.
___ and S. G. Pooley. 1987. Growth and contraction of domestic fisheries: Hawaii's tuna industry in the 1980's. In D. J. Doulman (Editor), Tuna issues and perspectives in the Pacific islands region. East-West Center Press, Honolulu, Hawaii, 314 p.
Hunter, J. R., B. J. Macewicz, and J. R. Sibert. 1986. The spawning frequency of skipjack tuna, Katsuwonus pelamis, from the South Pacific. Fish. Bull. 84:895-903.
IATTC. 1985. Annual report of the Inter-American Tropical Tuna Commission, 1984. IATTC, La Jolla, Calif., 270 p.
_....,-_-,- . 1992. Annual report of the InterAmerican Tropical Tuna Commission, 1990. IATTC, La Jolla, Calif., 261 p.
June, F. C. 1951. Preliminary fisheries survey of the Hawaiian-Line Islands area. Part III. The live-bait skipjack fishery of the Hawaiian Islands. Commer. Fish. Rev. 13(2): 1-18.
Kearney, R. E. 1987. Skipjack tuna migration and interactions. In Forces of change in Hawaii's aku (skipjack tuna) industry, 1986 workshop summary, p. 4-13. U.S. Dep. Commer., NOAA Tech. Memo. NMFSSWFC-72.
King, D. M. 1987. World tuna markets and the Pacific fishery. In Forces of change in Hawaii's aku (skipjack tuna) industry, 1986 workshop summary, p. 18-23. U.S. Dep. Commer., NOAA Tech. Memo. NMFSSWFC-72.
Kleiber, P., A. W. Argue and R. E. Kearney. 1983. Assessment of Pacific skipjack tuna Katsuwonus pelamis resources by estimating standing stock and components of population turnover from tagging data. Can. J. Fish. Aquat. Sci. 44(6):1122-1134.
Matsumoto, W. M., R. A. Skillman, and A. E. Dizon. 1984. Synopsis of biological data on skipjack tuna Katsuwonus pelamis. U.S. Dep. Commer., NOAA Tech. Rep. NMFS Circ. 451,92 p.
Miyabe, N. In press. General review paper of Pacific bigeye tuna Thunnus obesus. In R. S. Shomura, J. Majkowski and S. Langi (Editors), Proceedings of the FAO expert consultation on interactions of Pacific tuna fisheries, Noumea, New Caledonia, 3-11 December 1991. Food & Agric. Organ., U.N., FAO Fish. Tech. Pap.
Pooley, S. G. 1987. Economic profile of Hawaii's aku fleet. In Forces of change in Hawaii's aku (skipjack tuna) industry, 1986 workshop summary, p. 31-37. U.S. Dep. Commer., NOAA Tech. Memo. NMFSSWFC-72.
Seckel, G. R. 1972. Hawaiian-caught skipjack tuna and their physical environment. Fish. Bull. 72:763-787.
Sibert, J. 1987. The status of research on skipjack tuna fisheries in the Pacific. In Forces of change in Hawaii's aku (skipjack tuna) industry, 1986 workshop summary, p. 1-4. U.S. Dep. Commer., NOAA Tech. Memo. NMFS-SWFC-72.
Skillman, R. A. 1987. Trends in Hawaii's aku production. In Forces of change in Hawaii's aku (skipjack tuna) industry, 1986 workshop summary, p. 28-31. U.S. Dep. Commer., NOAA Tech. Memo. NMFSSWFC-72.
Suzuki, Z. 1989. Catch and fishing effort relationships for striped marlin, blue marlin, and black marlin in the Pacific Ocean, 19521985. In R. H. Stroud (Editor), Planning the future of bill fishes, research and manage
ment in the 90's and beyond. Part I. Fishery and stock synopses, data needs, and management. Mar. Rec. Fish. 13:165-177. Natl. Coalition Mar. Conserv., Savannah, Georgia.
__-,---;::- . In press. A brief review of biology and fisheries for yellowfin tuna Thunnus albacares in the western and central Pacific Oceans. In R. S. Shomura, J. Majkowski and S. Langi (Editors), Proceedings of the FAO expert consultation on interactions of Pacific tuna fisheries, Noumea, New Caledonia, 3-11 December 1991. Food & Agric. Organ., U.N., FAO Fish. Tech. Pap.
Uchida. R. N. 1966. The skipjack tuna fishery in Hawaii. In T. A. Manar (Editor), Proceedings, governor's conference on central Pacific fishery resources, Honolulu-Hilo, 28 February-12 March, 1966, p. 147-159. State of Hawaii, Honolulu.
__-,---_. 1970. Distribution of fishing effort and catches of skipjack tuna, Katsuwonus pelamis, in Hawaiian waters, by quarters of the year, 1948-65. U.S. Dep. Inter., Fish and Wildlife Serv., Bur. Commer. Fish., Spec. Sci. Rep. Fish. 615, 37 p.
_-;:--,----_. 1976. Reevaluation of fishing effort and apparent abundance in the Hawaiian fishery for skipjack tuna, Katsuwonus pelamis 1948-70. Fish Bull. 74:59-69.
. 1977. The fishery for nehu, Stolephorus purpureus, a live bait used for skipjack tuna, Katsuwonus pelamis, fishing in Hawaii. In R. S. Shomura (Editor), Collection of tuna baitfish papers, p. 57-62. U.S. Dep. Commer., NOAA Tech. Rep. NMFS Circ. 408.
Uchida, R. N., and R. F. Sumida. 1971. Analysis of the operations of seven Hawaiian skipjack tuna fishing vessels, June-August 1967. U.S. Dep. Commer., NOAA Natl. Mar. Fish. Serv., Spec. Sci. Rep. Fish. 629, 25 p.
Yamashita, D. T. 1958. Analysis of catch statistics of the Hawaiian skipjack fishery. Fish. Bull. 58: 253-278
Yong, M. Y. Y., and J. Wetherall. 1980. Estimates of the catch and effort by foreign longliners and baitboats in the fishery conservation zone of the central and western Pacific, 1955-77. U.S. Dep. Commer., NOAA Tech. Memo. NMFS-SWFC-2, 103 p.