The differences in regulatory capital requirements for the banking and insurance industry regarding Dutch mortgages A.W. van de Burgwal October 23, 2014 [Public version] A study that compares the regulatory capital requirements under the first pillar on behalf of investing in Dutch mortgages for the banking and insurance industry.
Transcript
The differences in regulatory capital requirements for the
banking and insurance industry regarding Dutch mortgages
A.W. van de Burgwal
October 23, 2014
[Public version]
A study that compares the regulatory capital requirements under the first pillar on behalf of investing
in Dutch mortgages for the banking and insurance industry.
Author
A.W. van de Burgwal
Date
October 23, 2014
Educational information
University of Twente
School of Management and Governance
Master Industrial Engineering and Management
Specialization Financial Engineering and Management
Company information
ABN AMRO Bank N.V.
Finance – Mortgages – Balance Sheet Management
Supervisors
Dr. B. Roorda University of Twente
Ir. Drs. A.C.M. de Bakker University of Twente
Drs. R.J. Reitsma ABN AMRO Bank N.V.
Preface i
Preface
During the last six months, I have written this thesis at the ABN AMRO Bank N.V. in order
to obtain my master’s degree in Industrial Engineering and Management at the University of
Twente. I am thankful that the ABN AMRO Bank N.V. offered me the opportunity to conduct
the thesis at their company which has resulted in a better understanding of the banking
industry, the regulations for financial institutions, mortgages and securitizations. For this, I
would like to thank several people.
First, I would like to thank Robert-Jan Reitsma for the enthusiastic support which helped me
to improve this thesis and to get a better understanding of the banks’ business and financial
institutions in general. Second, I would like to thank Berend Roorda and Toon de Bakker, my
supervisors from the University of Twente, for providing feedback during our meetings.
Furthermore, thanks to Mark Geubbels for providing feedback on my writing, thanks to
Karim Bensaid for providing information from the credit risk department and thanks to the
colleagues of the balance sheet department for the support and social interaction.
Finally, I would like to thank Aranka, family and friends for their support which helped me to
successfully complete my study.
Edo van de Burgwal
Management Summary iii
Management Summary
The Dutch mortgage market is changing. Insurers increased their activity in providing
mortgages and the regulation frameworks for the banking and insurance industry have
changed during the last decade. Therefore, the discussion about the level playing field
between insurers and banks has increased. This study contributes to this discussion by
answering the research question: Are there differences in the regulatory capital requirements
for banks and insurers for the product Dutch mortgages?
To answer this question, the relevant parts of the regulations Basel III and Solvency II are
described and applied to the XX mortgage portfolio of ABN AMRO Bank N.V. Due to the
available data, this study is restricted to the regulatory capital requirements of the first pillar.
As hypothesis, it is assumed that there are differences in the regulatory capital requirement.
Therefore, this study also examines the questions: What are the differences in the regulatory
capital requirements for banks and insurers? Which characteristics of the mortgage have an
effect on these differences? Are these differences reflected in the interest rates that banks and
insurers set for the customer?
Whereas the differences in the capital requirements are in favour for insurers for the lower
Loan-to-Foreclosure-Values and fixed interest rate periods, the analysis of the interest rate
indicates that insurers seems to have a higher focus on higher Loan-to-Foreclosure-Values
and longer fixed interest rate periods.
Confidential
Table of contents iv
Table of contents
Preface ......................................................................................................................................... i
Management Summary ............................................................................................................. iii
Table of contents ....................................................................................................................... iv
List of figures & tables .............................................................................................................. vi
Abbreviations ........................................................................................................................... vii
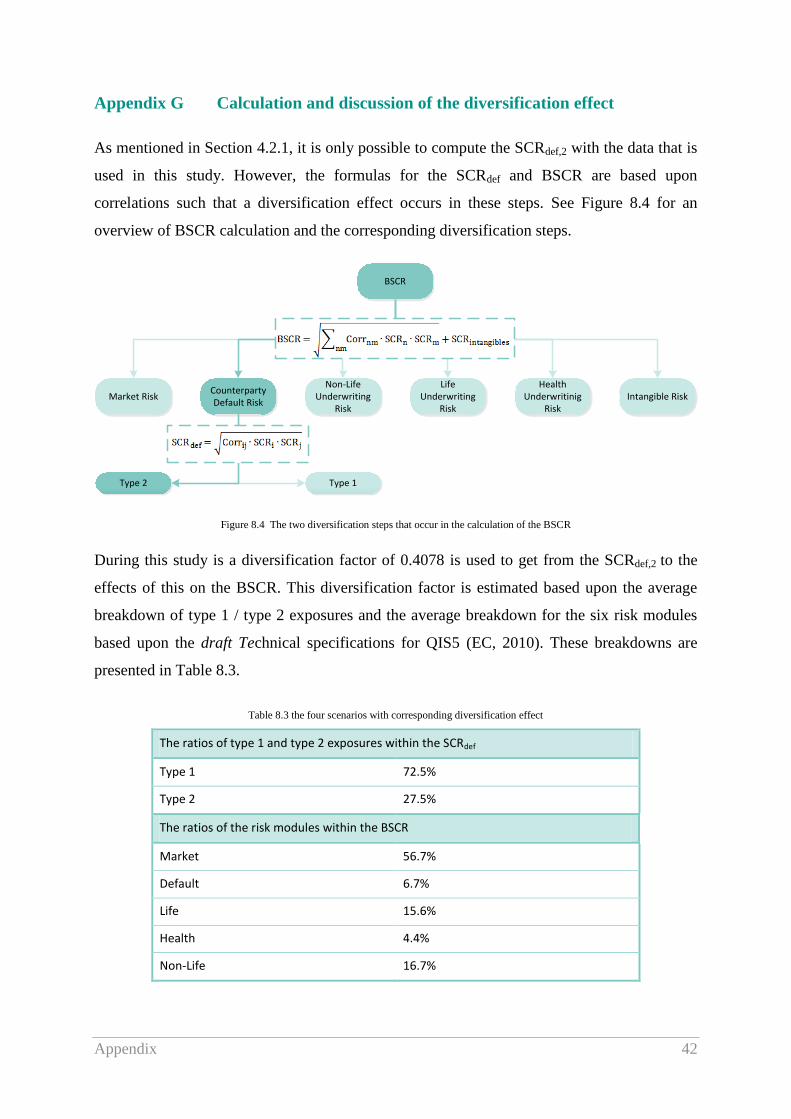
Figure 8.3 Solvency II, the dark green parts are used in this study (CEIOPS, 2010) .............. 38
Figure 8.4 The two diversification steps that occur in the calculation of the BSCR .............. 42
Table 3.1 The BSCR correlation matrix (CEIOPS, 2010) ....................................................... 14
Table 4.1 Methods and assumptions used in this study for banks ........................................... 18
Table 4.2 The influence of the fixed interest rate period on the credit risk capital charge ...... 20
Table 4.3 Methods and assumptions used in this study for insurers ........................................ 22
Table 5.1 total regulatory capital requirements per regulation ................................................ 25
Table 5.2 cost of capital in EUR 1,000 .................................................................................... 26
Table 5.3 cost of capital in basis points ................................................................................... 26
Table 8.1 The regulatory environments of the mortgage providers ......................................... 35
Table 8.2 The influence of each adjustment on the data .......................................................... 41
Table 8.3 The influence of the Basel restrictions on the data .................................................. 41
Table 8.4 The influence of the Solvency restrictions on the data ............................................ 41
Table 8.5 the four scenarios with corresponding diversification effect ................................... 42
Table 8.6 the four scenarios with corresponding diversification effect ................................... 45
Table 8.7 the average interest rates of last year ....................................................................... 46
Abbreviations vii
Abbreviations
AT1 Additional Tier-1
ABN ABN AMRO Bank N.V.
BCBS Basel Committee on Banking Supervision
BIS Bank of International Settlements
BSCR Basic solvency capital requirement
CET1 Common Equity Tier-1
CRD Capital Requirements Directive
DNB Dutch National Bank
EAD Exposure at default
EC European Commission
EIOPA European Insurance and Occupational Pension Authority
EU European Union
GDP Gross domestic product
IRB Internal ratings based
LGD Loss given default
LtFV Loan-to-Foreclosure-Value
LtMV Loan-to-Market-Value
MCR Minimum capital requirement
NHG Nationale Hypotheek Garantie
NSC Notional solvency criterion
PD Probability of Default
QIS Quantitative Impact Study
RoE Return on Equity
RWA Risk-weighted assets
SCR Solvency capital requirement
SCRdef Solvency capital requirement regarding counterparty default risk
SCRdef,2 Solvency capital requirement regarding counterparty default risk type 2
SIB Systematically important bank
VaR Value-at-Risk
WACC Weighted average cost of capital
Introduction 1
1 Introduction
The core business of banks and insurers is different; banks operate as financial intermediaries
that link the capital of customers with a surplus to those with a shortage, whereas insurers
indemnify customers in case a predefined event happens (Al-Darwish, Hafeman, Impavido,
Kemp, & O'Malley, 2011). As a result, both industries have their own regulatory regimes.
After the financial crisis, these regulatory frameworks have changed to increase the financial
market stability with adequate and consistent capital standards (Laas & Siegel, 2014). The
regulation framework for the banking industry shifted from Basel II to Basel III in 2013 and
Basel III will be fully effective as of 2019. At the same time, the insurance regulation has
changed to Solvency II, which will come into force as of 2016.
Since these regulatory frameworks are built for two different industries, both regulations
compute the regulatory capital requirements with different methods. These regulatory capital
requirements are set to ensure that financial institutions are prudently managed (Laas &
Siegel, 2014).
The new regulations started the discussion about the level playing field for banks and insurers.
See for example the speech same risk, same rules, same capital of Leo de Boer, Director
Verbond van Verzekeraars (Verbond van Verzekeraars, 2014), who argues that insurers have
to hold more capital for wealth accumulation products. If the level playing field does not hold,
it means that products of the same type with the same amount of risk have a different capital
charge under both regulations. Consequently, this would give one industry a competitive
advantage with respect to the other.
During the last years, the insurance industry started to invest more in the mortgage market
directly, which is attractive for them due to the long term investment focus of insurers (NVM,
2014). ABN AMRO Bank N.V. (ABN) would like to know if this is caused by differences in
the regulatory capital requirements that apply to mortgages under Basel III and Solvency II.
Therefore, the following research question will be answered during this study:
Are there differences in the regulatory capital requirements for banks and insurers for the
product Dutch mortgages?
Introduction 2
The hypothesis is that there are differences in the regulatory capital requirements, since both
industries have a different business model. Therefore, this study also examines the following:
1. What are the differences in the regulatory capital requirements for banks and insurers?
2. Which characteristics of the mortgage have an effect on these differences?
3. Are these differences reflected in the interest rates that banks and insurers set for the
customer?
To present these findings, an overview of the Dutch mortgage market and the active providers
will be given in Chapter 2. After this, Chapter 3 describes the regulatory capital requirements
calculation under Basel III and Solvency II. These methods will be used for a numerical
comparison of the capital requirements for the XX mortgage portfolio in Chapter 4. Finally, if
these differences are reflected in the interest rates is analysed in Chapter 5.
Although an extensive amount of literature can be found on Basel III and Solvency II
separately, the number of studies comparing Basel III with Solvency II is limited. There are
some articles, such as A comparative assesment of Basel II/III and Solvency II (Gatzert &
Wesker, 2011), Possible Unintended Consequences of Basel III and Solvency II (Al-Darwish
et al, 2011) and Solvency II and Basel III (Zähres, 2011) which show the differences and
similarities of the frameworks, but they all argue that it is hard to draw conclusions due to a
lack of empirical evidence.
While those articles have a lack of empirical evidence, the article Basel Accords versus
Solvency II: Regulatory Adequacy and Consistency under the Postcrisis Capital Standards
(2014) includes an empirical research. It shows that the regulatory capital requirements for
Solvency II are higher with 10.82% compared to the 8.79% that holds for systematically
important banks (SIB) under Basel III. However, these numbers are based upon a stylized
portfolio and are not specific for the Dutch market. Therefore, this study contributes to the
literature by comparing the regulatory capital requirements based upon a real mortgage
portfolio that contains Dutch mortgages only.
Delimitation
This study compares only the regulatory capital requirements of the first pillar which relate to
Dutch mortgages.
The Dutch mortgage market 3
2 The Dutch mortgage market
2.1 The Dutch mortgage market in numbers
Almost 4.3 million Dutch households owned a house on January 1, 2013, from which 83%
had financed (a part) of their house with a mortgage (CBS, 2014). The total outstanding
exposure was EUR 653 bln and EUR 637 bln at the end of respectively 2012 and 2013 (DNB,
2014a).
(AAHG, 2014).
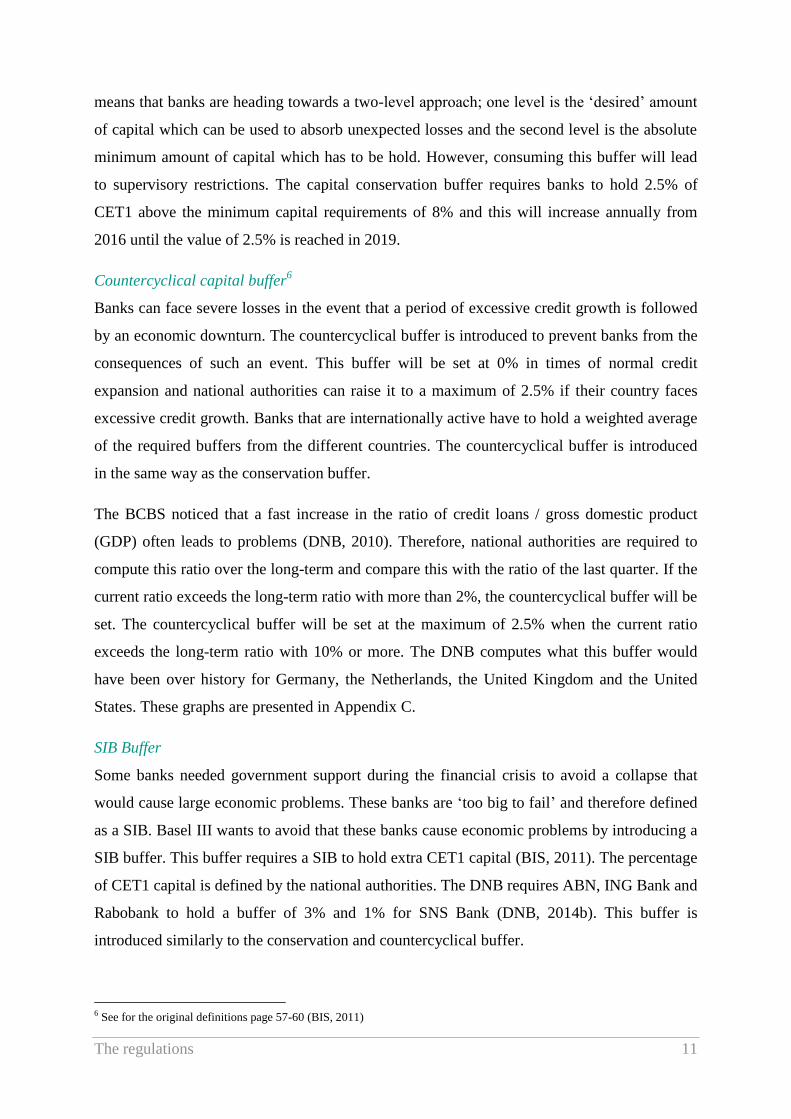
The corresponding market shares are presented in Figure 2.1. This figure shows that the total
market share of insurers – Achmea, AEGON, ASR and Delta Lloyd – is rising. The increase
is mainly caused by the large increase in production of AEGON and Delta Lloyd, which are
insurers with a long-term investment focus due to their supply of pensions and life insurances.
The decline in the mortgage production is caused by the financial crisis. Due to the financial
crisis, the inflation corrected house prices dropped around 4% per year between 2008 and
2012 in the Netherlands (CBS, 2013). As a consequence of this price drop, approximately 1.1
million of the households had a Loan-to-Market-Value (LtMV) of more than 100% in 2012
and approximately 1.4 million in 2013 (CBS, 2014); i.e. the market value of their house is
lower than the outstanding mortgage loan. Therefore, households are moving less and early
Figure 2.1 The mortgage production market shares in 2012 and 2013 (AAHG, 2014)
0%
5%
10%
15%
20%
25%
30%
35%
40%
ABN Concern
Rabo Concern
ING Concern
SNS Concern
Argenta Achmea Aegon ASR Delta Lloyd
Other
Market shares of the mortgage production
2012
2013
Confidential
The Dutch mortgage market 4
repayment is stimulated so that the total outstanding mortgage exposure declines.
Furthermore, originators apply stricter lending criteria for the issuance of new mortgages as
agreed in the code of conduct mortgage finance 2011 (Dutch: gedragscode hypothecaire
financieringen) (Homefinance.nl, n.d.).
In the Netherlands there is a unique feature that guarantees the repayment of the remaining
debt in the event that the borrower is not able to fulfil the payment obligations due to a
divorce, disability, unemployment or death. This is the so called Nationale Hypotheek
Garantie (NHG). To receive the guarantee, a one-time fee of 1% has to be paid and the
mortgage cannot exceed EUR 265,000 as of 1 July 2014 (NHG, n.d.). Mortgage providers
assume that mortgages with NHG are less risky, such that the interest rate is up to 0.6% lower
than a mortgage without the guarantee (NHG, n.d.). At the end of December 2013, almost 1.1
million mortgages were issued under NHG with a total outstanding exposure of EUR 164 bln
(Stichting Waarborgfonds Eigen Woningen, 2014).
2.2 The mortgage providers
Some companies that are mentioned in Figure 2.1 are active in both the banking and insurance
industry and thus they have legal entities that report under Basel and Solvency. Therefore, the
annual reports of these providers are analysed to check under which entity the mortgages are
provided and to which regulation they report. The findings are shown in Appendix A and the
most important findings are summarised below:
The Dutch system banks – ABN, ING Bank, Rabobank and SNS REAAL – hold their
mortgages on the banking book and compute the regulatory capital requirements
regarding credit risk via the advanced internal ratings based (IRB) approach;
Argenta is a bank and insurance combination based in Belgium, which also provides
mortgages on the Dutch market. The mortgages are issued from their banking entity
which shifter recently from the standardized approach to the foundation IRB approach;
Achmea, AEGON, Delta Lloyd, Nationale-Nederlanden and ASR core business is in
the insurance industry. Although the insurance business is their core business all these
companies, except ASR, have a separate legal entity that is operating as a bank and
does provide their mortgages. It should be noted, however, that Achmea, AEGON and
Nationale-Nederlanden sell parts of their mortgage portfolio to legal entities that apply
the Solvency regulation. This is also noticed by the Dutch National Bank (DNB) who
The Dutch mortgage market 5
argues that insurers have become more active as a provider of mortgage loans through
banking subsidiaries (Z24, 2014b);
Furthermore, Nationale Nederlanden Levensverzekering N.V. argues that it is
interesting to invest in mortgages for an insurer on page 113 of their annual report:
“Residential mortgages are a common investment class for Dutch insurance
companies, since their illiquidity provides a good match to the illiquidity of insurance
liabilities. Mortgages provide a good risk-reward profile at current spreads and the
risk is deemed manageable even if default losses are expected to rise.”
The regulations 6
3 The regulations
Both Basel III and Solvency II are based upon a three-pillar structure. The first pillar states
the minimum capital requirements, the second pillar sets additional capital requirements for
risks that are not covered in the first pillar and the third pillar specifies standards for the
public disclosure of regulatory information (Gatzert & Wesker, 2011). This study is restricted
to the first pillar, since the second pillar is specified for each company individually and the
capital requirements are not affected by the public disclosure requirements of the third pillar.
The capital requirements for banking and insurance industry are described in Section 3.1 and
3.2 and the capital requirements are theoretically compared in Section 3.3.
3.1 Capital requirements for the banking industry
The Basel Committee on Banking Supervision (BCBS) develops the regulatory guidelines for
the banking industry that are known as Basel Accords (BIS, 2013). However, these accords do
not hold the status of law and are therefore transformed into a Capital Requirements Directive
(CRD) by the European Commission (EC) in order to be part of European law. Basel III is the
most recent accord and is transformed into CRD IV (European Parliament, 2013).
Once the Basel guidelines are transformed into the CRD, national authorities have to
transform the CRD so that it fits into their national legislation. In the Netherlands, this is the
responsibility of the DNB. The national implementation of Basel III started in January 2013
and will be fully effective as of January 2019 (BIS, 2011).
The purpose of Basel III is to ensure that banks can absorb shocks arising from financial and
economic stress. Therefore, regulatory capital requirements are set to make sure that the
financial institutions are prudently managed. The capital that has to be held is divided into
Common Equity Tier-1 (CET1), Additional Tier-1 (AT1) and Tier-2 capital. See page 12-18
of Basel III: A global regulatory framework for more resilient banks and banking systems for
the definitions (BIS, 2011) for the definitions of these types of capital.
To compute the regulatory capital requirements regarding mortgages under Basel III the next
four steps have to be executed:
1. Compute the risk-weight in euros for the credit and operational risk;
2. Multiply the risk-weight with the capital adequacy ratio (also known as BIS-ratio);
The regulations 7
3. Compute and add the capital add-ons of pillar 21;
4. Compute the leverage ratio across the entire portfolio of the bank.
These steps are explained in the Sections 3.1.1-3.1.3. A schematically overview of Basel III is
presented in Appendix B.
3.1.1 Risk-weighted assets calculation
The first pillar of Basel III classifies four categories of risks; concentration, credit, market and
operational. The risk-weight has to be computed for each risk class individually and the total
risk-weight is the sum of these risk-weights.
Residential mortgages are only exposed to credit risk and operational risk if they comply with
the following definition (§231, BIS, 2005b): “Residential mortgage loans (including first and
subsequent liens, term loans and revolving home equity lines of credit) are eligible for retail
treatment regardless of exposure size so long as the credit is extended to an individual that is
an owner-occupier of the property (with the understanding that supervisors exercise
reasonable flexibility regarding buildings containing only a few rental units - otherwise they
are treated as corporate).”
Credit risk-weight
The credit risk-weight of residential mortgages can be computed using the standardized
approach or the IRB approach. Both approaches make a distinction between performing and
defaulted loans, where a mortgage is defined to be in default when the repayments are past
due for more than 90 days (BIS, 2005b).
Standardized approach
The standardized approach is the most basic method to compute the risk-weight. The
outstanding exposure of performing residential mortgages is multiplied with 35% (§72, BIS,
2005b) and for defaults with 100% (§78, BIS, 2005b).
IRB approach
The IRB approach allows banks to assign a specific risk-weight to each loan and client. The
credit risk-weight for performing loans is than computed with the following formulas (§328,
BIS, 2005b):
1 This study is restricted to the first pillar and therefore this step will be neglected.
The regulations 8
Where R is the correlation coefficient which is set at 0.15 for mortgages; K the capital
requirement; N(x) the normal cumulative distribution function; G(z) the inverse cumulative
distribution function; and RWA the risk-weighted assets. The input parameters PD, EAD and
LGD are defined on page 3-4 of An Explanatory Note on the Basel II IRB Risk Weight
Functions (BIS, 2005a) as:
“probability of default (PD) per rating grade, which gives the average percentage of
obligors that default in this rating grade in the course of one year
exposure at default (EAD), which gives an estimate of the amount outstanding (drawn
amounts plus likely future drawdowns of yet undrawn lines) in case the borrower
defaults
loss given default (LGD), which gives the percentage of exposure the bank might lose
in case the borrower defaults. These losses are usually shown as a percentage of EAD,
and depend, amongst others, on the type and amount of collateral as well as the type
of borrower and the expected proceeds from the work-out of the assets.”
The IRB approach has two versions; the foundation and advanced method. Under the
foundation IRB approach, the bank estimates the PD only, while under the advanced IRB
approach the banks also estimates the EAD and LGD (BIS, 2005a).
The PD estimate that is inserted in the formula for K is the average PDs that reflects the
expected default rates under normal business conditions. The Vasicek formula2 turns the
average PD into a downturn PD (dPD) which represents the PD in periods of economic stress.
The Vasicek formula applies a confidence level of 99.9% (BIS, 2005a).
In contrast to the PD, Basel III does not propose an explicit function to transform the LGD
into a downturn LGD (dLGD) and expect banks to determine this themselves (BIS, 2005a).
As explained on page 8 of An Explanatory Note on the Basel II IRB Risk Weight Functions
2
The regulations 9
(BIS, 2005a), both LGD parameters that are inserted in the formula for K are estimates of the
dLGD.
Since Basel III does not specify how this dLGD has to be computed, this differs per bank.
In the United States, in contrast to Europe, the Federal Reserve System proposed a generic
formula to compute the dLGD (Moody's Global Credit Policy, 2007)3:
The estimates of the average PD and the dLGD that are inserted in the formula to compute K,
are also restricted to a floor of 0.03% and 10% respectively (§266 & §331, BIS, 2005b).
However, the dLGD floor of 10% does not hold for mortgages that have NHG.
Applying the formula of K for non-performing loans will results in a K of zero, since both the
Vasicek formula and the PD are equal to 100%. Therefore, on page 8 of An Explanatory Note
on the Basel II IRB Risk Weight Functions (BIS, 2005a) is explained that the required capital
for defaulted mortgages is calculated via4:
Operational risk-weight
The capital charges for operational risk can be computed using the basic indicator approach,
the (alternative) standardized approach or the advanced measurement approach. Within ABN,
the alternative standardized approach is used to calculate the operational risk-weight.
The alternative standard approach is related to the standardized approach. The standardized
approach defines the bank’s activities into eight categories and the capital charge is computed
by summing up the individual charges for each business line. The alternative standard
approach uses the same business lines and only changes the computation of the business lines
retail banking and commercial banking. As stated in §653 (BIS, 2005b) mortgages fall under
the retail banking and the operational capital charge is:
3 Note that dLGD = 1 - downturn recovery rate, and that this could be rewritten to dLGD = α + (1 - α)LGD 4 “The difference of the downturn LGD and the best estimate of EL represents the UL capital charge for defaulted assets.”
Confidential
The regulations 10
Where βrb is the beta for the retail business line which is set at 12%; m is equal to 0.035; and
LArb is the average of outstanding loans and advances over the last three years (non-risk
weighted and gross of provisions) (BIS, 2005b).
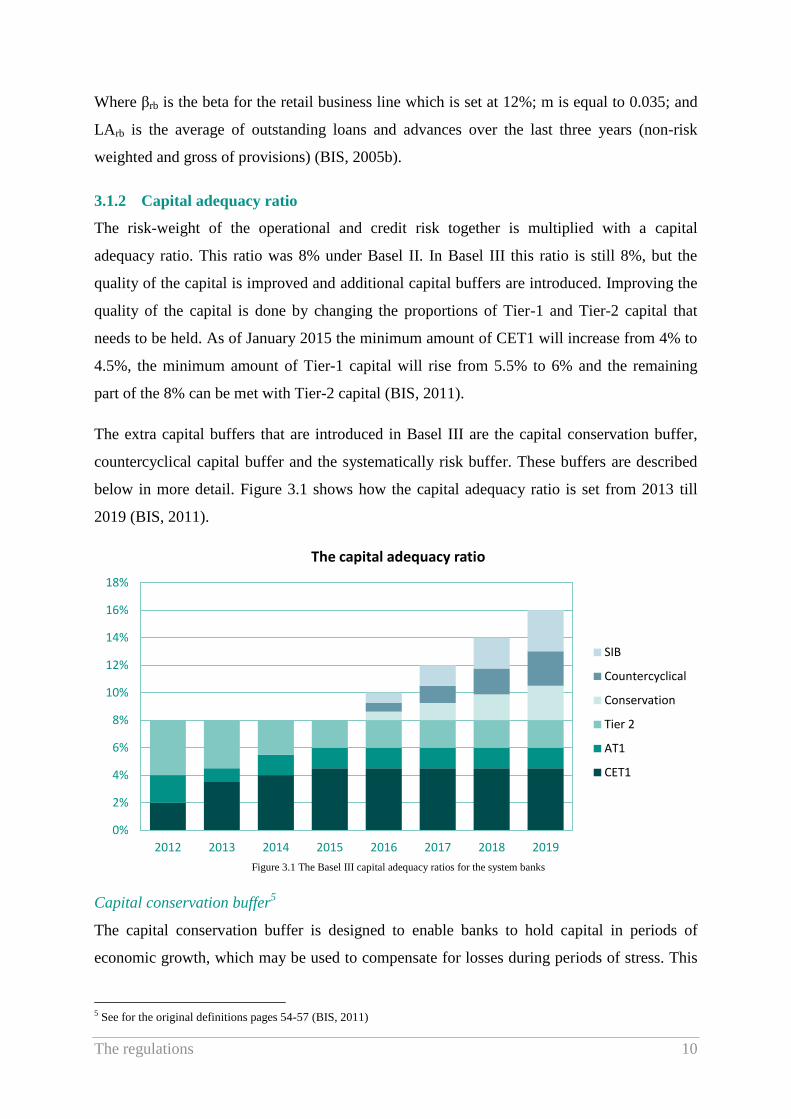
3.1.2 Capital adequacy ratio
The risk-weight of the operational and credit risk together is multiplied with a capital
adequacy ratio. This ratio was 8% under Basel II. In Basel III this ratio is still 8%, but the
quality of the capital is improved and additional capital buffers are introduced. Improving the
quality of the capital is done by changing the proportions of Tier-1 and Tier-2 capital that
needs to be held. As of January 2015 the minimum amount of CET1 will increase from 4% to
4.5%, the minimum amount of Tier-1 capital will rise from 5.5% to 6% and the remaining
part of the 8% can be met with Tier-2 capital (BIS, 2011).
The extra capital buffers that are introduced in Basel III are the capital conservation buffer,
countercyclical capital buffer and the systematically risk buffer. These buffers are described
below in more detail. Figure 3.1 shows how the capital adequacy ratio is set from 2013 till
2019 (BIS, 2011).
Capital conservation buffer5
The capital conservation buffer is designed to enable banks to hold capital in periods of
economic growth, which may be used to compensate for losses during periods of stress. This
5 See for the original definitions pages 54-57 (BIS, 2011)
Figure 3.1 The Basel III capital adequacy ratios for the system banks
0%
2%
4%
6%
8%
10%
12%
14%
16%
18%
2012 2013 2014 2015 2016 2017 2018 2019
The capital adequacy ratio
SIB
Countercyclical
Conservation
Tier 2
AT1
CET1
The regulations 11
means that banks are heading towards a two-level approach; one level is the ‘desired’ amount
of capital which can be used to absorb unexpected losses and the second level is the absolute
minimum amount of capital which has to be hold. However, consuming this buffer will lead
to supervisory restrictions. The capital conservation buffer requires banks to hold 2.5% of
CET1 above the minimum capital requirements of 8% and this will increase annually from
2016 until the value of 2.5% is reached in 2019.
Countercyclical capital buffer6
Banks can face severe losses in the event that a period of excessive credit growth is followed
by an economic downturn. The countercyclical buffer is introduced to prevent banks from the
consequences of such an event. This buffer will be set at 0% in times of normal credit
expansion and national authorities can raise it to a maximum of 2.5% if their country faces
excessive credit growth. Banks that are internationally active have to hold a weighted average
of the required buffers from the different countries. The countercyclical buffer is introduced
in the same way as the conservation buffer.
The BCBS noticed that a fast increase in the ratio of credit loans / gross domestic product
(GDP) often leads to problems (DNB, 2010). Therefore, national authorities are required to
compute this ratio over the long-term and compare this with the ratio of the last quarter. If the
current ratio exceeds the long-term ratio with more than 2%, the countercyclical buffer will be
set. The countercyclical buffer will be set at the maximum of 2.5% when the current ratio
exceeds the long-term ratio with 10% or more. The DNB computes what this buffer would
have been over history for Germany, the Netherlands, the United Kingdom and the United
States. These graphs are presented in Appendix C.
SIB Buffer
Some banks needed government support during the financial crisis to avoid a collapse that
would cause large economic problems. These banks are ‘too big to fail’ and therefore defined
as a SIB. Basel III wants to avoid that these banks cause economic problems by introducing a
SIB buffer. This buffer requires a SIB to hold extra CET1 capital (BIS, 2011). The percentage
of CET1 capital is defined by the national authorities. The DNB requires ABN, ING Bank and
Rabobank to hold a buffer of 3% and 1% for SNS Bank (DNB, 2014b). This buffer is
introduced similarly to the conservation and countercyclical buffer.
6 See for the original definitions page 57-60 (BIS, 2011)
The regulations 12
3.1.3 Leverage Ratio
Whereas the capital requirement – as explained above; RWA multiplied with the capital
adequacy ratio – are risk based, the leverage ratio is a non-risk based capital ratio. Therefore,
it will function as a ‘back stop’ measure for the risk-weighted capital charge, since a banks
has to hold the greater of the risk-weighted capital charge and the leverage ratio. The leverage
ratio is defined as Tier-1 capital divided by the total exposure and should equal 3% of the
outstanding exposure. It should be noted that this 3% is set as a test value by the European
Banking Authority and the real percentage will be published in 2017 (BIS, 2013). In the
Netherlands, there are already political discussions whether this leverage ratio should be
raised to 4% or even higher for Dutch banks (Z24, 2014a).
3.2 Capital requirements for the insurance industry
The regulatory framework for insurers is developed by the EC and is named Solvency. In
contrast to the Basel Accords, this framework holds the status of a law for insurers operating
in the European Union (EU). These guidelines are further specified in the Quantitative Impact
Study (QIS) done by the European Insurance and Occupational Pension Authority (EIOPA).
The results of the QIS are transformed into national legislation by the national authorities. As
of January 2016, Solvency II becomes effective (DNB, 2013).
In order to prepare for the Solvency II regulation EIOPA introduced preparatory guidelines
which are known as Solvency 1.5. National authorities have to apply these preparatory
guidelines in their country on a comply-or-complain basis as of January 2014, which means
that national authorities decide that their country applies these guidelines or explains why they
do not apply these guidelines. The DNB requires insurers to apply these guidelines as of
January 2015. However, the 40 largest life insurers already apply a Notional Solvency
Criterion (NSC), which is based on the Solvency II regulations. Insurers that breach the NSC
are not allowed to pay out dividends (DNB, 2013).
Solvency II makes a distinction between the solvency capital requirement (SCR) and the
minimal capital requirement (MCR). The SCR is the level of capital that an insurer needs to
hold to have sufficient resources over the next year with a certainty of 99.5%. Breaching this
requirement will lead to moderate supervision actions. The MCR is the absolute minimum of
capital that needs to be held and is set between 25% and 45% of the SCR. Breaching this
requirement will lead to serious supervision measures or even a bankruptcy. Solvency II
divides the capital into three different tiers: Tier-1, Tier-2 and Tier-3. The definitions of these
The regulations 13
tiers can be found on page 295-307 the QIS5 Technical Specifications (CEIOPS, 2010) . The
SCR should be met with at least 50% of Tier-1 items and could exist of utmost 15% Tier-3.
The SCR can be computed using either an internal model, standard model, a combination of
both models or by using simplifications. The regulation specifies rules that apply to the
standard model, but it does not specify any formulas for an internal model. Therefore, this
section only provides an overview of the capital requirements that are set regarding mortgages
under the standard model.
The next steps have to be executed to compute the SCR and are described in more detail in
the Sections 3.2.1-3.2.4. A full overview of the Solvency II frameworks is presented in
Appendix D.
1. Compute the solvency capital requirement for counterparty default risk for type 2
exposures (SCRdef,2);
2. Compute the solvency capital requirement for counterparty default risk (SCRdef);
3. Compute the basic solvency capital requirement (BSCR);
4. Compute the adjustment and operational risk.
3.2.1 SCRdef,2
Mortgages are treated as type 2 exposures under the counterparty default risk module if the
following requirements are met (p. 195-196, EIOPA, 2014): “(1) The exposure shall be either
to a natural person or persons or to a small or medium sized enterprise. … (3) The total
amount owed to the insurance or reinsurance undertaking … shall not, to the knowledge of
the insurance or reinsurance undertaking, exceed EUR 1 million. … (4) The residential
property is or shall be occupied or let by the owner. (5) The value of the property does not
materially depend upon the credit quality of the borrower.”
To compute the SCRdef,2 the following formula is used (141, CEIOPS, 2010):
Where NAV is the net value of assets; and the type 2 counterparty default shock is computed
as follows:
The regulations 14
Where Epast-due > 3m is the sum of values of receivables that are past due for more than 3
months; and E the sum of values for type 2 which is computed as follows:
Exposurei is the mortgage exposure to borrower i; and Securedi the fully and completely
secured part of the exposure to borrower i. The fully and completely secured part is the part of
the exposure covered by real estate after subtracting a haircut, which is 25% for residential
real estate (i.e. the secured part is 75% of the real estate value).
3.2.2 SCRdef
The SCRdef consist of type 1 and type 2 exposures; type 1 exposures may not be diversified
and the counterparty is usually rated, whereas type 2 exposures are usually diversified and the
counterparty is usually unrated (p. 134-135, EIOPA, 2010). As explained in Section 3.2.1,
mortgages are categorized as type 2 exposures. The SCRdef,1 and SCRdef,2 should be calculated
separately and the risk module SCRdef is than computed via (p. 136, CEIOPS, 2010):
3.2.3 BSCR
When the SCR is computed for each risk module individually, the BSCR can be computed via
the following formula (p. 95, CEIOPS, 2010):
Where i and j refer to the market, default, life, health and non-life risk; and Corrij is the
correlation of i and j as given in the correlation matrix given in Table 3.1.
Table 3.1 The BSCR correlation matrix (CEIOPS, 2010)
Risk type Market Default Life Health Non-Life
Market 1 0.25 0.25 0.25 0.25
Default 0.25 1 0.25 0.25 0.5
Life 0.25 0.25 1 0.25 0
Health 0.25 0.25 0.25 1 0
Non-Life 0.25 0.5 0 0 1
The regulations 15
3.2.4 SCR
The SCR is computed by adding up the BSCR, operational risk and adjust this for the risk
absorbing effect of technical provisions and deferred taxes. For residential mortgage loans,
the module adjustment for the risk absorbing effect of technical provisions and deferred taxes
is not applicable. Therefore, only the module BSCR and operational risk have to be
calculated. The operational risk is computed as follows (p.103-104, CEIOPS, 2010):
Where Expul represents the annual expenses during the previous 12 months in life insurance;
Op = max(Oppremiums ; Opprovisions); Oppremiums is calculated via a specified formula that uses
earned premiums as input paramters; Opprovisions uses obligations as input parameters.7
3.2.5 NSC
The DNB requires the 40 largest life insurers to stress-test their capital requirements which
specifies the computation for the capital requirements of mortgages similar to Solvency II.
However, the applied haircut for the residential real estate increases to 40% and mortgages
with NHG are treated differently; the type 2 counterparty default shock for mortgages with
NHG equals 0.07% of the outstanding exposure.
3.3 Theoretical comparison
Section 3.1 and 3.2 describe the methods to compute the regulatory capital requirements that
banks and insurers need to hold regarding mortgages. The methods of both regulations make a
distinction between performing and defaulted loans, where mortgages are defined to be in
default if the payments are past-due for more than three months. The major differences
between Basel III and Solvency II that could be noticed based upon these theoretical
descriptions are as follows:
The mortgage exposure is related to operational and credit risk under Basel III and to
operational and counterparty default risk under Solvency II;
The operational and credit risk of Basel III are based on a Value-at-Risk (VaR) of
99.9%8, while Solvency II uses a VaR of 99.5% for all their risk modules;
7 See pages 102-104 (CEIOPS, 2010) for more information on these formulas. 8 For the market risk Basel III uses a VaR of 99%.
The regulations 16
The standard approach of Basel III is not risk based, while the standard approach of
Solvency II does reflect risk within the SCRdef,2 which is based upon the Loan-to-
Foreclosure-Value (LtFV);
The regulatory capital requirements of Basel III are the greater of the capital ratio
times the risk-weight or the leverage ratio of 3% times the outstanding exposure.
Insurers do not have such a non-risk based ratio;
Solvency II has a two-level approach with the SCR and MCR, while Basel III does
only include a two-level approach in the conservation buffer;
Solvency II has a diversification benefit within the SCRdef module and one for the
calculation of the BSCR9, while Basel III does not include a diversification benefit;
The IRB approach under Basel III and the calculation of the SCR do not include any
explicit maturity adjustment. However, the fixed interest rate period is one of the
parameters that is used to model the PD such that the fixed interest rate period is
implicitly included in the IRB approach.
9 There is also a global diversification effect at the consolidated group level (Gatzert & Wesker, 2011)
The numerical comparison 17
4 The numerical comparison
The aim of this chapter is to compare the regulatory capital requirements of banks and
insurers based upon the XX mortgage portfolio of ABN. Section 4.1 will describe the
regulatory capital requirements for banks based upon this portfolio, Section 4.2 does this for
insurers and Section 4.3 will compare the regulatory capital requirements of both industries.
This study compares the advanced IRB approach of ABN with the standard model of
Solvency II. This is the consequence of the fact that ABN applies the advanced IRB approach
to their portfolio which makes it possible to obtain the appropriate data. However, Solvency II
does not describe how an internal model is built and therefore it is not possible to apply an
internal model with the obtained data. Some arguments that justify this approximation are
presented in Appendix E.
4.1 The capital requirement for banks
The first part of this section describes how the regulatory capital requirements for banks are
computed and the second part shows the results.
4.1.1 The regulatory capital requirements calculation
Confidential
Confidential
The numerical comparison 18
Finally, the regulatory capital requirement is the greatest among the risk-weighted capital
requirements and the leverage ratio. To show the influence of the leverage ratio this will be
presented separately from the risk-weighted capital charge. For a summary of the used
methods and all the assumptions to compute the regulatory capital requirement for banks, see
Table 4.1.
Table 4.1 Methods and assumptions used in this study for banks
Bank Assumptions
Confidential
4.1.2 The results
The regulatory capital requirements regarding the credit and operational risk are presented in
Figure 4.1. This figure uses the LGD as input and not the dLGD. The figure shows that the
Confidential
The numerical comparison 19
regulatory capital requirements of mortgages under the first pillar are dominated by the
leverage ratio, regardless if it is 3 or 4%. It should be noted, however, that pillar 2 is not
included in this comparison and that the leverage ratio is applied over the whole portfolio of
the bank and not for each individual investment. Therefore, business lines or mortgages with a
risk-weighted capital charge that is higher than the leverage ratio can compensate for those
that are below the leverage ratio.
Figure 4.1 The regulatory capital requirements for credit and operational risk
Confidential
Confidential
The numerical comparison 20
Figure 4.2 The influence of the downturn factor
Table 4.2 The influence of the fixed interest rate period on the credit risk capital charge
4.2 The capital requirement for insurers
Similar to Section 4.1 this section describes first how the regulatory capital requirements for
insurers under the standard model are computed and the second part shows the results. In
appendix E is justified that comparing the IRB approach of banks with the standard model of
insurers is not a bad approximation.
Confidential
Confidential
Confidential
The numerical comparison 21
4.2.1 The regulatory capital requirements calculation
The first step under Solvency II is to compute the SCRdef,2. This is done by applying the
following formula in Excel:
Once the SCRdef,2 is computed, the SCRdef can be computed as described in Section 3.2.2. The
formula for SCRdef uses correlation factors between type 1 and type 2 exposures and therefore
a diversification effect occurs. When the SCRdef is computed, the BSCR should be computed
as described in Section 3.2.3. This formula also uses correlations and creates another
diversification effect.
With the data used in this study, it is only possible to compute the SCRdef,2. Therefore, this
study uses a diversification factor to get from the SCRdef,2 to the BSCR of 0.4078 (i.e. the
diversification effect is -59.22% for both steps together). This diversification factor is
estimated based upon the average breakdown of type 1 / type 2 exposures and the average
breakdown for the six risk modules based upon the draft Technical specifications for QIS5
(EC, 2010). The assumption of the diversification effect is discussed in more detail in
Appendix G.
The last step to compute the SCR is to add the operational risk and adjustment to the BSCR.
The adjustment does not apply to mortgages and the operational risk can be calculated as
explained in Section 3.2.4. However, this is not possible with the obtained data. Therefore, the
operational risk is estimated at 5.4% of the BSCR, which is similar to the operational risk as
presented in the EIOPA Report on the fifth Quantitative Impact Study (QIS5) for Solvency II
(2011). The 5.4% is distributed proportional to the residual debt of each risk class.
4.2.2 NSC
The SCR for mortgages under the NSC can be computed using similar steps as mentioned in
Section 4.2.1. The only difference is that the SCRdef,2 is applied in Excel as follows:
IF H “J” 6
foreclosure value))
An overview of all the methods and assumptions to compute the regulatory capital
requirements regarding mortgages for insurers is presented in Table 4.3.
The numerical comparison 22
Table 4.3 Methods and assumptions used in this study for insurers
Insurers Assumptions
Regulation framework Solvency II and NSC
Method to compute SCR Standard model
Treatment operational risk 5.4% of the BSCR*
Diversification factor from SCRdef,2 to BSCR 0.4078 (i.e. diversification of -59.22%)
* As explained before, with the data used in this study it is not possible to compute the operational risk-weight
4.2.3 The results
The result of applying the standard model of Solvency II and NSC with the diversification
factor of 0.4078 is presented in Figure 4.3. The SCRdef,2 for LtFVs up to 75% are zero for
Solvency II (up to 60% for NSC). Therefore, the SCR for LtFVs below these values consist of
the operational risk only.
Figure 4.3 The RC requirements exclusive operational risk
The figure shows that the NSC and Solvency set different capital requirements. Most striking
is the difference in the treatment of NHG mortgages, for which the NSC does specify separate
rules, whereas Solvency II does not make such a distinction.
4.3 Comparison
To show the differences in the regulatory capital requirements for banks and insurers, the
regulatory capital requirements of both industries are presented in Figure 4.4.
0,00%
1,00%
2,00%
3,00%
4,00%
5,00%
Cap
ital
re
qu
ire
me
nt
/ re
sid
ual
de
bt
LtFV
The SCR for mortgages
Solvency II
NSC
The numerical comparison 23
Figure 4.4 The regulatory capital requirements of Solvency II, NSC and Basel III
Confidential
Confidential
The numerical comparison 24
Confidential
The pricing 25
5 The pricing
This chapter shows what the cost of capital are for the regulatory capital requirements as
derived in Chapter 4 for banks and insurers. After deriving the cost of capital, it is analysed if
these differences are reflected in the interest rates that banks and insurers set for the customer.
5.1 Cost of capital
Table 5.1 total regulatory capital requirements per regulation
Confidential
Confidential
The pricing 26
Table 5.2 cost of capital in EUR 1,000
Table 5.3 cost of capital in basis points
Confidential
Confidential
Confidential
Confidential
The pricing 27
Table 5.2 and 5.3 show the same trend as the figures of Chapter 4. The total cost of capital is
5.2 Interest rates comparison
The numerical comparison of Chapter 4 shows that there are differences in the regulatory
capital requirements of banks and insurers and Section 5.1 shows that there are differences in
the cost of capital that has to be included in the interest rates. This chapter will show whether
these differences are reflected in the pricing by analysing the interest rates. This chapter starts
with an explanation of how the analysis is conducted after which the results are shown and
discussed.
The interest rates fluctuate over time. To deal with these fluctuations, the interest rates of are
averaged over the last year for each mortgage provider. The interest rates that are used are
those as reported within ABN on the first Monday of each month from October 2013 till
September 2014. In Appendix H is shown which mortgage providers are included in this
dataset and which providers are seen as a bank or insurer. The differences in the average
interest rates over the last year between banks and insurers are presented in Figure 5.1. A
positive value indicates that banks are offering lower interest rates and vice versa.
Figure 5.1 The average interest rate difference between banks and insurers of the last year
Confidential
Confidential
The pricing 28
Figure 5.2 The interest rate differences between banks and insurers of September 1, 2014
Confidential
Confidential
Conclusions & Recommendations 29
6 Conclusions & Recommendations
Whereas the main providers of Dutch residential mortgages have been banks during history,
insurers have increased their mortgage production during the last years. This could be the
effect of the recent developments in the regulation frameworks for banks and insurers. These
frameworks set capital requirements to make the financial system more stable. It is the aim of
this research to indicate if there are differences in the regulatory capital requirements for
banks and insurers for the product Dutch mortgages.
As hypothesis, it is assumed that there are differences in the regulatory capital requirements
and therefore this study gives a more in-depth insight in the differences based on a theoretical
description of the regulations and a numerical comparison of the regulations based upon the
XX mortgage portfolio.
The theoretical description shows that mortgages are exposed to operational and credit risk
under the Basel III approach with a VaR of 99.9%, whereas mortgages are exposed to
operational and counterparty default risk under Solvency II with a VaR of 99.5%. The
methods to compute the credit risk under Basel III and counterparty default risk under
Solvency II are both risk-based, except for the standard approach of Basel. In addition to the
risk-based capital requirements, Basel III introduced a leverage ratio which is a non-risk
based measurement. Furthermore, Solvency II takes a diversification effect into account
which is not considered under Basel III.
The numerical comparison confirms that there are differences in the regulatory capital
requirements between both regulations. This comparison is restricted to the first pillar and
computes the credit risk of Basel III with the advanced IRB approach and the SCR of
solvency II with the standard model. To compute the SCR, the diversification effect is
estimated at 59.22%, which is based upon the averages as presented in EIOPA Report on the
fifth Quantitative Impact Study (QIS5) for Solvency II (2011) for solo undertakings.
Confidential
Conclusions & Recommendations 30
The analysis of the interest rates shows that there are differences between the average interest
rates of banks and insurers last year. This analysis shows that the interest rates of insurers are
lower for long-term fixed interest rates and high LtMVs. This could be the consequence of the
fact that insurers try to match their long-term liabilities with long-term assets.
Confidential
Conclusions & Recommendations 31
6.1 Limitations
There are a few features of the current research that limit the conclusions that can be drawn
from these results. Foremost among these is the exclusion of the second pillar. It is likely that
its inclusion would increase the gap between the capital requirements of both regulations,
since Basel III does expect banks to hold more capital above the requirements as set under the
first pillar, while the use of these capital add-ons is not explicitly planned under Solvency II
(Gatzert & Wesker, 2011). Besides the exclusion of the second pillar, this study also excludes
mortgages that are in default. Including both the second pillar and the defaulted mortgages
would show the full capital requirements that are set under both regulations. Another
limitation is the lack of data from an insurer’s perspective. A comparison which is constructed
in cooperation with both a bank and an insurer would increase the reliability.
Furthermore, it should be noted that the development of the Solvency II regulations is still in
progress. Since this framework is not fully developed yet, it is unclear what the precise capital
requirements will be. One of the most important things that is still unclear is whether the
matching adjustment will apply to mortgages.
6.2 Suggestions for future research
This study contributes to a better understanding of the differences between banks and insurers
regarding the issuance of mortgages. However, further research can help to get a better insight
in the differences between the behaviour of banks and insurers on the mortgage market:
A complete comparison of the regulatory capital requirements which also includes
defaulted mortgages and the second pillar;
The analysis as executed in this study can be supplemented with an analysis of the
capital requirements under an internal model for insurers, since it could be expected
that insurers with an increased activity in the mortgage market would like to gain from
the advantages of an intern model. Therefore, such a model would give a better insight
in the estimation of the risks and it is likely that the capital requirements are lowered;
Valuable insights could be gained by comparing all the aspects that affect the pricing
of mortgages for the banking and insurance industry. Some examples of aspects that
could be included are the cost of funding, liquidity and provisions;
Better products could be offered if all the factors that influence the customer choice
for a specific mortgage provider are analysed.
References 32
7 References
A.S.R. (2011, April 26). Building confidence: ASR Nederland 2010 annual report. Retrieved
from http://www.afm.nl/registers/fv_documents/6495.pdf
A.S.R. (2014, May 02). 2013 annual report.
AAHG. (2014, January). AAHG maandrapportage hypotheekmarkt & marktaandelen tot en