The Dynamic Impact of Unilateral Environmental Policies David HØmous INSEAD and CEPR Abstract This paper builds a two-country, two-sector (polluting, nonpolluting) trade model with directed technical change, examining whether unilateral environmental policies can ensure sustainable growth. The polluting good generates more or less emissions depending on its relative use of a clean and a dirty input. I show that a unilateral policy combining clean research subsi- dies and a trade tax can ensure sustainable growth, while unilateral carbon taxes alone increase innovation in the polluting sector abroad and gener- ally cannot ensure sustainable growth. Relative to autarky and exogenous technical change respectively, the mechanisms of trade and directed techni- cal change accelerate environmental degradation either under laissez-faire or with unilateral carbon taxes, yet both help reduce environmental degradation under the appropriate unilateral policy. I characterize the optimal unilateral policy analytically and numerically using calibrated simulations. Knowledge spillovers have the potential to reduce the otherwise large welfare costs of restricting policy to one country only. Key words: climate change, environment, directed technical change, innovation, trade, unilateral policy JEL: F18, F42, F43, O32, O33, O41, Q54, Q55 Previous versions were circulated under the titles "Environmental Policy and Directed Technical Change in a Global Economy: Is There a Case for Carbon Tari/s?" and "En- vironmental Policy and Directed Technical Change in a Global Economy: The Dynamic Impact of Unilateral Environmental Policies." INSEAD, Boulevard de Constance, 77300 Fontaineblean France. +33160724818 Email address: [email protected](David HØmous) URL: http://faculty.insead.edu/david-hemous/ (David HØmous) Preprint submitted to Elsevier February 4, 2015
Transcript
The Dynamic Impact of Unilateral EnvironmentalPolicies
David Hémous∗
INSEAD and CEPR
Abstract
This paper builds a two-country, two-sector (polluting, nonpolluting)trade model with directed technical change, examining whether unilateralenvironmental policies can ensure sustainable growth. The polluting goodgenerates more or less emissions depending on its relative use of a clean anda dirty input. I show that a unilateral policy combining clean research subsi-dies and a trade tax can ensure sustainable growth, while unilateral carbontaxes alone increase innovation in the polluting sector abroad and gener-ally cannot ensure sustainable growth. Relative to autarky and exogenoustechnical change respectively, the mechanisms of trade and directed techni-cal change accelerate environmental degradation either under laissez-faire orwith unilateral carbon taxes, yet both help reduce environmental degradationunder the appropriate unilateral policy. I characterize the optimal unilateralpolicy analytically and numerically using calibrated simulations. Knowledgespillovers have the potential to reduce the otherwise large welfare costs ofrestricting policy to one country only.
Previous versions were circulated under the titles "Environmental Policy and DirectedTechnical Change in a Global Economy: Is There a Case for Carbon Tariffs?" and "En-vironmental Policy and Directed Technical Change in a Global Economy: The DynamicImpact of Unilateral Environmental Policies."
∗INSEAD, Boulevard de Constance, 77300 Fontaineblean France. +33160724818Email address: [email protected] (David Hémous)URL: http://faculty.insead.edu/david-hemous/ (David Hémous)
Preprint submitted to Elsevier February 4, 2015
1. Introduction
Despite the signature of the Kyoto protocol in 1997, annual carbon diox-ide (CO2) emissions increased by 39% between 1997 and 2010. Meanwhile,climate negotiations have stalled and no global agreement is in sight. In re-sponse, several countries have undertaken unilateral environmental policieswith varying degrees of ambition and success. For instance, the EuropeanUnion implemented a cap-and-trade system (EU ETS) in 2005 which coversaround 45% of the EU’s greenhouse gas emissions. However, such policiesgenerate a pollution haven effect, as the production of tradable and pollutinggoods moves to countries with laxer policies, which leads to an increase intheir emissions. Could unilateral policies nevertheless achieve the necessaryreduction in CO2 emissions? If so, how should they be designed? These ques-tions are fundamentally about the economy’s long-run behavior. Over thetime period relevant to climate change, comparative advantages evolve withinnovation, which itself responds to environmental policies. Yet, the eco-nomic literature on unilateral environmental policies has largely ignored therole played by innovation. This paper builds a trade model featuring directedtechnical change and a global pollution externality, and thereby highlightsthe crucial role that innovation plays in the positive and normative analysisof unilateral climate change policies.More formally, I consider a dynamic Ricardo—Heckscher—Ohlin model
with two countries, North and South, and two sectors, polluting and non-polluting. The North represents countries willing to implement an environ-mental policy, and the South, countries that are not– a division which neednot fall along the lines of developed versus developing countries. The pollut-ing good represents the tradable goods with a high CO2 emission intensity,typically energy-intensive sectors. It is produced using clean inputs (e.g.,renewable and nuclear energy or bioplastics) and/or dirty inputs (e.g., fossilfuel energy or traditional petroleum products). Innovation is undertaken inboth countries by profit-maximizing firms that hire scientists. It can be di-rected at the nonpolluting sector, or, within the polluting sector, at clean ordirty technologies. For most of the analysis, innovation is completely local.In laissez-faire, the allocation of innovation favors the exporting sector
and therefore reinforces comparative advantage over time. This results froma market size effect: a country exports the good that it produces relatively
2
more, such that the market for innovation in that sector is relatively larger.As in Acemoglu et al. (2012a; henceforth AABH), the allocation of innova-tion within the polluting sector exhibits path-dependence, also because of amarket size effect (a more advanced technology has a larger market whichincreases the profits of subsequent innovators). If clean technologies are ini-tially less advanced than dirty ones, the laissez-faire equilibrium leads theeconomy toward an environmental disaster, as the quality of the environ-ment falls below a critical threshold. In other words, economic growth is notsustainable. The paper analyzes whether this disaster can be prevented byspecific policies in the North only, and doing so, makes two important points.First, carbon taxes are generally unable to prevent an environmental dis-
aster and may even be counterproductive. A carbon tax in the North leadsto a reallocation of some of the polluting good’s production from the Northto the South (a static pollution haven effect). It cannot prevent an envi-ronmental disaster if the South initially had a comparative advantage in thepolluting sector, since then, the South specializes further in the pollutingsector and its emissions keep growing. Moreover, because reallocating pro-duction goes hand in hand with reallocating innovation, a Northern carbontax actually increases dirty Southern innovations (a dynamic pollution haveneffect) and thereby may accelerate environmental degradation.Second, a temporary industrial policy, which combines clean research sub-
sidies and a trade tax, may prove to be more effective. Such a policy canhelp the North develop a comparative advantage in the polluting sector whilemaking that sector cleaner at the same time. This ensures that emissionseventually start decreasing in both countries. If the initial environmentalquality is high enough, an environmental disaster can be averted. Impor-tantly, directed technical change is essential for this result; with exogenoustechnical change, unilateral policies in the North could still fail to prevent adisaster when the South initially has a suffi ciently large comparative advan-tage in the polluting sector.The optimal unilateral policy can be decentralized through a carbon tax
and research subsidies in the North along with a trade tax on the pollutinggood. When the social planner values equally consumption in the Northand the South, the trade tax typically takes the form of a tariff and thenof an export subsidy. Its expression reflects two aims of the social planner:reducing emissions in the South and redirecting Southern innovation towardthe nonpolluting sector. To illustrate the results, I conduct a numericalexercise where, in accordance with the literature, the South corresponds to
3
countries with no binding constraints under the Kyoto protocol. This exerciseshows that, even though avoiding a disaster is possible, the welfare costs fromnot being able to intervene in the South may be very large. It also highlightsthe double-edged nature of trade and directed technical change. Relativeto autarky and exogenous technical change respectively, the mechanisms oftrade and directed technical change accelerate environmental degradationeither under laissez-faire or with unilateral carbon taxes, yet both help reduceenvironmental degradation under the appropriate unilateral policy.Finally, the model is enriched by including knowledge spillovers. Unilat-
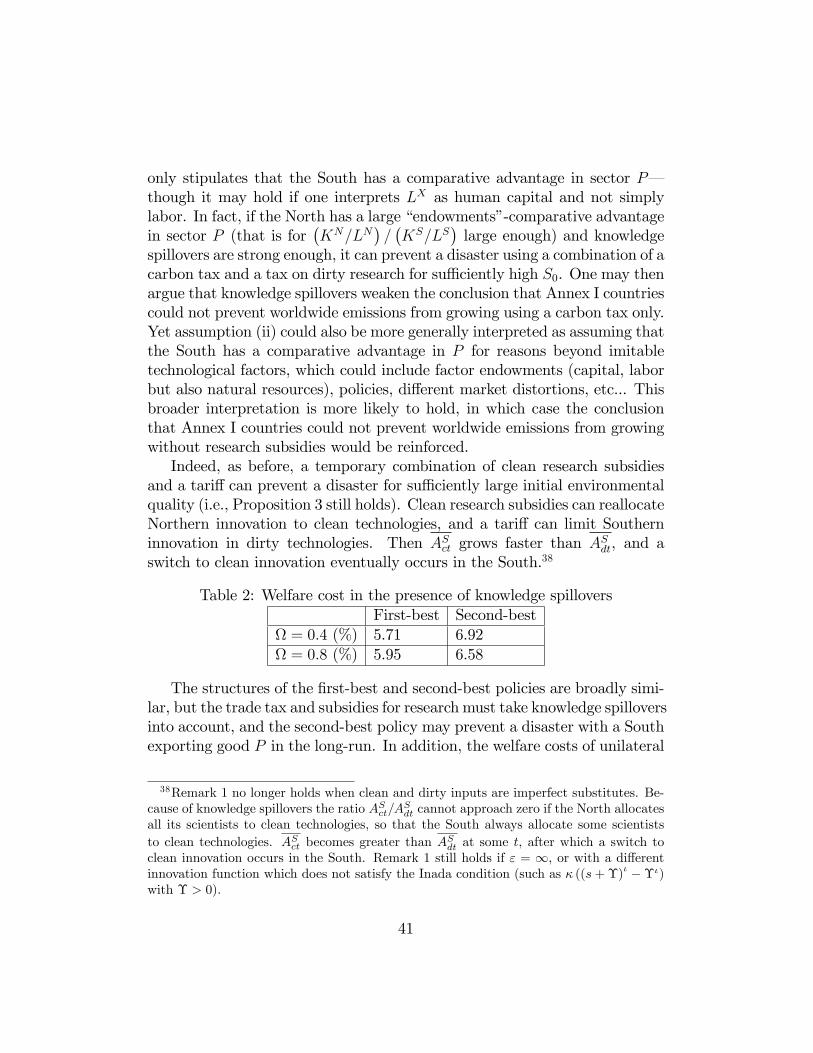
eral carbon taxes may still fail to prevent an environmental disaster; whereasa combination of clean research subsidies and a carbon tariff can do so forsuffi ciently high initial environmental quality. In this scenario, however, thediffusion of knowledge can ensure a switch toward clean innovation in theSouth; hence an environmental disaster can be prevented even though theSouth still specializes in the polluting good. In addition, the welfare costsfrom not being able to intervene in the South are much lower.This paper can be interpreted as a green version of the “infant industry
argument,”which claims that trade can be detrimental to growth if it leadscountries to specialize in sectors with poor development prospects (Krug-man,1981, Young, 1991, Matsuyama, 1992). Here as well, a country risksspecializing in the “wrong”sector, not because that sector offers poor growthprospects, but because this country cannot prevent the environmental exter-nality associated with production in that sector. The idea that free trade mayamplify comparative advantages and that a temporary trade policy could per-manently reverse the trade pattern was previously touched on by Krugman(1987), and Grossman and Helpman (1991, ch. 8).1
It has long been recognized that, in an open world, the pollution haveneffect hampers the effectiveness of unilateral policies for reducing world pollu-tion (Pethig, 1976). Empirical evidence is reported by Copeland and Taylor(2004) or Broner, Bustos and Carvalho (2012). Markusen (1975) and Hoel(1996) show that the optimal instrument for addressing the pollution haveneffect is a tariff. In the context of global warming, where the pollutant
1Krugman’s (1987) is based on learning-by-doing, and Grossman and Helpman’s (1991)model features endogenous growth in one sector only. A few papers have built models withtrade and directed technical change; examples include Acemoglu (2003), who studies theimpact of trade on the skill bias of technological change, and Gancia and Bonfiglioli (2008),who show that trade amplifies international wage differences.
4
(CO2) enters at several stages of the production process, several papers usecomputable general equilibrium (CGE) models to track carbon through theglobal economy; in this way they determine the pattern of trade and computethe carbon leakage rate (the rate at which emissions abroad increase after adomestic reduction). Developed countries are net carbon importers, whichjustifies the focus of the paper on the case where the South has a comparativeadvantage in the polluting sector: Atkinson et al. (2011) find that the net USimports of carbon from China in 2004 amounted to 244 million tons of CO2
or 0.9 percent of total world emissions that year; the OECD STAN databaseestimates that for OECD countries net CO2 imports represent 12.6% of CO2
emissions from production. Elliott et al. (2010) compute a carbon leak-age rate of 20 percent from a reduction in Annex I countries– the countrieswith binding constraints under the Kyoto protocol– and show that bordertax adjustments eliminate half of it.2 There are comparatively few empiricalstudies. Aichele and Felbermayr (2012) find that countries which committedto the Kyoto protocol reduced domestic CO2 emissions by about 7%, but didnot change their total CO2 consumption. While this literature has focusedon static models, the novelty of the present paper is to incorporate dynamicaspects. This comes at the expense of a more detailed model of world trade(as in CGE models) and of a study of the strategic interactions betweencountries (as in Copeland and Taylor, 2005).A growing literature has shown the importance of taking into account
directed technical change when designing climate change policies. On theempirical side, Popp (2002) shows that an increase in energy prices leadsto more energy-saving innovation; similar results are found by Newell, Jaffeand Stavins (1999) in the air conditioner industry and by Hassler, Kruselland Olovsson (2012) using macroeconomic US data. Aghion et al. (2012)focus on the car industry and establish that an increase in fuel prices leadsto clean innovation at the expense of dirty innovation and that there is pathdependence in clean versus dirty innovation– findings in line with the resultsreported here. On the theoretical side, several papers have integrated di-rected technical change in the study of climate change policies; here, I buildon AABH.3 The final good in AABH and the polluting sector in this paper
2Among others, Babiker and Rutherford (2005); Böhringer, Fisher and Rosendahl(2010); and Böhringer, Carbon and Rutherford (2011) find similar results.
3Earlier work on the environment and directed technical change includes Bovenbergand Smulders (1995) Goulder and Schneider (1999), van der Zwaan et al. (2002) , Popp
5
are produced similarly with a clean and a dirty input, which are substitutesfor each other. Yet, AABH focus on a closed economy and does not featurea “non-polluting sector”as in this paper. Therefore, in AABH carbon taxescan still prevent an environmental disaster by redirecting innovation towardsclean technologies. This result, which would still hold if there was only onecountry, collapses in an open economy, as carbon taxes are often insuffi cientand sometimes counterproductive. Acemoglu, Aghion and Hémous (2014)present a simple North-South extension of AABH, where countries trade apolluting and a non-polluting goods. Crucially, the two goods are assumedto be substitute and there is no innovation which can make the polluting in-put less polluting (therefore the two goods are similar to the clean and dirtyinputs in this set-up). Besides the South cannot innovate even if it reachesthe technological frontier. In that paper, carbon taxes necessarily reduce theamount of emissions in the long-run (contrary to here), but may be unableto prevent an environmental disaster (yet this result rests on the assumptionthat Southern imitators coordinate on a bad equilibrium). The present paperreverses these assumptions, which provides a more realistic and richer frame-work. Di Maria and Smulders (2004) and Di Maria and van der Werf (2008)also study the allocation of innovation between an energy-intensive sectorand a non—energy-intensive sector in a directed technical change model withtrade, but they also overlook that innovations within the energy-intensivesector could either reduce or increase pollution.4
Finally, this paper relates to the large “integrated assessment models”(IAMs) literature which builds dynamic models of the economy and the cli-mate to evaluate the impact of climate change policies on welfare. Thisliterature has been pioneered in particular by Nordhaus (1994), who devel-oped the DICE model for a world economy, and Nordhaus and Boyer (2000),who developed the RICE model for a multi-regions economy. It aims at de-riving (quantitatively) the optimal policy, which generally takes the form ofa carbon tax schedule (see, for instance, Golosov et al., 2014, for a recenttreatment, or Krusell and Smith, 2009, for an ongoing project with highly
(2004) and Grimaud and Rouge (2008). See also Acemoglu et al. (2012b).4In Di Maria and Smulders (2004), the North develops technologies and the South
imitates. Opening up to trade leads to a reallocation of innovation toward the sectorthat the North exports. Carbon leakage is reduced when the goods are substitutes andamplified otherwise. In Di Maria and van der Werf (2008), both countries innovate andcarbon leakage is always reduced by the innovation response to a unilateral cut in emissions.
6
disaggregated regions). While this literature generally ignores endogenousinnovation, this paper shows that in the presence of externalities in knowl-edge creation, green R&D subsidies are a crucial part of the optimal climatepolicy (a point also made by AABH). In addition, it also derives the opti-mal unilateral policy in the presence of trade in goods, which neither thisliterature nor the CGE trade literature mentioned above do.5
Section 2 presents the model. Section 3 studies the equilibrium, identifieswhich policies are able to ensure sustainable growth and discusses the model’smain assumptions. Section 4 solves for the second-best policy when theSouth is constrained to be in laissez-faire, both analytically and numerically.Section 5 discusses how the main results generalize when there are knowledgespillovers. An online Appendix contains the proofs and further extensions.
2. Model
I consider a discrete-time, infinite-horizon two-country (North, N , andSouth, S), two-sector (polluting P and non-polluting NP ), three-factor (cap-ital, labor and scientists) Heckscher—Ohlin—Ricardo model in which sector Pis similar to the economy of AABH. Each country is endowed with a fixedamount of labor and capital, LN , KN and LS, KS, and a mass 1 of scientists.The North is meant to represent countries which are ambitious in tacklingclimate change and the South countries which are not. I consider an ad-mittedly extreme scenario in which the North is able to implement strongenvironmental policies and the South does not carry any policy at all– ofcourse, in reality, most countries lay somewhere between these two extremes.As already mentioned, the division North-South need not fall along the linesof developed versus developing countries, in particular because the UnitedStates have not signed the Kyoto protocol. Yet, in the numerical exercise, Ifollow the CGE literature and identify the North with the countries whichwere subject to binding constraints under the Kyoto protocol, including theUnited States, and the South with the rest of the world.
2.1. WelfareThe economy admits, for each period t, a representative agent in the
North who lives for one period and a like representative agent in the South.
5Hassler and Krusell (2012) are close to doing so but their model does not feature tradein goods (nor innovation), and they do not explore the full set of policy instrumments.
7
The utility of time-t agent in country X ∈ N,S is given by ν (St)CXt ,
where St is the quality of the environment (identical in North and South)and CX
t is the final good consumption in country X. The social welfarefunction aggregates these preferences according to:
U =
∞∑t=0
1
(1 + ρ)t
(v (St)
(CNt + CS
t
))1−η
1− η ; (1)
where ρ > 0 is the discount rate and η ≥ 0 is the inverse elasticity of intertem-poral substitution (η = 1 corresponds to a logarithmic utility). Therefore,the social planner cares only about the time profile of world consumption andenvironmental quality. Section 4.2 discusses an alternative set-up where shealso cares about the distribution of consumption between North and South.Consumption, CX
t , and environmental quality, St, are weakly positive andv is increasing in St. There is an upper-bound on St, denoted S, that corre-sponds to a pristine environment. I define an environmental disaster as aninstance of environmental quality reaching zero in finite time. I assume thatv (0) = 0 so that a disaster is as detrimental to welfare as zero consumption.6
2.2. ProductionFinal consumption is a Cobb-Douglas aggregate of the consumption of
two goods, polluting, P , and nonpolluting, NP :
CX =(CXP
)ν (CXNP
)(1−ν), (2)
where CXY represents the quantity of good Y ∈ P,NP consumed in country
X ∈ N,S.7 The analysis extends easily to the case where the consumptionaggregate between the two goods is CES with an elasticity of substitutionsmaller than 1.8 Goods P and NP are the only goods that are traded in-ternationally. Good P represents tradable goods the production of which
6The notion of sustainability is defined in the literature on exhaustible resource. Aconsumption path is sustainable if the consumption flow is bounded away from zero.Here, environmental quality affects utility directly, so a path can be defined as sustainableif the utility flow is bounded away from the utility flow obtained with zero consumption.Therefore the economy is on an unsustainable path if a disaster occurs.
7Whenever this does not lead to confusion, I drop the time subscript but it should beclear that allocations, technologies and policies are time-dependent.
8A previous version of the paper (CEPR Discussion Paper 9733) does so. On the otherhand, the analysis would be different if the elasticity of substitution is greater than 1 (seesection 3.6).
8
generates a lot of greenhouse gases emissions (in particular energy-intensivegoods), while goodNP represents the other tradable goods. When the modelis calibrated, good P is identified with the sectors which have the highestCO2 emissions over value-added ratio, namely the manufacture of chemicalsand chemical products (ISIC code 24), other nonmetallic mineral products(26), and basic metals (27), good NP is identified with the rest of manu-facturing (see Table A.1 in Appendix A.15). Even though not all emissionscan be traced to the tradable sector, the paper initially focuses on tradablegoods, since it is because of international trade that policymakers fear thatunilateral policies may have adverse consequences. Emissions for the produc-tion of tradable goods represent a significant share of CO2 emissions– onceelectricity and heat are allocated to consuming sectors, manufacturing andconstruction represented 36.9 % of world CO2 emissions in 2010 according tothe International Energy Agency.9 The inclusion of nontradables is discussedin Section 5.Good P is produced competitively with a clean input Y X
c and a dirtyinput Y X
d according to
Y XP =
((Y Xc
) ε−1ε +
(Y Xd
) ε−1ε
) εε−1
, (3)
where ε > 1 is the elasticity of substitution between the clean and the dirtyinput. The clean input models nonpolluting inputs that could substitute forpolluting inputs, for instance, renewable energies to replace fossil fuel energyor bioplastics to replace traditional petroleum products.Goods c, d and NP in country X are produced competitively following
Y XNP =
(∫ 1
0
AXNPi(xXi)γdi
)((KXnp
)β (LXnp)1−β
)1−γand (4)
Y Xzt =
(∫ 1
0
AXzi(xXzi)γdi
)((KXz
)α (LXz)1−α
)1−γfor z ∈ c, d . (5)
KXnp and L
Xnp are the capital and labor employed in the assembly of good NP
in country X; xXNPi is the quantity of intermediates i employed in sector NP ;
9Construction is nontradable, but agriculture and forestry, which are tradable activities,are not included in this figure. Using input-output tables Davis and Caldeira (2010)estimates that today, 23% of carbon emitted is attributable to the production of goodsthat will be exported.
9
and AXNPi is its productivity, which is specific to the country and the sector.KXz , L
Xz , x
Xzi and A
Xzi are defined similarly for good z ∈ c, d. γ is the factor
share of intermediates. Intermediates cannot be traded internationally andare produced monopolistically according to
xXNPi = ψ−1(KXNPi
)β (LXNPi
)1−βand xXzi = ψ−1
(KXzi
)α (LXzi)1−α
for z ∈ c, d .(6)
KXnpi and L
Xnpi are the capital and labor employed in the production of inter-
mediate i for good NP in country X (and KXzi and L
Xzi are defined similarly).
Since the same factor share is used in the production of intermediates and inthe final assembly of the good, β ∈ (0, 1) is the overall factor share of capitalin sector NP , and α ∈ (0, 1) is the overall factor share of capital in sectorz ∈ c, d.10 Therefore the production of goods c and d and the productionof good NP only differ in the capital share. I assume throughout that α > β,which is true empirically: within tradables, polluting sectors tend to be morecapital intensive. All results hold when α < β and the analysis of this sectioncan be extended to a pure Ricardian model with α = β.11
I use KXNP and K
XP to denote total employment of capital in sectors NP
and P in country X, so that:
KXNP ≡ KX
np+
∫ 1
0
KXNPidi and K
XP ≡ KX
c +KXd +
∫ 1
0
KXci di+
∫ 1
0
KXdidi. (7)
Similarly, LXNP and LXP denote the total employment of labor in sectors NP
and P in country X. Factor market clearing and good market clearing imply:
KXP +KX
NP ≤ KX and LXP + LXNP ≤ LX , (8)
CNP + CS
P ≤ Y NP + Y S
P and CNNP + CS
NP ≤ Y NNP + Y S
NP . (9)
10The Cobb-Douglas structure of production for intermediates is important because itensures that monopolists get a constant share of the sector’s revenues, which mattersfor the incentives to innovate. Yet, the analysis can be extended straightforwardly toproduction functions for which aggregation between capital and labor is not Cobb-Douglas.11A Ricardian model would pose some technical diffi culties for section 4 as explained
below. With different factor shares in the two sectors, the analysis is not significantlymore complex, the model can account for situations where both countries do not fullyspecialize and it will later be easy to introduce knowledge spillovers, as another reason fortrade than technological differences is then needed. There is nothing special about capitaland labor being the two factors here instead of high-skill and low-skill labor for instance.This is why the paper abstracts from capital accumulation.
10
Intermediates producers face an iso-elastic demand with a price elasticityof 1/ (1− γ) and therefore charge a mark-up 1/γ over marginal cost. Thisleads to a classic monopoly distortion, as too few intermediates are produced.A subsidy (1−γ) to the purchase of intermediates ensures that the consumerprice is equal to marginal costs and therefore corrects for the monopoly dis-tortion (see Appendix A.1). To simplify the exposition and focus the com-parison between first-best and second-best on environmental issues, I assumethroughout that this subsidy is implemented in both countries. Since theshare of intermediates is the same for all sectors, the monopoly distortiononly has a scale effect, and this assumption is completely innocuous. Hence-forth I abuse language by referring to the "laissez-faire" case as one wheregovernments only implement the subsidy to the use of all intermediates.
2.3. InnovationAt the beginning of every period, one-period monopoly rights are allo-
cated to entrepreneurs (such that each entrepreneur holds monopoly rightson only a finite number of intermediates). Entrepreneurs can hire scientiststo increase the productivity of their variety. By hiring sXzit scientists, themonopolist for intermediate i in (sub)sector z ∈ NP, c, d can increase theinitial productivity AXzi(t−1) of her intermediate to
AXzit =(
1 + κ(sXzit)ι (
AXz(t−1)/AXzi(t−1)
) 11−γ)1−γ
AXzi(t−1) for z ∈ c, d,NP ,(10)
where 0 < ι < 1. AXzt is the average productivity of (sub)sector z ∈ c, d,NPat time t, and is defined as
AXzt ≡(∫ 1
0
(AXzit
) 11−γ di
)1−γ
for z ∈ c, d,NP . (11)
The factor (AXzi(t−1))−1/(1−γ) captures decreasing returns to scale in innova-
tion (the more advanced is a technology, the more diffi cult it is to innovatefurther), and (AXz(t−1))
1/(1−γ) denotes knowledge spillovers from the other in-termediates in the same sector and country. The innovation technology ex-hibits decreasing returns to scale in the mass of scientists hired (e.g., becausescientists hired for the same intermediate in the same period risk reproducingthe same innovation) and ι measures the concavity of the innovation func-tion. κ measures the size of innovations (κ is related to the length of a timeperiod, a shorter time period will be associated with a lower κ).
11
Since the mass of scientists is equal to 1 in both countries, the marketclearing equation is given by∫ 1
0
(sXNPit + sXcit + sXdit
)di ≤ 1. (12)
Because an entrepreneur has monopoly rights for one period only, shewill hire scientists so as to maximize current profits instead of the entireflow of profits generated by the innovations of her scientists. The allocationof scientists across (sub)sectors is therefore myopic. One-period monopolyrights are the only ineffi ciency in innovation and they allow one to modelas simply as possible the “building on the shoulder of giants” externality,the existence of which has long been recognized by the endogenous growthliterature. In the specific context of climate change, this externality plays acrucial role in explaining why clean technologies have so far failed to reallytake off, and why direct research incentives in addition to carbon taxes arewelfare improving, a point made by AABH and Gerlagh et al. (2014).12
There are no knowledge spillovers between sectors. Cross-country spilloversare absent for the moment but introduced in Section 5. A fixed mass of sci-entists in both countries implies that the amount of resources devoted toproductivity improvements (in particular R&D) remains the same in bothcountries and over time. It allows us to focus on the direction of techni-cal change and ensures that one country does not become arbitrarily largerelative to the other. This assumption is further discussed in section 3.6.
2.4. EnvironmentWithin the bounds 0 and S, environmental quality evolves according to
St = (1 + ∆)St−1 −(ξNY N
dt + ξSY Sdt
). (13)
The parameter ξX > 0 measures the rate of environmental degradation fromthe production of dirty inputs (which may differ across countries) and ∆ > 0is the regeneration rate of the environment. Without loss of generality, Iassume that S0 = S. Such a law of motion captures the idea that theenvironment’s regeneration capacity decreases with greater environmental
12With permanent monopoly rights, infinitely lived agents, and no environmental ex-ternality, the effi cient innovation allocation would be an equilibrium, but usually not theonly one.
12
degradation– the type of negative feedback that climatologists worry about,e.g., the change in Earth’s albedo and the release of captured greenhousegases which may occur as the polar ice cap melts. It is adopted for simplicity’ssake but, unless explicitly mentioned, the analytical results do not dependon it. The only important assumption is that if emissions become too large,St reaches the disaster level.13 The dirty input is directly responsible forenvironmental degradation, which is equivalent to a situation where it cancan be combined with a (cheap) fossil fuel resource in a Leontieff way.14
2.5. Policy tools
Section 4 solves the social planner’s problem, but Section 3 studies onlywhether or not an environmental disaster can be prevented with specificpolicy instruments, the ones that will eventually be used to decentralize theoptimal policy. A policy is characterized by a sequence of ad valorem taxeson the dirty input τXt in each country (the equivalent of a carbon tax),a sequence of ad valorem subsidies for scientists in each country and eachsubsector,15 and a sequence of ad valorem trade taxes bt on the pollutinggood (by Lerner symmetry, they could equally be on the other good). Allsubsidies and taxes are financed or rebated through lump-sum taxation atthe country level.The trade tax is implemented by the North, so that prices in the South
are equal to international prices: pSNPt = pNPt and pSPt = pPt, while pricesin the North follow pNNPt = pNPt and pNPt = pPt (1 + bt). A positive tradetax corresponds to a tariff (resp., export subsidy) when the North imports
13Real climate dynamics are much more complicated. In particular, emissions have alagged impact on temperature, part of their impact is essentially infinitely-lived and thereis a lot of uncertainty in the magnitude of the impact of CO2 on temperatures. Thismatters for the numerical exercise but not the results of section 3.14Therefore, we abstract from resource exhaustion. This is not a bad assumption since
oil does not play a major role in emissions for the manufacturing sector, while reserves ofcoal, natural gas and non-traditional fossil fuels are in large supply relative to the timescale of critical environmental degradation. Note that changes in the type of fossil fuelused (from coal to natural gas) can significantly affect the emission rate, yet, modelingsuch a possibility would not affect the propositions of the paper.15In order to ensure uniqueness of the equilibrium allocation of scientists, I assume that
it is possible to subsidize only a given mass of scientists; hence the social planner can usethe subsidy to determine the exact allocation. If the subsidy is greater than 100 percent,then a monopolist may be willing to hire scientists even if she is not producing any good.
13
(resp., exports) good P .16 When the North is the only country intervening,I assume that trade balance must be maintained every period (there is nointertemporal trade):
pPt(Y SPt − CS
Pt
)+ pNPt
(Y SNPt − CS
NPt
)= 0. (14)
The trade tax is not explicitly related to the carbon content of imports. Ifthe South does not undertake any policy, then relating the tax to the averagecarbon content of imports from a given country and in a given sector wouldnot alter the results; since each Southern firm is atomistic, its impact onaverage emission is infinitesimal and so its behavior will not affect the tradetax it pays. Changing the behavior of Southern firms would require eitherthe North to know the exact carbon content of each specific import, whichseems implausible, or the South to implement its own policy.
3. A positive analysis of unilateral environmental policies
This section presents a positive analysis of unilateral environmental poli-cies. The first two subsections solve for the allocation of innovation, in par-ticular subsection 3.2 shows how directed technical change reinforces thepollution haven effect. The following three subsections focus on whether anenvironmental disaster can be prevented. Section 3.3 shows that the economyreaches a disaster in laissez-faire and how such disaster may be prevented ifthere is only one country. Section 3.4 explains why taxing the North’s pol-luting sector likely fails to prevent a disaster. Section 3.5 describes how adisaster can be avoided using unilateral policies in the North. Finally, Section3.6 discusses some of the assumptions. For a given policy, the equilibrium isdefined as follows.
Definition 1. A feasible allocation is a sequence of demands for capital(KX
npt, KXNPit, K
Xct , K
Xcit, K
Xdt , K
Xdit), demands for labor (L
Xnpt, L
XNPit, L
Xct , L
Xcit,
LXdt, LXdit), demands for intermediates (x
Xzit for z ∈ c, d,NP), demands for
inputs(Y Xct , Y
Xdt
), goods production
(Y XPt , Y
XNPt
), demands for goods
(CXPt, C
XNPt
),
research allocations(sXzit for z ∈ c, d,NP
), and quality of the environment
16Starting from a situation where the North imports good P under free trade, an increas-ingly higher trade tax corresponds to a positive tariff up to the point where it implementsautarky. Beyond that point, the North begins to export good P and the trade tax is apositive export subsidy.
14
St such that, in each period t and in each country X ∈ N,S , factor andgood markets clear (i.e., (8), (9), and (12) hold).
Definition 2. For a given policy, an equilibrium is given by a feasible alloca-tion and sequences of wages of workers (wXt ), returns to capital (r
Xt ), wages of
scientists (υXt ), consumer prices for intermediates(ϕXzit for z ∈ c, d,NP
),
producer prices for clean and dirty inputs (pXct , pXdt), and international prices
of goods (pPt, pNPt) for X ∈ N,S such that: (i)(ϕXzit, x
Xzit, s
Xzit, K
Xzit, L
Xzit
)maximizes profits by the producer of intermediate i in sector z ∈ c, d,NPin country X; (ii) LXzt, and K
Xzt maximize the profits of the producer of good
z ∈ c, d,NP; (iii) Y Xct and Y
Xdt maximize the profits of producer of good
P ; (iv) CXPt and C
XNPt maximize consumers’utility under the trade balance
constraint (14).
3.1. Trade and innovation allocationTrade pattern. Here I analyze the equilibrium when the only policy
implemented is a carbon tax in the North τNt ≥ 0; the results are derivedand generalized in Appendix A.1. In each country, aggregate production ineach sector can be written as
Y XPt =
ζAXPt1− δXt
(KXPt
)α (LXPt)1−α
and Y XNPt = ζAXNPt
(KXNPt
)β (LXNPt
)1−β,
(15)
where ζ ≡ γγ (1− γ)1−γ ψ−γ, AXPt ≡((AXct)ε−1
+(1 + τXt
)1−ε (AXdt)ε−1
) 1ε−1
and δXt ≡ τXt(AXdt/A
XPt
)ε−1 (1 + τXt
)−ε ∈ [0, 1) (as τSt = 0, δSt = 0). AXPt/(1− δXt
)decreases in τXt and measures the effective average productivity of sector Pin country X. This formulation highlights that, in a given period, the modelcollapses to a Heckscher—Ohlin model with varying productivity across coun-tries. In laissez-faire (that is for τNt = 0), the South has the comparativeadvantage in the polluting good P if and only if(
ASPtASNPt
) 1α−β KS
LS>
(ANPtANNPt
) 1α−β KN
LN. (16)
Trade results fromRicardian forces (relative productivity) as well as Heckscher—Ohlin forces (relative factors endowment). Provided the difference in com-parative advantage is not too large, both countries produce both goods.When the difference in comparative advantage is larger, one and eventually
15
both countries fully specialize. Besides, a positive carbon tax in the North(τNt > 0
)reduces the productivity of sector P there and therefore increases
the chance that the South has a comparative advantage in that sector.Emissions. Emissions are given by EX
t = ξX(1 + τXt
)−ε (AXdt/A
XPt
)εY XPt .
Thus the emission rate in sector P is increasing in the ratio of dirty to cleanproductivities AXdt/A
Xct and decreasing in the carbon tax τ
Xt .
Allocation of innovation. Entrepreneurs face a two-stage problem. Inthe second stage, they choose prices to maximize their profits given theirproductivity. Post-innovation profits in sector z ∈ c, d,NP are given by:
πXzit = (1− γ)(AXzit/A
Xzt
) 11−γ pXztY
Xzt . (17)
These profits are proportional to the revenues of the intermediate’s (sub)sector(because of the Cobb-Douglas specification) and are increasing in the pro-ductivity of the intermediate, AXzit. In the first stage, entrepreneurs hirescientists to increase the productivity of their intermediate. Thanks to theknowledge spillovers across varieties, all monopolists in a given (sub)sectorhire the same number of scientists and average productivity grows following
AXzt =(1 + κ
(sXzt)ι)1−γ
AXz(t−1) for z ∈ c, d,NP .
Therefore, regardless of the technology and its level of development, the sameamount of innovation resources (scientists) is required for a given propor-tional increase in productivity. Such formulation is common in endogenousgrowth models as it is consistent with steady-state growth.Path dependence in clean versus dirty technologies. Assume that
country X produces good P (otherwise, sXct = sXdt = 0). Combining the first-order conditions with respect to the number of scientists in the clean anddirty subsector yields the following equation:(
sXct)1−ι (
1 + κ(sXct)ι)
(sXdt)1−ι (
1 + κ (sXdt)ι) =
pXctYXct
pXdtYXdt
=(1 + τXt
)ε(AXctAXdt
)ε−1
. (18)
The second equality follows from the demand equation for both inputs insector P (knowing that the production technologies differ only by their pro-ductivity level). The ratio of revenues in the clean sector to those in the dirtysector increases with the ratio of clean to dirty technologies. This associationreflects two counteracting forces: a larger technology ratio leads to a largermarket share ratio but also to a lower price ratio; the former effect dominates
16
when the inputs are substitutes (ε > 1). Thus, in laissez-faire (τXt = 0), fora suffi ciently small innovation size κ, more scientists are allocated to thedirty than to the clean subsector if and only if the dirty sector is already themost advanced AXd(t−1) > AXc(t−1): there is path dependence (see AppendixA.2).17,18 A carbon tax in the North reduces demand for the dirty input.Therefore, for a given mass of scientists in sector P , it leads to a reallocationof innovation within that sector towards clean technologies, which is strongerthe larger the elasticity of substitution between the two inputs, ε, is.Amplification of comparative advantage. Assume that production
occurs in both sectors (otherwise, innovation occurs only in the active sec-tor). By combining the first-order conditions with respect to the number ofscientists in (sub)sectors NP , c and d, I obtain(
sXct)1−ι (
1 + κ(sXct)ι)
+(sXdt)1−ι (
1 + κ(sXdt)ι)
(sXNPt)1−ι (
1 + κ (sXNPt)ι) =
(1− δXt
)pXPtY
XPt
pXNPtYXNPt
. (19)
(1− δXt
)pXPtY
XPt are the net of tax revenues of the polluting sector. There-
fore, for a given ratio AXd(t−1)/AXc(t−1) of initial productivities within sector P
and given carbon tax τXt , the number of scientists allocated to sector P isincreasing in the ratio of sector P to sector NP revenues. Under free trade,prices are equalized in both countries, and each tends to innovate relativelymore in its exporting sector (it necessarily does so when ANct/A
Ndt = ASct/A
Sdt
and τNt = 0). In laissez-faire, comparative advantages are typically amplifiedover time, so that one and eventually both countries fully specialize.By contrast, in autarky, consumer demand implies that
pXNPtYXNPt/
(pXPtY
XPt
)= (1− ν) /ν, (20)
17If κ is large, however, and AXd(t−1) and AXc(t−1) are close to each other, multiple equilibra
may exist (as in AABH): if more scientists are allocated to clean than to dirty technologiesat time t, clean technologies may become more developed than dirty ones at time t (eventhough they were not at time t−1), which in return would justify that more scientists gotallocated to clean than to dirty technologies.18One might think however that innovation could be easier for new technologies (such
as clean technologies) where low-hanging fruits are more common. For instance we could
have AXct =(
1 + κmax(
1,(AAXct
)η) (sXct)ι)1−γ
AXc(t−1) for some A > 0 and η > 0. Such
formulation would go against path dependence in clean versus dirty technologies but onlytemporarily (as long as AXct < A). Yet, Aghion et al. (forthcoming) find evidence of pathdependence in the car industry.
17
so that innovation always occurs in both sectors in that case.Equilibrium uniqueness. As innovating more in a sector increases
a country’s comparative advantage in that sector, which, in turn, promptsmore innovation in the same sector, multiple equilibria could arise whenthe innovation size κ is large enough. On the other hand, with a small κ,the concavity of the innovation technology ensures that the equilibrium isunique. Although the main results of this section could be extended to acase with multiple equilibria, focusing on a unique equilibrium simplifies theexposition. Henceforth, I assume that the conditions of the following lemmaare satisfied (proof in Appendix A.2).19
Lemma 1. If κ is small enough and ι ≥ 1/2, the equilibrium is unique.
3.2. The dynamic pollution haven effectThe following proposition characterizes the existence of a dynamic pollu-
tion haven effect under free trade (proof in Appendix A.3).
Proposition 1. For κ small enough, the introduction at time t of a positivecarbon tax τNt > 0 in the North increases innovation in the polluting sector in
the South, sSPt. If ANd(t−1) ≥ ANc(t−1) and
(1 + τNt
)≤(ANd(t−1)/A
Nc(t−1)
)2
, then
innovation in the polluting sector in the North, sNPt, decreases. An increasein sSPt and a decrease in s
NPt further increases emissions in the South (relative
to a situation where innovation does not respond), provided that the Southerndirty technologies are more advanced than clean ones (ASd(t−1) ≥ ASc(t−1)) and
ANPt/(1− δNt
)increases in sNPt (which is the case if
(ANc(t−1)/A
Nd(t−1)
)ε−1
>
(τ (ε− 1)− 1)(1 + τNt
)−εor ANd(t−1)/A
Nc(t−1) >
(1 + τNt
) εε−1 ).
The introduction of a positive carbon tax τNt in the North increases theproduction cost of the polluting good P there and therefore reduces its pro-duction. This raises its world price which leads to an increase in its produc-tion in the South, and therefore an increase in Southern emissions (this is
19The technical assumption ι ≥ 1/2 is further necessary to ensure that the equilibriumis unique when one country is close to a corner of specialization (i.e., to a point at whicha producer of the imported good would break even only if he produces an infinitesimalamount of the good). The lemma does not extend to the Ricardian case where α = β:in that case, no matter how small κ is, there are multiple equilibria when the initialcomparative advantage is small.
18
the classic static pollution haven effect). Following (19), and for a suffi cientlysmall innovation size (such that the equilibrium is unique), an increase in therelative revenues of sector P in the South leads to an increase in innovation inthat sector in the South (sSPt increases), while a decrease in the relative rev-enues of sector P in the North leads to a decrease in innovation in that sectorin the North (sNPt decreases). This changes technology levels in a way whichfurther favors production of good P by the South and so further increasesSouthern emissions (creating a dynamic pollution haven effect).For this logic to go unabated, a few additional assumptions are necessary.
First, the further the ratio of clean to dirty revenues, the more innovation insector P is attractive. If the carbon tax in the North is very large, the ratioof clean to dirty revenues may be further from unity post-tax than it waspre-tax, which might lead to an increase in sNPt (this is what the assumption
ANd(t−1) ≥ ANc(t−1) and 1 + τNt ≤(ANd(t−1)/A
Nc(t−1)
)2
prevents). Second, moreinnovation in sector P in the South will increase the emission rate only ifASd(t−1) > ASc(t−1) (otherwise it decreases it). Third, because of the distortioncreated by the carbon tax, for some very specific combination of parameters, adecrease in sNPt might increase A
NPt/(1− δNt
)and thereby Y N
Pt , which wouldpush towards a decrease of Southern emissions (this case is ruled out forinstance if τ is small).Whether world emissions are more likely to increase when innovation re-
sponds to the policy change depends on the pattern of comparative advantageand the emission rates. The dynamic pollution haven effect increases South-ern emissions but it also further decreases Northern emissions. Moreover,the dynamic pollution haven effect has permanent consequences: in all sub-sequent periods, the relative productivity of the South in sector P will haveincreased, which favors innovation in that sector itself and therefore tends toincrease Southern emissions. Proposition 2 below further characterizes thedynamic consequences of a Northern carbon tax.A carbon tax has an ambiguous effect on clean innovation in the North:
as the market for good P shrinks, overall sector P innovation is reduced, butwithin that sector, it gets reallocated towards clean technologies.
3.3. Environmental disaster in laissez-faire, with a global social planner orin autarky
Under laissez-faire, as long as dirty technologies are more advanced thanclean ones in both countries, innovation in sector P remains directed primar-
19
ily toward dirty technologies. Since innovation in sector P does not asymp-totically vanish (the exporting country innovates more in that sector than itwould under autarky), the production of good P grows unboundedly and sodo emissions. At some point, the regenerative capacity of the environmentbecomes overwhelmed and the economy reaches an environmental disaster.In contrast, if there were only one country (and therefore no trade), the
logic of AABH applies. The social planner could use clean research subsi-dies, taxes on dirty research or carbon taxes to redirect innovation from thedirty toward the clean subsector. Once clean technologies acquire a suffi cientlead over dirty intermediates, market forces will ensure that most research isdirected toward the clean subsector, which is now the most advanced. Even-tually, the emission rate of good P approaches zero– suffi ciently fast to offsetgrowth good P’s production– and a disaster can be avoided for suffi cientlyhigh initial environmental quality. A social planner who can intervene inboth countries can use the same instruments and avert a disaster (for highenough S0) by redirecting sector P innovation towards clean technologies incountries which produce good P (proof in Appendix A.4).Consider now the case of a social planner who can only intervene in
the North, but assume that both countries are in autarky. Then, withoutknowledge spillovers, no policy restricted to the North can prevent a disasterbecause Southern emissions grow unboundedly regardless of what the Northdoes. Therefore, absent international cooperation, trade is necessary to avoidan environmental disaster.
3.4. Taxes on the polluting good in the North only
I now consider the case where trade is possible and only the North canimplement some policy (in particular, this implies that the North cannot paythe South to implement a policy). The key to avoid an environmental disasterin this context is to ensure that the South asymptotically fully specializesin the nonpolluting sector NP . Otherwise, there is always innovation inthe polluting sector P in the South, and the production of good P andtherefore emissions grow unboundedly (see Appendix A.5 for a formal proof).I first focus on the case where the North can implement a positive carbontax and/or a positive tax on dirty research. Both instruments can reduceemissions in the North, and prompt clean innovation there. However, suchpolicies may be incompatible with a South specializing in sector NP andthus may fail to prevent an environmental disaster. More formally, one canshow (proof in Appendix A.6).
20
Proposition 2. If innovation size κ is small enough then, no matter howhigh initial environmental quality S0 is, no combination of a positive carbontax and a positive tax on dirty research can prevent an environmental disasterif: (i) clean technologies are less developed than dirty ones in both countries(ANc0/A
Nd0 ≤ 1 and ASc0/A
Sd0 ≤ 1), (ii) the South has a weak initial compar-
ative advantage in the polluting sector P (i.e.,(ASP0/A
SNP0
) 1α−β KS/LS ≥(
ANP0/ANNP0
) 1α−β KN/LN), and (iii) either clean technologies are suffi ciently
less developed than dirty ones in the South (ASc0/ASd0 is suffi ciently small) or
the South has a suffi ciently strong initial comparative advantage in P .
Under laissez-faire and with the assumptions of the proposition, the Southinnovates more than the North in the polluting sector P , which reinforcesits comparative advantage over time eventually leading it to specialize inthat sector (the “amplification of comparative advantage effect” describedabove). The North government cannot reverse this pattern simply by usinga positive tax on dirty research or a positive carbon tax. In contrast, acarbon tax reduces the productivity of sector P in the North, which leads toan increase in sector P innovation in the South and a decrease in the North(as specified in Proposition 1). This further strengthens the comparativeadvantage of the South in sector P . A positive tax on dirty innovationin the North has similar effects to a carbon tax: it drives scientists awayfrom sector P toward the nonpolluting sector NP ; and, within sector P ,it allocates innovation toward the initially backward clean subsector, whichfurther reduces the growth rate of average productivity ANPt– the resultingincrease in the price of good P also leads to more innovation in sector Pin the South. Accordingly, positive Northern taxes on good P can onlyaccelerate the Southern specialization in that sector. In fact, the economytypically grows faster since more specialization entails less overlap in thetype of innovations being undertaken by both countries, and, as a result,such policies are then likely to accelerate environmental degradation.20
20The extreme version of this argument is illustrated by the knife-edge case where
ANc0/ANd0 = ASc0/A
Sd0 < 1 and
(ASP0/A
SNP0
) 1α−β KS/LS =
(ANP0/A
NNP0
) 1α−β KN/LN , with
no carbon tax, there would be no trade in equilibrium, and emissions and the economywould grow at rate (1 + κ2−ι)
1−γ − 1. A small carbon tax τNt is enough to ensure thatboth countries eventually specialize so that emissions (and the economy) asymptoticallygrow at rate (1 + κ)
1−γ − 1.
21
Condition (iii) in Proposition 2 is necessary because when the ratio ofclean to dirty revenues is farther from unity in the North than in the South,more innovation in sector P might take place in the North even if the Southexports good P .21 The assumption that κ is small could also be relaxedif ASc0/A
Sd0 is suffi ciently small and the South has a suffi ciently strong initial
comparative advantage in P : in this case, all possible equilibria would featurethe South specializing in sector P leading to an environmental disaster.The crucial hypothesis of Proposition 2 is that the South has a compar-
ative advantage in sector P . When the North is identified with Annex Icountries, this hypothesis seems to hold since the CGE literature systemat-ically finds that developed countries are net carbon importers as mentionedin the introduction (and I also find that the South has a comparative advan-tage in sector P initially in the numerical exercise in section 4.3). Yet, with adifferent definition of the North, this hypothesis may not hold, in which case,the North might be able to prevent an environmental disaster with a carbontax only as the pollution haven and the amplification of initial comparativeadvantage effects work in opposite directions.
3.5. Introducing clean research subsidies and the trade taxAllowing the North to use clean research subsidies and a trade tax leads
to the following result.
Proposition 3. A combination of a temporary trade tax and a temporaryclean research subsidy in the North can prevent an environmental disasterprovided that the initial environmental quality S is suffi ciently high.
The key difference between clean research subsidies and the carbon taxor the tax on dirty research is that the former can also reallocate scientists
21That is this condition plays a similar role to the assumption that ANd(t−1) ≥ ANc(t−1)
and(1 + τNt
)≤(ANd(t−1)/A
Nc(t−1)
)2in Proposition 1. More specifically: the incentive to
innovate in sector P is, ceteris paribus, lower when the revenues in the clean and dirty sub-
sectors are close to each other– that is when(AXc(t−1)
)ε−1and
(1 + τXt
)−ε (AXd(t−1)
)ε−1are comparable. Given carbon taxes that are high enough or taxes on dirty research thatare of suffi cient duration, the ratio of clean to dirty revenues may become farther fromunity in the North than in the South. In that event, assumption (iii) ensures that thiseffect is dominated, either directly if the initial comparative advantage is large enough, orbecause the difference in comparative advantage would have had to become large beforethis occurs when ASc0/A
Sd0 is suffi ciently small.
22
who were working in the nonpolluting sector NP toward the clean subsec-tor. This boosts innovation in clean technologies in the North, even when theNorth does not have the comparative advantage in sector P . Increasing inno-vation in clean technologies makes sector P less polluting and helps build acomparative advantage in that sector. In the meantime, a positive trade taxreduces production and therefore innovation in sector P in the South, whichalso helps reverse the pattern of comparative advantage. For suffi ciently highinitial environmental quality, a policy combining these two instruments canprevent a disaster. To see this, consider the following two-phase approach(this is not the optimal policy, which is derived in Section 4). First, a so-cial planner implements a tariff large enough to shut down trade, so thatinnovation in the South must be balanced between the two sectors P andNP . Simultaneously, she implements large clean research subsidies so thatnearly all Northern scientists innovate in the clean subsector, and the Northinnovates more in sector P than the South. Once the North has acquiredthe comparative advantage in that sector and ANc(t−1)/A
Nd(t−1) is suffi ciently
large, the social planner can discontinue all policies and re-open up to trade.Market forces then ensure that the production of good P eventually movesentirely to the North where it relies essentially on clean technologies,22 emis-sions go down to zero in both countries, and a disaster can be avoided.23 Theabsence of a nontradable polluting sector is crucial here: otherwise (and with-out knowledge spillovers), even if the South were not to produce the tradablepolluting good, it would still produce the nontradable one, and therefore itwould still be impossible to prevent an environmental disaster.From this discussion one might think that clean research subsidies alone
should be enough to prevent an environmental disaster. This is true if the ini-tial comparative advantage of the South is not too large, but as the followingremark stipulates, it does not always hold (proof in Appendix A.7).
Remark 1. There exist initial factor endowments and technologies, suchthat no matter how high S0 is, no combination of a carbon tax, a tax ondirty research, and a subsidy for clean research can prevent a disaster.
22This follows lemma A.3, applied to the case where the North now has the comparativeadvantage in sector P at some date τ , with ANdτ/A
Ncτ < AScτ/A
Sdτ < 1.
23This result does not rest on the assumption that κ is small as the logic can be extendedto a scenario with multiple equilibria.
23
Clean research subsidies alone cannot prevent a disaster when the Southfully specializes in sector P and clean technologies in the South are suffi -ciently less advanced than dirty ones. In that case, all Southern scientistsare allocated to sector P and, asymptotically, to dirty technologies. So evenif the North were to allocate all its scientists to clean technologies, ASPt wouldgrow as fast as ANPt. That situation is irreversible and an environmental dis-aster cannot be avoided. Full specialization in the South occurs in the firstplace when its initial comparative advantage in sector P is suffi ciently largeor when clean technologies are suffi ciently backward in the North, as theaverage productivity of sector P in the North, ANPt, grows slowly during theperiod when clean technologies are catching up with dirty ones.24
3.6. Discussion
Here, I discuss some of the assumptions of the model. Appendix A.8presents additional results regarding alternative instruments.Size and mass of scientists. The relative size of the two countries
in terms of capital and labor endowments plays a role quantitatively: thelarger the North is, the easier it is to reverse comparative advantages. Inthe long-run, the relative size of the two economies depends on the mass ofscientists, which is a proxy for the amount of resources spent on innovation.The assumption that the two countries have the same fixed mass of scientistsimplies that the analysis is implicitly restricted to a case where the twocountries (or groups of countries) are of similar size.If the mass of scientists in the North (sN) were much smaller than in the
South (sS), the North would eventually become a small economy relative tothe South, and the South’s economy will behave as if it were in autarky:regardless of the policies undertaken by the North, a disaster would be un-avoidable. In contrast, if sN was much larger than sS, a disaster could beavoided using clean research subsidies without the need for a tariff (as ANPtcould grow faster than ASPt allowing the North to progressively build a com-parative advantage in sector P even if the South has fully specialized in sectorP ). Depending on parameters, a disaster may also be avoided using taxeson dirty research or a carbon tax under the assumptions of Proposition 2.25
24This is the only result of this section that would not hold if goods P and NP werestrict complements (instead of Cobb-Douglas): in this case the South could not stay fullyspecialized in sector P if both countries innovate only in that sector.25For instance, if the consumption share of good P (ν) is close to 1 and sN is large
24
This suggests that the inclusion of the United States in the North is crucial.However, one may think that sS is bound to increase, making it harder andharder for the North to intervene decisively as time passes.The assumption that the mass of scientists is exogenous is not innocuous
either. With an endogenous mass of scientists, clean research subsidies be-come an even more potent instrument, as they can ensure that the amount ofresources spent in R&D in the North becomes greater than that in the South(so that a disaster becomes avoidable with clean research subsidies only).The impact of a carbon tax depends on the specific way in which innovationis endogenized, but in models where the cost of innovation moves with GDP,a carbon tax is likely to reduce overall innovation since innovation dependson firms’profits which are proportional to the revenues net of taxes (thiswould reinforce Proposition 2).Three sectors. The results of the paper crucially depend on the as-
sumption that innovation may occur in all three (sub)sectors (clean, dirtyand non-polluting). If innovation were limited to clean and dirty technolo-gies within the polluting sector, then the North could not build a comparativeadvantage in a specific sector. With clean innovation in the polluting sectoronly (as in Di Maria and Smulders, 2004; Di Maria and van der Werf, 2008and Acemoglu, Aghion and Hémous, 2014), the model would falsely assumethat all innovations in the polluting sector decrease emissions. In contrast,with only dirty innovations in the polluting sector, no innovations could re-place existing polluting technologies since the final good is a Cobb-Douglasaggregate of the polluting and the nonpolluting goods.26
The assumption that the clean and dirty inputs are substitute (ε > 1)is crucial, as otherwise avoiding a disaster with unilateral policies is notpossible.27 Yet, this is a very natural assumption, first if ε ≤ 1, both in-
enough, ANPt/ANNPt can grow faster than A
SPt/A
SNPt, leading to a reversal of comparative
advantage; if ν = 1/2, on the contrary, the previous analysis still holds.26Here clean innovations allow to develop an input which substitutes for the dirty one,
and the polluting sector’s productivity can grow at the same rate whether it relies mostlyon the clean or the dirty inputs. If the clean alternative had some growth’s costs, thenpreventing a disaster with unilateral policies would be more diffi cult (this would be thecase in a model where the clean alternative refers to energy effi ciency improvements, andwhere energy is complement to other inputs in the polluting sector).27Doing so requires positive growth in the polluting sector in the North to ensure that
Southern emissions do not grow unboundedly, but positive growth in the polluting sectoris not possible without positive growth in dirty input production.
25
puts would be essential in the production of the polluting good and thereforeclean inputs would not really represent an alternative to dirty inputs; second,Papageorgiou, Saam and Schulte (2013) show empirically that the elasticityof substitution between clean and dirty inputs (notably in energy) is sig-nificantly greater than 1. The assumption of a unit elasticity between thepolluting and non-polluting good is very common in the literature, and, asalready mentioned, the analysis extends to the case where goods P and NPare complements.28 It does not extend to the case where P and NP aresubstitutes (and therefore not essential). Then whether an environmentaldisaster can be avoided or not depends crucially on how large ASd is relativeto ASNP : a large A
Sd may push the South towards producing the dirty input
rather than the non-polluting good, regardless of the policy in the North.Importantly, dirty innovations generally include not only innovations in
the energy sector that make fossil fuel energy cheaper (for instance by al-lowing the use of shale gas or bituminous sands), but also innovations incomponents that are complements to fossil fuel energy and thus increase itsdemand, or the introduction of new goods or inputs that rely on fossil fuelenergy. In practice, some innovations in the polluting sector may complementboth fossil fuel energy and alternative forms of energy; one could representsuch innovations as improving the productivity of an additional input inthe polluting sector complement to both the clean and dirty inputs. Thiswould not affect the economic intuitions developed and my results could beextended to this scenario.The South’s behavior. The paper assumes that the South does not
implement any policy. Regarding environmental policy today, this seems areasonable assumption: several countries seem willing to move forward, whileothers are opposing a global agreement while often undertaking very limiteddomestic policies (Barrett, 1994, explains why designing a self-enforcing in-ternational agreement on climate change is diffi cult). A reason why these
28The CGE literature often assumes a unit elasticity of substitution between manufac-turing goods, which often include a non-polluting sector and a more detailed representationof polluting goods (see for instance Babiker and Rutherford, 2005 or Boehringer et al.,2010). Copeland and Taylor (2005) assume that polluting and non-polluting goods areboth essential (which rules out the substitute case). This also seems very reasonable givenwhat the two sectors stand for: for instance the polluting good includes the manufac-ture of basic metals (code 24) while the non-polluting good includes the manufacture ofmachinery and equipment (code 28).
26
divisions may persist in reality is the significant delay between emissions anddamages that climate models predict, an aspect that I abstract from here: asa result, it may be too late before skeptic countries get convinced that theyshould start undertaking significant policy actions. Even if one expects thatthese divisions will eventually end, the results of the paper are still useful forcountries who are willing to intervene before the rest of the world.Even if the South does not implement any environmental policy, it may
still want to implement trade policies, particularly if the North’s trade policyhurts the South. Yet, South’s consumption is not necessarily negativelyaffected by the North’s unilateral policies, and the South benefits from betterenvironmental quality. For instance, if the North’s temporary policy reversesthe pattern of comparative advantages, both countries fully specialize in thelong run. Income shares are linked to the consumption share of the good thatthe country exports; therefore, if the income share for the polluting good issmaller than for the nonpolluting one (ν < 1− ν), the South’s income sharewill be larger under the North unilateral policy than under laissez-faire.29
Although a full analysis of the strategic interactions between two govern-ments is beyond the scope of this paper, one can consider the case wherethe South government is myopic and maximizes current consumption. Thisgovernment implements its own trade tax to improve its terms of trade. Aslong as the South retains an initial comparative advantage in the pollutinggood, this trade tax moves both countries closer to autarky and thus doesnot prevent the North from reversing the pattern of comparative advantage.Once the North exports the polluting good, the South implements its owntariff. This tariff slows down the South’s specialization in the nonpollutingsector. Yet, once the North has acquired a suffi ciently large comparativeadvantage, it does not prevent the South from fully specializing in the non-polluting sector. Therefore, a disaster can still be avoided for suffi cientlyhigh initial environmental quality.
29Even in the short run, the South might benefit: a tariff implemented by the Northhurts the South when the South exports the polluting good, but a trade tax high enoughto reverse the pattern of trade immediately may benefit the South (this trade tax is thenan export subsidy).
27
4. Optimal policy and numerical illustration
I now turn to the normative part of the paper, characterizing the first-best policy and the second-best policy under the constraint that the socialplanner cannot intervene in the South. I then use a numerical example toillustrate both policies and compute their welfare costs, and to show thatboth trade and directed technical change act as double-edge swords.
4.1. First-Best: North and South Policy
Before solving for the optimal unilateral policy, the focus of this paper,I briefly present the first-best which is a useful benchmark– the solution isderived in Appendix A.9. In the first-best, the social planner maximizes (1)subject to the following constraints: the production function equations (2),(3), (4), (5), (6) and; the factor market—clearing equations (8) and (12); thegoods market—clearing equation (9); the environmental degradation equation(13); and the knowledge accumulation equation (10).The first-best policy can be decentralized in the following way. As already
mentioned, a subsidy 1 − γ to all intermediates corrects for the monopolydistortion. The environmental externality is corrected by a carbon tax inboth countries that equalizes the marginal cost of the tax (lower currentconsumption) with the marginal benefit (higher environmental quality in allsubsequent periods). Carbon taxes in the North and the South differ in advalorem values across countries but are identical as a tax per unit of CO2.The social planner corrects for the myopia of monopolists in their innovationdecisions by allocating scientists in accordance with the discounted value ofthe entire stream of additional revenues generated by their innovation.Since utility flow is minimized during a disaster and since the social plan-
ner can always reduce world emissions, the optimal policy always avoids adisaster. In addition (as shown in Appendix A.10), if the discount rate ρis suffi ciently small and the inverse elasticity of intertemporal substitutionη ≤ 1, then both countries specialize in finite time and innovation in sectorP switches to mostly clean,30 so that emissions eventually vanish. With thelaw of motion (13), the quality of the environment reverts to S– and thecarbon tax reaches zero– in finite time.31
30These are only suffi cient conditions, and the optimal policy is likely to feature a switchto clean innovations also when η > 1.31For an alternative law of motion where environmental regeneration decreases as the
28
4.2. Second-Best: Policy only in the NorthI now turn to the case where the social planner cannot implement any
policy in the South, whose economy is in laissez-faire, and cannot transferincome from one country to another. Trade balance must be maintained atevery point in time. The second-best policy is defined by the social plannermaximizing (1) subject to the following constraints: (2) for the North andthe South; constraints (3), (4), (5), (6), (8), (12) and (10) for the North only;the environmental degradation constraint (13); the goods market—clearingconstraints in both countries, which are now written as
CNY t = Y N
Y t +MY t and CSY t = Y S
Y t −MY t, for Y ∈ P,NP , (21)
where MY t denotes net imports of the North of good Y ; the trade balanceconstraint
ptMPt +MNPt = 0, (22)
where pt ≡ pPt/pNPt is the international price ratio; and constraints describ-ing the South’s laissez-faire economy. These latter constraints (detailed inAppendix A.11) are: a consumer demand equation(
∂CS
∂CSP
)(∂CS
∂CSNP
)−1
=ν
1− νCSNPt
CSPt
= pt; (23)
offers equations in the South of the type
Y SPt = ySP
(pt, A
SPt, A
SNPt
)and Y S
NPt = ySNP(pt, A
SPt, A
SNPt
); (24)
an emissions equation Y Sdt =
(ASdt/A
SPt
)εY SPt; an equation that specifies the
mass of scientists allocated to sector P ,
sSPt = sSP(pt, A
Sdt, A
Sct, A
SNPt
); (25)
and the resulting law of motion of aggregate productivity in the South:
ASNPt =(1 + κ
(1− sSPt
)ι)1−γASNP (t−1), (26)
ASzt =(1 + κ
(sSzt(sSPt, a
St−1
))ι)1−γASz(t−1), for z ∈ c, d .
quality of the environment St approaches S, or where a share of emissions stay permanentlyin the atmosphere, St may not reach S asymptotically. The optimal carbon tax may thennot converge to 0 but it becomes irrelevant in the sense that a 0 carbon tax would onlyhave a negligible effect on welfare.
29
The allocation between clean and dirty innovation sSct, sSdt is uniquely deter-
mined by the total mass sSPt and the ratio aSt−1 ≡
(ASc(t−1)/A
Sd(t−1)
)ε−1
. Forthe problem to be well-defined, the South’s equilibrium must be unique giventhe North’s allocation. An argument similar to that of Appendix A.2 showsthat it is the case when κ is suffi ciently small and ι ≥ 1/2. (This is wherethe Ricardian case would pose a technical diffi culty, with α = β, even for asmall κ, the South’s equilibrium may not be uniquely defined.) This leadsto the following result (proof in Appendix A.11).
Proposition 4. The second-best policy can be decentralized through a carbontax in the North, research subsidies/taxes in the North, a subsidy for the useof all intermediates, and a trade tax.
Therefore, the social planner uses the same instruments as before to ad-dress the ineffi ciencies in the North’s economy: the environmental externality,the knowledge externality and the monopoly distortion. The trade tax, bt,allows the social planner to distort prices in the South thereby affecting theallocation of factors there. The optimal allocation satisfies:
νν (1− ν)1−ν p−νt
((1 + bt)
−ν btpt∂ySP∂pt
+((1 + bt)
1−ν − 1) νY SNPt
pt
+(1− (1 + bt)
−ν) (1− ν)Y SPt
)
= ωtξS
(ASdtASPt
)ε∂ySP∂pt− φt
∂sSPt∂pt
(27)
where ωt is the shadow value of a unit of environmental quality at time t(in units of consumption at time t) and φt is the shadow value of movingan additional scientist in the South from the nonpolluting sector NP to thepolluting sector P . In this expression, the left-hand side has the sign of bt,which shows that the social planner imposes a wedge between relative pricesin the North and in the South. This wedge is generated by an environmentalmotive (the first term on the right-hand side) and an innovation motive(the second term). The first term is always positive. A positive trade taxon good P imposed by the North reduces its relative price in the South,which decreases its production there and emissions. The second term isgenerally also positive as there is typically too much innovation in sector Pin the South (φt < 0) for two reasons. First, more innovation in sector P inthe South leads to more emissions. Second, to avoid a disaster– which the
30
social planner generally does– the South must at least asymptotically fullyspecializes in sector NP , so that current innovations in sector P will be oflittle use in the future. Because of their myopia, Southern innovators do notinternalize this and their innovation efforts are tilted too much toward sectorP . By reducing the production of good P in the South, a positive tradetax moves Southern scientists away from sector P . Therefore, the trade taxis generally positive; it takes the form of a tariff when the North importsgood P and of an export subsidy otherwise. The next proposition furthercharacterizes the optimal policy (proof in Appendix A.13).
Proposition 5. (i) For a suffi ciently high initial environmental quality S0,the social planner avoids a disaster if the inverse elasticity of intertemporalsubstitution η ≥ 1; or if η < 1 and the discount rate ρ is suffi ciently low.The South must asymptotically be fully specialized in the nonpolluting sectorif initially clean technologies are less developed than dirty ones there (ASc0 ≤ASd0).(ii) If ASc0 ≤ ASd0, S0 is suffi ciently high, ρ is suffi ciently small, and η ≤ 1,then the mass of scientists allocated to clean technologies in the North isasymptotically 1, both countries fully specialize and the optimal trade taxreaches 0 in finite time.
Since the North cannot fully control the Southern economy, avoiding adisaster may not be feasible when S0 is low. Yet, when it is feasible, asocial planner will do so if the elasticity of intertemporal substitution η ≥ 1(as then a disaster brings a utility of −∞), or if η < 1 and the discountrate is suffi ciently low (as then the social planner maximizes long-run utilitygrowth and S = 0 is an absorbing state). To avoid a disaster, the South mustasymptotically fully specialize in sector NP , and production of good P in theNorth must be limited or a switch to clean innovations must occur. Statement(ii) specifies suffi cient conditions under which innovation does indeed switchto mostly clean innovation in the North. The optimal policy maximizeslong-run growth when η ≤ 1 and the discount rate is low enough. Long-rungrowth, in return, is maximized if the North asymptotically innovates onlyin clean technologies and the South in sector NP , in this case both countriesfully specialize in finite time and the trade tax reaches 0 (since environmentalquality can fully recover, the optimal carbon tax also reaches 0 but this resultmay not extend to different law of motions for environmental quality).In the problem considered so far, the social planner cares equally about
consumption in the North and the South. This allows to separate climate
31
issues from redistribution issues. An alternative set-up is to consider thatthe economy admits infinitely lived representative agents in each country,whose utilities are given by
∑∞t=0
(v (St)C
Xt
)1−η/((1− η) (1 + ρ)t
). The so-
cial planner maximizes a weighted sum of these utilities:
U =∞∑t=0
1
(1 + ρ)tv (St)
1−η
1− η
(Ψ(CNt
)1−η+ (1−Ψ)
(CSt
)1−η), (28)
where Ψ ∈ [0, 1] is the weight on the North’s representative agent. Then, thesocial planner also cares about the distribution of consumption. AppendixA.14 discusses this approach and solves for this case. The first-best is identi-cal up to lump-sum transfers between the two countries. The second-best issimilar, but the trade tax must now also reflects terms-of-trade issues and itis modified so as to favor the country with the largest social marginal value ofconsumption. If the social planner cares only about the North (Ψ = 1), thenthis motive pushes toward a tariff when the North imports good P and anexport tax otherwise. If the social planner cares equally about both countries(Ψ = 1/2) but the South is poorer, then it pushes toward an import or anexport subsidy. Proposition 5 still applies, except that full specialization mayonly occur asymptotically and the trade tax may not asymptote 0 (becauseof terms-of-trade motives).
4.3. Parameter Choices
Here, I briefly describe the parametrization; details are given in Appen-dix A.15. A period corresponds to 5 years, and initial values are based onthe 2003—2007 world economy while assuming laissez-faire in both countries.The elasticity of intertemporal substitution is unity (η = 1). The annualtime discount rate is 0.015, as in Nordhaus (2008). In line with the CGEliterature, the North comprises 33 countries in Annex I of the Kyoto protocol(including the United States) and the South 18 major countries in the restof the world. Restricting attention to manufacturing, I compute the worldrate of emissions per dollar of value-added in each sector at the availableaggregation level, here using data on sectoral emissions of CO2 from fos-sil fuel combustion given by the International Energy Agency (IEA, 2010a),and data on sectoral value added by the United Nations Industrial Develop-ment Organization (UNIDO, 2011). The sectors with the highest rate areidentified with sector P– namely the manufacture of chemicals and chemicalproducts, ISIC code 24, of other nonmetallic mineral products, 26, and of
32
basic metals, 27– and the others with sector NP .32 As already mentioned,Southern production is tilted toward sector P relative to Northern produc-tion (Y N
P0/YSP0 × Y S
NP0/YNNP0 = 0.77), so that the South has a small initial
comparative advantage in sector P .The consumption share of good P is computed using world production
of both sectors: ν = 0.257. The capital shares are α = 0.5 for sector P andβ = 0.3 for sector NP , here using the ratio of capital to labor compensationsin both sectors in the United States according to the EU KLEMS dataset,[48], and the share of intermediates γ = 1/3, a common value in endogenousgrowth models. The elasticity of substitution between the clean and the dirtyinput, ε is fixed at 5, but Appendix A.16 considers the cases of ε = 3 and10. The innovation size κ is adjusted so that the long-run annual growthrate is 2%, and the concavity of the innovation function is fixed by choosingι = 0.55 (≥ 0.5 so that the equilibrium is unique for a small κ).The quality of the environment St is linearly and negatively related to the
atmospheric concentration of CO2; the assumption that S0 = S is relaxed,and the initial environmental quality S0 corresponds to the atmospheric con-centration in 2003-2007 (379 ppm). ∆ is chosen such that, for St = S0, half ofCO2 emissions are absorbed and do not add to atmospheric concentrations.Changes in atmospheric CO2 concentrations are mapped against changes intemperature, and S = 0 is chosen to correspond to a disaster temperaturelevel of 6C. The function ν (St) is the same as in AABH and mimics the costfunction of Nordhaus (2008) for temperature increases up to 3C. I identifythe ratio Y X
c0 /YXd0 with the ratio of nonfossil to fossil fuel energy produced
for country X’s primary energy supply (following IEA, 2010b). From this, Iderive the ratio AXc0/A
Xd0. This, together with the emission rates in sector P
in both countries, gives the emission rates per unit of dirty input ξX .33
Yet, the model is still very stylized and the numerical exercise shouldnot be taken too literally. A more complete calibration would feature amore realistic carbon cycle, a more detailed trade model where domesticproduction and imports are not perfect substitutes, a nontradable sector,and some technologies in sector P common to the clean and the dirty inputs.
32According to the model, I ignore emissions from sector NP , which corresponds tothe other sectors in manufacturing (except 23, 25, 33, 36 and 37, for which data are notavailable).33Overall the emission rate in sector P in the South is nearly 4 times that of the North’s,
so that ξS > ξN , even though ANd0/ANc0 < ASd0/A
Sc0.
33
0 50 100 150 200 250 300
0
0.2
0.4
0.6
0.8
1
Year
Allo
catio
n of
scie
ntist
s
0 50 100 150 200 250 3000
0.05
0.1
0.15
0.2
Taxe
s
First Best
Year
North cleanNorth dirtySouth cleanSouth dirty
carbon tax Northcarbon tax South
Figure 1: First-best policy. From left to right, figures: 1.A and 1.B.
Such an exercise would deserve a separate paper and is left for future research.
4.4. Simulation results
Figure 1 describes the first-best policy. Figure 1.A shows that sector-Pinnovation switches to clean technologies (here immediately), and is rapidlyonly carried out in the South, since both countries rapidly fully specialize (theNorth clean, North dirty and South dirty lines are indistinguishable from thex-axis and the scientists allocated to sector NP are not represented). Thisrapid full specialization results from a relatively large growth rate (2% ayear), combined with a small difference in capital shares between the twosectors (α− β = 0.2) and a small initial comparative advantage. Either im-perfect mobility of factors, cross-sector or cross-country knowledge spillovers,or imperfect substitutability between domestic and foreign goods would havethe effect of slowing down the specialization process. Figure 1.B shows thead valorem carbon taxes in both countries, they decline and eventually reach0 as the environment recovers; it declines faster in the South where cleantechnologies catch up with dirty ones.Figure 2 shows the second-best policy. Contrary to the first-best case, the
North must now export good P in the long run. For these parameter values,a large trade tax on good P (Figure 2.B) ensures that, right from the first pe-riod, the South specializes in sector NP , and thus does not innovate in sectorP (in Figure 2.A, the South clean and South dirty lines are indistinguishable
34
0 5 0 1 0 0 1 5 0 2 0 0 2 5 0 3 0 00
0 .0 5
0 .1
0 .1 5
0 .2
0 .2 5
0 .3
0 .3 5
0 .4
Y e a r
Allo
catio
n of
scien
tists
S eco n d B es t
0 5 0 1 0 0 1 5 0 2 0 0 2 5 0 3 0 00 .0 5
0
0 .0 5
0 .1
0 .1 5
0 .2
Taxe
s
Y e a r
N o rth cleanN o rth d irtyS o u th cleanS o u th d irty
carb o n tax N o rthtrad e tax o n g o o d P
Figure 2: Second-best policies. From left to right, figures 2.A and 2.B.
from the x-axis, all Southern innovation is in sector NP ). Several factors ex-plain this feature: the high emission rate in the South means that it shouldspecialize rapidly in sector NP , its low initial comparative advantage thatthe pattern of trade is easily reversed, and its smaller size together with asmall difference α−β in factor shares between the two sectors imply that fullspecialization there is reached quickly. The switch from predominantly dirtyto clean innovation in sector P occurs after 65 years. The switch is delayedrelative to the first-best because the North starts with a lower emission ratein sector P , so that the initial temperature increase is lower, and becausecontinuing to invest in dirty technologies helps the North build a large com-parative advantage in sector P . The amount of clean innovation increasesover time and, beyond the time frame of the simulation, eventually reachesone when the North fully specializes in sector P (in line with Proposition 5).The unilateral policies which are able to avoid a disaster are quite radical
since they involve a reversal in the pattern of trade, so the welfare costs fromnot being able to intervene in the South may be very large. Table 1 reportsthe welfare costs of the first-best and second best-policies, computed as theequivalent percentage loss of world consumption every period relative to thefirst-best case in a “miracle” scenario under which the dirty input wouldcease to pollute (i.e. ξN = ξS = 0). As already emphasized, the numbersshould not be taken literally considering the limits of the numerical exercise.Yet, comparing the costs of the first-best and second-best policies is stillof interest: in this simple model, not being able to intervene in the Southincreases the welfare costs by a factor 4. The reason is that reversing the
35
pattern of comparative advantages leads to significant static costs in the firstperiods and to lower productivity levels in subsequent periods. Thereforeunilateral intervention is possible here but a global one is much preferred.34
Table 1: Disaster and welfare costFirst-best Second-best Third-best
Welfare cost (%) 6.36 24.64 24.75
Table 1 also presents the case of a “third”best in which the North canimplement a positive carbon tax and research subsidies/taxes but cannotimplement trade, consumption, or production taxes. With the calibratedparameter values it is still possible to avoid a disaster under such a policy(which is not always the case, see Remark 1), and the welfare costs of dis-pensing with the trade tax are small. With these parameters, the differencein initial comparative advantages is small and innovation is very effective inaffecting technological levels. As a result, the North can quickly acquire acomparative advantage in sector P without the help of a trade tax by in-novating more in that sector than in the second-best and implementing alow carbon tax initially. As before, the South quickly specializes in sectorNP . Appendix A.16 discusses the distributional impacts and presents thecase where the social planner maximizes (28).
4.5. Trade and Directed Technical Change, Two Double-Edged SwordsFigure 3 shows the temperature increase for different policies when trade
is allowed for and when the two countries are in autarky, in laissez-faire andunder various policies. Laissez-faire leads to an environmental disaster after50 years for the open economy case but occurs later in autarky, since economicgrowth is lower in that case. Under free-trade and following Proposition 2, nocombination of a positive carbon tax or a tax on dirty research in the Northcan prevent an environmental disaster. Figures 3.A depicts the combinationthat minimizes CO2 emissions (“Taxes on Good P in the North Only”), thecurve is indistinguishable from the laissez-faire one, as it is not even possibleto delay a disaster with such a policy when trade is allowed.35 In contrast, in
34This increase in cost is almost entirely due to the environmental externality. In themiracle case, the inability to intervene in the South generates welfare cost since innovationthere is not allocated optimally, but these costs are very small: 0.03%.35The dynamic aspect is key in obtaining this result, since it also holds when North and
South initially have the same emission rates (when ASc0/ASd0 = ANc0/A
Nd0 and ξ
S = ξN ):
36
0 50 100 150 200 250 3000
1
2
3
4
5
6
Year
Open EconomyTe
mpe
ratu
re in
crea
se
LaissezfaireTaxes on good P in the North onlyFirst bestSecond best
0 50 100 150 200 250 3000
1
2
3
4
5
6
Tem
pera
ture
incr
ease
Autarky
Year
LaissezfaireTaxes on good P in the North onlyFirst bestSecond best
Figure 3: Temperature increase in open economy and in autarky. From left to right:Figures 2.A and 2.B.
autarky, such a policy can postpone the disaster for 85 years, as there is nopollution haven effect. The second-best curve in Figure 3.A shows how theappropriate unilateral intervention avoids an environmental disaster, whileadding the same instrument (research subsidies) does not affect emissionsmuch in autarky (in Figure 3.A, the second-best refers to the maximizationof (1), while in Figure 3.B, it is the combination of research subsidies andpositive carbon tax which minimizes CO2 emissions). Even in the first-bestcase temperature increases more in autarky because the growth rate of cleantechnologies is lower than in the open economy scenario.36 Overall, Figure2 illustrates the double-edged nature of trade: without it, unilateral policiescannot prevent a disaster; but opening up to trade accelerates environmentaldegradation if the North does not undertake the appropriate policy (thisrelates this paper to the literature on the impact of trade on the environment,e.g. Copeland and Taylor, 1995).Directed technical change (DTC) plays a similar role. To study it, I
compare the current scenario with DTC to one in which the allocation ofinnovation is exogenous and equal in all subsectors (sXct = sXdt = sXNPt = 1/3).With the calibrated values, however, Northern taxes on the polluting goodcannot postpone the disaster even in the exogenous growth case. So as
36Comparing the increase in temperature between the first-best and the second-best inthe open economy case is interesting. The temperature is initially higher in the first-bestbecause the South’s emission rate is higher, but since the switch to clean innovation occurssooner, the temperature decreases faster.
37
0 50 100 150 200 250 3000
1
2
3
4
5
6
Year
Tem
pera
ture
incr
ease
With Directed Technical Change
L a isse z fa i reT a xe s on good P in the NorthFi rst be stSe c ond be st
0 50 100 150 200 250 3000
1
2
3
4
5
6
Year
Exogenous Technical Change
Tem
pera
ture
incr
ease
L a isse z fa i reT a xe s on good P in the NorthFi rst be stSe c ond be st
Figure 4: Temperature increase with and without directed technical change (differentcapital shares than in the baseline scenario: α = 0.7, β = 0.1). From left to right: figures3.A and 3.B.
to better illustrate the impact of DTC, I perform the same exercise butnow assume that α = 0.7 and β = 0.1. (A larger difference in capitalshares limits the pollution haven effect in a static model and therefore betterillustrates how it is amplified by the innovation response.) Figure 4 showsthat DTC accelerates the disaster under laissez-faire because it acceleratesthe economy’s growth rate. With DTC, a disaster cannot be postponed witha combination of positive carbon tax and tax on dirty research in the North:in fact the combination that minimizes CO2 emissions is no taxes. WithoutDTC, it is possible to delay an environmental disaster for up to 30 yearswith this policy because the dynamic pollution haven effect that this paperemphasizes is absent. Here, the second-best policy can avoid a disaster bothwith and without DTC, but without DTC, the increase in temperature ismuch larger– despite a much lower growth rate– and a large trade tax mustbe permanently maintained in order to reverse the pattern of trade.In fact, there are parameters for which unilateral policies cannot prevent
a disaster without DTC, regardless of initial environmental quality. To avoida disaster, the North should be able to produce good P relying mostly onclean technologies and to force the South to asymptotically fully specializein sector NP . The most extreme way for the North to do this is to produceonly good P (with nearly only the clean input) and to give it for free tothe South. Yet, without DTC, the ratio of relative productivities stay thesame over time, so if initially the South has a large comparative advantagein sector P , or if clean technologies in the North are suffi ciently backward,
38
this is not enough to push the South towards full specialization and to avoida disaster. This thought experiment demonstrates that innovation’s abilityto affect comparative advantage is essential in deriving the previous results.
5. Knowledge Diffusion
I now relax the assumption that productivity improvements are entirelycountry specific. In reality, some productivity improvements cross borders,mitigating the amplification of comparative advantage effect, which partlydrove the previous results.37 This brings into question the robustness of theprevious analysis. Here I consider an extension of the original model wherebythe lagging country can benefit from the diffusion of innovations producedin the leading country, while Appendix A.18 considers a different extensionwhere innovation is undertaken by multinational firms so that technologiesare the same in both countries.To model knowledge diffusion in a simple way, I assume that, at the begin-
ning of every period, the country with the less advanced average productivityin a given sector can partially catch up exogenously. That is, before any in-novation occurs, the producer of intermediate i in sector z ∈ c, d,NP gainsaccess to the technology AXzit = max((A−Xz(t−1)/A
Xz(t−1))
Ω, 1)AXzi(t−1), whereΩ ∈ [0, 1] measures the strength of the technological diffusion. This equalitythen delivers the following law of motion for aggregate productivity:
AXzt =(1 + κ
(sXzt)ι)1−γ
max
((A−Xz(t−1)/A
Xz(t−1)
)Ω
, 1
)AXz(t−1)
for z ∈ c, d,NP. Under this formulation, the ratio of the technological lev-els across countries cannot diverge: as soon as one country acquires a strongadvantage over the other one, the catching-up process ensures that this dif-ference is reduced in the next period. Unless factor endowments are signif-icantly different across countries, this limits considerably the scope for fullspecialization. Yet, the main intuitions of the baseline model carry through.
37One should not expect all productivity improvement to cross borders easily, becausesome may be embedded in capital or may depend on local know-how. Dechezleprêtre et al.(2011) suggest that clean technology transfers between developing and developed countriesexist but are limited: for the period 2000—2005, only 15 percent of the clean innovationswere patented in more than one country; this is slightly less than the share (17 percent)of all innovations patented in more than one country.
39
Northern policies that foster clean innovation in the North now also in-crease the productivity of clean Southern technologies. They may even putthe South on a clean innovation track. If, in some period, pre-innovationclean Southern technologies become more advanced than dirty ones (i.e., forsome t, ASct > ASdt), market forces will induce more clean than dirty inno-vations in the South from that period onwards. Preventing a disaster doesnot necessarily involve pushing the South toward specializing in sector NPany more; it can also be achieved by ensuring a switch to clean innovationthere. That transition will occur if more scientists are allocated to clean tech-nologies in the North than to dirty technologies in the South for a suffi cientamount of time. Clean innovation in the North and dirty innovation in theSouth enter a horse race, which determines whether or not good P will beproduced in a clean way in the long-run. Who wins depends on the policiesthat the North allows for and on the pattern of comparative advantage, muchas in Section 3, which leads to the following result (proof in Appendix A.17).
Proposition 6. Assume that initially: (i) technologies are suffi ciently closeto each other across countries, that κ is suffi ciently small, and that thespillovers Ω are suffi ciently strong; (ii) the South is relatively well-endowedin capital, KS/LS > KN/LN ; and (iii) clean technologies are suffi ciently lessadvanced than dirty ones (ASc0/A
Sd0 suffi ciently small). Then no combination
of a carbon tax and a tax on dirty research in the North can prevent a disasterirrespective of how high initial environmental quality S0 is.
This proposition mirrors Proposition 2. Assumption (i) implies that tech-nology levels remain suffi ciently close to each other across countries. Whencombined with assumption (ii), it ensures that the South maintains its com-parative advantage in sector P (before the implementation of a carbon tax).Assumption (iii) plays the same role as in Proposition 2, ensuring that, whenthe South has the comparative advantage in sector P , it innovates there morethan the North does. Since a carbon tax in the North can only reinforce theSouth’s comparative advantage in P (and in fact, a carbon tax still increasesSouthern innovation in sector P ), there are more Southern scientists innovat-ing in dirty technologies than Northern scientists innovating in clean ones.Hence Southern clean productivity ASct never catches up, so a switch in theSouth to clean innovation never occurs. Intuitively, the Northern market forgood P is too small to generate enough clean innovations.When the South is identified with non-Annex I countries, assumption (ii)
seems less likely to hold relative to its counterpart in Proposition 2, which
40
only stipulates that the South has a comparative advantage in sector P–though it may hold if one interprets LX as human capital and not simplylabor. In fact, if the North has a large “endowments”-comparative advantagein sector P (that is for
(KN/LN
)/(KS/LS
)large enough) and knowledge
spillovers are strong enough, it can prevent a disaster using a combination of acarbon tax and a tax on dirty research for suffi ciently high S0. One may thenargue that knowledge spillovers weaken the conclusion that Annex I countriescould not prevent worldwide emissions from growing using a carbon tax only.Yet assumption (ii) could also be more generally interpreted as assuming thatthe South has a comparative advantage in P for reasons beyond imitabletechnological factors, which could include factor endowments (capital, laborbut also natural resources), policies, different market distortions, etc... Thisbroader interpretation is more likely to hold, in which case the conclusionthat Annex I countries could not prevent worldwide emissions from growingwithout research subsidies would be reinforced.Indeed, as before, a temporary combination of clean research subsidies
and a tariff can prevent a disaster for suffi ciently large initial environmentalquality (i.e., Proposition 3 still holds). Clean research subsidies can reallocateNorthern innovation to clean technologies, and a tariff can limit Southerninnovation in dirty technologies. Then ASct grows faster than ASdt, and aswitch to clean innovation eventually occurs in the South.38
Table 2: Welfare cost in the presence of knowledge spilloversFirst-best Second-best
Ω = 0.4 (%) 5.71 6.92Ω = 0.8 (%) 5.95 6.58
The structures of the first-best and second-best policies are broadly simi-lar, but the trade tax and subsidies for research must take knowledge spilloversinto account, and the second-best policy may prevent a disaster with a Southexporting good P in the long-run. In addition, the welfare costs of unilateral
38Remark 1 no longer holds when clean and dirty inputs are imperfect substitutes. Be-cause of knowledge spillovers the ratio ASct/A
Sdt cannot approach zero if the North allocates
all its scientists to clean technologies, so that the South always allocate some scientiststo clean technologies. ASct becomes greater than A
Sdt at some t, after which a switch to
clean innovation occurs in the South. Remark 1 still holds if ε = ∞, or with a differentinnovation function which does not satisfy the Inada condition (such as κ ((s+ Υ)
ι −Υι)with Υ > 0).
41
intervention are typically lower than without knowledge spillovers. Indeed,the reversal in comparative advantages, which generated the large welfarecost in the no-spillover case, may not happen, and even if it does, is muchless costly since the South ends up benefiting from the technologies that theNorth had developed. Accordingly, Table 2 shows the welfare costs in thefirst-best and the second-best cases with knowledge spillovers (Ω = 0.4 andΩ = 0.8): the welfare costs of the first-best policy are very similar to thosein Table 1, but those of the second-best policy are much lower.39
To some extent, technological diffusion itself is a parameter that canbe affected by policy: laxer intellectual property rights, direct financing ofprojects abroad, or migrations of skilled workers could all contribute to afaster diffusion of technology. Therefore, according to the analysis presentedhere, the diffusion of clean technologies from North to South renders a tariffless necessary, and significantly reduces the costs of a unilateral policy.
5.1. An extended model: knowledge spillovers, nontradables and different en-dowments of scientists
The inclusion of knowledge spillovers allows to obtain non-trivial resultswhen the economy also features a nontradable sector. I now assume thatfinal consumption is a Cobb-Douglas aggregate of nontradable (CX
NT ) andtradable goods (CX
T ), where the consumption share of tradables is given bya, that is:
CX =(CXT
)a (CXNT
)1−a. (29)
Both goods are produced according to (2), with the associated goods P andNP (and the associated subsectors c and d), but for the nontradable good,the polluting and non-polluting inputs must be sourced locally. The sameintermediates are used whether the good is produced for the tradable or non-tradable sector. In the no-spillovers case, it is impossible to prevent a disasterbecause Southern emissions from nontradables will increase unboundedly re-gardless of Northern policy. In addition, I allow for the mass of scientists inthe South (sS) and the North to differ (sN). For simplicity, I focus on the casewhere the clean and dirty inputs are perfect substitutes (ε = ∞).40 I intro-
39Here, the reversal of comparative advantage still takes place in the presence of knowl-edge spillovers because the difference in factor endowments is small.40Focusing on this case allows to write a simpler proposition. It is possible to generalize
the results provided that the initial ratio ASc0/ASd0 is small enough.
42
duce the notations d ≡ 1 +(
1(1−ν)(1−a)
− 1)− 1
1−ιand d = 1 +
(1
ν(1−a)− 1) 1
1−ι,
such that d > d > 1. Propositions 2 and 3 are then modified according tothe following proposition (proof in Appendix A.19).
Proposition 7. Assume that κ is suffi ciently small and that dirty technolo-gies are initially more advanced than clean ones in both countries.a) No combination of a carbon tax and a tax on dirty research in the Northcan prevent a disaster irrespective of how high initial environmental qualityS0 is, provided that knowledge spillovers Ω are strong enough and-either i) the South is relatively well-endowed in capital (KS/LS > KN/LN)and sS ≥ sN ;- or ii)
(KN/KS
)α (LN/LS
)1−αis small enough,
(KN/KS
)β (LN/LS
)1−βis
large enough, and sN/sS < d/d.b) A combination of a carbon tax and a tax on dirty research in the Northcan prevent a disaster if S0 is high enough and sN/sS > d/d.c) Research subsidies in the North alone can prevent a disaster if S0 is highenough and sN/sS > 1/d.d) Unilateral policies can never prevent a disaster if sN/sS < 1/d.
Therefore, the logic of Proposition 2 carries through. A carbon tax isgenerally unable to prevent a disaster particularly when the South has alarge comparative advantage in sector P . It is only if the North has muchmore innovation resources than the South that such a policy may succeedregardless of the pattern of comparative advantage. In addition, since d/dincreases in a, a larger share of tradables makes it more likely that a carbontax fails. Proposition 3 survives as long as the North innovation resources arenot too small relative to the South. Otherwise, and especially if the shareof tradables is small, it may be impossible to prevent a disaster with anyunilateral policies, as the South innovates more in dirty for its nontradablesector than the North innovates in clean, preventing clean technologies fromcatching up.41
41The assumptions that κ is small and that ε = ∞ allow to derive exacts expressionsregarding the thresholds d/d, 1/d and 1/d, otherwise the expressions are more complicated(see the proof). Part c) of the proposition characterizes a range of parameters for which adisaster can be avoided with research subsidies only, allowing for a trade tax expands thisrange (within the limit of part d).
43
6. Conclusion
On the backdrop of a literature on trade and the environment, whichhas largely ignored innovation, this paper presents a simple model whichputs innovation at the center. It shows that when evaluating the long-term consequences of unilateral environmental policies, it is essential to con-sider their impact on the allocation of innovation within the polluting sectorbetween technologies (clean/dirty) and between countries (intervening/non-intervening). The propositions in the text model-specific but they allow toillustrate fundamental intuitions. First, the pollution haven effect becomesworse in a dynamic setting. Positive taxes on the polluting sector in theNorth risk placing the economy on a path that leads to the South havinga comparative advantage in the polluting sector. This leads to the reloca-tion of not only the production of the polluting good but also of innovationin that sector, which dramatically hampers the benefits of such a policy onworldwide emissions. The South innovates more in dirty technologies, whileinnovation in clean technologies in the North does not take off because themarket share for the polluting sector is reduced. Second, sustainable growthcan be achieved without cooperation from the South, but this requires a“green industrial policy”(with clean research subsidies and perhaps a tradetax) in order to ensure that there is more clean than dirty innovation world-wide. Such a policy can guarantee that either the North acquires a long-runcomparative advantage in the polluting sector, or, with knowledge spillovers,that a switch towards clean innovation occurs in the South.Therefore, in practice, the paper argues that unilateral environmental
policies should be devoted to developing clean technologies, which have thepotential to reduce emissions in the North, but also in the South eitherthrough technology diffusion or by slowing down the move of polluting in-dustries there. These policies should be thought of as transitory until asatisfactory global agreement is reached. The paper aims at analyzing what“well-intentioned” countries should do until then, and therefore, as a firststep, it has taken as given the absence of such an agreement. The next logi-cal step is to analyze why some countries are willing to participate and othersare not, and how unilateral policies shape their intentions in the long-run.This is, however, a complex issue as the incentive to sign a global agreementdepends on the benefit that the reluctant country would get from it. Uni-lateral policies can affect this potential benefit in at least three dimensions:by decreasing environmental damages which discourages a reluctant country
44
from joining (the free-rider problem), by developing clean technologies whichcan diffuse and therefore reduce the costs of an environmental policy for thereluctant country, and by affecting comparative advantages and therefore theimpact of a potential environmental policy on the reluctant country’s termsof trade (as analyzed in a static framework by Copeland and Taylor, 2005).Another aspect left for future research is to study policies that directly
boost technological diffusion. Such policies (e.g., the clean developmentmechanism) are already part of climate negotiations. Studying technolog-ical diffusion would, however, require a proper model of intellectual propertyrights (IPR), whose impact on emissions is ambiguous. On the one hand,laxer IPR could lead to more rapid diffusion of clean technologies to theSouth, which would facilitate the switch to a clean path there. On the otherhand, they might reduce the incentives to develop Northern clean technolo-gies in the first place. Finally, the paper’s results suggest that directed tech-nical change renders Southern emissions much more responsive to Northernpolicies in the long run. This finding calls into question existing estimates ofthe carbon leakage rate obtained from static models. To properly evaluatethe impact of local carbon taxes and carbon tariffs, numerical models of theworld economy should incorporate directed technical change.
7. Acknowledgments
I am very grateful to my advisors Daron Acemoglu, Philippe Aghion, PolAntràs and Elhanan Helpman for their invaluable guidance. I thank DavidAtkin, Steve Cicala, Richard Cooper, Rafael Dix-Carneiro, Vasco Carvalho,Matt Darnell, Dave Donaldson, Emmanuel Farhi, Gita Gopinath, AdamGuren, Christian Hellwig, Per Krussell, Marc Melitz, Nathan Nunn, MortenOlsen, Jennifer Page, Torsten Persson, Dorothée Rouzet, Robert Stavins,Vania Stavrakeva, Jean Tirole, Anthony Venables, and Martin Weitzmanfor their helpful comments. I also thank seminar and conference partici-pants at Harvard University, Harvard University Kennedy School of Govern-ment, Toulouse School of Economics, IIES Stockholm, INSEAD, Universityof Maryland, Ohio State University, Pennsylvania State University, the con-ference on macroeconomics and climate change at Yale University, the con-ference on climate and the economy at IIES Stockholm, Ecole Polytechnique,the EAERE 2013 conference, ETH Zurich, CIRED, the Oxcarre conferenceand Paris School of Economics.
45
References
[1] Acemoglu, D., 2003. Patterns of skill premia. Review of Economic Stud-ies 70, 199—230.
[2] Acemoglu, D., Aghion, P., Bursztyn, L., Hémous, D., 2012a. The envi-ronment and directed technical change. The American Economic Review102 (1), 131—166.
[3] Acemoglu, D., Aghion, P., Hémous, D., 2013. The environment anddirected technical change in a North-South model.
[4] Acemoglu, D., Akcigit, U., Hanley, D., Kerr, W., 2012b. The transitionto clean technology, mimeo.
[5] Aghion, P., Dechezleprêtre, A., Hémous, D., Martin, R., Reenen, J. V.,forthcoming. Carbon taxes, path dependency and directed technicalchange: Evidence from the auto industry. Journal of Political Economy.
[6] Aichele, R., Felbermayr, G., 2012. Kyoto and the carbon footprint ofnations. Journal of Environmental Economics and Management (forth-coming).
[7] Atkinson, G., Hamilton, K., Ruta, G., Mensbrugghe, D. V. D., 2011.Trade in "virtual carbon": Empirical results and implications for policy.Global Enviromental Change 21, 563—574.
[8] Babiker, M. H., Rutherford, T. F., 2005. The economic effects of bordermeasures in subglobal climate agreements. The Energy Journal 26, 99—126.
[10] Bovenberg, A. L., Smulders, S., 1995. Environmental quality andpollution-augmenting technological change in a two-sector endogenousgrowth model. Journal of Public Economics 57 (3), 369—391.
[11] Broner, F., Bustos, P., Carvalho, V., 2012. Sources of comparative ad-vantages in polluting industries, Working Paper 655, Barcelona Gradu-ate School of Economics.
46
[12] Böhringer, C., Carbon, J. C., Rutherford, T. F., 2011. Embodied carbontariffs, NBER Working Papers 17376.
[13] Böhringer, C., Fischer, C., Rosendahl, K. E., 2010. The global effects ofsubglobal climate policies. The B.E. Journal of Economic Analysis andPolicy 10(2), article 13.
[14] Copeland, B. R., Taylor, M. S., 1995. Trade and transboundary pollu-tion. The American Economic Review 85(4), 716—737.
[15] Copeland, B. R., Taylor, M. S., 2004. Trade, growth and the environ-ment. Journal of Economic Literature 42(1), 7—71.
[16] Copeland, B. R., Taylor, M. S., 2005. Free trade and global warming:a trade theory view of the kyoto protocol. Journal of EnvironmentalEconomics and Management 49, 205 —234.
[17] Davis, S., Caldeira, K., 2010. Consumption-based accounting of CO2emissions. Proceedings of the National Academy of Sciences 107(12),5867—5693.
[18] Dechezleprêtre, A., Glachant, M., Hascic, I., Johnstone, N., Ménière, Y.,2011. Invention and transfer of climate change mitigation technologieson a global scale: A study drawing on patent data. Review of Environ-mental Economics and Policy 5(1), 109—130.
[19] Elliott, J., Foster, I., Kortum, S., Munson, T., Cervantes, F. P., Weis-bach, D., 2010. Trade and carbon taxes. American Economic Review:Papers & Proceedings 100, 465—469.
[20] Gancia, G., Bonfiglioli, A., 2008. North-South trade and directed tech-nical change. Journal of International Economics 76, 276—295.
[21] Gerlagh, R., Snorre, K., Rosendahl, K. E., 2014. The optimal time pathof clean energy R&D policy when patents have finite lifetime. Journalof Environmental Economics and Management 67 (1), 2—19.
[22] Golosov, M., Hassler, J., Krusell, P., Tsyvinski, A., 2014. Optimal taxeson fossil fuel in general equilibrium. Econometrica 82, 41—88, nBERworking paper 17348.
47
[23] Goulder, L. H., Schneider, S. H., 1999. Induced technological changeand the attractiveness of CO2 abatement policies. Resource and EnergyEconomics 21 (3-4), 211—253.
[24] Grimaud, A., Rouge, L., 2008. Environment, directed technical changeand economic policy. Environmental and Resource Economics 41 (4),439—463.
[25] Grossman, G. M., Helpman, E., 1991. Innovation and Growth in theGlobal Economy. MIT Press. Cambridge, Massachusetts.
[26] Hassler, J., Krusell, P., 2012. Economics and climate change: Integratedassessment in a multi-region world. Journal of the European EconomicAssociation 10, 974U1000.
[27] Hassler, J., Krusell, P., Olovsson, C., 2012. Energy-saving technicalchange, NBER Working Paper No. 18456.
[28] Hoel, M., 1996. Should a carbon tax be differentiated across sectors?Journal of Public Economics 59, 17—32.
[29] IEA, 2010. Detailed CO2 estimates. In: IEA CO2 Emissions from FuelCombustion Statistics (database).
[30] IEA, 2010. World energy balances. In: IEA World Energy Statistics andBalances.
[31] Krugman, P., 1981. Trade, accumulation, and uneven development.Journal of Development Economics 8, 149—161.
[32] Krugman, P., 1987. The narrow moving band, the Dutch disease, andthe competitive consequences of Mrs Thatcher. Journal of DevelopmentEconomics 27, 41—55.
[33] Krusell, P., Smith, A., 2009. Macroeconomics and global climate change:Transition for a many-region economy.
[34] Maria, C. D., Smulders, S. A., 2004. Trade pessimists vs technologyoptimists: Induced technical change and pollution havens. The B.E.Journal of Economic Analysis and Policy 4(2), Article 7.
48
[35] Maria, C. D., van der Werf, E., 2008. Carbon leakage revisited: Unilat-eral climate policy with directed technical change. Environmental andResource Economics 39, 55—74.
[36] Markusen, J. R., 1975. International externalities and optimal tax struc-tures. Journal of International Economics 5, 15—29.
[37] Matsuyama, K., 1992. Agricultural productivity, comparative advantageand economic growth. Journal of Economic Theory 58, 317—334.
[38] Newell, R. G., Jaffe, A. B., Stavins, R. N., 1999. The induced innova-tion hypothesis and energy-saving technological change. The QuarterlyJournal of Economics 114 (3), 941—975.
[39] Nordhaus, W. D., 1994. Managing the Global Commons: The Eco-nomics of Climate Change. MIT Press. Cambridge, Massachusetts.
[40] Nordhaus, W. D., 2008. A Question of Balance: Economic Modeling ofGlobal Warming. Yale University Press, New Haven, CT.
[41] Nordhaus, W. D., Boyer, J., 2000. Warming the World: Economic Mod-eling of Global Warming. MIT Press. Cambridge, Massachusetts.
[42] OECD, 2013. Stan, database.
[43] Papgeorgiou, C., Saam, M., Schulte, P., 2013. Elasticity of substitutionbetween clean and dirty energy inputs - a macroeconomic perspective,zEW Discussion Paper 13-087.
[44] Pethig, R., 1976. Pollution, welfare, and environmental policy in thetheory of comparative advantage. Journal of Environmental Economicsand Management 2, 160—169.
[45] Popp, D., 2002. Induced innovation and energy prices. The AmericanEconomic Review 92 (1), 160—180.
[46] Popp, D., 2004. Entice: Endogenouse technological change in the DICEmodel of global warming. Journal of Environmental Economics andManagement 24 (1), 742—768.
[47] Stanton, E., 2011. Negishi welfare weights in integrated assessment mod-els: the mathematics of global inequality. Climatic Change 107, 417—432.
49
[48] Timmer, M., O’Mahony, M., van Ark, B., March 2008. EU KLEMSdatabase. In: The EU KLEMS Growth and Productivity Accounts: AnOverview. University of Groningen & University of Birmingham, down-loadable at www.euklems.net.
[50] van der Zwaan, B. C. C., Gerlagh, R., Klaassen, G., Schrattenholzer,L., 2002. Endogenous technological change in climate change modelling.Energy Economics 24 (1), 1—19.
[51] Young, A., 1991. Learning by doing and the dynamic effects of interna-tional trade. Quarterly Journal of Economics 106, 369—405.