134
MORGAN STANLEY DEAN WITTER The e-Marketing Report Equity Research Global May 2000 msdw.com X OK Want to Profit from e-Marketing? http://www.msdw.com

MORGAN STANLEY DEAN WITTERMORGAN STANLEY DEAN WITTER
The e-Marketing Report
Equity ResearchGlobal
May 2000
May 2000
MO
RG
AN
STA
NLE
YD
EA
N W
ITT
ER
The e-M
arketing Report
EQ
UIT
YR
ES
EA
RC
H
The Americas Europe Japan Asia Pacific1585 Broadway 25 Cabot Square, Canary Wharf 20-3, Ebisu 4-chome, Shibuya-ku Three Exchange Square 4th Floor Forbes BuildingNew York, New York 10036-8293 London E14 4QA, England Tokyo 150-6008, Japan Hong Kong Charanjit Rai Marg FortTel: (1) 212 761 4000 Tel: (44 171) 425 8000 Tel: (81) 3 5424 5000 Tel: (852) 2848 5200 Mumbai 400 001, India
Tel: (91 22) 209 6600
BCE Place, 181 Bay Street, AB Asesores 23 Church Street The Chifley Tower, Level 33Suite 3700 Plaza de la Lealtad, 3 #16-01 Capital Square 2 Chifley SquareToronto, Ontario M5J 2T3, Canada Madrid 28014, Spain Singapore 049481 Sydney NSW 2000, AustraliaTel: (1) 416 943 8400 Tel: (34 91) 580 1100 Tel: (65) 834 6888 Tel: (61 2) 9770 1111
msdw.com X
OKWant to Profit from e-Marketing?
http://www.msdw.com
MORGAN STANLEY DEAN WITTER
This memorandum is based on information available to the public. No representation is made that it is accurate or complete. This memorandum is not an offerto buy or sell or a solicitation of an offer to buy or sell the securities mentioned. Please refer to the notes at the end of this report.
AuthorsInternet Advertising & Direct Marketing ServicesMichael Russell ([email protected]) (212) 761-6352
Robert Keith ([email protected]) 8945
The Media TeamEntertainment, Satellites & Cable TelevisionRichard Bilotti ([email protected]) (212) 761-8042
Celeste Mellet ([email protected]) 3896Ben Swindburne ([email protected]) 7588Scott Babka ([email protected]) 7277
Gary Lieberman ([email protected]) 4343Alex Shire ([email protected]) 8124
Myles Davis ([email protected]) 6916Charles Bronstein ([email protected]) 8118
SatellitesMarc Nabi ([email protected]) 8228
R. Burns McKinney ([email protected]) 8940
BroadcastingFrank Bodenchak ([email protected]) 4251Kit Spring ([email protected]) 8204Brian Pitz ([email protected]) 4133
PublishingDouglas Arthur ([email protected]) 4441Craig Huber ([email protected]) 4939Gary Merwitz ([email protected]) 3959
Lisa Monaco ([email protected]) 3295
The Internet TeamInternet, Portals & Commerce/PC SoftwareMary Meeker ([email protected]) (212) 761-8042Mark Mahaney ([email protected]) 4864
David Joseph ([email protected]) 3365Mark Trowbridge ([email protected]) 3384Fabrizio Cascianelli ([email protected]) 8949
Internet/B2B Software & CommerceCharles Phillips ([email protected]) 4450
Ryan Rathman ([email protected]) 6377Evan Bloomberg ([email protected]) 3659Courtney Cook ([email protected]) 6347Matthew Miksic (Matthew [email protected]) 6261
Internet Infrastructure ServicesJeffrey Camp ([email protected]) 3112Stephen Flynn ([email protected]) 8294
April Henry ([email protected]) 4669Vivian Cervantes ([email protected]) 4649Jamie Gomezjurado ([email protected]) 6250Richard Lee ([email protected]) 3685
Internet Infrastructure & Data NetworkingGeorge Kelly ([email protected]) (212) 761-6242
Ronna Sieh ([email protected]) 3819Peter Carrillo ([email protected]) 6030
Internet Telecom Equipment � Wireline/WirelessAlkesh Shah ([email protected]) 6554
David Jackson ([email protected]) 3366Mark Weinswig ([email protected]) 4717Michael Lynch ([email protected]) 8342
Internet Consulting & Application ServicesMichael Sherrick ([email protected]) 6687
Douglas Levine ([email protected]) 7134Matthew Cullen ([email protected]) 8115
Internet Direct Marketing & Advertising ServicesMichael Russell ([email protected]) 6352
Robert Keith ([email protected]) 8945
Internet HealthcareMarie Rossi ([email protected]) 8290
Michael Fitzgibbons ([email protected]) 6983
Internet Financial ServicesHenry McVey ([email protected]) 7201Andrew Brown ([email protected]) 3408
Prem Kumar ([email protected]) 4875
Internet Drug & GroceryDebra Levin ([email protected]) 8414
Monica Aggarwal ([email protected]) 6893
Internet ImagingRebecca Runkle ([email protected]) 6466
Stacey Wexler ([email protected]) 4144
Internet SportsFrank Bodenchak ([email protected]) 4251
Brian Pitz ([email protected]) 4133
Internet DevicesGillian Munson ([email protected]) 6070
Tien Le ([email protected]) 6119
Vertical Portals � Career Services/Domestic ArtsDoug Arthur ([email protected]) 4441
Lisa Monaco ([email protected]) 3295
Internet AutomotiveStephen Girsky ([email protected]) 6317Susan Quilty ([email protected]) 6416
Soei Park ([email protected]) 6533Scott Ashby ([email protected]) 4573
Cross IndustryLawrence Herman ([email protected]) 7479Brian Fitzgerald ([email protected]) 4276
EditorialRichard Cunniff
GraphicsClaudette Bell
Joyce YurmanMariella Talleyrand
Morgan Stanley Dean Witter
MORGAN STANLEY DEAN WITTER
This memorandum is based on information available to the public. No representation is made that it is accurate or complete. This memorandum is not an offerto buy or sell or a solicitation of an offer to buy or sell the securities mentioned. Please refer to the notes at the end of this report.
http://www.msdw.com/
MORGAN STANLEY DEAN WITTER
Chapter 1
Chapter 2
Chapter 3
Chapter 4
Chapter 5
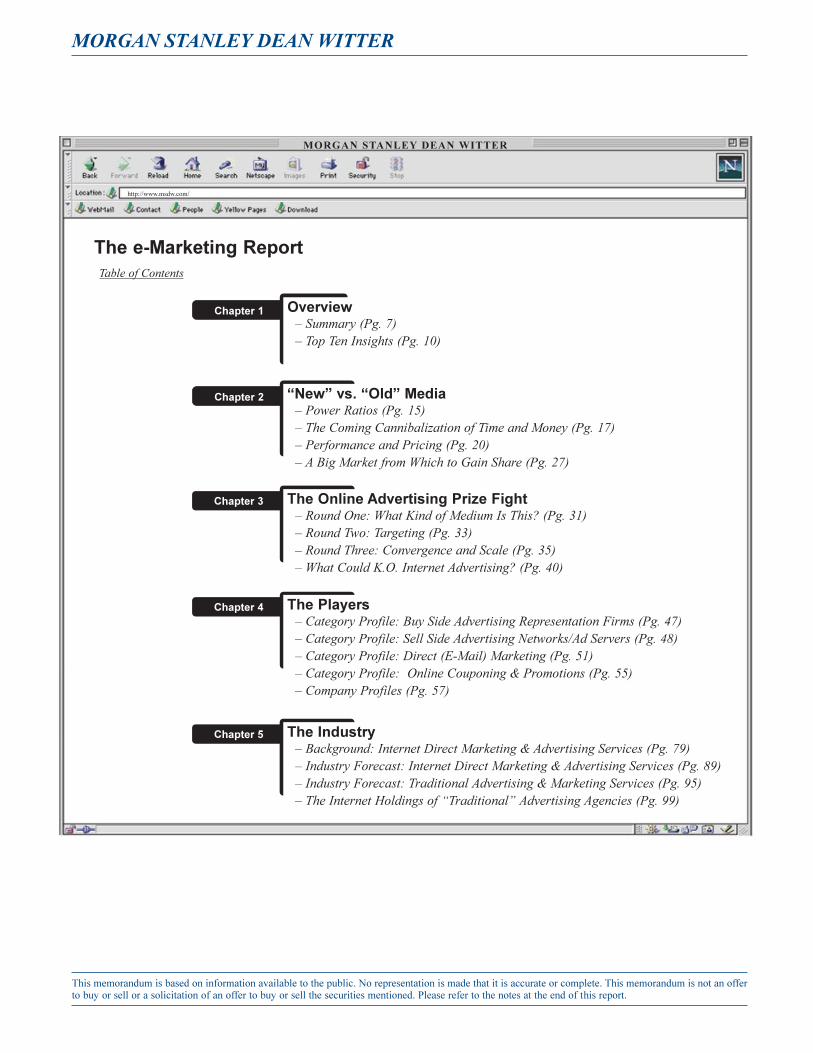
The e-Marketing ReportTable of Contents
Overview� Summary (Pg. 7)� Top Ten Insights (Pg. 10)
�New� vs. �Old� Media� Power Ratios (Pg. 15)� The Coming Cannibalization of Time and Money (Pg. 17)� Performance and Pricing (Pg. 20)� A Big Market from Which to Gain Share (Pg. 27)
The Online Advertising Prize Fight � Round One: What Kind of Medium Is This? (Pg. 31)� Round Two: Targeting (Pg. 33)� Round Three: Convergence and Scale (Pg. 35)� What Could K.O. Internet Advertising? (Pg. 40)
The Players� Category Profile: Buy Side Advertising Representation Firms (Pg. 47)� Category Profile: Sell Side Advertising Networks/Ad Servers (Pg. 48)� Category Profile: Direct (E-Mail) Marketing (Pg. 51)� Category Profile: Online Couponing & Promotions (Pg. 55)� Company Profiles (Pg. 57)
The Industry� Background: Internet Direct Marketing & Advertising Services (Pg. 79)� Industry Forecast: Internet Direct Marketing & Advertising Services (Pg. 89)� Industry Forecast: Traditional Advertising & Marketing Services (Pg. 95)� The Internet Holdings of �Traditional� Advertising Agencies (Pg. 99)

2 MORGAN STANLEY DEAN WITTER
This memorandum is based on information available to the public. No representation is made that it is accurate or complete. This memorandum is not an offer to buy or sell or asolicitation of an offer to buy or sell the securities mentioned. Please refer to the notes at the end of this report.
The e-Marketing Universe
BU
Y S
IDE
SE
LL
SID
E
LifeMinders
Digital Impact
NetCreations
MessageMedia

MORGAN STANLEY DEAN WITTER 3
This memorandum is based on information available to the public. No representation is made that it is accurate or complete. This memorandum is not an offer to buy or sell or asolicitation of an offer to buy or sell the securities mentioned. Please refer to the notes at the end of this report.
BU
Y S
IDE
SE
LL
SID
E
ADVERTISER
WEBTOOLWEB
CONSUMER
MediaPlex
L90
Netcentives
PromotionsBe Free
Avenue A
MyPointsFreeShopCybergold
DoubleClick
24/7 MediaEngage
Media MetrixNetRatings
NetPerceptions
PRIVACY
VIOLATIO
N
GO TO JAIL

4 MORGAN STANLEY DEAN WITTER
This memorandum is based on information available to the public. No representation is made that it is accurate or complete. This memorandum is not an offer to buy or sell or asolicitation of an offer to buy or sell the securities mentioned. Please refer to the notes at the end of this report.
5MORGAN STANLEY DEAN WITTER
This memorandum is based on information available to the public. No representation is made that it is accurate or complete. This memorandum is not an offerto buy or sell or a solicitation of an offer to buy or sell the securities mentioned. Please refer to the notes at the end of this report.
http://www.msdw.com/
MORGAN STANLEY DEAN WITTER
Summary (pg. 7)
Top Ten Insights (pg. 10)
Chapter 1 Chapter 2 Chapter 3 Chapter 4 Chapter 5
msdw.com X
OKOverview

6 MORGAN STANLEY DEAN WITTER
This memorandum is based on information available to the public. No representation is made that it is accurate or complete. This memorandum is not an offer to buy or sell or asolicitation of an offer to buy or sell the securities mentioned. Please refer to the notes at the end of this report.

MORGAN STANLEY DEAN WITTER 7
This memorandum is based on information available to the public. No representation is made that it is accurate or complete. This memorandum is not an offer to buy or sell or asolicitation of an offer to buy or sell the securities mentioned. Please refer to the notes at the end of this report.
May 3, 2000
Internet Direct Marketing Michael J. Russell (212) 761-6352 [email protected]
& Advertising Services Robert J. Keith (212) 761-8945 [email protected]
The e-Marketing Report
In the beginning (before Internet time)...
“I know that half the money I spend on advertisingis wasted... but I can never figure out which half.”John Wanamaker
In the beginning (of the Internet)...
“Advertising is a science, but the limitations of themedia turned it into an art.”Kevin O’ConnorCo-founder and CEO, DoubleClick
Today, on the Internet...
“The right ad in the right location can generate re-sults up to 100 times greater than the worst ad inthe worst location. Not knowing the proper com-bination leaves a lot of value on the table.”Brian McAndrewsCEO, Avenue A
Overview Three years have passed since we worked withMary Meeker and her team to publish The Internet Adver-tising Report. It is time to revisit e-advertising and add ananalysis of direct e-marketing (e-mail) to it.
E-Advertising Will Be Big...And Direct E-Marketing (E-mail) Is Fast on its Heels
We expect e-advertising will continue to swell. Our 2002estimates for e-advertising indicate that the U.S. may exceed$17 billion (a CAGR of over 64%) and Europe may reach$2 billion. Combined with estimates for Asia, Canada, andLatin America, worldwide e-advertising may reach $21 bil-lion in 2002. Global e-advertising and direct e-marketingshould be over $22 billion in 2002, up from $4.5 billion in1999 — a CAGR of 71%.
In the traditional world of U.S. marketing services, di-rect marketing exceeds brand advertising. Even withlow response rates, direct marketing can easily justify budg-ets aggregating to $175 billion in 1999. This total directmarketing number is more than twice the $85 billion of tra-ditional brand advertising spending.
The Internet is the perfect direct marketing tool. The Inter-net’s interactivity and tracking ability allows custom tai-lored marketing at minimum costs. The ability to performmatched cell tests and to change creative content on the flymakes for possibilities unimaginable in the traditional directmarketing world.

8 MORGAN STANLEY DEAN WITTER
This memorandum is based on information available to the public. No representation is made that it is accurate or complete. This memorandum is not an offer to buy or sell or asolicitation of an offer to buy or sell the securities mentioned. Please refer to the notes at the end of this report.
The Internet allows for targeting by individual browser —as well as by context or demographic. The Internet is ableto target specific messages to individual browsers or e-mailaccounts. It can also work like other media that narrowcastcontextually to households in particular demographics. TheInternet allows advertisers to access valuable backgroundinformation on consumers through the use of cookies, click-stream tracking, domain name recognition, and other means.
The Internet lets marketers know which pages are “dog-eared,” revealing an “intentional” database. The threemajor actions performed online — research, browsing, andpurchasing — all leave behind electronic trails of demon-strated interests that are incredibly valuable to advertisers.
The Internet produces a transactional database. By collaps-ing the ordering, billing and payment cycle into an inte-grated process, the Internet improves payment and lowerscost while maintaining an updated transactional database.
Early data indicate that the Internet may prove to bemore effective than traditional media in direct responseadvertising. Proof of such effectiveness may result in up-ward pressure on Internet advertising pricing and downwardpressure on traditional mass market advertising pricing.
The Potential of Internet AdvertisingIs Understood by its Power Ratio
It is our belief that the Internet’s current power ratio of 1.1is well below the 3.0 it could be. Simple recognition ofInternet user demographics should push the power ratiohigher — this should mean better pricing and higher inven-tory sellout ratios on the Internet.
The benefits of targeting could push the power ratio tothe 3.0+ level, somewhere ahead of magazine advertising.As the Internet’s power ratio rises, we believe that thoseareas with currently high power ratios, high pricing and lowtargeting capabilities — such as newspapers — may be hurt.
The War Between Traditional & Internet AdvertisingHas Been a Cold War So Far: 2001 Will Be Different
The Cold War To date, the Internet boom has increasedtotal media usage, increased advertising supply, and in-creased traditional and e-advertising demand. A strongeconomy and strong pharmaceutical advertising trends haveadded to the good-time frenzy in ad spending.
The Hot War In 2001, we expect the Cold War will turnHot and the battle for advertising market share will inten-sify. We forecast that in 2001 U.S. e-advertising and directe-marketing could take 17% of the incremental advertis-ing/marketing spending (we expect this to further increaseto 21% and 20% in 2002 and 2003, respectively). In 2001we expect Internet advertising and marketing spending togrow at almost a 77% clip, while we expect traditional me-dia advertising — excluding spending on the Internet — togrow at a 5% pace in 2001.
Dot-com’s may “eat their own cooking” in 2001. Weexpect successful Web brands will understand that theyneed to continue to invest in advertising their brands longafter the initial land grab is over. Advertising can bethought of as maintenance capex for a brand. However, wealso expect them to migrate more of their advertising onlineby 2001 (i.e., “eat their own cooking”), as the ROI of this adspace becomes more obvious and brands have been estab-lished.
Investment Conclusions
Based on the changing dynamics of the Internet’s impact onadvertising, we find four clear investment themes:
1) Starting now, we would advise traditional mediainvestors to increase their exposure to the new me-dia trends that we foresee developing in 2001. Thiscan be achieved through pure-play Internet advertisingcompanies or through traditional companies with dis-tinguishable Internet operations.
2) Additionally, we would encourage investment incompanies with strong direct marketing and databasemarketing skill-sets and personnel that can exploitthese skills on the Internet. If advertising becomesmore of a science because of the Internet (as KevinO’Connor of DoubleClick believes — and we agree),invest in the companies with the scientists.
3) Marketing services businesses appear less vulner-able to the Internet threat than do mass media,brand advertising companies. Due to the account-ability and affordability, we feel that marketing services(direct marketing, promotions, public relations, andother specialty communications) are less vulnerable to

MORGAN STANLEY DEAN WITTER 9
This memorandum is based on information available to the public. No representation is made that it is accurate or complete. This memorandum is not an offer to buy or sell or asolicitation of an offer to buy or sell the securities mentioned. Please refer to the notes at the end of this report.
the Internet threat than traditional branding businesseslike mass media advertising.
4) When it comes to market share gains, bigger sitesappear to be best (they are currently squeezing themid-sized sites), but in aggregate the smaller niche sitesappear to be holding their own. Over the past 9 quar-ters, smaller niche sites (those just below the top 50)appear to be on average holding on to, or gaining, mar-ket share. Over the same period, the top 10 sites appearto be gaining market share, largely at the expense of thetop 11-50 sites. It thus appears that purchasing a roy-alty on the revenue streams of small sites may be betterthan investing in the mid-sized sites and equally asgood as picking the big-time winners among the largestsites.
The companies below are likely to be some of the publicbeneficiaries of the trends cited in this report. (Althoughit is difficult to classify the companies into singular, non-overlapping categories, we have attempted to do so belowand list them alphabetically):
1) Buy-Side Companies
a) new media buyers (Avenue A, Mediaplex)
b) traditional media buyers (Interpublic, Omnicom,True North, WPP, Young & Rubicam)
c) direct e-mailers (Digital Impact, MessageMedia)
2) Sell–Side Companies
a) portals
b) ad networks (DoubleClick, Engage, L90, 24/7Media)
c) e-mail newsletters (LifeMinders)
3) Promotions Companies
a) providers of loyalty, incentives, and savings pro-grams (Be Free, Cybergold, Free Shop, My-Points.com, NetCentives, NetCreations)
4) Web Tools
a) audience and advertising measurement services(Media Metrix, Nielsen//NetRatings)
b) site-level marketing infrastructure, consulting andmeasurement (Net Perceptions, Be Free)
Additionally, e-consultants offer Web site development,Internet business planning and e-commerce development, inaddition to Internet marketing. While not within the scopeof this report, these companies are often partially owned bythe traditional ad agencies. Companies included in thisspace are: Sapient, MarchFirst, Viant, Scient, Organic,Agency.com, Razorfish, ModemMedia, and others. Finally,many of the large “traditional” agency holding companieslike Omnicom, Interpublic Group, Young & Rubicam, TrueNorth and WPP Group have consolidated operations incompanies that do e-marketing and e-consulting.
For now, we expect the market to prefer buy-side oppor-tunities. Sell-side companies somewhat compete with themore established major portals for media sales and mayhave more exposure to privacy concerns. Buy-side compa-nies appear to have less exposure to such issues. We alsoexpect some consolidation in the promotions area, as pro-motions and e-marketers converge in direct marketing.
At the same time, our conclusions reduce our general enthu-siasm for some U.S. advertising media, particularly news-papers. While we do not believe the Internet will commit“media-cide” and kill off any of the traditional media, we dobelieve it will alter their upside, market share and economicmodels.
10 MORGAN STANLEY DEAN WITTER
This memorandum is based on information available to the public. No representation is made that it is accurate or complete. This memorandum is not an offer to buy or sell or asolicitation of an offer to buy or sell the securities mentioned. Please refer to the notes at the end of this report.
Top Ten Insights
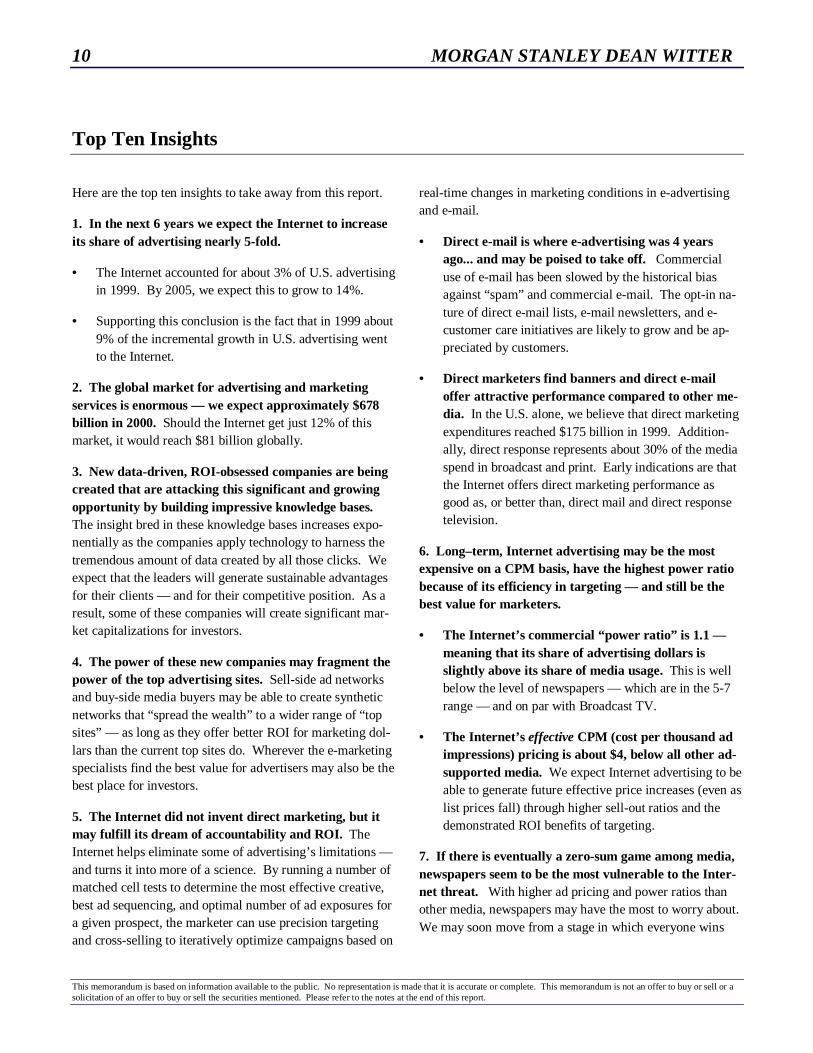
Here are the top ten insights to take away from this report.
1. In the next 6 years we expect the Internet to increaseits share of advertising nearly 5-fold.
• The Internet accounted for about 3% of U.S. advertisingin 1999. By 2005, we expect this to grow to 14%.
• Supporting this conclusion is the fact that in 1999 about9% of the incremental growth in U.S. advertising wentto the Internet.
2. The global market for advertising and marketingservices is enormous — we expect approximately $678billion in 2000. Should the Internet get just 12% of thismarket, it would reach $81 billion globally.
3. New data-driven, ROI-obsessed companies are beingcreated that are attacking this significant and growingopportunity by building impressive knowledge bases.The insight bred in these knowledge bases increases expo-nentially as the companies apply technology to harness thetremendous amount of data created by all those clicks. Weexpect that the leaders will generate sustainable advantagesfor their clients — and for their competitive position. As aresult, some of these companies will create significant mar-ket capitalizations for investors.
4. The power of these new companies may fragment thepower of the top advertising sites. Sell-side ad networksand buy-side media buyers may be able to create syntheticnetworks that “spread the wealth” to a wider range of “topsites” — as long as they offer better ROI for marketing dol-lars than the current top sites do. Wherever the e-marketingspecialists find the best value for advertisers may also be thebest place for investors.
5. The Internet did not invent direct marketing, but itmay fulfill its dream of accountability and ROI. TheInternet helps eliminate some of advertising’s limitations —and turns it into more of a science. By running a number ofmatched cell tests to determine the most effective creative,best ad sequencing, and optimal number of ad exposures fora given prospect, the marketer can use precision targetingand cross-selling to iteratively optimize campaigns based on
real-time changes in marketing conditions in e-advertisingand e-mail.
• Direct e-mail is where e-advertising was 4 yearsago... and may be poised to take off. Commercialuse of e-mail has been slowed by the historical biasagainst “spam” and commercial e-mail. The opt-in na-ture of direct e-mail lists, e-mail newsletters, and e-customer care initiatives are likely to grow and be ap-preciated by customers.
• Direct marketers find banners and direct e-mailoffer attractive performance compared to other me-dia. In the U.S. alone, we believe that direct marketingexpenditures reached $175 billion in 1999. Addition-ally, direct response represents about 30% of the mediaspend in broadcast and print. Early indications are thatthe Internet offers direct marketing performance asgood as, or better than, direct mail and direct responsetelevision.
6. Long–term, Internet advertising may be the mostexpensive on a CPM basis, have the highest power ratiobecause of its efficiency in targeting — and still be thebest value for marketers.
• The Internet’s commercial “power ratio” is 1.1 —meaning that its share of advertising dollars isslightly above its share of media usage. This is wellbelow the level of newspapers — which are in the 5-7range — and on par with Broadcast TV.
• The Internet’s effective CPM (cost per thousand adimpressions) pricing is about $4, below all other ad-supported media. We expect Internet advertising to beable to generate future effective price increases (even aslist prices fall) through higher sell-out ratios and thedemonstrated ROI benefits of targeting.
7. If there is eventually a zero-sum game among media,newspapers seem to be the most vulnerable to the Inter-net threat. With higher ad pricing and power ratios thanother media, newspapers may have the most to worry about.We may soon move from a stage in which everyone wins

MORGAN STANLEY DEAN WITTER 11
This memorandum is based on information available to the public. No representation is made that it is accurate or complete. This memorandum is not an offer to buy or sell or asolicitation of an offer to buy or sell the securities mentioned. Please refer to the notes at the end of this report.
because Internet usage is incremental — to more of a zero-sum battle for share of time and ad spend.
8. The “tail may wag the dog” — information gleanedfrom interactive advertising may determine decisions onpricing, positioning, and promotion in other media. Al-though we do not forecast the Internet to become the largestadvertising medium, it could be the most important. Theimmediate feedback and iterative process of e-advertising islikely to create intelligence on the pricing, positioning, andmessaging across all media.
9. Privacy issues are at a sensitive stage right now. E–marketing companies must be sensitive to the concerns ofconsumers and legislators regarding privacy in all of theirhost countries. As the Internet creates and tracks databasesof transactional, behavioral and contextual information —and as this information is linked to other data we alreadyhave — privacy concerns will be aired at the national andstate level. In the worst case, cookies could be demonized
and be made “opt–in,” reducing (but not eliminating) theability to target advertising, personalize content, and im-prove customer service. Even in this worst case, however,e-advertising and direct e-mail will offer the best targetedmarketing medium, just to a lesser extent.
10. Broadband promises to deliver rich media — whichallows marketers to get beyond banners and use soundand motion for more creative commercial offers thatgenerate higher response rates. This means better pric-ing, larger budget commitments and a greater opportunityfor well-positioned e-marketing services companies, pro-viding another wave of opportunity. While still hard toquantify, some analysts point to broadband as another cableTV business in the making. To put this in perspective, inthe U.S. national and local cable systems represent $11 bil-lion in advertising, about 7% of the total. Additionally, aconvergence of TV/Internet and wired/wireless appliancesmay lead to convergence in interactive marketing plans.

12 MORGAN STANLEY DEAN WITTER
This memorandum is based on information available to the public. No representation is made that it is accurate or complete. This memorandum is not an offer to buy or sell or asolicitation of an offer to buy or sell the securities mentioned. Please refer to the notes at the end of this report.

13MORGAN STANLEY DEAN WITTER
This memorandum is based on information available to the public. No representation is made that it is accurate or complete. This memorandum is not an offerto buy or sell or a solicitation of an offer to buy or sell the securities mentioned. Please refer to the notes at the end of this report.
http://www.msdw.com/
MORGAN STANLEY DEAN WITTER
Power Ratios (pg. 15)
The Internet's commercial �power ratio� of 1.1 is low, meaning more pricing power ahead. The Internet'sdemographics and targeting strengths could push it toward the magazine power ratio of 3.0.
If there is eventually a zero-sum game among media, newspapers seem to be the most vulnerable � with apossibly unsustainable power ratio of 5-7.
TV and radio appear safer � with 0.8 and 0.3 power ratios that are slightly lower than that of the Internet.
The Coming Cannibalization of Time and Money (pg. 17)
Cannibalization of time spent on traditional media will occur ... it's just a question of when.
Time share � how consumers allocate their time � will lead to market share (how advertisers allocate theirbudgets).
Currently, Internet usage appears to be incremental � it does not seem to be taking time away from TV view-ership. Other media have experienced minor declines in usage, but nothing significant... yet.
Performance and Pricing (pg. 20)
Using the effective CPM pricing of about $4, Internet advertising compares favorably with traditional media.Its average CPM is below that of all other media. We expect that eventually its superior targeting apabilitymay lead to premium pricing.
Banners and direct e-mail offer attractive cost-per-order performance when compared to the direct marketingperformance of traditional media � the problem is that traditional media has never been measured as closely.
The click-through rate is declining, but so is its importance. ROI-driven cost-per-action (i.e. order, registra-tion) metrics are driving pricing and budget allocations.
Recently, all traditional advertising revenues have been strong due to pricing growth. From 1993 to 1999media inflation grew at 6% per year. Recently, price increases have ranged from 10-20%. New dot-combrands and pharamaceuticals have helped drive demand and pricing across-the-board � a trend we believewill boost effective Internet CPMs, as well.
A Big Market from Which to Gain Share (pg. 27)
For now, Internet marketing services are but a tiny portion of a huge market. Investors may not realize thatour estimate for the global marketing budget in 2000 is about $678 billion.
The Internet accounted for about 3% of U.S. advertising in 1999. By 2005, we expect this to grow to 14%.
When considering the entire U.S. marketing budget of $390 billion (advertising plus marketing services), theInternet accounted for only 1% in 1999. We expect this number to quadruple by 2005.
Chapter 1 Chapter 2 Chapter 3 Chapter 4 Chapter 5
msdw.com X
OK�New� vs. �Old� Media

14 MORGAN STANLEY DEAN WITTER
This memorandum is based on information available to the public. No representation is made that it is accurate or complete. This memorandum is not an offer to buy or sell or asolicitation of an offer to buy or sell the securities mentioned. Please refer to the notes at the end of this report.
MORGAN STANLEY DEAN WITTER 15
This memorandum is based on information available to the public. No representation is made that it is accurate or complete. This memorandum is not an offer to buy or sell or asolicitation of an offer to buy or sell the securities mentioned. Please refer to the notes at the end of this report.
“New” vs. “Old” Media: Power Ratios
KEY POINTS:
½ The Internet’s current commercial “power ratio” of 1.1 is
low, meaning more pricing power ahead. The Internet’s
demographics and targeting strengths could push it to-
ward the magazine power ratio of 3.0.
½ If there is eventually a zero-sum game among media,
newspapers seem to be the most vulnerable — with a pos-
sibly unsustainable power ratio of 5-7.
½ TV and radio appear safer — with 0.8 and 0.3 power ra-
tios, respectively, that are slightly lower than that of the
Internet.
U.S. Internet Advertising Power Ratio
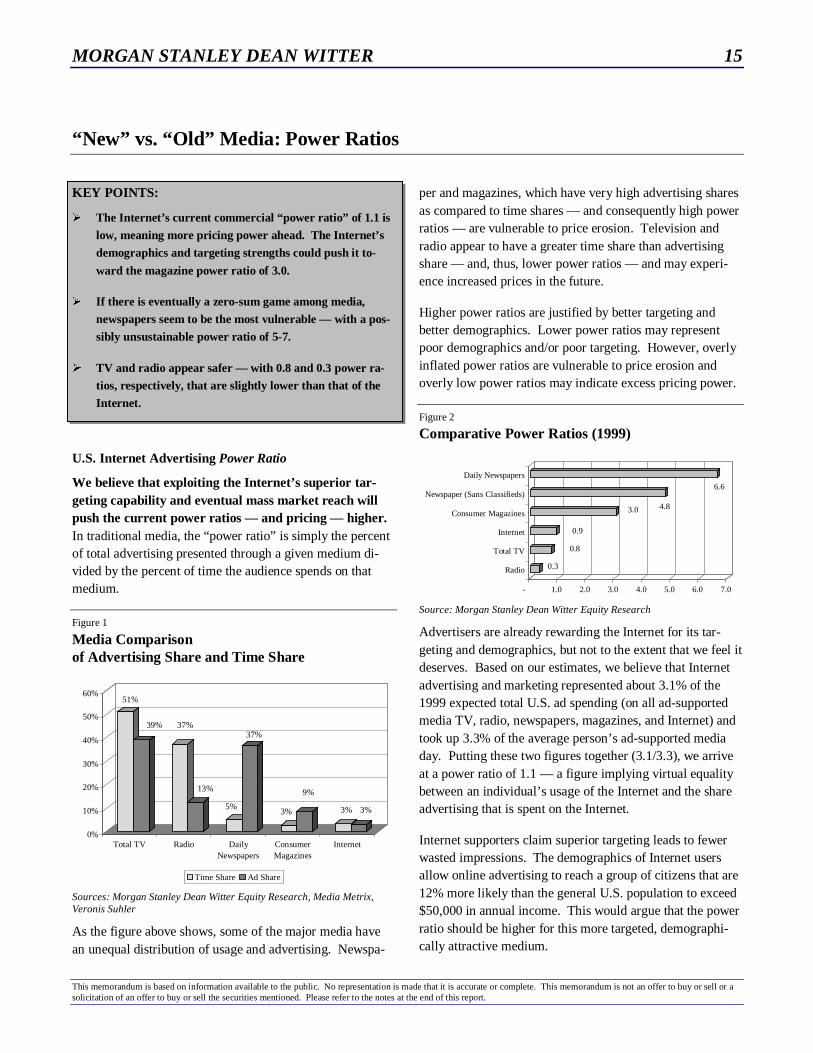
We believe that exploiting the Internet’s superior tar-geting capability and eventual mass market reach willpush the current power ratios — and pricing — higher.In traditional media, the “power ratio” is simply the percentof total advertising presented through a given medium di-vided by the percent of time the audience spends on thatmedium.
Figure 1
Media Comparisonof Advertising Share and Time Share
51%
39% 37%
13%
5%
37%
3%
9%
3% 3%
0%
10%
20%
30%
40%
50%
60%
Total TV Radio DailyNewspapers
ConsumerMagazines
Internet
Time Share Ad Share
Sources: Morgan Stanley Dean Witter Equity Research, Media Metrix,Veronis Suhler
As the figure above shows, some of the major media havean unequal distribution of usage and advertising. Newspa-
per and magazines, which have very high advertising sharesas compared to time shares — and consequently high powerratios — are vulnerable to price erosion. Television andradio appear to have a greater time share than advertisingshare — and, thus, lower power ratios — and may experi-ence increased prices in the future.
Higher power ratios are justified by better targeting andbetter demographics. Lower power ratios may representpoor demographics and/or poor targeting. However, overlyinflated power ratios are vulnerable to price erosion andoverly low power ratios may indicate excess pricing power.
Figure 2
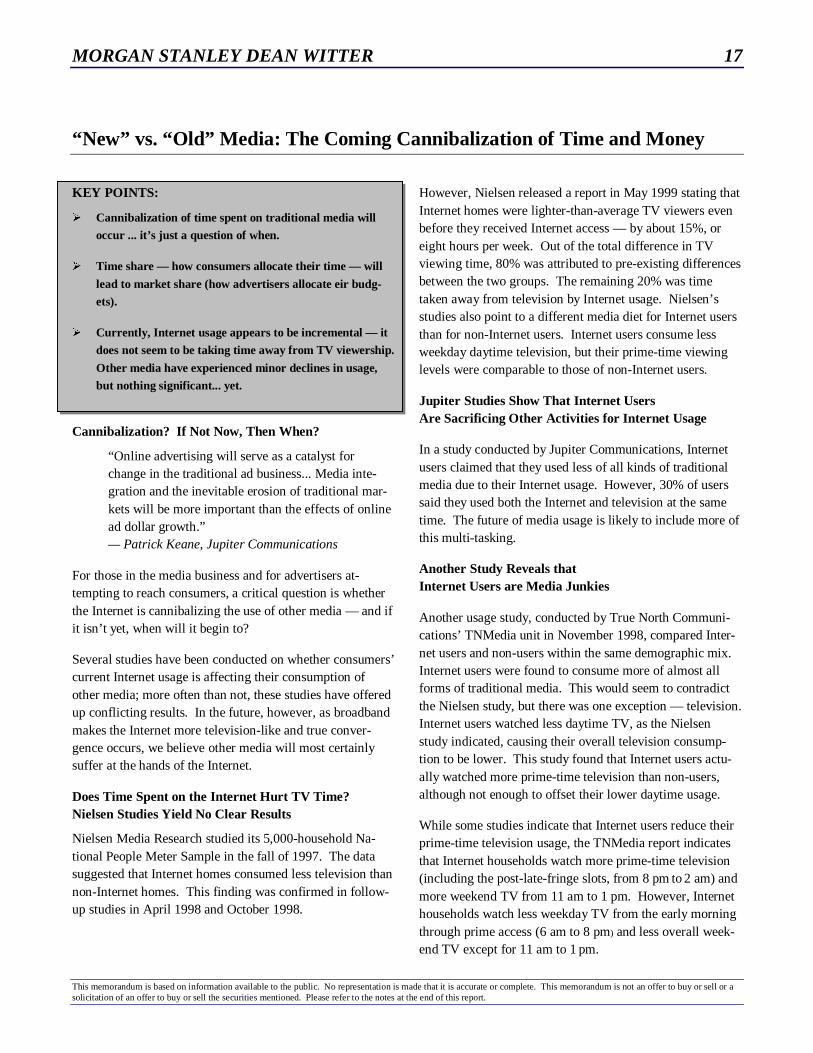
Comparative Power Ratios (1999)
0.3
0.8
0.9
3.0 4.8
6.6
- 1.0 2.0 3.0 4.0 5.0 6.0 7.0
Radio
Total TV
Internet
Consumer Magazines
Newspaper (Sans Classifieds)
Daily Newspapers
Source: Morgan Stanley Dean Witter Equity Research
Advertisers are already rewarding the Internet for its tar-geting and demographics, but not to the extent that we feel itdeserves. Based on our estimates, we believe that Internetadvertising and marketing represented about 3.1% of the1999 expected total U.S. ad spending (on all ad-supportedmedia TV, radio, newspapers, magazines, and Internet) andtook up 3.3% of the average person’s ad-supported mediaday. Putting these two figures together (3.1/3.3), we arriveat a power ratio of 1.1 — a figure implying virtual equalitybetween an individual’s usage of the Internet and the shareadvertising that is spent on the Internet.
Internet supporters claim superior targeting leads to fewerwasted impressions. The demographics of Internet usersallow online advertising to reach a group of citizens that are12% more likely than the general U.S. population to exceed$50,000 in annual income. This would argue that the powerratio should be higher for this more targeted, demographi-cally attractive medium.

16 MORGAN STANLEY DEAN WITTER
This memorandum is based on information available to the public. No representation is made that it is accurate or complete. This memorandum is not an offer to buy or sell or asolicitation of an offer to buy or sell the securities mentioned. Please refer to the notes at the end of this report.
Advertisers are already rewarding theInternet for its targeting and demo-graphics, but not to the extent that wefeel it deserves.
Unfortunately, power ratio calculations fluctuate due toa wide range of usage estimates. Between Media Metrix,Nielsen//NetRatings, and other Internet usage monitors, onecould arrive at varying levels for the power ratio of theInternet. Sites’ internal usage logs would give another set ofdata from which to calculate a power ratio.
Table 1
Power Ratios of Major U.S. Media
1998 1999 2000E 2001E 2002E 2003EBroadcast TV 1.0 1.0 1.1 1.1 1.1 1.1
Cable TV 0.4 0.4 0.4 0.4 0.4 0.4Total TV 0.8 0.8 0.8 0.7 0.7 0.7Radio 0.3 0.3 0.3 0.4 0.3 0.3Daily Newspapers 6.8 6.8 6.7 6.6 6.3 6.2Consumer Magazines 3.1 3.0 3.0 3.0 2.9 2.8Internet 0.5 0.9 1.1 1.5 1.9 2.1
Sources: Morgan Stanley Dean Witter Research and Media Metrix
MORGAN STANLEY DEAN WITTER 17
This memorandum is based on information available to the public. No representation is made that it is accurate or complete. This memorandum is not an offer to buy or sell or asolicitation of an offer to buy or sell the securities mentioned. Please refer to the notes at the end of this report.
“New” vs. “Old” Media: The Coming Cannibalization of Time and Money
KEY POINTS:
½ Cannibalization of time spent on traditional media will
occur ... it’s just a question of when.
½ Time share — how consumers allocate their time — will
lead to market share (how advertisers allocate eir budg-
ets).
½ Currently, Internet usage appears to be incremental — it
does not seem to be taking time away from TV viewership.
Other media have experienced minor declines in usage,
but nothing significant... yet.
Cannibalization? If Not Now, Then When?
“Online advertising will serve as a catalyst forchange in the traditional ad business... Media inte-gration and the inevitable erosion of traditional mar-kets will be more important than the effects of onlinead dollar growth.”— Patrick Keane, Jupiter Communications
For those in the media business and for advertisers at-tempting to reach consumers, a critical question is whetherthe Internet is cannibalizing the use of other media — and ifit isn’t yet, when will it begin to?
Several studies have been conducted on whether consumers’current Internet usage is affecting their consumption ofother media; more often than not, these studies have offeredup conflicting results. In the future, however, as broadbandmakes the Internet more television-like and true conver-gence occurs, we believe other media will most certainlysuffer at the hands of the Internet.
Does Time Spent on the Internet Hurt TV Time?Nielsen Studies Yield No Clear Results
Nielsen Media Research studied its 5,000-household Na-tional People Meter Sample in the fall of 1997. The datasuggested that Internet homes consumed less television thannon-Internet homes. This finding was confirmed in follow-up studies in April 1998 and October 1998.
However, Nielsen released a report in May 1999 stating thatInternet homes were lighter-than-average TV viewers evenbefore they received Internet access — by about 15%, oreight hours per week. Out of the total difference in TVviewing time, 80% was attributed to pre-existing differencesbetween the two groups. The remaining 20% was timetaken away from television by Internet usage. Nielsen’sstudies also point to a different media diet for Internet usersthan for non-Internet users. Internet users consume lessweekday daytime television, but their prime-time viewinglevels were comparable to those of non-Internet users.
Jupiter Studies Show That Internet UsersAre Sacrificing Other Activities for Internet Usage
In a study conducted by Jupiter Communications, Internetusers claimed that they used less of all kinds of traditionalmedia due to their Internet usage. However, 30% of userssaid they used both the Internet and television at the sametime. The future of media usage is likely to include more ofthis multi-tasking.
Another Study Reveals thatInternet Users are Media Junkies
Another usage study, conducted by True North Communi-cations’ TNMedia unit in November 1998, compared Inter-net users and non-users within the same demographic mix.Internet users were found to consume more of almost allforms of traditional media. This would seem to contradictthe Nielsen study, but there was one exception — television.Internet users watched less daytime TV, as the Nielsenstudy indicated, causing their overall television consump-tion to be lower. This study found that Internet users actu-ally watched more prime-time television than non-users,although not enough to offset their lower daytime usage.
While some studies indicate that Internet users reduce theirprime-time television usage, the TNMedia report indicatesthat Internet households watch more prime-time television(including the post-late-fringe slots, from 8 pm to 2 am) andmore weekend TV from 11 am to 1 pm. However, Internethouseholds watch less weekday TV from the early morningthrough prime access (6 am to 8 pm) and less overall week-end TV except for 11 am to 1 pm.

18 MORGAN STANLEY DEAN WITTER
This memorandum is based on information available to the public. No representation is made that it is accurate or complete. This memorandum is not an offer to buy or sell or asolicitation of an offer to buy or sell the securities mentioned. Please refer to the notes at the end of this report.
Figure 3
% of Internet Users Who Claim to Use Less ofTraditional Media as a Result of Their Web Use
42%
18%
17%
10%
0% 10% 20% 30% 40% 50%
Television
Magazines
Newspapers
Radio
Source: Jupiter Communications
The “cold” war of peaceful coexistencein Media Land will come to an end inthe near future.One would expect Internet (and generally increased media)consumption to hurt other activities. Below is a list of ac-tivities that consumers say have been most affected by theirInternet use, according to a study by Yahoo!
Media Consumption (and Advertising Spending)Will Soon Become a Zero-Sum Game
The “cold” war of peaceful coexistence in Media Land willcome to an end in the near future. It is our expectation thatInternet usage will start to gain at the expense of traditionalmedia and that advertising spending will follow. ForresterResearch concurs, predicting that by 2004, roughly half ofall Internet ad spending will come from the pockets of tra-ditional media.
Newspapers have probably the most to lose as a result ofincreased Internet usage and ad spending. The highpower ratio of newspapers makes us worry that time spentwith newspapers is not high enough to justify the currentlevel of ad spending on newspapers (see earlier chapter forpower ratio details). Of course, this high power ratio hasexisted for some time, so it is not clear what “straw” wouldbreak the camel’s back.
Figure 4
Percent of Internet Users Who Do Lessof Other Things as a Result of Their Web Use
78%24%
17%
17%
12%
5%
0% 10% 20% 30% 40% 50% 60% 70% 80%
Television
Sleep
Chores
Magazines
Newspapers
Exercise
Source: Yahoo!
Newspaper revenues and earnings have never been higher— thanks in part to dot-com advertising. But, as dot-comsmove more of their advertising online and as usage / pene-tration of the Web increases, newspapers’ ad pricing islikely to be hurt. Classifieds, in particular, appear vulner-able to Internet cannibalization.
Magazines are slightly more targeted than newspapers,and thus, should be less affected. We expect magazines tobe cannibalized for the same reasons as newspapers (an un-sustainably high power ratio), but to a lesser extent.
Television is in a unique position relative to the Internet.For now, television occupies a special position in most peo-ple’s homes (where the fireplace used to be), and its overallpower ratio is similar to the Internet’s. While televisionusage has been minimally impacted by the Internet to date,the future is certain to be different. Traditional (i.e., pas-sive) television is certain to see at least a small shift in usageand ad dollars toward an interactive alternative. The ques-tion is, will this be interactive television, the Internet, or acombination thereof.
We are already seeing the beginnings of this interactivity incompanies like Wink. Wink allows broadcasters to addinteractivity to their programming and commercials. Winkusers see a small “i” in the corner of their screens when aprogram or commercial contains interactive features. Theymay then access this functionality to learn more about aproduct, statistics on players (Monday Night Football), orparticipate in game shows (Wheel of Fortune and Jeopardy,currently) via multiple choice menus.
MORGAN STANLEY DEAN WITTER 19
This memorandum is based on information available to the public. No representation is made that it is accurate or complete. This memorandum is not an offer to buy or sell or asolicitation of an offer to buy or sell the securities mentioned. Please refer to the notes at the end of this report.
While Wink is only a baby step into interactivity, muchlarger steps are sure to follow given the range of new tech-nologies just coming to market at TiVo, Replay, WebTV,and OpenTV, among others. We expect television of thissort to eventually dominate the television advertising land-scape. However, television will be held to higher levels of
performance in the future due to its interactivity. For in-stance, advertisers will be able to calculate the click-throughrate on their television advertising. Instead of simplychalking up massive television budgets to branding, adver-tisers will be forced to defend their television budgets by theperformance achieved.
Figure 5
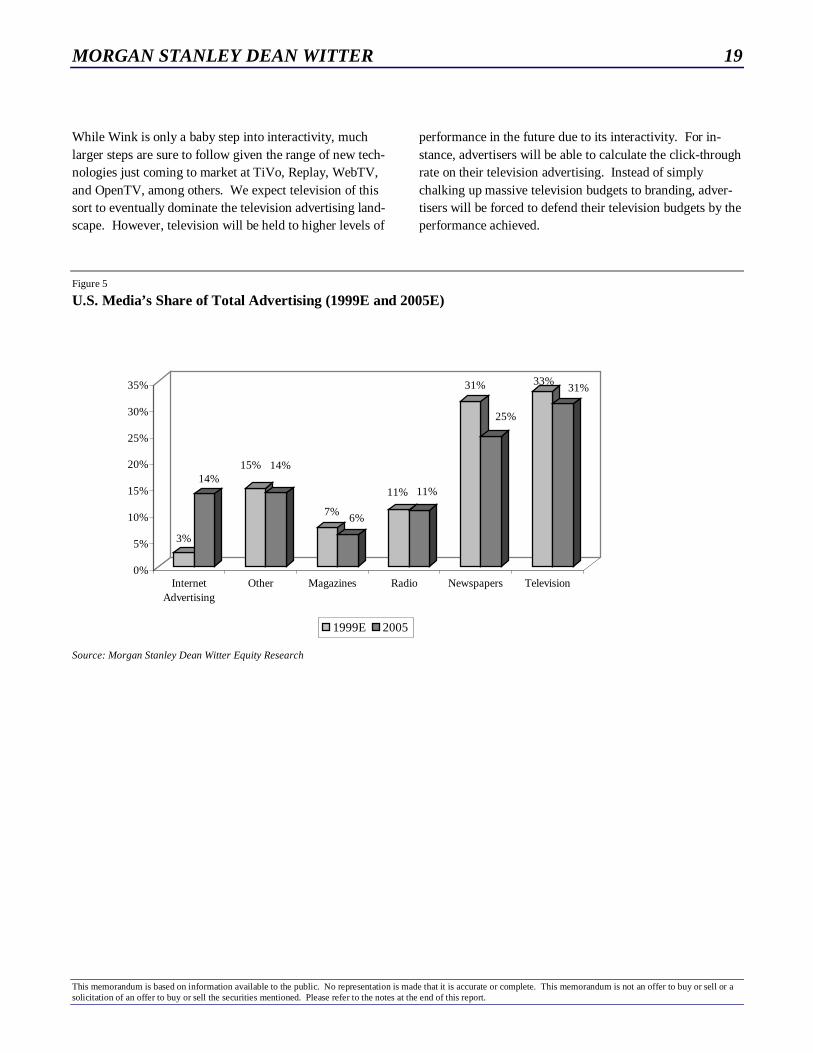
U.S. Media’s Share of Total Advertising (1999E and 2005E)
3%
14%15% 14%
7%6%
11% 11%
31%
25%
33%31%
0%
5%
10%
15%
20%
25%
30%
35%
InternetAdvertising
Other Magazines Radio Newspapers Television
1999E 2005
Source: Morgan Stanley Dean Witter Equity Research

20 MORGAN STANLEY DEAN WITTER
This memorandum is based on information available to the public. No representation is made that it is accurate or complete. This memorandum is not an offer to buy or sell or asolicitation of an offer to buy or sell the securities mentioned. Please refer to the notes at the end of this report.
“New” vs. “Old”: Performance and Pricing
KEY POINTS:
½ Using the effective CPM pricing of about $4, Internet ad-
vertising compares favorably with traditional media. Its
average CPM is below that of all other media. We expect
that eventually its superior targeting ability may lead to
premium pricing.
½ Banners and direct e-mail offer attractive cost-per-order
performance when compared to the direct marketing per-
formance of traditional media — the problem is that tra-
ditional media has never been measured as closely.
½ The click-through rate is declining, but so is its impor-
tance. ROI-driven cost-per-action (i.e., order, registra-
tion) metrics are driving pricing and budget allocations.
½ Recently, all traditional advertising revenues have been
strong due to pricing growth. From 1993 to 1999 media
inflation was 6% per year. Recently, price increases have
ranged from 10-20%. New dot-com brands and pharma-
ceuticals have helped drive demand and pricing across-
the-board — a trend we believe will boost effective Inter-
net CPMs, as well.
The debate as to how successful Internet advertising reallyis consists of two separate issues: branding vs. selling andimpressions vs. performance.
Is Internet advertising capable of branding? Yes
So are coupons and other promotional efforts. However,while companies such as Dynamic Logic claim to be able tomeasure the Internet’s branding ability, the Web’s effect onbranding is still largely shrouded in mystery. Therefore,more quantifiable measuring sticks are used for Internetadvertising campaigns. The most popular is the click-through rate (CTR). It is ironic, however, that in the offlineworld a low response rate — the equivalent of a CTR — ischalked up to branding, but in the Web advertising world,low CTRs are enough for a campaign to be considered afailure.
Of course, it is unclear how many clicks add up to brandawareness or how many clicks add up to a sale. There-fore, the cost-per-1,000 impressions (CPM) or clicks areconsidered less important than the cost-per-order. This is adirect marketing validation that acts as a floor to supportcertain pricing levels.
Table 2
Direct Marketing Campaign Comparisons
Web Banners(list price)
Web Banners(average
price)Prime Time
TVDay Time
TVDirectE-Mail
SoloDirect Mail
SharedDirect Mail
Impressions 1,000 1,000 1,000 1,000 1,000 1,000 1,000
CPM (Cost per 1,000 Impressions) $292 $42 $161 $51 $203 $9344 $405
Request More Info/Click Through Rate 0.40%-11%7 0.40%-11%7 0.73%6 0.73%6 NA NA 55.3%8
Lookers 4-110 4-110 7 7 NA NA 553
Cost per Lead/Look $0.26-7.25 $0.04-1.00 $2.20 $0.68 NA NA $0.07
Look-to-Book Ratio (% of lookers who buy) 10.00%9 10.00%9 NA NA NA NA 6.33%10
Buyers Booked 0.4-11.0 0.4-11.0 NA NA 30-100 10-120 30-40
Order Response Rate of All Impressions 0.04-1.1%10 0.04-1.1%10 NA NA 3-10%11 1-12%12 3-4%
Cost per Order $2.64-72.50 $0.40-10.40 NA NA $0.20-0.67 $7.78-93.40 $1.00-1.33
Sources: 1 Media Dynamics; 2 Morgan Stanley Equity Research Estimate for average effective CPM is $4; list price of portal is about $29 according toWebConnect; 3 Morgan Stanley Equity Research Estimate, based on conversations with industry executives ; 4 DMA Statistical Fact Book 1998 pg. 57,“Sample Working Budget”; 5 Based on ADVO data; 6 Based on assumptions generated by conversations with Wink Communications management; moredetail to follow based on their experience ; 7 Click-Through-Rate from Nielsen//NetRatings for average top site and the top site ; 8 DMA Statistical FactBook 1998 pg. 48, citing USPS Household Diary Study from 1996 “Consumer Treatment of Third-Class Mail” for merchants; 9 Jupiter Consumer InternetEconomy, 1998 page 102 ; 10 Calculated based on other inputs; 11 Digital Impact; 12 Generally accepted direct mail response rate is 1%, but “will respond”rates for commercial sales notes in DMA Statistical Fact Book citing USPS Household Diary ranges from 8-18% and averages at 12%

MORGAN STANLEY DEAN WITTER 21
This memorandum is based on information available to the public. No representation is made that it is accurate or complete. This memorandum is not an offer to buy or sell or asolicitation of an offer to buy or sell the securities mentioned. Please refer to the notes at the end of this report.
Nearly 50% of Internet users claim never to look atbanners. Further, most banners do not get clicked on for“more information,” and clicks convert into orders at only a2–10% look-to-book ratio. This would seem worrisome,until one becomes aware of the comparable effectivenessmeasures for other media, and the information to do thesecomparisons is hard to come by.
The Web’s effect on branding is stilllargely shrouded in mystery.
Banner Successes
Internet advertising has many advantages over offline me-dia. Several are detailed below:
• Internet ads are relatively simple to create. Even rich-media banner ads are still simple for most programmers tocreate. Yet even the most simple banner ad is a tool forcreating brand awareness.
• Internet ads are relatively inexpensive to develop. Notonly are banners much less expensive to create than televi-sion or radio ads, but they even put direct mail to shame;and then there is the low cost of e-mail compared with tra-ditional mail. Jupiter Communications estimates that a di-rect marketing campaign on e-mail costs about $0.01–0.25per piece, versus $1.00–2.00 using traditional mail.
• Internet advertising is easy to update as conditionschange. Sponsorships are probably the most difficult typeof Internet ad to update, but even they can be modifiedmuch more simply than offline ads.
• Internet advertising is easier and faster to test. Awide variety of creative content can be tested in matchedcell tests so as to come up with the most effective approachas quickly as possible.
• Internet advertising promises real-time interactionwith consumers. Not only are customers developing brandawareness from Internet advertising, but they are also ableto link directly to the seller’s Web site and purchase a prod-uct. Internet advertising can compress the sales cycle intoone interaction with the customer (information gathering,further research, company contact, and sale). No other me-dium can boast this kind of customer interaction.
Payment for Performance and Impressions
Advertisers on the Internet are pushing for more quanti-fiable results. Cost-per-click, cost-per-lead, and cost-per-sale are different ways of quantifying results, and advertis-ers are pushing Web publishers to use more performance-based pricing.
Web publishers retort that they don’t control the creativecontent, nor what happens once the consumer clicks on thead and is taken to the advertiser’s site. For this reason, Webpublishers prefer to be paid on the basis of impressions (costper thousand impressions, or CPM, is the most commonsuch technique). Even if consumers don’t click on an ad,publishers argue, branding is occurring and the site shouldbe compensated.
According to the Internet Advertising Bureau, the mostpopular form of Web ad buying in 1998 was priced using ahybrid of impression and performance metrics, accountingfor about 56% of the total market. Pure impression-based(CPM) buying came in at about 40% of the total in 1998,with the remaining 4% based on some measure of perform-ance. Performance-based advertising rose to 7% of totalInternet advertising in 2Q99, with impression-based adver-tising rising to 41% and hybrid falling to 52%.
Figure 6
Pricing Models Used (3Q99)
Performance-Based
8%
Impression-Based37%
Hybrid55%
Source: Internet Advertising Bureau
Going forward, we expect to see more pay-for-performance contracts. Advertisers’ push for more ac-countability will be the major reason for this shift. How-ever, we don’t believe that pure pay-for-performance con-tracts will ever completely triumph over impression-basedcontracts, largely because performance measurement doesnot take branding into account. It is our belief that brandingwill play a larger role on the Internet going forward.

22 MORGAN STANLEY DEAN WITTER
This memorandum is based on information available to the public. No representation is made that it is accurate or complete. This memorandum is not an offer to buy or sell or asolicitation of an offer to buy or sell the securities mentioned. Please refer to the notes at the end of this report.
Impression Measurement:What Are the “M”s in CPMs?
Currently no clearly defined consensus exists on whatshould be measured online. In the beginning (all four-plusyears ago) the measure most often cited was “hits.”Roughly speaking, any time a user requested data from aWeb page, a hit was recorded. This metric was soon out-moded, as several hits may be recorded each time a Webpage is seen if the user requests more than one item fromthat page or if the user repeatedly clicks on a link withoutknowing that a request has already taken hold.
“Pageviews” came next. A pageview results each time apage is viewed. This measurement was considered superiorto hits because it eliminated the double-counting of hitsnoted above. However, a single user could view a pagenumerous times with little incremental benefit for the ad-vertiser, and the “Back” function available on browsersmade pageviews a particularly weak means of measuringtraffic. As a result, pageviews were soon out of fashion,replaced by “visitors.”
“Visitors” is the number of people who visited a site ratherthan the number of pages seen. And “unique visitors” (sim-ply a nomenclature change) soon replaced “visitors” as thestandard metric for measuring the attractiveness of a Website.
Performance Measurement
“One of the bedrock problems is a lack of trustableresearch. There’s no bedrock yet in this medium, likein television, where there’s been 40 years of researchto show what a 30-second spot can do.”— Rich Glassberg, Vice Chairman, Internet Adver-tising Bureau
The Internet community has grappled with the above met-rics to determine the merit of Web sites, but advertisersmust go even further to attempt to gauge how successfultheir campaign is. By itself, a pageview or a visitor does notnecessarily mean that an ad has been viewed.
Advertisers are demanding more information on the successof their Internet campaigns. For that reason, they haveshifted toward a return-on-investment (ROI) measurementsystem. Some of the current Internet advertising metricsbeing used today are:
• Click-Throughs: The number of times that consumersclick on an advertisement. The Cost-per-Click is theamount spent by the advertiser to generate one click-through. The Click-Through Rate (CTR) is calculated bydividing the number of click-throughs by the number ofimpressions served. This gives the rate at which consumersare clicking on an ad.
• Cost-per-Action/Lead (CPA/L): The amount spent bythe advertiser to generate one lead, one desired action, orsimply information on one likely customer. This informa-tion is sometimes obtained through a contest or a literaturerequest form. The advertiser pays an amount based uponthe number of individuals who enter the contest or fill outthe form.
• Cost-per-Sale (CPS): The amount spent by the adver-tiser to generate one sale. Advertisers pay an amount basedupon how many consumers actually purchase something.
The Falling Click-Through Rate
As happened to the catalog industry before it, the Inter-net advertising market is suffering a severe decline inresponsiveness. The first banners were displayed in 1994,and received a click-through rate of about 10%. From there,it has been all downhill; CTRs fell to 2–3% in 1996–97.1998 saw CTRs reach 1%, and as of today they have falleneven further; we estimate today’s CTRs to be in the 0.4%area. However, the best banners still garner CTRs over10%, sometimes reaching over 15%. Meanwhile, we stilldo not have an effective measure of “click-through rates”for other media, although companies like Wink Communi-cations will give some insight into the CTR for televisioncommercials soon.
The reasons for the falling click-through rates are relativelysimple. Internet users are becoming more discriminating.They are also generally not using the Internet as entertain-ment (like most TV, the easiest comparable), but rather as atool to gather information, communicate, etc. Taking timeout from whatever task is being pursued to click on an ad isthe exception, not part of the typical user’s game plan. Con-sumers who were once “surfers” are evolving into “search-ers.” The newness of the Web has also worn off, causingconsumers to be less fascinated by advertising.

MORGAN STANLEY DEAN WITTER 23
This memorandum is based on information available to the public. No representation is made that it is accurate or complete. This memorandum is not an offer to buy or sell or asolicitation of an offer to buy or sell the securities mentioned. Please refer to the notes at the end of this report.
“Nobody surfs the Web anymore ... now it’s utility-oriented.”— G. M. O’Connel, CEO, Modem.Media
Table 3
New Internet Users’Likelihood of Clicking on Banner Ads
Unlikely Likely Extremely Likely
Reading News 55% 39% 6%Researching Products 35% 59% 9%Shopping for Products 29% 65% 6%Using a Search Engine 13% 81% 6%Source: Forrester Research
Television is the most similar media in appearance to theInternet, and as such, comparisons are inevitable. However,if one compares the creativity, action, audio, and excitementof a television ad with those of an Internet ad, there is nocomparison. Current Internet ads may be boring to some,but the emergence of more active video and sound willmake them more appealing (and interruptive?).
“The smart marketers are really not paying much at-tention to click-throughs anymore ... CTRs are a mis-application of the accountability of the Net. Just be-cause you can count click-throughs doesn’t mean it’sthe right thing to count.”— Rich LeFurgy, Chairman, IAB
Several studies have shown that a high click-through rate isnot necessarily a sign of a high conversion (or sales) ratio.In fact, the correlation between click-throughs and sales isloose at best. AdKnowledge reports that the campaignsgenerating the highest click-throughs generate the mostconversions only 14.3% of the time. That means that 85.7%of the time, the campaign generating the highest CTR gen-erated a lower conversion rate than other campaigns withlower CTRs. Clearly, click-through rates are a poor meas-ure of sales and thus performance.
Studies have shown that a high click-through rate is not necessarily a signof a high conversion or sales ratio.
CPMs: The Rate Card
Impressions, which are so important in the offline world(particularly when used in calculating the CPM), are
difficult to quantify on the Web. Most measurementcompanies don’t even agree on what constitutes an impres-sion. Some calculate an impression as the number of timesan ad is requested. Others calculate an impression as thenumber of times a page with an ad is requested. Still othersmeasure an impression as the number of times that 100% ofan ad graphic is downloaded. Obviously, this results inhuge disparities. For our purposes, we will rely on the mostcommonly applied measure of impressions (and the one thatwe feel is most appropriate in measuring impressions): thenumber of times an ad is served (not necessarily fullyloaded) to a unique visitor to a site.
Figure 7
Rate Card CPMs for Web Site Categories in 1999
$21
$23
$27
$35
$37
$38
$38
$43
$45
$45
$62
$90
$42
$0 $20 $40 $60 $80 $100
Search Engines
Gaming
Entertainment
Sports
Children
News/Information
Travel
Download/Shareware
Financial
Women
Business Execs
Computing
Total Internet Average
Source: WebConnect
Estimates of list price CPMs on the Internet range fromunder $1 — for an untargeted site and an untargeted ad— to as much as $100 for a desirable site and a targetedad. As nearly all Web advertising is priced in some way offof CPMs, it is important to understand the drivers of CPMs.Basically, supply and demand govern CPMs just like every-thing else in the world. The greater the supply of ad inven-tory on the Web, the lower the CPM will be, and vice versa.Since the supply of advertising space available on the Inter-net appears to have nowhere to go but up, it would seem thatCPMs are likely to trend downward.
However, we believe a better understanding of the brandingbenefits of the Internet — combined with better under-standing of the comparable click-through-rates of traditionalmedia — will lead to increased demand for Internet adver-tising.

24 MORGAN STANLEY DEAN WITTER
This memorandum is based on information available to the public. No representation is made that it is accurate or complete. This memorandum is not an offer to buy or sell or asolicitation of an offer to buy or sell the securities mentioned. Please refer to the notes at the end of this report.
“Rates are plummeting ... for some of the most suc-cessful sites, their models are in jeopardy ... if theInternet follows the life cycle of the traditional me-dia, there will be a shakeout.”— Greg Smith, Director of Strategic Planning,Darwin Digital/Saatchi & Saatchi
Content targeting is one means of increasing a site’s at-tractiveness to an advertiser. The more targeted a site is,the more receptive an audience the advertiser can hope toreach. Thus, the advertiser will be willing to pay more forthis space.
Table 4
Top 15 “Sticky” Properties of March— Ranked by Millions of Pageviews
Property- Home Pageviews Property- Work Pageviews
1 Yahoo! 5,647 Yahoo! 4,4042 MSN 3,281 eBay 2,8093 eBay 2,885 MSN 2,4564 AOL Websites 2,157 AOL Websites 1,4325 Excite@Home 1,047 Excite@Home 7166 Lycos Network 1,014 GO Network 5617 GO Network 751 iWon.com Inc. 5568 iWon.com Inc. 528 AltaVista 4929 AltaVista 449 Lycos Network 49010 Uproar 449 E Trade 40611 E Trade 308 Microsoft 30212 NBC Internet 303 Time Warner 26213 Amazon 281 Amazon 24314 Microsoft 280 Intuit 23115 Time Warner 252 NBC Internet 189Source: Nielsen//NetRatings
Just as a site can be content-targeted, a user can be tar-geted. As advertisers are better able to target an ad at aparticular user, CPMs will rise. The ability to target ads,regardless of what site a user is currently visiting, is thebackbone of several Internet advertisers’ strategies. Theseadvertisers foresee a day when a user that has visited a Gen-eral Motors Web site to view a Suburban two days ago willbe served an ad for the GM Suburban the next time s/hegoes online.
Table 5
CPM Pricing as a Function of Targeting
Category of Site Traffic Level Demographics CPMPortal Very High Broad LowContent Provider Moderate Broad-Narrow HigherNiche Site Low Narrow HighestSource: eStats
Stickiness is very important for sites to generate higherCPMs. “Stickiness” is a measure of the degree to whichusers stay on a Web property. It may be measured in theamount of time spent on each property, the number of pagesviewed per person, or the number of times each person re-turns to the site. “Sticky” sites will receive a higher CPMthan those sites with rapid turnover. Likewise, any adver-tisement that catches the consumer’s eye, causing someoneto take a second look, will demand a higher CPM.
Table 6
Top 15 “Sticky” Properties of March— Ranked by Minutes per User per Month
Property- Home Minutes Property- Work Minutes
1 eBay 133.97 eBay 224.672 E Trade 79.05 E Trade 110.633 Yahoo! 66.03 Yahoo! 109.174 iWon.com Inc. 57.10 MSN 87.805 MSN 56.42 iWon.com Inc. 85.926 Uproar 36.45 Intuit 62.277 MyFamily.com 35.95 AOL Websites 47.828 Intuit 33.23 CNN 37.109 Monster Board 30.82 GO Network 37.0310 Homestore 29.93 AltaVista 37.0011 AOL Websites 28.95 Excite@Home 35.7012 Women.com
k27.13 USATODAY.co 32.37
13 Excite@Home 27.08 Monster Board 32.0714 GO Network 24.70 Snowball 30.5215 iwin.com 23.93 iwin.com 29.98Source: Nielsen//NetRatings
CPMs: The Effective Price
A better measure of the cost to reach consumers is theeffective CPM. Typically, the standard CPM is based onthe prices quoted on the Web publisher’s rate card. How-ever, these prices rarely reflect reality. In fact, rate cardprices are typically just the opening point for continueddownward bargaining between the advertiser and Web pub-lisher. The effective CPM is closer to reality, since it iscalculated as the total actual advertising revenue (reflectingdiscounting and bartering) divided by thousand ads served.
We estimate that the average effective CPM today isabout $4. We expect this to increase in the future due toseveral factors. The first is a continuing consolidation ofsites under large portals and into networks of sites. Thisconsolidation makes individual sites more attractive to ad-vertisers. A second factor is the shift of greater amounts ofadvertising dollars online. As the Internet establishes itselfas a mainstream medium, more advertisers will devote

MORGAN STANLEY DEAN WITTER 25
This memorandum is based on information available to the public. No representation is made that it is accurate or complete. This memorandum is not an offer to buy or sell or asolicitation of an offer to buy or sell the securities mentioned. Please refer to the notes at the end of this report.
greater shares of their advertising budgets to it. Yahoo!recently pushed through a list price increase that has beenaccepted by the market. Yahoo!’s increase is a list priceincrease, but we would expect that the effective price willalso increase.
Table 7
Top 15 “Sticky” Properties of March— Ranked by Visits per User per Month
Property- Home Visits Property- Work Visits
1 iWon.com Inc. 10.09 iWon.com Inc. 15.652 eBay 9.35 eBay 13.933 MSN 8.51 Yahoo! 13.914 Prodigy 8.47 MSN 12.825 Yahoo! 8.37 AOL Websites 11.706 AOL Websites 7.00 E Trade 10.407 E Trade 6.92 CNN 6.338 Gator.com 6.38 Time Warner 5.809 EarthLink 5.42 AltaVista 5.7910 PlasmaNet Inc. 4.39 GO Network 5.7311 Porncity 4.24 EarthLink 5.7212 Excite@Home 4.16 Intuit 5.6813 Gamma Ent. 3.92 Excite@Home 5.5914 AT&T 3.87 PlasmaNet Inc. 5.5315 AltaVista 3.78 Washington Post 5.52Source: Nielsen//NetRatings
Table 8
Yahoo!’s Public Gross Rate Card— Non-Demographically Targeted
Run of Property 1999 Run of Property 2000
Group A: $9.00–30.00 Group A: $20.50–31.00 Group B: $28.00–58.00 Group B: $29.00–61.50 Group C: $45.00–85.00 Group C: $47.50–89.00Source: Yahoo!
Although difficult in practice, advertisers must comparethe effectiveness and cost of their online advertising totheir offline cost and effectiveness. The effective CPM iscurrently the only statistic on which comparisons can realis-tically be based, and television is the medium that is usuallycompared with the Internet.
We willingly concede that CPMs may not turn out to be thebest measure of ad performance on the Web; likewise, tele-vision may not turn out to be the best comparison, but bothseem to be en vogue at present.
Figure 8
Inter-Media CPM Comparisons
$4
$5
$6
$6 $16
$19
$0 $5 $10 $15 $20
Internet - Effective CPM
Day Time Broadcast TV
Magazines
Radio
Prime-Time Broadcast TV
Daily Newspapers
Source: Morgan Stanley Dean Witter Research
We can compare the Internet to more traditional forms ofmedia advertising in two ways: based upon “pageviews”and based on 30 seconds of exposure. (In television, animpression is considered 30 seconds of exposure.) Based onpageviews, the Internet’s effective CPM is cheaper thanthose for all other media except day-time broadcast televi-sion.
Table 9
Inter-Media CPM Comparisons
1996 1997 1998 1999EPer 1,000 Pageviews Effective Internet CPM $2.35 $3.04 $3.23 $3.90Per 1,000: 30 second "spots" Effective Internet CPM $0.98 $1.88 $2.68 $3.91
Pricing Comparison with Other Media PrimeTime Broadcast TV CPM $14.90 $16.18 $16.33 $19.13
Internet CPM (pageviews) % index 16% 19% 20% 20% Internet CPM ( :30 spots) % index 7% 12% 16% 20% Day Time Broadcast TV CPM $4.15 $5.10 $5.30 $5.45 Internet CPM (pageviews) % index 57% 60% 61% 71% Internet CPM ( :30 spots) % index 24% 37% 50% 72% PrimeTime Cable Net TV CPM $8.45 $8.20 $8.80 $9.75 Internet CPM (pageviews) % index 28% 37% 37% 40%
Internet CPM ( :30 spots) % index 12% 23% 30% 40% Radio Spot CPM $6.50 $6.78 $7.25 $7.78 Internet CPM (pageviews) % index 36% 45% 45% 50% Internet CPM ( :30 spots) % index 15% 28% 37% 50% Magazines Newsweeklies CPM $8.15 $8.35 $8.75 $9.35 Internet CPM (pageviews) % index 29% 36% 37% 42%
Internet CPM ( :30 spots) % index 12% 22% 31% 42% Daily Newspapers CPM $18.20 $17.85 $18.75 $17.35 Internet CPM (pageviews) % index 13% 17% 17% 22% Internet CPM ( :30 spots) % index 5% 11% 14% 23%
Source: Morgan Stanley Dean Witter Research, Media Dynamics
Receptivity to Internet Advertising
Internet advertising cannot help but be compared with tradi-tional offline advertising. The primary motivation of peopleusing the media must be considered, however. Radio, tele-vision, even outdoor advertising is presented to a passiveaudience.
26 MORGAN STANLEY DEAN WITTER
This memorandum is based on information available to the public. No representation is made that it is accurate or complete. This memorandum is not an offer to buy or sell or asolicitation of an offer to buy or sell the securities mentioned. Please refer to the notes at the end of this report.
Television and radio are intended to entertain consumers. Incontrast, the Internet is used for a mixture of business andpersonal communication, research, and entertainment pur-poses. This will likely impact how receptive consumers areto Internet advertising.
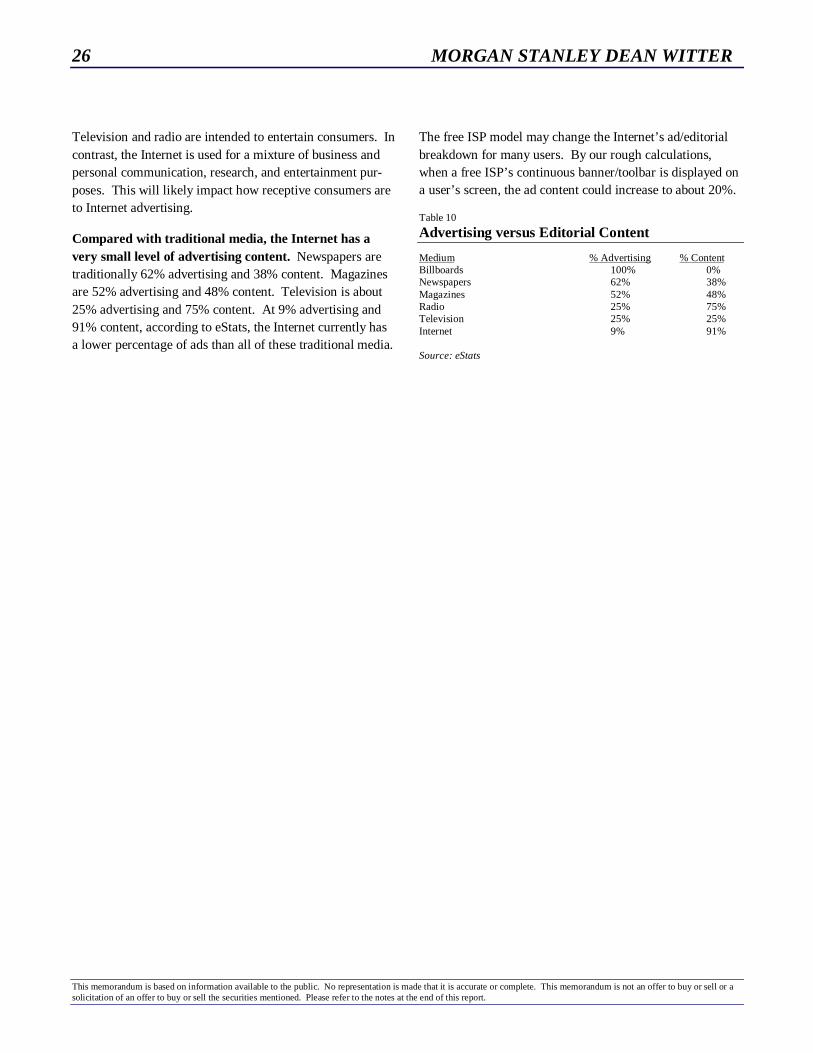
Compared with traditional media, the Internet has avery small level of advertising content. Newspapers aretraditionally 62% advertising and 38% content. Magazinesare 52% advertising and 48% content. Television is about25% advertising and 75% content. At 9% advertising and91% content, according to eStats, the Internet currently hasa lower percentage of ads than all of these traditional media.
The free ISP model may change the Internet’s ad/editorialbreakdown for many users. By our rough calculations,when a free ISP’s continuous banner/toolbar is displayed ona user’s screen, the ad content could increase to about 20%.
Table 10
Advertising versus Editorial Content
Medium % Advertising % ContentBillboards 100% 0%Newspapers 62% 38%Magazines 52% 48%Radio 25% 75%Television 25% 25%Internet 9% 91%
Source: eStats

MORGAN STANLEY DEAN WITTER 27
This memorandum is based on information available to the public. No representation is made that it is accurate or complete. This memorandum is not an offer to buy or sell or asolicitation of an offer to buy or sell the securities mentioned. Please refer to the notes at the end of this report.
“New” Vs. “Old” Media: A Big Market from Which to Gain Share
KEY POINTS:
½ For now, Internet marketing services are but a tiny por-
tion of a huge market. Investors may not realize that our
estimate for the global marketing budget in 2000 is about
$678 billion.
½ The Internet accounted for about 3% of U.S. advertising
in 1999. By 2005, we expect this to grow to 14%.
½ When considering the entire U.S. marketing budget of
$390 billion (advertising plus marketing services), the
Internet accounted for only 1% in 1999. We expect this
number to quadruple by 2005.
Are We Underestimating the Sizeof E-Advertising and Direct E-Marketing?
We believe that investor perception of the magnitude ofthe opportunity may be too small. For example, in theU.S., traditional advertising spending is expected to havebeen $151 billion in 1999, and Internet advertising is ex-pected to be $4.0 billion, or 3% of the total. We believe thisnumber could reach 14% in 2005 — larger than radio ad-vertising.
But the addressable market is even larger. We estimatethat the total U.S. marketing budget (advertising plus mar-keting services) to be $389 billion in 1999, only 1% ofwhich is e-advertising and direct e-marketing. We believeInternet marketing could reach 6% of this bigger number by2005.
Figure 9
Internet as a Portion of Total Advertising (1999)
Other Media Advertising
97%
Internet3%
$4.0 of $151 Billion
Source: Morgan Stanley Dean Witter Research
Figure 10
The E-Ad and E-DM as a %of Total Marketing Budget (1999)
Internet1%
Other Media Advertising and
Marketing Services
99%
$4 of $389 Billion
Source: Morgan Stanley Dean Witter Research
Figure 11
Internet as a Portion of Total Advertising (2005E)
Internet14%
Other Media Advertising
86%
$32 of $233 Billion
Source: Morgan Stanley Dean Witter Research
Figure 12
E-Ad and E-DM as % ofTotal Marketing Services (2005E)
Other Media Advertising and
Marketing Services
95%
Internet5%
$35 of $591 Billion
Source: Morgan Stanley Dean Witter Research

28 MORGAN STANLEY DEAN WITTER
This memorandum is based on information available to the public. No representation is made that it is accurate or complete. This memorandum is not an offer to buy or sell or asolicitation of an offer to buy or sell the securities mentioned. Please refer to the notes at the end of this report.
Table 11
Internet Advertising and Direct MarketingRelative to U.S. Advertising & Marketing Services Forecast
($ millions) 1996 1997 1998 1999 2000E 2001E 2002E 2003E 2004E
Incremental Marketing Spend 20,228 26,183 25,300 26,576 31,191 29,145 33,574 34,227 34,040 Incremental E-Marketing Spend 246 542 974 2,262 2,810 4,962 7,071 6,772 4,306 Incremental E-Marketing Share 1.2% 2.1% 3.9% 8.5% 9.0% 17.0% 21.1% 19.8% 12.6%
Incremental Trad Marketing Spend 19,982 25,641 24,326 24,314 28,381 24,183 26,503 27,455 29,734 Incremental Trad Marketing Share 98.8% 97.9% 96.1% 91.5% 91.0% 83.0% 78.9% 80.2% 87.4%
Trad Marketing Spend 310,577 336,218 360,544 384,859 413,240 437,423 463,926 491,381 521,115 % growth 6.9% 8.3% 7.2% 6.7% 7.4% 5.9% 6.1% 5.9% 6.1% E-Advertising 301 843 1,800 3,982 6,600 11,100 17,600 23,700 27,200 Direct E-Marketing 0 0 17 97 289 751 1,322 1,994 2,800E-Marketing Spend 301 843 1,817 4,079 6,889 11,851 18,922 25,694 30,000 % growth 447.3% 179.9% 115.6% 124.5% 68.9% 72.0% 59.7% 35.8% 16.8%Total Marketing Spend 310,878 337,061 362,361 388,938 420,129 449,274 482,848 517,075 551,115 % growth 7.0% 8.4% 7.5% 7.3% 8.0% 6.9% 7.5% 7.1% 6.6%
E-Marketing Share of Total Marketing Spend - Total 0% 0% 1% 1% 2% 3% 4% 5% 5% E-Advertising Share 0% 0% 0% 1% 2% 2% 4% 5% 5% Direct E-Marketing Share 0% 0% 0% 0% 0% 0% 0% 0% 1%Market Share Relative to Other Sub-Categories E-Advertising Share of Advertising 0% 1% 1% 3% 4% 6% 9% 12% 13% Direct E-Marketing Share of Marketing Services 0% 0% 0% 0% 0% 0% 0% 1% 1% Direct E-Marketing Share of Direct Marketing (non-media) 0% 0% 0% 0% 0% 1% 1% 1% 2%
E = Morgan Stanley Dean Witter Research Estimates
The final chart shows the size of the global advertising andmarketing services industries by geographic location. Thepercentage make-up of this total is broken out between ad-vertising and marketing services. Obviously, the U.S. con-tinues to be the largest market by far, accounting for overhalf of all marketing. The U.S. also has the largest percent-age of marketing services, at 61%.
Figure 13
Global Advertisingand Marketing Services (2000E, $ Billions)
39%
61%
60%
40%
85%
15%
85%
15%
54%
46%
0%
20%
40%
60%
80%
100%
United States Europe Asia LatinAmerica
World
Advertising Marketing Services
$389 $146 $92 $678$33
Source: Morgan Stanley Dean Witter Research

29MORGAN STANLEY DEAN WITTER
http://www.msdw.com/
MORGAN STANLEY DEAN WITTER
msdw.com X
OKThe Online Advertising Prize Fight
Chapter 1 Chapter 2 Chapter 3 Chapter 4 Chapter 5
This memorandum is based on information available to the public. No representation is made that it is accurate or complete. This memorandum is not an offerto buy or sell or a solicitation of an offer to buy or sell the securities mentioned. Please refer to the notes at the end of this report.
Round One: What Kind of Medium Is This? (pg. 31)
In the beginning, the Internet took a content-based targeting approach mimicking traditional media�s approach,as advertisers tried to fit the Internet into existing models for magazines, cable and broadcast TV advertising.
The prevailing question was whether advertisers should narrowcast on niche sites, broadcast on searchengines, or both?
The development of portals allowed advertisers to do both narrow and broadcasting conveniently at one loca-tion. Advertising networks sprang out of a portal model as a way for unaffiliated sites to gain scale and cloutwith advertisers.
Round Two: Targeting (pg. 33)
Content targeting � as done on television � is the least valuable form of targeting for advertisers.Demographic targeting � as done in direct mail and some magazines � is more valuable.
Behavioral targeting � now possible in real-time on the Internet � is the most valuable form of targeting toadvertisers. The sources of the largest, most robust databases will likely be the winners.
Companies are now trying to marry online and offline data to better target their messages and media to �theright person, at the right place, at the right time.�
Round Three: Convergence and Scale (pg. 35)
Rich media � brought on by broadband � may lead to higher response rates, better branding capability, andmore creative possibilities. A convergence of television and the Internet, with interactive advertising, is likelyto lead to larger budget commitments.
The largest advertisers are only just beginning to enter the online fray. The new interactive media will likelylead to significant perturbations in their business models, brands, and media choices, brought about by a newunderstanding of their customers.
The future interactive agency and advertiser must be ROI-driven. To do so, they must be able to integratecampaigns, data, and technology across a wide variety of new, traditional, and converged media across geo-graphies and cultures.
The �tail may wag the dog� as information gleaned from interactive advertising will have implications forother marketing decisions on pricing, positioning, and promotion.
What Could K.O. Internet Advertising? (pg. 40)
Privacy matters, software that blocks ads and cuts out cookies, and the anti-spam culture could reduce theeffectiveness and the value of Web advertising. It would also curtail consumer convenience and reduce con-tent quality � there is no free lunch without advertising.
Net vs. Gross revenue recognition is a focus of concern. The SEC is looking into the way in which Internetad firms account for their revenues. If FASB forced those firms that are �grossing up� their revenues to dis-continue the practice, revenue multiples would be altered (which could hurt price to sales comparisons), but inmost cases the underlying business would not be afficted.

30 MORGAN STANLEY DEAN WITTER
This memorandum is based on information available to the public. No representation is made that it is accurate or complete. This memorandum is not an offer to buy or sell or asolicitation of an offer to buy or sell the securities mentioned. Please refer to the notes at the end of this report.
MORGAN STANLEY DEAN WITTER 31
This memorandum is based on information available to the public. No representation is made that it is accurate or complete. This memorandum is not an offer to buy or sell or asolicitation of an offer to buy or sell the securities mentioned. Please refer to the notes at the end of this report.
The Online Advertising Prize Fight —Round One: What Kind of Medium Is This?
KEY POINTS:
½ In the beginning, the Internet took a content-based tar-
geting approach, mimicking traditional media’s approach,
as advertisers tried to fit the Internet into existing models
for magazine, cable, and broadcast TV advertising.
½ The prevailing question was whether advertisers should
narrowcast on niche sites, broadcast on search engines, or
both?
½ The development of portals allowed advertisers to do both
narrowcasting and broadcasting conveniently at one loca-
tion. Advertising networks sprang up that resembled the
portal model as a way for unaffiliated sites to gain scale
and clout with advertisers.
Since the advent of the Web (typically dated to 1994), ad-vertisers have struggled to understand it and how they fitinto the scheme of things online. In the beginning, manyadvertisers ignored the new medium; some embraced it, butmore just scratched their heads. Today, many more adver-tisers have come to embrace the Internet, and although someare still scratching their heads, no one believes they cancontinue to ignore it.
The Internet: Cable Television?
Originally, advertisers looked at the Internet as a seriesof unrelated channels, much like cable television or maga-zines. They saw promise in Internet advertising due to itsability to reach users with specific demographic characteris-tics. Advertisements were targeted based on site content.Visitors to a pet site, for example, would receive Purina dogfood ads, while visitors to financial news sites would re-ceive E*Trade ads. This demographically targeted adver-tising followed the cable television and magazine models.
Of course, cable and magazines also get subscriptionrevenues ... and the Internet tried. Once upon a time,many subscription attempts were made. Very few remain,as hopes of e-commerce have stepped in to join advertisingas the supporting revenue for most business models. TheInternet is now more like broadcast television than cable
television in its lack of subscription revenue for program-mers.
The Internet: Broadcast Television?
The Internet soon shifted underneath advertisers. Searchengines sprang up, allowing users to better navigate theWeb. Because nearly everyone was lost in cyberspace,nearly everyone used search engines. Now, instead of fo-cusing on niche content sites, advertisers could obtain abroad reach by placing ads on search engine sites. It thusappeared that advertising on the Web would follow a modelsimilar to that of network broadcasters like ABC, CBS,NBC, and FOX. By advertising on the largest, most popularsites, advertisers could reach the broadest audience. Ya-hoo!, Excite, Lycos, Go Network, MSN, and AOL receivedthe most benefit from this concentration of advertising.
Advertisers have come to embrace theInternet, and although some are stillscratching their heads, no one believesthey can continue to ignore it.
The Internet: Broadcast and Cable?
However, the Internet is neither a cluster of cable chan-nels nor several large broadcast networks. Rather, theInternet offers advertisers the opportunity to follow bothbroadcast and cable television strategies. Advertisers cangain broad reach as well as target specific demographics.And just when advertisers started to think they had this“Internet Thing” figured out, the Web evolved, again.
Search engines became not simply directors of traffic, butalso destinations for traffic. “Portals” are distinguishedfrom search engines (although most have a search engineability) by their aggregation of content; they serve as peo-ple’s jumping off points on the Web and as their destina-tion. To become a destination, portals grouped their contentsites into channels that appeal to different groups of users.Thus, two users might both start at the Lycos portal, but

32 MORGAN STANLEY DEAN WITTER
This memorandum is based on information available to the public. No representation is made that it is accurate or complete. This memorandum is not an offer to buy or sell or asolicitation of an offer to buy or sell the securities mentioned. Please refer to the notes at the end of this report.
each would pursue a different channel of content withinLycos’ complete offering of Web properties.
Advertisers quickly discovered the advantages of the newmodel by transacting with the largest portals. In this man-ner, they could purchase broad-reaching advertising on theopening portal pages, plus specific, demographically tar-geted advertising on selected channels or sites within theportal. Because of these advantages, and because usersflocked to the aggregators for the same reasons advertisersdid, advertisers focused their spending on the largest portals.
The Internet: Networks of Networks, Networks of Sites
The largest portals serve as networks of channels onwhich advertisers display their messages. Content aggre-gators — portals — purchased niche content providers todevelop their networks of channels. This was one means for
smaller, less trafficked sites to share in the advertising of theInternet. Many of the smaller sites felt that they needed tolink up with large portals, or they would be left to fend forthemselves to secure advertising.
From this sprang the advertising network. Media sellers,such as DoubleClick, 24/7 Media, and Engage, formed net-works of sites. By forming networks that resembled thoseof the portals, the media sellers could offer something toboth advertisers and the sites in the network. Ad networksgave advertisers the ability to target broadly across all typesof sites, narrowly on channels of sites, and more specificallyon particular sites. This is called run of network, run ofchannel, and run of site advertising, respectively. The siteson the network gained most of the advantages of being partof a portal without actually joining one — access to moreadvertisers and their dollars.
MORGAN STANLEY DEAN WITTER 33
This memorandum is based on information available to the public. No representation is made that it is accurate or complete. This memorandum is not an offer to buy or sell or asolicitation of an offer to buy or sell the securities mentioned. Please refer to the notes at the end of this report.
The Online Advertising Prize Fight — Round Two: Targeting
KEY POINTS:
½ Content targeting — as done on television — is the least
valuable form of targeting for advertisers. Demographic
targeting — as done in direct mail and some magazines —
is more valuable.
½ Behavioral targeting — now possible in real-time on the
Internet — is the most valuable form of targeting to ad-
vertisers. The sources of the largest, most robust data-
bases will likely be the winners.
½ Companies are now trying to marry online and offline
data to better target their messages and media to “the
right person, at the right place, at the right time.”
Round Two of the Internet advertising battle is in the proc-ess of being played out. The key elements of this battlehave already been established, however. Targeting, target-ing, and more targeting is the key to Round Two.
Classical Targeting —Targeting via Site Content
Targeting based on the content of a television show, amagazine, or an Internet site is what we will call elementarydemographic targeting. This type of targeting has beendone for years by television (based on the likely demo-graphics of viewers of a particular show or channel), radio,magazines, and other forms of media. As such, it was alogical way for the Internet to develop; e.g., sites containingfinancial news would serve financial advertising.
Neoclassical Targeting —Demographic Targeting via Registration
Web sites soon developed an enhanced form of targeting.Rather than assuming what type of user would show up,many sites have taken the next step to actually ask usersabout their interests through the use of registration ques-tionnaires.
The information about the user is stored in the form of“cookies” that are imbedded in the browser and containelectronic codes that allow publishers to identify them.Each time a user comes back to a site on which they have
previously registered, the site immediately determines whatadvertising that user will be most receptive to based on theinitial questionnaire.
Generally, the incentive of greater access to a site’s offer-ings is the carrot that is held out to encourage users to giveup personal information in the form of a registration. Addi-tionally, sites requiring passwords often ask users for infor-mation. The added value here is that users are able to havethe site remember his/her password if they go through theregistration. Any site that conducts commerce gains infor-mation on users. Each time a user purchases something, atthe bare minimum, the site receives credit card, location,and product interest information.
The newest trend in gathering demographic information onusers is via free Internet service registration. NetZero, AltaVista, Excite, and other “Free ISPs” plan to gain all of theirrevenue from advertising (and any commerce that mightoccur on their sites). In return for receiving free Internetaccess, users are required to fill out a detailed questionnaire.This questionnaire allows advertisers to tailor their market-ing to particularly receptive users.
There are many ways of obtaining demographic infor-mation on users, but it is all still demographic. Advertis-ers are only able to use statistics to forecast what type of ada user with certain characteristics might be receptive to.The key tool for advertisers is behavioral data.
Credit card companies are the ultimategatherers of behavioral targeting in-formation.
New Age Targeting — Online Behavioral Profiling
Advertisers have known for some time that behavioraltargeting (a.k.a. profiling) is vastly superior to simpledemographic targeting. Knowledge of a consumer’s pastpurchases, interests, likes/dislikes, and behavior in generalallows an advertiser to target an ad much more effectively.
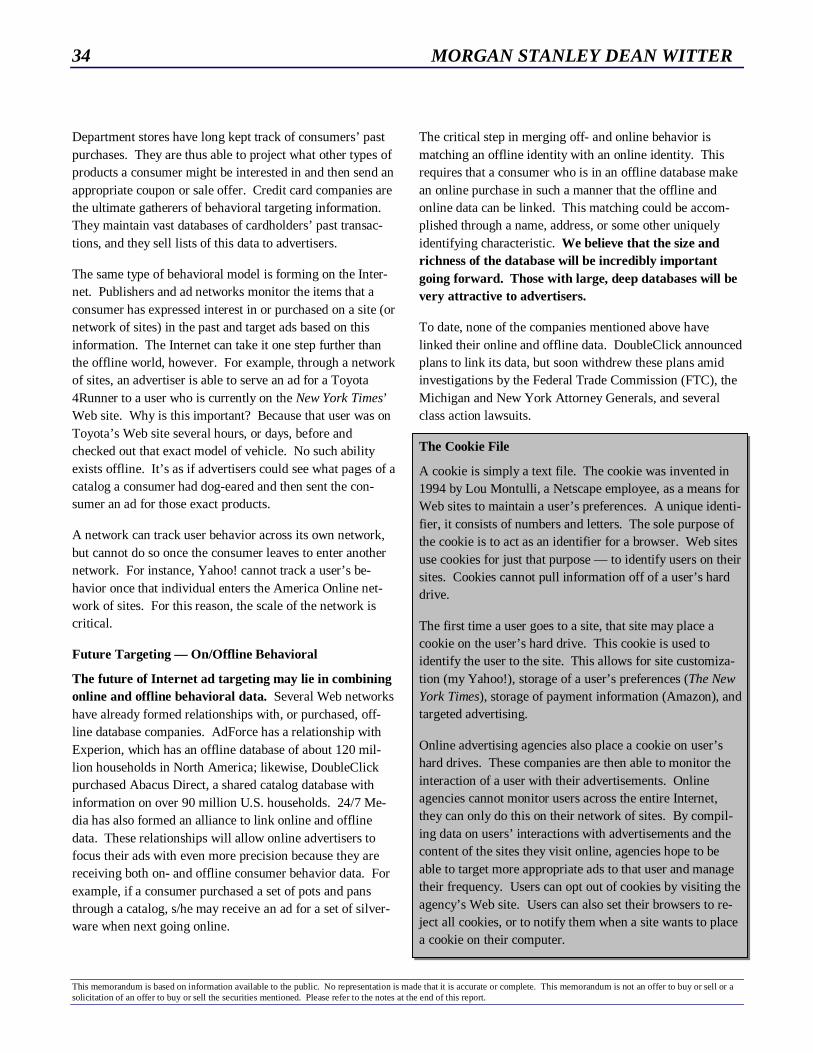
34 MORGAN STANLEY DEAN WITTER
This memorandum is based on information available to the public. No representation is made that it is accurate or complete. This memorandum is not an offer to buy or sell or asolicitation of an offer to buy or sell the securities mentioned. Please refer to the notes at the end of this report.
Department stores have long kept track of consumers’ pastpurchases. They are thus able to project what other types ofproducts a consumer might be interested in and then send anappropriate coupon or sale offer. Credit card companies arethe ultimate gatherers of behavioral targeting information.They maintain vast databases of cardholders’ past transac-tions, and they sell lists of this data to advertisers.
The same type of behavioral model is forming on the Inter-net. Publishers and ad networks monitor the items that aconsumer has expressed interest in or purchased on a site (ornetwork of sites) in the past and target ads based on thisinformation. The Internet can take it one step further thanthe offline world, however. For example, through a networkof sites, an advertiser is able to serve an ad for a Toyota4Runner to a user who is currently on the New York Times’Web site. Why is this important? Because that user was onToyota’s Web site several hours, or days, before andchecked out that exact model of vehicle. No such abilityexists offline. It’s as if advertisers could see what pages of acatalog a consumer had dog-eared and then sent the con-sumer an ad for those exact products.
A network can track user behavior across its own network,but cannot do so once the consumer leaves to enter anothernetwork. For instance, Yahoo! cannot track a user’s be-havior once that individual enters the America Online net-work of sites. For this reason, the scale of the network iscritical.
Future Targeting — On/Offline Behavioral
The future of Internet ad targeting may lie in combiningonline and offline behavioral data. Several Web networkshave already formed relationships with, or purchased, off-line database companies. AdForce has a relationship withExperion, which has an offline database of about 120 mil-lion households in North America; likewise, DoubleClickpurchased Abacus Direct, a shared catalog database withinformation on over 90 million U.S. households. 24/7 Me-dia has also formed an alliance to link online and offlinedata. These relationships will allow online advertisers tofocus their ads with even more precision because they arereceiving both on- and offline consumer behavior data. Forexample, if a consumer purchased a set of pots and pansthrough a catalog, s/he may receive an ad for a set of silver-ware when next going online.
The critical step in merging off- and online behavior ismatching an offline identity with an online identity. Thisrequires that a consumer who is in an offline database makean online purchase in such a manner that the offline andonline data can be linked. This matching could be accom-plished through a name, address, or some other uniquelyidentifying characteristic. We believe that the size andrichness of the database will be incredibly importantgoing forward. Those with large, deep databases will bevery attractive to advertisers.
To date, none of the companies mentioned above havelinked their online and offline data. DoubleClick announcedplans to link its data, but soon withdrew these plans amidinvestigations by the Federal Trade Commission (FTC), theMichigan and New York Attorney Generals, and severalclass action lawsuits.
The Cookie File
A cookie is simply a text file. The cookie was invented in1994 by Lou Montulli, a Netscape employee, as a means forWeb sites to maintain a user’s preferences. A unique identi-fier, it consists of numbers and letters. The sole purpose ofthe cookie is to act as an identifier for a browser. Web sitesuse cookies for just that purpose — to identify users on theirsites. Cookies cannot pull information off of a user’s harddrive.
The first time a user goes to a site, that site may place acookie on the user’s hard drive. This cookie is used toidentify the user to the site. This allows for site customiza-tion (my Yahoo!), storage of a user’s preferences (The NewYork Times), storage of payment information (Amazon), andtargeted advertising.
Online advertising agencies also place a cookie on user’shard drives. These companies are then able to monitor theinteraction of a user with their advertisements. Onlineagencies cannot monitor users across the entire Internet,they can only do this on their network of sites. By compil-ing data on users’ interactions with advertisements and thecontent of the sites they visit online, agencies hope to beable to target more appropriate ads to that user and managetheir frequency. Users can opt out of cookies by visiting theagency’s Web site. Users can also set their browsers to re-ject all cookies, or to notify them when a site wants to placea cookie on their computer.

MORGAN STANLEY DEAN WITTER 35
This memorandum is based on information available to the public. No representation is made that it is accurate or complete. This memorandum is not an offer to buy or sell or asolicitation of an offer to buy or sell the securities mentioned. Please refer to the notes at the end of this report.
The Online Advertising Prize Fight —Round Three: Convergence and Scale
KEY POINTS:
½ Rich media — brought on by broadband — may lead to
higher response rates, better branding capability, and
more creative possibilities. A convergence of television
and the Internet with interactive advertising is likely to
lead to larger budget commitments.
½ The largest advertisers are only just beginning to enter the
online fray. The new interactive media will likely lead to
significant perturbations in their business models, brands,
and media choices, brought about by a new understanding
of their customers.
½ The future interactive agency and advertiser must be
ROI-driven. To do so, they must be able to integrate
campaigns, data, and technology across a wide variety of
new, traditional, and converged media across geographies
and cultures.
½ The “tail may wag the dog” as information gleaned from
interactive advertising will have implications for other
marketing decisions on pricing, positioning, and promo-
tion.
We will soon enter the next round of the Internet advertisingbattle as broadband reaches the masses; the Internet be-comes more ubiquitous and wireless; televisions becomemore interactive; video/data/voice appliances converge;brand advertising and direct marketing practices integrate;domestic brands, commerce and marketing become evenmore global; and big marketing spenders spend more moneyonline. Many companies that are well-positioned today willneed to continue to evolve to take advantage of the opportu-nities. We believe that the success of Internet advertisingcompanies will largely be driven by how they maneuveramong the coming developments.
Technology: Broadband Brings Rich Media
One of the key issues playing out in the next round ofInternet advertising will be broadband technology.Roughly defined as a minimum of 128 KBPS speed and analways-on connection, broadband will allow more data to
reach consumers faster. This is certain to increase usage ofthe Internet, causing more ads to be viewed. However, foradvertisers, the real importance of broadband is that itbrings rich media to the Internet. Rich media is graphic-intensive, animated, audio-enabled, and interactive.
There is no question that broadband is coming. The de-ployment of digital subscriber line (DSL), cable modem,and Direct Broadcast Satellite (DBS) technologies has as-sured that broadband will reach many users in the comingyears. Further, many business offices already havebroadband technologies deployed.
Rich media, brought on by broadband, will allow adver-tisers much greater creativity. This will be seen in theform of greater animation, audio features, and interactivity.Banners currently have some degree of all of these features,but the animation is jerky, the audio is often interrupted, andthe interactivity is limited. Faster broadband connectionswill change this.
More detailed graphics will be possible, with more anima-tion. For instance, movie clips or television-like advertise-ments can be viewed on the Web. In the past, these had tobe downloaded through a lengthy process, given the limitedspeeds of telephone lines. Broadband will allow muchfaster downloads, as well as streaming media that is playedin real time. Further, bandwidth “sniffers” are now beingused that determine the amount of bandwidth that a user’smachine can handle and then deliver the ad with the maxi-mum possible amount. Not only video, but audio too, willbe enhanced by broadband.
Broadband streaming will allow advertisers to interact withconsumers on the site where the ad appears, rather thanforcing the consumer to click on a link that steers themaway from their original Web destination. Interactive ads,games, and other forms of entertainment can be imbedded ina site’s advertising, allowing users to interact with the ad.

36 MORGAN STANLEY DEAN WITTER
This memorandum is based on information available to the public. No representation is made that it is accurate or complete. This memorandum is not an offer to buy or sell or asolicitation of an offer to buy or sell the securities mentioned. Please refer to the notes at the end of this report.
Figure 14
Advertising Awareness Is Increased by the Use ofRich Media (% Who Remembered Ad)
20% 21%
49% 59%
0%
10%
20%
30%
40%
50%
60%
Static Banner AnimatedBanner
AnimatedInterstitial
HighlyAnimated,
LargeInterstitial
Source: Millward-Brown Interactive
Broadband will likely bring new types of advertising tothe Internet, as well as enhancing some of the more tra-ditional forms. Banners will be able to move without thetraditional jerkiness. Additionally, they will have audiofeatures, allowing users to hear jingles or music samples.Banners, interstitials, and sponsorships will become muchmore interactive. Instead of simply being linked to an ad-vertiser’s site or to a selling window, broadband will allowusers to play entire ads on the screen without leaving thecurrent page. This feature makes it much more likely thatusers will read about a product than if they were transportedto a new page.
Expandable windows are gaining popularity on the Web.These ads appear to be normal banners but expand to reveala much larger frame for viewing when a user clicks on thead. This keeps the screen from getting cluttered and alsoallows the advertiser to really show off its wares to an inter-ested consumer.
Interstitials will likely grow in popularity, thanks tobroadband. These pop-up windows are perfect for playinganimated ads. Further, they can be immediately closed ifthe consumer is uninterested.
Studies by Millward-Brown Interactive (a unit of WPPGroup’s Millward-Brown International) have found thatlarge animated ads produce impressive awareness andbrand recall. Greater animation, larger presence on theuser’s screen, and interactivity are all possible as a result ofbroadband technology.
Figure 15
Brand Recognition Is Increased Through the Use ofRich Media (% Who Remembered Brand)
40% 39%
48% 58%
0%
10%
20%
30%
40%
50%
60%
Static Banner AnimatedBanner
AnimatedInterstitial
HighlyAnimated,
LargeInterstitial
Source: Millward-Brown Interactive
In addition to increased awareness and brand recall, 38% ofrespondents in a Millward-Brown Interactive study said thatthey came away with a positive reaction to the ad. Further,26% said they were more likely to make a purchase afterseeing the large, animated interstitial than if they had notseen it. Clearly, consumers enjoy more television-like ani-mation in their ads, and this, we believe, will be critical indriving Internet advertising.
Excite@Home has conducted its own rich media studies inwhich broadband-enabled rich media generated 22% higherbrand recall and a 35% higher propensity to click through.As both studies have shown, rich media will allow forgreater branding on the Web. Branding requires more thana static banner to have its effect. The jingles that emanatefrom our televisions and radios, as well as the scenes thatwe see in magazines or on television, form our impressionsof brands. With rich media, the Web will acquire the abilityto use sound and animation to enhance the branding ofproducts.
Rich media will allow for greaterbranding on the Web.
Television-like animation will be critical in drivingInternet advertising precisely because it is TV-like. Ad-vertisers are comfortable with television advertising, andthey know how to use it to accomplish their goals. We be-lieve that advertisers will view the broadband-enabled ani-

MORGAN STANLEY DEAN WITTER 37
This memorandum is based on information available to the public. No representation is made that it is accurate or complete. This memorandum is not an offer to buy or sell or asolicitation of an offer to buy or sell the securities mentioned. Please refer to the notes at the end of this report.
mation, audio, and video features of the Internet as an op-portunity to expand their advertising on the Web. To date,most advertisers have spent tiny portions of their advertisingand marketing budgets on the Web, and many have com-pletely shied away from it. However, as the Web comes tomore closely resemble television and enters more advertis-ers’ “comfort zones,” we expect many more to establish aWeb presence, and the early adopters to continue to shiftmore of their advertising online.
Those companies that are best able to develop, serve, andtrack these new forms of advertising brought about bybroadband will be best-positioned. As broadband enables anew form of Internet advertising to evolve, this will allownew players with specialties in this area to quickly make aname for themselves, while forcing more mature companiesto re-invent themselves if they are to stay competitive.
Another area that will benefit from broadband will beaudio streaming. Studies by Arbitron New Media havefound that 31 million Americans have listened to radio overthe Web, while only 16 million have watched streamingvideo. Importantly for advertisers, 69% of those surveyedrequested more information concerning the audio clip theyheard while listening to Web radio or hearing a Web adver-tisement.
Technology: Broadband II —Television and Internet Convergence
Broadband technology will allow the convergence of televi-sion and the Internet. Dubbed “interactive TV,” in its sim-plest form this consists of television with some interactivecapabilities. Basically, a user will see a television screenthat is three-quarters traditional television, but with a framethat has Internet capabilities. This frame allows users toaccess up-to-the-minute sports scores or news on the Web,for example. More importantly for advertisers, it wouldallow viewers to immediately leap to the Web site of anadvertiser whose ad was being shown. The user could findout more information or order the product right there: Im-pulse shoppers, beware!
What we have just described is the most basic version ofinteractive TV. Going forward, we expect that more func-tions will be added that truly integrate the two mediums.Whatever the case, advertisers will have to spend to inte-grate and enhance the abilities of their Internet advertising
campaigns. Those advertisers that are not already onlinewill likely be forced to enter the game in a big way. Due totheir familiarity with television, this may not seem to besuch a big leap.
Content providers are already developing channels and pro-grams that combine interactivity and television viewing,including Microsoft’s WebTV and AOL TV. We believethat the advertising companies that are able to work withsuppliers of integrated content and develop a seamless tran-sition for their advertising clients will be best positioned toprosper in the future.
Technology Outsourcing
Outsourcing of Internet advertising will play an in-creasing role going forward. Since the beginning of thecomputer age — when instead of purchasing software, userswould buy a share of it — outsourcing has played an im-portant role. Today, we see it in the Web hosting model, incustomer relations management, and to a growing degree inthe e-mail sphere. We believe that Internet ad serving andtargeting are no different.
Ad serving requires a huge technological investment inservers, back-up servers, a trained staff to man the servers,and real estate to house the server farms (not to mention theair conditioners to cool the servers). Likewise, the target-ing/tracking software requires large outlays to purchase andmaintain. And if the company is trying to bridge the on-and offline worlds, a database of behavioral history is re-quired. This can be a huge investment — DoubleClickspent nearly $2 billion to acquire Abacus Direct’s database.
As more new entrants pop up on the Web, we believethey will look to outsource their ad serving and target-ing, rather than making the investment to keep it in-house. In fact, very few Web publishers still perform thesefunctions in-house, with Excite@Home, Yahoo!, the GoNetwork, and, to some extent, America Online being thefew holdouts. Although these companies may continue torun their operations in-house, the number of Web sites isproliferating at an unbelievable pace. New entrants are notlikely to make the huge investment to undertake ad servingand targeting on their own — particularly when they arespending virtually all of their IPO proceeds on marketing.Thus, they will need to turn to outsiders for help. For thisreason, we believe that those companies with the best net-
38 MORGAN STANLEY DEAN WITTER
This memorandum is based on information available to the public. No representation is made that it is accurate or complete. This memorandum is not an offer to buy or sell or asolicitation of an offer to buy or sell the securities mentioned. Please refer to the notes at the end of this report.
works, serving ability, and targeting ability will ultimatelytriumph.
Online and Offline Advertising Convergence
We expect advertisers will increasingly integrate theiron- and offline campaigns in the future. As mentionedabove, rich media will allow advertisers to develop moretelevision-like ads on the Internet, and this will encouragethem to unify their messages in the on- and offline worlds.
There will always be some firms that specialize in certainmediums, particularly the Internet. However, ad companiesthat are able to bridge the gap between the on- and offlineworlds should be best positioned to answer all of an adver-tiser’s needs. An agency able to purchase time on CNN’sHeadline News and purchase space on the CNN Web site isthe type of agency that we see flourishing in the convergingworld.
Historical Media Consolidation
In the traditional media world, consolidation has occurredover a long span of time. We expect online consolidation tohappen at “Internet speed.” The top six television networksaccount for 84% of advertising revenues, while drawing67% of the viewers. The top 25 newspapers account for88% of newspaper circulation. There are only 31 magazineswith ad revenues over $200 million, and Time Inc. captures30% of the magazine advertising market. Only 20 “real”cable brands exist, and only two of these generate in excessof $1 billion in revenue. Only five cable service companieshave 3 million or more cable customers. We believe thatthis type of consolidation will occur in the Internet adver-tising space.
Brand Advertising and Direct Marketing Convergence
We feel that the Internet is much more of a direct mar-keting media than an advertising one. The ability to in-teract with consumers in real time is the Internet’s power.The successful agencies will understand and practice this.Rather than simply running a bunch of static banner ads,good advertising campaigns will encourage consumers tointeract with the advertiser.
The Internet is the first media with which an advertiser isable to directly interact with consumers. While this is ahuge opportunity, it is also dangerous, as unwanted and ir-ritating interaction will immediately turn off a consumer.
The successful agencies will facilitate interaction betweenconsumers and advertisers. To accomplish this, advertiserswill generate interesting and pro-active campaigns that drawusers’ attention. After getting their attention, it is importantto ensure that a positive interaction occurs. This may entailentertaining games, more information, a chance to win aprize, or other appropriate means of encouraging and devel-oping a positive relationship between an advertiser and apotential consumer.
Today, it is estimated that 30–40% ofInternet traffic is internationally gen-erated. This number will continue togrow.
If Media Goes Global, So Do Brands
Today, it is estimated that 30–40% of Internet traffic isinternationally generated. This number will continue togrow. Currently, international users have a slightly lowerresponse rate to ads than domestic users do. However, thistoo will change over time.
According to Jupiter Communications, today approximatelyone in four U.S. Internet users shops online. In Europe, thenext most-developed Internet market, one in five usersshops online. We expect Europeans to spend more timeonline, but we are only just getting data on their averageusage. More time online should result in more shopping,and more shopping will result in more advertising. We ex-pect this pattern to be played out around the world.
Currently, only 28% of U.S. Internet retail sites have foreignlanguage pages for international shoppers (according to Ju-piter Communications). Further, only 38% of U.S. retailsites will ship internationally. As these numbers increase,we expect that more advertisers will shift a greater share oftheir business online.
Those companies that are best positioned to serve ads inlocal languages, with local customs/mannerisms in mind,will be able to capitalize on the internationalization ofthe Web. Agencies that are capable of developing andserving ads in a multitude of languages and cultures will bebest positioned to compete on the global stage.

MORGAN STANLEY DEAN WITTER 39
This memorandum is based on information available to the public. No representation is made that it is accurate or complete. This memorandum is not an offer to buy or sell or asolicitation of an offer to buy or sell the securities mentioned. Please refer to the notes at the end of this report.
Here Come the Big Ad Spenders
All of the aforementioned factors will lead to greater adver-tising on the Internet. Those agencies that develop the bestcapabilities to handle rich media, the convergence of TVand the Internet, technology outsourcing, direct marketing,and the globalization of the Web will reap the greatest re-wards.
Figure 16
Marketing Budgets of the Largest Companies
Other Marketing70%
Internet Advertising
1%
Offline Advertising
29%
Source: Association of National Advertisers
General Motors is the only advertiser to rank as one of thetop ten offline and online advertisers. Even more important,GM spends less than 1% of its advertising budget online.The Association of National Advertisers reports that theaverage annual expenditure of an advertiser on the Internet
was $714,00 in 1998, up from $250,000 in 1997. Internetad budgets have nowhere to go but up as advertisers shiftlarger portions of their budgets online. We saw the begin-ning of this in 2Q99, as consumer brand advertisers (usuallythe ones with the big bucks) accounted for 29% of totalInternet advertising revenues, according to the Internet Ad-vertising Bureau. This makes consumer brand advertisersthe leading industry category for online advertising. Asmore large advertisers advertise on the Internet and as theonline share of marketing budgets increases, online adver-tising expenditures will take off.
“Direct marketing online is a ‘sleeper’ waiting to ex-plode. Major advertisers are still putting less than1% of their ad budgets on the net; instead, two-thirdsof their budgets are going into direct marketing, notimpression-based advertising.”— George Bell, CEO Excite
The concentration of advertising expenditures on the Inter-net has been broadening. No longer do only a few firmsventure to advertise online. Rather, the Internet is becomingmore of an accepted — and useful — advertising medium.We expect this trend to continue for some time.

40 MORGAN STANLEY DEAN WITTER
This memorandum is based on information available to the public. No representation is made that it is accurate or complete. This memorandum is not an offer to buy or sell or asolicitation of an offer to buy or sell the securities mentioned. Please refer to the notes at the end of this report.
What Could K.O. Internet Advertising?
KEY POINTS:
½ Privacy matters, software that blocks ads and cuts out
cookies, and the anti-spam culture could reduce the effec-
tiveness and the value of Web advertising. It would also
curtail consumer convenience and reduce content quality
— there is no free lunch without advertising.
½ Net vs. Gross revenue recognition is a focus of concern.
The SEC is looking into the way in which Internet ad
firms account for their revenues. If FASB forced those
firms that are “grossing up” their revenues to discontinue
the practice, revenue multiples would be altered (which
could hurt price to sales comparisons), but in most cases
the underlying business would not be affected.
½ Today’s declining click-through rates and (tomorrow’s?)
declining stock prices may lead to negative advertiser sen-
timent — hurting demand and pricing. While marketing
ROI should be the only thing that matters, focusing on the
wrong metrics could have an impact.
Privacy Concerns Are Gaining Momentumand Will Not Go Away Any Time Soon
Web publishers and buy/sell-side networks usually placecertain informational text files called “cookies” on auser’s hard drive without the user’s knowledge or con-sent. Agencies use cookies to identify users and target ap-propriate ads to them. This can also help in limiting thefrequency with which the user is shown a particular ad. Iflegal restrictions reduce the effectiveness of cookies, sig-nificant reengineering resources may be required for ad tar-geting. This would mean that Internet ads would have to becontextually placed, based on aggregate demographic groupbehavior (as is the case on television), rather than individu-ally targeted based on personal behavior. Advertisers couldalso target based on the ISP of origin and other such factors.Internet browsers allow users to modify their browser set-tings to remove or prevent cookies.
In the offline world, many companies have just as muchinformation (or more) on consumers — particularly thecredit card companies. In the U.S., we believe that the abil-ity to eliminate or block cookies by opting out of ad target-
ing programs, combined with clear privacy policies postedon Web sites (and an acceptance of just how much informa-tion offline companies already have on consumers), willmollify most users.
Overseas, however, privacy concerns seem to playing alarger role. For example, the European Union has adopted adirective addressing data privacy that may result in limita-tions on the collection and use of certain information re-garding Internet users. Also, Germany has imposed its ownstrict set of standards, limiting the use of cookies.
Internet users’ privacy concerns peaked with the an-nouncement that DoubleClick was being investigated bythe Federal Trade Commission’s (FTC) Bureau of Con-sumer Protection. This is not the same bureau that coversAntitrust/Competition. The Bureau of Consumer Protec-tion’s mandate is “to protect consumers against unfair, de-ceptive, or fraudulent practices.” The Bureau enforces avariety of consumer protection laws enacted by Congress, aswell as trade regulation rules issued by the Commission. Itis common for such an investigation to take 6–12 months,and it may include investigations into other companies re-lated to DoubleClick’s business.
In the worst-case scenario,the Internet goes all opt-in.
Several federal bills regarding privacy are under way inthe U.S. House and the U.S. Senate, but with very fewlegislative days left in the shortened election year, it is un-likely we will have legislative resolution before 2001. Inthe worst-case scenario, the Internet goes all opt-in, as themost controversial legislation, written by Senator Torricelli(D-NJ), calls for. What does this worst-case mean? Userswho choose not to opt in will not have cookies placed ontheir hard drives, and therefore will likely receive repetitivemarketing messages. Others will opt in, creating a panel ofusers on whom data could be compiled; online advertiserscould extrapolate from that data to do effective targeting.For those who fail to opt in, targeting would be based on theISP of origination and the content of the Web page visited.
MORGAN STANLEY DEAN WITTER 41
This memorandum is based on information available to the public. No representation is made that it is accurate or complete. This memorandum is not an offer to buy or sell or asolicitation of an offer to buy or sell the securities mentioned. Please refer to the notes at the end of this report.
Finally, in order to increase the percentage of opt-in, sitesand their marketers will need to offer sweepstakes and otherbenefits to entice consumers.
Even with the most basic tools, we believe the long-termvalue of Internet advertising can rise from its current powerratio of 80% (similar to TV) — to around 300% (similar tomagazines). What does that mean in English? We believethat Internet advertising’s pricing power may triple withoutcookies... and could possibly be higher with them.
State legislatures and Attorneys General say “Don’tTread on Me.” Privacy is very much a state issue. Manyon Wall Street and in Silicon Valley miss this point, think-ing that government begins and ends in Washington, DC.Underlying the states’ interests in this area is the most re-cent federal legislation on financial services, which devotedan entire section to privacy. In the excerpt noted belowfrom the Gramm-Leach-Bliley Act, Congress permitted thestates to propose more restrictive privacy rules.
Gramm-Leach-Bliley Act
Became Public Law No: 106-102, 11/12/1999. An Act toenhance competition in the financial services industry byproviding a prudential framework for the affiliation ofbanks, securities firms, and other financial service provid-ers, and for other purposes.
TITLE V--PRIVACY
Subtitle B--Fraudulent Access to Financial Information
SEC. 507. RELATION TO STATE LAWS.
(b) GREATER PROTECTION UNDER STATE LAW- Forpurposes of this section, a State statute, regulation, order, orinterpretation is not inconsistent with the provisions of thissubtitle if the protection such statute, regulation, order, orinterpretation affords any person is greater than the protec-tion provided under this subtitle and the amendments madeby this subtitle, as determined by the Federal Trade Com-mission, after consultation with the agency or authority withjurisdiction under section 505(a) of either the person thatinitiated the complaint or that is the subject of the com-plaint, on its own motion or upon the petition of any inter-ested party.
Some state legislatures and attorneys general have taken thispermission as a mandate. In the State of Washington, theAttorney General has vowed to be the first to act on this“permission.” Investors should expect a crescendo of stateactivity from now until next year, with a number of omnibusprivacy bills and ballot initiatives considered.
Accounting Standards— Gross vs. Net Revenue Recognition
Accounting standards questions have been a hot topicamong Internet companies. On December 3, 1999, theSEC issued Staff Accounting Bulletin (SAB) 101 on ac-counting for revenue recognition to clarify current principlesfor recognizing and reporting revenue. SAB101a was re-cently released to extend the deadline for compliance until2Q00. Although the SAB covers a wide range of issuesregarding revenue recognition policies, the key area thatcould affect Internet advertisers is the gross versus net reve-nue disclosure.
In areas where it is unclear whether the gross revenuesshould be reported with a separate display of cost of goodssold to determine net sales, the SEC staff puts forth the fol-lowing requirements: The staff considers whether the regis-trant: (1) acts as principal in the transaction, (2) takes title tothe products, (3) has risks and rewards of ownership, suchas the risk of loss for collection, delivery, or returns, and (4)acts as an agent or broker (including performing services, insubstance, as an agent or broker) with compensation on acommission or fee basis. If the company performs as anagent or broker without assuming the risks and rewards ofownership of the goods, sales should be reported on a netbasis. Managements claim to satisfy all of these conditions,yet should FASB disagree, companies could have to restatehistorical revenue and could have to report something closerto net revenues going forward.
A FASB decision that goes against a company’s ac-counting policies should not change profitability projec-tions or any other part of its business. However, should itresult in a lower level of revenues, investors relying solelyon revenue multiples for valuation may reduce the value ofthe stock — and this could impact strategic decisions at thecompany. This could hurt the stock considerably — andcould have a negative (but uneven) impact on a number ofnames in the Internet advertising sector.

42 MORGAN STANLEY DEAN WITTER
This memorandum is based on information available to the public. No representation is made that it is accurate or complete. This memorandum is not an offer to buy or sell or asolicitation of an offer to buy or sell the securities mentioned. Please refer to the notes at the end of this report.
Barter revenue accounting is another area that hascaused concern. Bartering occurs when two Internet com-panies exchange advertising space on their Web sites. TheSEC finds fault with the fact that these companies some-times report revenue earned for the ad and marketing ex-pense for the bartered ad. Forrester Research believes thatabout 8% of reported Internet advertising revenues are bar-ter revenues that should not be counted. Although most ofthe Internet advertising agencies would not be affected, acrackdown by the SEC on barter revenues could be a mod-est negative for the industry.
Ad-Blocking and Cookie-Cutting Software
Ad-blockers allow for a “free ride” — and some claim itcould be faster, too. To date, $20 off-the-shelf software bycompanies such as AdSubtract.com and Symantec Corp. hasnot proved too popular. This could change if the ad-blockers allow for faster Internet access, as some makers ofsuch software claim. Other media have “ad-blockers” todeal with, too — consider the early models of TiVo andReplay for television. Of course, since few subscriptionmodels have worked on the Web, blocking the ads inevita-bly leads the content distributor to block the content — nota good plan for an ad-supported media. Finally, ad-blockingsoftware is far from perfect; some ads slip through and somecontent is blocked.
Cookie cutters allow users to remove cookies, or storedidentification markers, from their hard drives. Thiscauses users to appear as completely new identities to Websites. Ad servers, unaware of a user’s identity (and thus,preferences) will serve contextual ads to users who have cuttheir cookies. At the same time, sites will not rememberuser’s passwords, preferences, and ordering details, thusrestricting convenience and detracting from the user’s expe-rience.
Direct E-Mail & the Anti-Spam Culture of the Web
Direct e-mailers have become very wary of being associatedwith “spam.” They have tried to make their marketing pro-grams invitations to buy, with very easy opt-out methods ifa user wishes to unsubscribe to future mailings. They havealso utilized previous offline relationships with brands tobuild new opt-in relationships. Clearly posted privacystatements and the ability to opt out of an ad targeter’s pro-gram are important means of empowering consumers.
Still, a Web consumer backlash could be ignited by a rela-tively small number of people angered by one careless orunlucky incident — so investors beware. Once Internethousehold penetration becomes more ubiquitous, however,we do not believe the average customer will be shocked thatthere is e-commerce going on in their e-mail box.
Declining Click-Through Rate
A continuously declining click-through rate on the Webcould lead advertisers to look unfavorably upon Internetadvertising ... even though they do not know the “click-through rate” of other media.
Although most admit that the click-through rate (CTR) isnot the best measure of an advertisement’s effectiveness, itis easily quantifiable and may be cited by advertisers asproof of a campaign’s success or failure. For every studythat shows a decline in CTRs — the percentage of peoplewho click on an ad — there is one that refutes the impor-tance of that measurement.
Not everyone agrees that the banner format itself is theproblem; rather the way banners are created and used is theissue.
“It’s more a case of bad banner ads, just like there arebad television ads. The space itself has huge poten-tial. You can have people register, there are pull-down scripts, you can play games.”— Mike Windsor, President of Ogilvy Interactive
However, some of those who believe that banner ads are theproblem point to emerging formats with higher CTRs aslikely future Internet advertising applications. Unicast’ssuperstitials are Java-based pop-up windows that are sup-ported by DoubleClick, Engage and 24/7 Media and aredesigned to be minimally intrusive and polite.
“The Superstitial is a pop-up on steroids. Supersti-tials have far exceeded our expectations.”— Sean Black, VP and Interactive Media Director,Grey Direct Interactive
Additionally, CTR information is currently available onlyfor Internet advertising. Over time, interactive televisionwill give us another medium’s CTR and allow for compari-sons. Finally, it is important to realize that CTRs, look-to-

MORGAN STANLEY DEAN WITTER 43
This memorandum is based on information available to the public. No representation is made that it is accurate or complete. This memorandum is not an offer to buy or sell or asolicitation of an offer to buy or sell the securities mentioned. Please refer to the notes at the end of this report.
book ratios, and response rates all boil down to ways to cre-ate a medium’s clearing price for its advertising.
Where Wall Street Crosses Madison Avenue
At some point, investor sentiment in the Internet spacemay take a turn for the worse ... and this could affectadvertising. While a lot of overvalued companies may jus-tifiably falter, we worry that some of the good companiesand their services will also be hurt should investor sentimentturn negative.
Analysts have sought to address this by using short-termconservative assumptions and long-term aggressive as-sumptions. However, should this dichotomous approach toforecasting appear to produce expectations out of line withevolving reality, many Internet advertising stocks could beunjustifiably hurt. As “the most measurable media ever,”the Internet has a lot of promise to live up to.

44 MORGAN STANLEY DEAN WITTER
This memorandum is based on information available to the public. No representation is made that it is accurate or complete. This memorandum is not an offer to buy or sell or asolicitation of an offer to buy or sell the securities mentioned. Please refer to the notes at the end of this report.
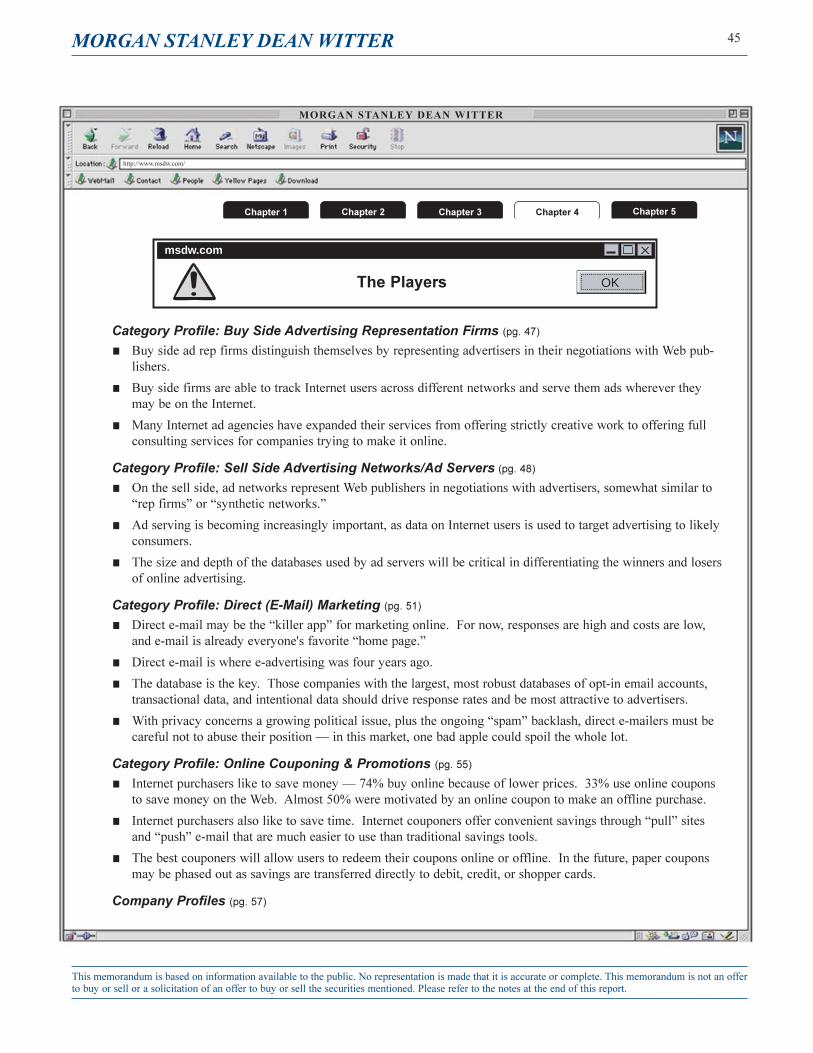
45MORGAN STANLEY DEAN WITTER
This memorandum is based on information available to the public. No representation is made that it is accurate or complete. This memorandum is not an offerto buy or sell or a solicitation of an offer to buy or sell the securities mentioned. Please refer to the notes at the end of this report.
http://www.msdw.com/
MORGAN STANLEY DEAN WITTER
Category Profile: Buy Side Advertising Representation Firms (pg. 47)
Buy side ad rep firms distinguish themselves by representing advertisers in their negotiations with Web pub-lishers.
Buy side firms are able to track Internet users across different networks and serve them ads wherever theymay be on the Internet.
Many Internet ad agencies have expanded their services from offering strictly creative work to offering fullconsulting services for companies trying to make it online.
Category Profile: Sell Side Advertising Networks/Ad Servers (pg. 48)
On the sell side, ad networks represent Web publishers in negotiations with advertisers, somewhat similar to�rep firms� or �synthetic networks.�
Ad serving is becoming increasingly important, as data on Internet users is used to target advertising to likelyconsumers.
The size and depth of the databases used by ad servers will be critical in differentiating the winners and losersof online advertising.
Category Profile: Direct (E-Mail) Marketing (pg. 51)
Direct e-mail may be the �killer app� for marketing online. For now, responses are high and costs are low,and e-mail is already everyone's favorite �home page.�
Direct e-mail is where e-advertising was four years ago.
The database is the key. Those companies with the largest, most robust databases of opt-in email accounts,transactional data, and intentional data should drive response rates and be most attractive to advertisers.
With privacy concerns a growing political issue, plus the ongoing �spam� backlash, direct e-mailers must becareful not to abuse their position � in this market, one bad apple could spoil the whole lot.
Category Profile: Online Couponing & Promotions (pg. 55)
Internet purchasers like to save money � 74% buy online because of lower prices. 33% use online couponsto save money on the Web. Almost 50% were motivated by an online coupon to make an offline purchase.
Internet purchasers also like to save time. Internet couponers offer convenient savings through �pull� sitesand �push� e-mail that are much easier to use than traditional savings tools.
The best couponers will allow users to redeem their coupons online or offline. In the future, paper couponsmay be phased out as savings are transferred directly to debit, credit, or shopper cards.
Company Profiles (pg. 57)
msdw.com X
OKThe Players
Chapter 1 Chapter 2 Chapter 3 Chapter 4 Chapter 5

46 MORGAN STANLEY DEAN WITTER
This memorandum is based on information available to the public. No representation is made that it is accurate or complete. This memorandum is not an offer to buy or sell or asolicitation of an offer to buy or sell the securities mentioned. Please refer to the notes at the end of this report.
MORGAN STANLEY DEAN WITTER 47
This memorandum is based on information available to the public. No representation is made that it is accurate or complete. This memorandum is not an offer to buy or sell or asolicitation of an offer to buy or sell the securities mentioned. Please refer to the notes at the end of this report.
Category Profile: Buy-Side Advertising Representation Firms
KEY POINTS:
½ Buy-side ad rep firms distinguish themselves by repre-
senting advertisers in their negotiations with Web pub-
lishers.
½ Buy-side firms are able to track Internet users across dif-
ferent networks and serve them ads wherever they may be
on the Internet.
½ Many Internet ad agencies have expanded their services
from offering strictly creative work to offering full con-
sulting services for companies trying to make it online.
Sell Side vs. Buy Side
As in the offline media world, the online media business hasboth a buy side and a sell side. On the sell side, agenciesand networks represent Web publishers in selling Internet adinventory (the ad networks described earlier). It is the sellside’s job to negotiate the best deal (i.e., most money) fromadvertisers for the publishers they represent. On the buyside, agencies try to get the best deal for their customers —the advertisers.
Sell-side ad networks can provide advertisers with ac-cess to only a limited number of sites — those in thenetwork. For instance, DoubleClick cannot serve ads to ormonitor users who are on AOL’s sites. Thus, they are un-aware of what ads a user has been served and how they havereacted. Nor can sell-side networks target advertisements tousers who do not enter their network of sites.
Buy-side ad agents essentially produce a custom networkfor advertisers. This is possible because they representadvertisers’ — not publishers’ — interests in negotiations.Buy-side agencies are independent of any Web publisher oradvertising network. Thus, they are able to focus on theneeds of Internet advertisers, rather than Web sites that selladvertising or advertising networks representing sellers ofInternet advertising.
Targeting
Targeting is based on data acquired from prior interactionswith users. This comes from a user’s interaction with the
buy-side client’s Web sites and from a user’s responses topast advertisements. For instance, an Internet user who vis-its Jeep’s Web site to look at the Jeep Wrangler could beserved an advertisement for the Wrangler anywhere on theWeb. Similarly, an Internet user who clicks through a Jeepad to gain more information may be served a Jeep ad again.
Sell-side ad serving systems enable advertisers to controlthe frequency with which an ad is delivered — regard-less of where the user sees the exposures. This is highlyimportant, as it has been established that if a user is going torespond to an ad, it will be within the first several expo-sures. Except for branding value, additional exposures arewasted. If advertisers contract directly with publishers orsell-side ad networks (like DoubleClick, Engage, or 24/7Media), they run the risk of wasting advertising, since pub-lishers have no ability to control the frequency of ads out-side their own networks. Sell-side ad shops track users atevery exposure to a client’s ad. They can thus control thefrequency with which the user sees each ad. If a user hasseen an ad three times on Yahoo!, then shows up on CNET,the company knows that s/he has already seen the ad, andwill deliver a different creative at the fourth exposure.
Advertisers often design a sequence of ads intended to rein-force their brand, then request an action. Buy-side firmsenable advertisers to determine the sequence in whichthey’d like users to see the ads, then execute this plan. Thesame goal cannot be guaranteed if advertisers contract di-rectly with publishers or sell-side ad networks.
BUY-SIDE COMPETITORS:
½ Avenue A — AVEA
½ DoubleClick — DCLK
½ Engage — ENGA
½ Mediaplex — MPLX
½ 24/7 Media — TFSM
48 MORGAN STANLEY DEAN WITTER
This memorandum is based on information available to the public. No representation is made that it is accurate or complete. This memorandum is not an offer to buy or sell or asolicitation of an offer to buy or sell the securities mentioned. Please refer to the notes at the end of this report.
Category Profile: Sell-Side Advertising Networks/Ad Servers
KEY POINTS:
½ On the sell side, ad networks represent Web publishers in
negotiations with advertisers, somewhat similar to “rep
firms” or “synthetic networks.”
½ Ad serving is becoming increasingly important, as data on
Internet users is used to target advertising to likely con-
sumers.
½ The size and depth of the databases used by ad servers
will be critical in differentiating the winners and losers of
online advertising.
Ad networks are basically groupings of sites that havebanded together to present a united front when dealingwith advertisers. In this way, they gain the benefits of awide-reaching portal. Relatively obscure sites can bargainfor media pricing from a position of strength when they arepart of a network. Typically, ad networks conduct ad serv-ing for their affiliated sites.
Ad serving is largely a technology job. When a user goesto a Web site, the site queries its ad-serving partner aboutwhich ads to deliver based on the user’s profile. The ad-serving partner serves (sends) the selected ad back to theWeb site. A few sites have chosen to do this on their own,but the vast majority outsource the serving job to third-partyad servers. We believe that as greater targeting ability isdeveloped, third-party ad servers will be even more critical.
Today, 61% of sites use some combination of internal andexternal ad serving. We expect this number to continue toclimb as more targeting comes online and more rich mediais demanded by advertisers.
Tracking
Internet commerce trackers and marketers believe thatevery Internet transaction generates ten times as muchinformation on consumers as an offline transaction. Thegood ad trackers are able to monitor this clickstream of dataand assemble it into a user profile. With individual userprofiles developed through clickstream tracking, targeterscan better serve appropriate ads to consumers.
Tracking has been going on in the offline world for sometime. Individual stores monitor consumers’ purchases andtry to target their specials to those consumers who may beinterested. The online world takes tracking to a whole newlevel, particularly if the Internet bridges the online and off-line data.
Data Is the Key!
For an advertisement to be targeted, there must be dataon consumers behind it. The richer and more in-depththe data, the better the targeting. In general, data are di-vided into behavioral and demographic data, although geo-graphic is also starting to enter the scene as local Internetadvertising catches on. Behavioral data can be further bro-ken into transactional and intent-to-purchase data.
• Transactional Data: The most important form of data istransactional data. A form of behavioral data, this is a his-tory of what consumers have purchased in the past. Adver-tisers can then market complementary products to consum-ers with this information.
• Intent to Purchase: Data on a consumer’s intent to pur-chase are nearly as important as the purchases themselves.Using this form of behavioral data, ad targeters are able tomonitor what consumers have read about, requested moreinformation about, or nearly purchased. With this informa-tion, they can offer special prices to consumers who turnedback on a sale at the last moment because of the price or forother reasons.
• Demographic: Demographic data are based on a broadcategorization of consumers. Ads are targeted at usersbased on their demographic group. For instance, males age18–24 may receive football advertisements. Demographic-based advertising depends on broad assumptions, making itmuch less likely to generate a response than ads using be-havioral data.
Targeting
Targeted advertising on the Internet is still in its initialstages. In our view, Internet advertisers are rich in data,but poor at using that data for targeting. We have di-
MORGAN STANLEY DEAN WITTER 49
This memorandum is based on information available to the public. No representation is made that it is accurate or complete. This memorandum is not an offer to buy or sell or asolicitation of an offer to buy or sell the securities mentioned. Please refer to the notes at the end of this report.
vided the development of Internet ad targeting into threetime periods:
• Building the Database: From 1994 to 1997, as the Inter-net morphed from a nerd hangout to a mainstream medium,advertisers came to realize that they had a treasure trove ofinformation waiting to be mined. Vast amounts of data onconsumers were available, and more was being added by thesecond. Advertisers focused on mining the data on Internetconsumers and developing databases to store it.
• Manipulating the Data: From 1997 through 1999, ad-vertisers and Internet ad targeters have focused their effortson manipulating these troves of data. Demographic datahave been widely used to target advertisements, but usingbehavioral data as a targeting mechanism is still in its infantstages.
• Targeting Customers: Now that advertisers, databasecompanies, and ad targeters have developed their databases,they are focusing their efforts on targeting ads based ondemographic, behavioral, psychographic, and even geo-graphic information.
Today, Internet ad targeting is moving from targeting basedsolely on site content — an estimate of the demographics ofa typical viewer of that site — to targeting based on specificuser data. However, numerous studies have shown that thevast majority of sites are still not tracking users’ click-streams.
Closed Loop Marketing
Closed-loop marketing involves clickstream trackingand then targeting based on this information, in virtu-ally real-time. Ad networks using this method track whenusers enter their network of sites, where they click, what adsthey have responded to, what information they have re-quested, and what purchases they have made. With the in-formation generated, closed-loop marketers are able to con-stantly refine their campaigns to generate the best possibleresults.
In the offline world, advertisers must wait until consumersmake a purchase to be able to see their behavior. The Inter-net has turned this upside down, however. Now, the adver-tiser can track a consumer’s behavior prior to a purchaseand can actually facilitate that purchase through the use oftargeted advertising.
Advertising Campaigns: From Broad to Narrow
On the Internet, advertisers can choose to reach a broadaudience or a more narrow selection of users. Within boththe broad and narrow audiences, the ad can be targeted,which distinguishes the Internet from other forms of adver-tising previously available.
• Run of Network: A run-of-network campaign runsacross a media seller’s entire network, similar to the broadreach enjoyed by network television. However, on theInternet, even though the ad is run across the entire networkof sites, it can still be targeted to specific users based on theavailable data.
• Run of Channel: A run-of-channel campaign runs on aportal or network’s distinct content channels. For instance,pet food maker Iams may advertise across Yahoo’s networkof pet sites. Within the channel, the Internet allows furthertargeting based on users’ demographic, psychographic, orgeographic data.
• Run of Site: Currently the most popular form of adver-tising on the Internet, a run-of-site campaign runs only on aparticular site’s pages. For example, one could advertiseonly on the New York Times’ site.
• Profile Targeting: Advertisers have recently been of-fered the option of targeting a campaign at a user with aparticular behavioral history. As of now, these profiles areanonymous, but marketers may try to link their online andoffline data in the future.
As in the offline world, seasonality can influence an adver-tiser’s choice of medium. More broad-reaching advertising,such as run-of-network campaigns, seem to be favored inholiday seasons, while more targeted forms like run-of-sitecampaigns dominate the rest of the year.
Affiliate Marketing
Affiliate marketing is the business-to-business version ofviral marketing. Marketers pay affiliates to lead consumersto their site. Jupiter Communications predicts that affiliateprograms will account for 24% of e-commerce revenues by2002, up from about 11% in 1998.
The granddaddy of affiliate marketing is Amazon.com.Affiliate members feature a link to Amazon’s site — usually

50 MORGAN STANLEY DEAN WITTER
This memorandum is based on information available to the public. No representation is made that it is accurate or complete. This memorandum is not an offer to buy or sell or asolicitation of an offer to buy or sell the securities mentioned. Please refer to the notes at the end of this report.
½
a button — on their own sites. When a user purchases any-thing on Amazon’s site after having gone there via the link,the member who sent the purchaser to Amazon receives acommission.
In general, there are three types of affiliate marketing pro-grams, distinguished by their payment style:
• Impressions: Affiliates are paid when they present abanner to a consumer.
• Click-Throughs: Affiliates are paid for each user thatclicks through the banner or button.
• Lead Generation: After a consumer has clickedthrough to a site, the affiliate is paid if the marketer isable to register the user.
• Revenue Sharing: The affiliate is paid only when thereferred consumer makes a purchase.
Agencies or Consultants?
Many Internet advertising agencies have expanded theirservices as opportunities on the Internet have expanded.Initially, companies like ModemMedia and Razorfish of-fered only creative marketing solutions to their clients.These “e-consultants” have since expanded their offerings to
include Web site development, Internet business planningand e-commerce development, in addition to Internet mar-keting. Companies included in this space are: Sapient,MarchFirst, Viant, Scient, Organic, Agency.com, Razorfish,ModemMedia, and others. Additionally, many of the large“traditional” agency holding companies like Omnicom, In-terpublic Group, Young & Rubicam, True North and WPPGroup have stakes in these e-consultants.
COMPETITORS:
½ DoubleClick — DCLK
½ Engage — ENGA
½ L90 — LNTY
½ Phase2Media — Private
½ Real Media — Has filed to go public
½ 24/7 Media — TFSM
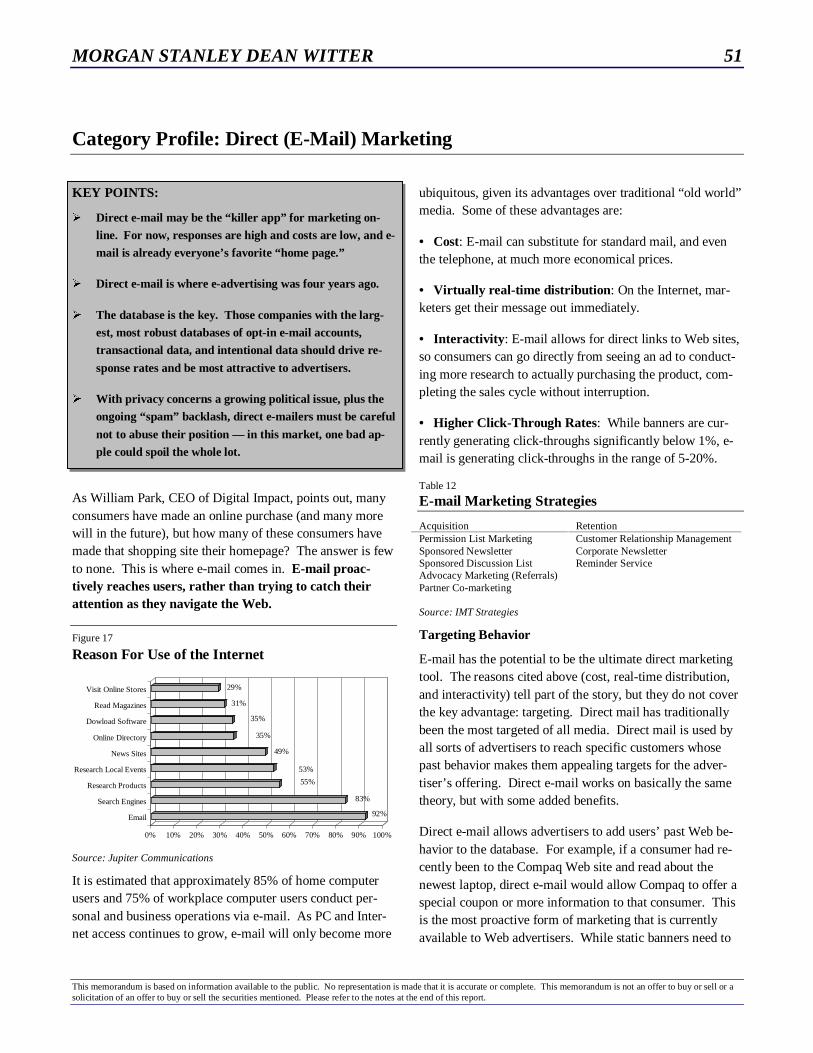
MORGAN STANLEY DEAN WITTER 51
This memorandum is based on information available to the public. No representation is made that it is accurate or complete. This memorandum is not an offer to buy or sell or asolicitation of an offer to buy or sell the securities mentioned. Please refer to the notes at the end of this report.
Category Profile: Direct (E-Mail) Marketing
KEY POINTS:
½ Direct e-mail may be the “killer app” for marketing on-
line. For now, responses are high and costs are low, and e-
mail is already everyone’s favorite “home page.”
½ Direct e-mail is where e-advertising was four years ago.
½ The database is the key. Those companies with the larg-
est, most robust databases of opt-in e-mail accounts,
transactional data, and intentional data should drive re-
sponse rates and be most attractive to advertisers.
½ With privacy concerns a growing political issue, plus the
ongoing “spam” backlash, direct e-mailers must be careful
not to abuse their position — in this market, one bad ap-
ple could spoil the whole lot.
As William Park, CEO of Digital Impact, points out, manyconsumers have made an online purchase (and many morewill in the future), but how many of these consumers havemade that shopping site their homepage? The answer is fewto none. This is where e-mail comes in. E-mail proac-tively reaches users, rather than trying to catch theirattention as they navigate the Web.
Figure 17
Reason For Use of the Internet
92%
83%
55%
53%
49%
35%
35%
31%
29%
0% 10% 20% 30% 40% 50% 60% 70% 80% 90% 100%
Search Engines
Research Products
Research Local Events
News Sites
Online Directory
Dowload Software
Read Magazines
Visit Online Stores
Source: Jupiter Communications
It is estimated that approximately 85% of home computerusers and 75% of workplace computer users conduct per-sonal and business operations via e-mail. As PC and Inter-net access continues to grow, e-mail will only become more
ubiquitous, given its advantages over traditional “old world”media. Some of these advantages are:
• Cost: E-mail can substitute for standard mail, and eventhe telephone, at much more economical prices.
• Virtually real-time distribution: On the Internet, mar-keters get their message out immediately.
• Interactivity: E-mail allows for direct links to Web sites,so consumers can go directly from seeing an ad to conduct-ing more research to actually purchasing the product, com-pleting the sales cycle without interruption.
• Higher Click-Through Rates: While banners are cur-rently generating click-throughs significantly below 1%, e-mail is generating click-throughs in the range of 5-20%.
Table 12
E-mail Marketing Strategies
Acquisition RetentionPermission List Marketing Customer Relationship ManagementSponsored Newsletter Corporate NewsletterSponsored Discussion List Reminder ServiceAdvocacy Marketing (Referrals)Partner Co-marketing
Source: IMT Strategies
Targeting Behavior
E-mail has the potential to be the ultimate direct marketingtool. The reasons cited above (cost, real-time distribution,and interactivity) tell part of the story, but they do not coverthe key advantage: targeting. Direct mail has traditionallybeen the most targeted of all media. Direct mail is used byall sorts of advertisers to reach specific customers whosepast behavior makes them appealing targets for the adver-tiser’s offering. Direct e-mail works on basically the sametheory, but with some added benefits.
Direct e-mail allows advertisers to add users’ past Web be-havior to the database. For example, if a consumer had re-cently been to the Compaq Web site and read about thenewest laptop, direct e-mail would allow Compaq to offer aspecial coupon or more information to that consumer. Thisis the most proactive form of marketing that is currentlyavailable to Web advertisers. While static banners need to

52 MORGAN STANLEY DEAN WITTER
This memorandum is based on information available to the public. No representation is made that it is accurate or complete. This memorandum is not an offer to buy or sell or asolicitation of an offer to buy or sell the securities mentioned. Please refer to the notes at the end of this report.
be noticed and clicked through, a targeted e-mail reaches amore receptive audience and is much more difficult to ig-nore.
Direct e-mail allows advertisers to deliver different ads andoffers to different consumers. Zip codes and local storescan be taken into account. The combination of demo-graphic, geographic, and psychographic data makes direct e-mail a potent tool for customer acquisition and retention.
E-mail proactively reaches users,rather than trying to catch their atten-tion as they navigate the Web.
Targeting on Browsers: Browser Sniffers
In the past, e-mail consisted of text only. Now browsershave been integrated into the e-mail system to allow forlinks and graphics. Users can click on the link in the mes-sage and be transported directly to the related Web site.Additionally, many browsers now have rich-media func-tionality that can send full graphic pictures through e-mail.
Direct e-mail marketers are poised to benefit from this tech-nology using “browser sniffers,” which indicate what typeof browser a user has and then sends the richest form ofmedia that can be viewed on that browser.
Figure 18
E-Mail Targeting – High and Right is Best
One-to-One
Broad
Plain Text/Link
Images andHTML
Interactive& Graphics
Segmented
TargetingGraphics
TargetingOffers
Source: Morgan Stanley Dean Witter Research and Digital Impact
Plain Text Approximately 10% of today’s e-mail users relyon browsers that can support text only, including LotusNotes and Unix Mail. These users will receive text-onlydirect mailings. In order to gain more information, the usermust click on the advertiser’s URL address and will betransported to the site. The response rate to these text-onlyads is 3–4%. This is about 3 times as effective as tradi-tional direct mail.
Clickable Text About 60% of today’s browsers allow for“clickable text.” Eudora 3.0 and Microsoft Exchange sup-port this type of advertisement. With clickable text, the linktakes the user to a site devoted to the offer itself, instead ofthe advertiser’s entire Web site. This allows many links todifferent portions of the advertiser’s site. Response rates onthese ads are 6–8%, or double those of plain text.
HTML E-Mail HTML e-mail allows users to see graphicimages in the message and accounts for about 30% of to-day’s e-mail market. Microsoft’s Hotmail and Netscape’sversions 3.0 and above service HTML e-mail. With HTMLe-mail, users can click on the image or another link to betransported to a site with more information or the actual salepage on the advertiser’s Web site. HTML e-mails typicallygenerate response rates of about 12–15%, three times thelevel of plain text and two times the level of clickable text.
Interactivity is currently being added to e-mail as well (userswill be able to ask questions about an offer or play a game),which should further increase the response rates. Of course,as targeting and interactivity become more commonplace, itis possible that response rates will stabilize and drift lowerfrom current levels as the novelty wears off. This has beenthe case with most new media (see the history of direct mailand, perhaps, Internet banners).
Table 13
E-Mail Response Rates
Click Through Cost per MailPlain Text E-Mail 3-4% $0.02Clickable Text E-Mail 6-8% $0.03HTML E-Mail 12-15% $0.05Average E-Mail 10% $0.04Source: Morgan Stanley Dean Witter Research and Digital Impact
Tracking
Just like ad serving, a consumer’s response to e-mail canbe tracked. The offers that most interested a consumer andthe degree of follow-through can be tracked. Of course,

MORGAN STANLEY DEAN WITTER 53
This memorandum is based on information available to the public. No representation is made that it is accurate or complete. This memorandum is not an offer to buy or sell or asolicitation of an offer to buy or sell the securities mentioned. Please refer to the notes at the end of this report.
once a consumer clicks through the e-mail to the adver-tiser’s site, the consumer’s behavior there can be tracked.Typically, advertisers receive information on what types ofconsumers are responding to different offers and what offersare generating responses.
Why Don’t Advertisers Do This Themselves?
Several obstacles must be overcome before companies cansuccessfully use e-mail as a marketing tool.
• Large technology investments: Companies must workaround potential problems such as “bounced” messages andSpam-blocking software and deal with issues like networkbandwidth utilization, content selection, and management ofmassive databases. These require larger investments intechnology (not to mention an expert staff to manage it)than many advertisers are willing to make themselves.
• Spam: Unsolicited commercial e-mail (UCE), alsoknown as “Spam,” is a major concern among users andInternet service providers (ISPs). A high degree of exper-tise and attention is essential on the part of a companysending e-mail to a large number of prospects. “Opt-in”databases alleviate some of this concern, but they are notfoolproof. This will be discussed further in the “Opt-In vs.Opt-Out” discussion below.
• Online Is Different from Offline: Techniques for add-ing subscribers/recipients and improving response rates aresubstantially different from those used in physical directmail. Because the experience and technology for imple-menting an effective e-mail direct marketing program are sodifferent, good direct offline mailers may not easily trans-form themselves into successful online direct marketers.
Opt-In vs. Opt-Out
How a direct e-mailer generates the database of consumersis of critical importance. In general, two methods are used.
Opt-Out The first is termed “opt-out,” because a consumeris automatically added to the database and must contact thee-mailer to opt out of the program. This is generally usedby advertisers trying to grab as many customers as possible,without much regard for long-term relationships. Theproblem is that consumers receive unsolicited e-mail thatclogs up their inboxes and raises privacy issues.
Opt-In The second way to generate a database requires theconsumer to specifically sign up for inclusion. Termed“opt-in,” consumers that visit a direct e-mailer’s Web sitemay list the areas about which they would like to receiveinformation. With opt-in, consumer acquisition may not bequite as rapid as with opt-out, but a better long-term rela-tionship is formed with the consumer. Consumers are muchmore receptive to advertising when they opted in to a pro-gram. As consumers become more and more inundatedwith e-mail, the use of filters will become more prevalent,and these filters will likely block opt-out e-mail for the sim-ple reason that many consumers aren’t interested. Opt-in e-mail will be much better received.
E-mail exchange programs also exist. In this case, a co-branded e-mail exchange registration page allows consum-ers to opt in for more than one e-mailer’s list. Additionally,some direct e-mail ads have a link to a co-branded site atwhich the consumer can sign up for further e-mail groups inselected areas. This is very similar to the media seller’snetwork of sites. Affiliated sites gain size, scale, and reachby participating. Further, they receive compensation forreferring consumers to other members of the exchange pro-gram, making them more attractive in advertisers’ eyes.
Table 14
Direct E-Marketing Appears to Beat the Rest
Medium Click ThroughConversion of
ClickersBanner 0.5% 1.0%Direct Mail - Purchased List 0.7% NADirect Mail - House List 1.0% NAE-Mail - Purchased List 10% 10%E-Mail - House List 14% 10%Source: Morgan Stanley Dean Witter and IMT Research
Cost
Typically, direct e-mail campaign fees are broken into twotypes. Set-up fees start at about $1,500 per campaign, anddelivery fees are usually $0.02–0.05 per e-mail, but volumediscounts often result in lower fees.
Customer acquisition costs via direct e-mail are muchlower than via direct mail. We estimate that the differenceis approximately 20–30% in favor of direct e-mail.
Customer Acquisition/Retention
It is our belief that direct e-mail’s greatest benefit lies inbuilding customer relationships, rather than simply acquir-

54 MORGAN STANLEY DEAN WITTER
This memorandum is based on information available to the public. No representation is made that it is accurate or complete. This memorandum is not an offer to buy or sell or asolicitation of an offer to buy or sell the securities mentioned. Please refer to the notes at the end of this report.
ing customers. This is opposed to the prevailing Internetwisdom, which encourages dot-coms to grab share of theirrespective markets no matter what the cost. We believe thatcustomer relations and quality will suffer if companiesadopt the “land grab” strategy.
E-mail is much more intrusive than banner advertising oreven interstitial advertisements. For that reason, it must beapproached with more care. Customers receiving unsolic-ited e-mail are much more likely to react negatively thaneven those receiving unsolicited direct mail. Thus, we feelthat opt-in e-mailers with a slowly building sales pitch arebest-positioned in this industry. Rather than focusing onone-time sales, these companies will build relationshipswith customers over the longer-term. After all, getting thethird or fourth sale is much more valuable than getting onlythe first.
Competition
Because of the low barriers to entry, the direct e-mail mar-keting space has many competitors. We believe that severalcharacteristics will separate the winners from the losers.
• Scalability: Those e-mailers with scalable operations,possessing the ability to reach large numbers of consumerswithout incurring large extra costs, will stand out.
• Rich Data: Data on consumers is key for the success ofe-mailers. Collection, management, and interpretation ofdata are important for ad targeters and direct e-mailers.
Those with the most rich data on the greatest numbers ofpeople will be best-positioned.
• Relationship Management: In our minds, direct e-mailis not a customer acquisition tool. Rather, it is a customerrelationship management tool. The successful e-mailerswill view it this way and act accordingly.
• On- and Offline Convergence: Eventually, due to itslow costs and incredible targeting ability, direct e-mail willbecome a complete direct marketing solution. Both on- andoffline advertisers will use it to enhance their businesses.The e-mailers that position themselves for this coming con-vergence will be best prepared to beat out their competitors.
COMPETITORS:
½ Avenue A — AVEA
½ Cybergold — CGLD
½ Digital Impact — DIGI
½ DoubleClick — DCLK
½ Message Media — MESG
½ MyPoints.com — MYPT
½ 24/7 Media — TFSM
½ YesMail — (Acquired by CMGI)
MORGAN STANLEY DEAN WITTER 55
This memorandum is based on information available to the public. No representation is made that it is accurate or complete. This memorandum is not an offer to buy or sell or asolicitation of an offer to buy or sell the securities mentioned. Please refer to the notes at the end of this report.
Category Profile: Online Couponing & Promotions
KEY POINTS:
½ Internet purchasers like to save money — 74% buy online
because of lower prices. 33% use online coupons to save
money on the Web. Almost 50% were motivated by an
online coupon to make an offline purchase.
½ Internet purchasers also like to save time. Internet cou-
poners offer convenient savings through “pull” sites and
“push” e-mail that are much easier to use than traditional
savings tools.
½ The best couponers will allow users to redeem their cou-
pons online or offline. In the future, paper coupons may
be phased out as savings are transferred directly to debit,
credit, or shopper cards.
Jupiter Communications reports that 74% of Internet pur-chasers choose to buy online because of the lower pricesthey have found there. Further, of those consumers who aremotivated by an online source to purchase a product in theoffline world, an online coupon motivated 49%. Separately,NPD Online Research reports that nearly one-third of thoseon the Internet are using online coupons to save money onthe Web.
It is important to note that we do not consider e-couponingthe same as direct e-marketing, just as we separate directmail from coupons in the traditional space. However, cou-poners can use direct marketing to distribute their coupons.
The same can be said for loyalty marketing programs, whichin the traditional space end up as some sort of promotionspending. Because of the database aspect of this business,in the e-marketing world loyalty marketing can also seemlike direct marketing.
Coupons & Promotions:The Internet Marketing Sweet Spot?
Couponers and promoters on the Internet sit in a very nicesweet spot. For several reasons, their marketing and abilityto provide advertisers with high rates of return are virtuallyunparalleled.
• Users and their behavior do not need to be tracked acrossthe Internet, as users go to the couponer’s home page toconduct transactions. There, couponers compile informa-tion on their various interests, often at the behest of the con-sumer.
• Couponers and promoters typically require registrationinformation, so they immediately obtain very valuable in-formation on consumers.
• Couponing is by definition an opt-in process. Thus, mar-keters can be assured that they are reaching a receptiveaudience.
• The demographics of Internet users, and those who signup for online couponing in particular, are very attractive.This has caused many offline businesses to offer onlinecoupons, even if they don’t ever expect to offer e-commerce.
Targeting
Through the use of coupons and rewards programs, market-ers are able to closely monitor what consumers are pur-chasing, due to the simple fact that consumers must redeemtheir coupons or report what they are purchasing in order togenerate points. The same is true on the Internet, but to amuch greater extent. Consumers clicking on certain cou-pons are obviously interested in those types of products, sospecific marketing can be targeted at them even if they don’tmake a purchase.
In addition to the clickstream monitoring, couponers typi-cally gather a great deal of information on consumersthrough the registration process, which allows advertisers totarget specific individuals depending on self-described likesand dislikes.
Rewards Programs
It is our belief that rewards programs on the Internet will bebig, like the “frequent-flier” programs currently offered off-line. By purchasing goods on the Internet, consumers ac-cumulate points that can be applied to the purchase of fur-ther products. Many companies are currently linking onlineand offline rewards programs, thereby allowing consumers

56 MORGAN STANLEY DEAN WITTER
This memorandum is based on information available to the public. No representation is made that it is accurate or complete. This memorandum is not an offer to buy or sell or asolicitation of an offer to buy or sell the securities mentioned. Please refer to the notes at the end of this report.
to accumulate points through both online and offline pur-chases.
The key to any such reward program is the marketer’s abil-ity to migrate consumers up the value chain. By gently en-couraging consumers to make larger purchases — therebyearning more points — marketers are able realize the great-est benefits.
Drivers of Success for Internet Couponers & Promoters
While there is no set template that Internet couponers mustfollow to ensure success, we believe there are certain issuesthat will distinguish the winners.
• The Offer: Marketers must optimize their targeting, us-ing all of the information available to drive up conversionratios.
• The Coupon: For offline marketers, the coupon itselfmust be easily printable, but not easily duplicable. For on-line marketers, the coupon must offer a seamless ability topurchase the product online.
• Privacy: Online couponers generate a great deal of in-formation on consumers that must be handled carefully andprudently. Clear privacy statements should be posted, andcouponers must stick by them. Failure to do so may resultin a mass exodus of consumers.
• Customer Relations: We feel that too many Internetcompanies are sacrificing good customer relationships in ascramble for customer acquisitions. Those couponers thatestablish good relationships through quality service andprudent use of consumer data will profit in the long term.Those who simply try to impress Wall Street with the num-ber of customers acquired will fall behind.
The Future
In the future, we believe that those couponers who integrateredemption across the offline and online worlds will benefitthe most from the development of online coupons. Lookingfurther ahead, we believe that the actual paper coupon willdisappear and be replaced by automatic transfers via creditcard. Some couponers are already doing this, in one in-stance allowing a consumer to “clip” an online coupon for arestaurant and have the savings transferred directly to his orher credit card to be redeemed in the future. Cybergoldgoes even further to allow its cyber dollars to be transferreddirectly to customers’ credit cards for use in purchasinganything.
COMPETITORS:
½ CoolSavings.com — Has filed to go public
½ CouponSurfer.com — Private
½ Cybergold — CGLD
½ Directcoupons.com — Private
½ e-centives.com — Private
½ e-maildirect — Private
½ Hotcoupons.com — Private
½ MyPoints.com — MYPT
½ Planet U. — Owned by News Corp. (NWS)
½ Save.com — Owned by Valassis (VCI)
½ ValPak — Owned by offline direct mailer ValPak
½ Valupage.com — Owned by Catalina Marketing (POS)
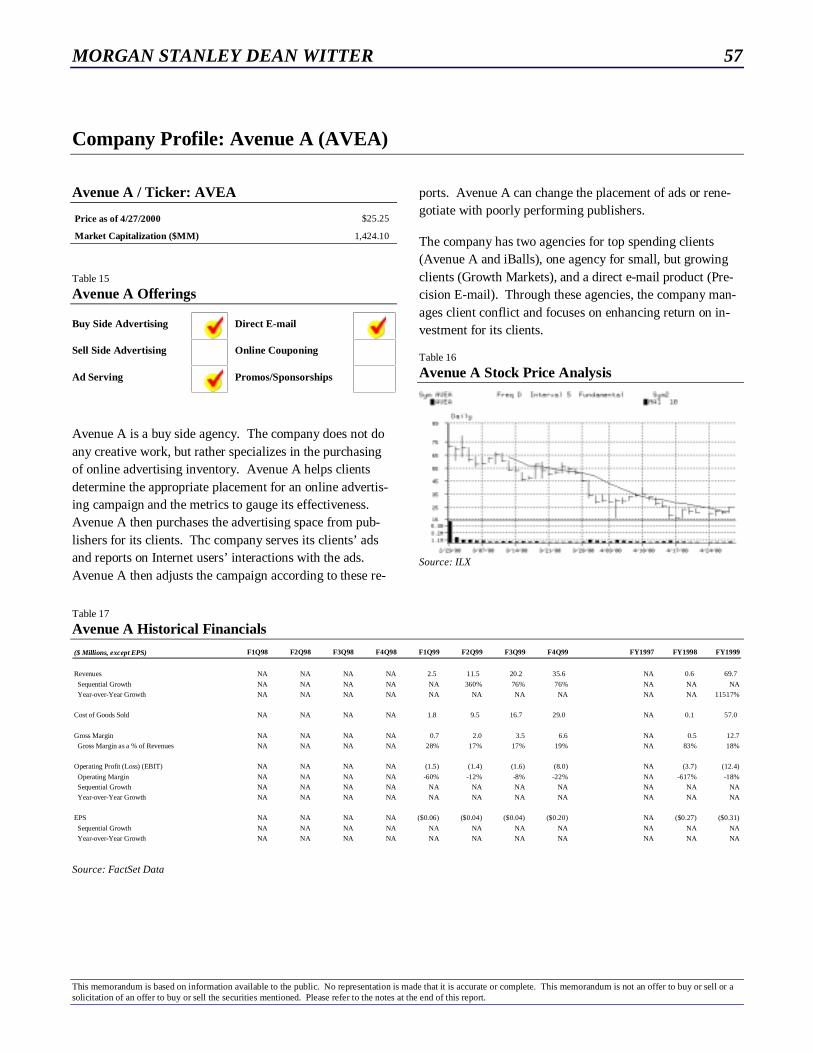
MORGAN STANLEY DEAN WITTER 57
This memorandum is based on information available to the public. No representation is made that it is accurate or complete. This memorandum is not an offer to buy or sell or asolicitation of an offer to buy or sell the securities mentioned. Please refer to the notes at the end of this report.
Company Profile: Avenue A (AVEA)
Avenue A / Ticker: AVEA
Price as of 4/27/2000 $25.25
Market Capitalization ($MM) 1,424.10
Table 15
Avenue A Offerings
Buy Side Advertising Direct E-mail
Sell Side Advertising Online Couponing
Ad Serving Promos/Sponsorships
Avenue A is a buy side agency. The company does not doany creative work, but rather specializes in the purchasingof online advertising inventory. Avenue A helps clientsdetermine the appropriate placement for an online advertis-ing campaign and the metrics to gauge its effectiveness.Avenue A then purchases the advertising space from pub-lishers for its clients. Thc company serves its clients’ adsand reports on Internet users’ interactions with the ads.Avenue A then adjusts the campaign according to these re-
ports. Avenue A can change the placement of ads or rene-gotiate with poorly performing publishers.
The company has two agencies for top spending clients(Avenue A and iBalls), one agency for small, but growingclients (Growth Markets), and a direct e-mail product (Pre-cision E-mail). Through these agencies, the company man-ages client conflict and focuses on enhancing return on in-vestment for its clients.
Table 16
Avenue A Stock Price Analysis
Source: ILX
Table 17
Avenue A Historical Financials
($ Millions, except EPS) F1Q98 F2Q98 F3Q98 F4Q98 F1Q99 F2Q99 F3Q99 F4Q99 FY1997 FY1998 FY1999
Revenues NA NA NA NA 2.5 11.5 20.2 35.6 NA 0.6 69.7
Sequential Growth NA NA NA NA NA 360% 76% 76% NA NA NA
Year-over-Year Growth NA NA NA NA NA NA NA NA NA NA 11517%
Cost of Goods Sold NA NA NA NA 1.8 9.5 16.7 29.0 NA 0.1 57.0
Gross Margin NA NA NA NA 0.7 2.0 3.5 6.6 NA 0.5 12.7
Gross Margin as a % of Revenues NA NA NA NA 28% 17% 17% 19% NA 83% 18%
Operating Profit (Loss) (EBIT) NA NA NA NA (1.5) (1.4) (1.6) (8.0) NA (3.7) (12.4)
Operating Margin NA NA NA NA -60% -12% -8% -22% NA -617% -18%
Sequential Growth NA NA NA NA NA NA NA NA NA NA NA
Year-over-Year Growth NA NA NA NA NA NA NA NA NA NA NA
EPS NA NA NA NA ($0.06) ($0.04) ($0.04) ($0.20) NA ($0.27) ($0.31)
Sequential Growth NA NA NA NA NA NA NA NA NA NA NA
Year-over-Year Growth NA NA NA NA NA NA NA NA NA NA NA
Source: FactSet Data
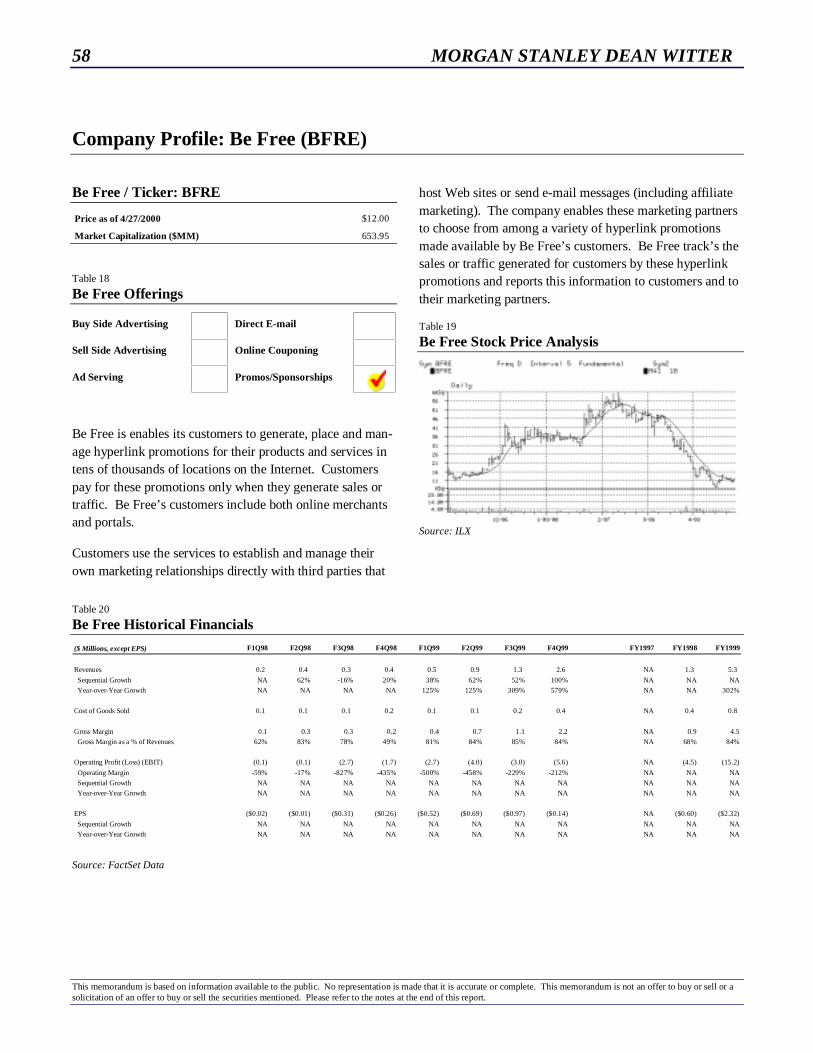
58 MORGAN STANLEY DEAN WITTER
This memorandum is based on information available to the public. No representation is made that it is accurate or complete. This memorandum is not an offer to buy or sell or asolicitation of an offer to buy or sell the securities mentioned. Please refer to the notes at the end of this report.
Company Profile: Be Free (BFRE)
Be Free / Ticker: BFRE
Price as of 4/27/2000 $12.00
Market Capitalization ($MM) 653.95
Table 18
Be Free Offerings
Buy Side Advertising Direct E-mail
Sell Side Advertising Online Couponing
Ad Serving Promos/Sponsorships
Be Free is enables its customers to generate, place and man-age hyperlink promotions for their products and services intens of thousands of locations on the Internet. Customerspay for these promotions only when they generate sales ortraffic. Be Free’s customers include both online merchantsand portals.
Customers use the services to establish and manage theirown marketing relationships directly with third parties that
host Web sites or send e-mail messages (including affiliatemarketing). The company enables these marketing partnersto choose from among a variety of hyperlink promotionsmade available by Be Free’s customers. Be Free track’s thesales or traffic generated for customers by these hyperlinkpromotions and reports this information to customers and totheir marketing partners.
Table 19
Be Free Stock Price Analysis
Source: ILX
Table 20
Be Free Historical Financials
($ Millions, except EPS) F1Q98 F2Q98 F3Q98 F4Q98 F1Q99 F2Q99 F3Q99 F4Q99 FY1997 FY1998 FY1999
Revenues 0.2 0.4 0.3 0.4 0.5 0.9 1.3 2.6 NA 1.3 5.3
Sequential Growth NA 62% -16% 20% 38% 62% 52% 100% NA NA NA
Year-over-Year Growth NA NA NA NA 125% 125% 309% 579% NA NA 302%
Cost of Goods Sold 0.1 0.1 0.1 0.2 0.1 0.1 0.2 0.4 NA 0.4 0.8
Gross Margin 0.1 0.3 0.3 0.2 0.4 0.7 1.1 2.2 NA 0.9 4.5
Gross Margin as a % of Revenues 62% 83% 78% 49% 81% 84% 85% 84% NA 68% 84%
Operating Profit (Loss) (EBIT) (0.1) (0.1) (2.7) (1.7) (2.7) (4.0) (3.0) (5.6) NA (4.5) (15.2)
Operating Margin -59% -17% -827% -435% -500% -458% -229% -212% NA NA NA
Sequential Growth NA NA NA NA NA NA NA NA NA NA NA
Year-over-Year Growth NA NA NA NA NA NA NA NA NA NA NA
EPS ($0.02) ($0.01) ($0.31) ($0.26) ($0.52) ($0.69) ($0.97) ($0.14) NA ($0.60) ($2.32)
Sequential Growth NA NA NA NA NA NA NA NA NA NA NA
Year-over-Year Growth NA NA NA NA NA NA NA NA NA NA NA
Source: FactSet Data

MORGAN STANLEY DEAN WITTER 59
This memorandum is based on information available to the public. No representation is made that it is accurate or complete. This memorandum is not an offer to buy or sell or asolicitation of an offer to buy or sell the securities mentioned. Please refer to the notes at the end of this report.
Company Profile: Cybergold (CGLD)
Cybergold / Ticker: CGLD
Price as of 4/27/2000 $7.25
Market Capitalization ($MM) 140.11
Table 21
Cybergold Offerings
Buy Side Advertising Direct E-mail
Sell Side Advertising Online Couponing
Ad Serving Promos/Sponsorships
Cybergold is a leading provider of Internet-based directmarketing and advertising solutions. The company com-bines Internet-based direct marketing and advertising serv-ices with programs that reward consumers with cash whenthey perform actions desired by advertisers. The company’sadvertisers are only charged when members execute specificpredefined actions.
Cybergold’s business revolves around “The Earn & SpendCommunity” — a place on the Internet where consumers
can earn cash incentives for responding to online marketingoffers presented by Cybergold’s advertising and marketingclients and then spend the cash with merchants. The cashearned by consumer members can be credited to either theirVISA or bank accounts from their Cybergold account or beused to purchase content, services and products, includingsoftware, music, games, credit reporting services, and origi-nal art works and publications.
Table 22
Cybergold Stock Price Analysis
Source: ILX
Table 23
Cybergold Historical Financials
($ Millions, except EPS) F1Q98 F2Q98 F3Q98 F4Q98 F1Q99 F2Q99 F3Q99 F4Q99 FY1997 FY1998 FY1999
Revenues 0.1 0.2 0.3 0.5 0.5 0.8 1.4 2.6 NA 1.0 5.3
Sequential Growth NA 53% 73% 59% 12% 54% 78% 92% NA NA NA
Year-over-Year Growth NA NA NA NA 370% 372% 387% 487% NA NA 428%
Cost of Goods Sold 0.0 2.7 0.1 3.2 0.2 0.6 0.6 0.8 NA 0.5 2.2
Gross Margin 0.1 -2.5 0.1 -2.7 0.3 0.2 0.8 1.8 NA 0.5 3.1
Gross Margin as a % of Revenues 67% -1522% 50% -608% 51% 26% 60% 68% NA 54% 58%
Operating Profit (Loss) (EBIT) (1.2) (2.4) (1.1) (2.4) (1.7) (4.0) (2.9) (3.8) NA (4.6) (4.7)
Operating Margin -1140% -1449% -398% -533% -345% -512% -212% -144% NA -456% -89%
Sequential Growth NA NA NA NA NA NA NA NA NA NA NA
Year-over-Year Growth NA NA NA NA NA NA NA NA NA NA NA
EPS ($0.33) ($0.29) ($0.35) ($0.38) ($0.53) ($0.62) ($0.67) ($0.17) NA ($0.20) ($1.35)
Sequential Growth NA NA NA NA NA NA NA NA NA NA NA
Year-over-Year Growth NA NA NA NA NA NA NA NA NA NA NA
Source: FactSet Data

60 MORGAN STANLEY DEAN WITTER
This memorandum is based on information available to the public. No representation is made that it is accurate or complete. This memorandum is not an offer to buy or sell or asolicitation of an offer to buy or sell the securities mentioned. Please refer to the notes at the end of this report.
Company Profile: Digital Impact (DIGI)
Digital Impact / Ticker: DIGI
Price as of 4/27/2000 $11.44
Market Capitalization ($MM) 269.34
Table 24
Digital Impact Offerings
Buy Side Advertising Direct E-mail
Sell Side Advertising Online Couponing
Ad Serving Promos/Sponsorships
Digital Impact offers Internet direct marketing services tobusinesses that wish to communicate more effectively withtheir customers online through e-mail. E-mail campaigns,are designed to maximize the client’s return on its marketinginvestment.
The company’s core set of services includes campaign man-agement, targeting and personalization, e-mail format opti-
mization, campaign tracking and reporting, and databasehosting and management. Digital Impact recently intro-duced the E-mail Exchange Network, an online marketingnetwork that provides clients with a new method to acquireadditional online customers. Digital Impact offers clients asuite of e-marketing services that includes e-mail campaignservices, customer acquisition tools, customer data analysisand strategic consulting services.
Table 25
Digital Impact Stock Price Analysis
Source: ILX
Table 26
Digital Impact Historical Financials
($ Millions, except EPS) F1Q98 F2Q98 F3Q98 F4Q98 F1Q99 F2Q99 F3Q99 F4Q99 FY1997 FY1998 FY1999
Revenues NA 0.0 0.1 0.4 0.8 1.4 1.9 4.0 NA NA 1.3
Sequential Growth NA NA 284% 313% 99% 75% 35% 114% NA NA NA
Year-over-Year Growth NA NA NA NA NA 5440% 1850% 913% NA NA NA
Cost of Goods Sold NA 0.0 0.1 0.2 0.4 0.7 1.6 1.9 NA NA 0.7
Gross Margin NA 0.0 0.0 0.2 0.4 0.7 0.3 2.1 NA NA 0.6
Gross Margin as a % of Revenues NA 4% 9% 52% 50% 51% 14% 52% NA NA 48%
Operating Profit (Loss) (EBIT) NA (0.3) (0.6) (0.6) (2.0) (3.2) (8.8) (6.4) NA NA (3.2)
Operating Margin NA -1212% -675% -139% -259% -228% -470% -160% NA NA -248%
Sequential Growth NA NA NA NA NA NA NA NA NA NA NA
Year-over-Year Growth NA NA NA NA NA NA NA NA NA NA NA
EPS NA ($0.90) ($1.05) ($0.30) ($1.81) ($1.06) ($1.89) ($0.60) NA NA ($2.86)
Sequential Growth NA NA NA NA NA NA NA NA NA NA NA
Year-over-Year Growth NA NA NA NA NA NA NA NA NA NA NA
Source: FactSet Data
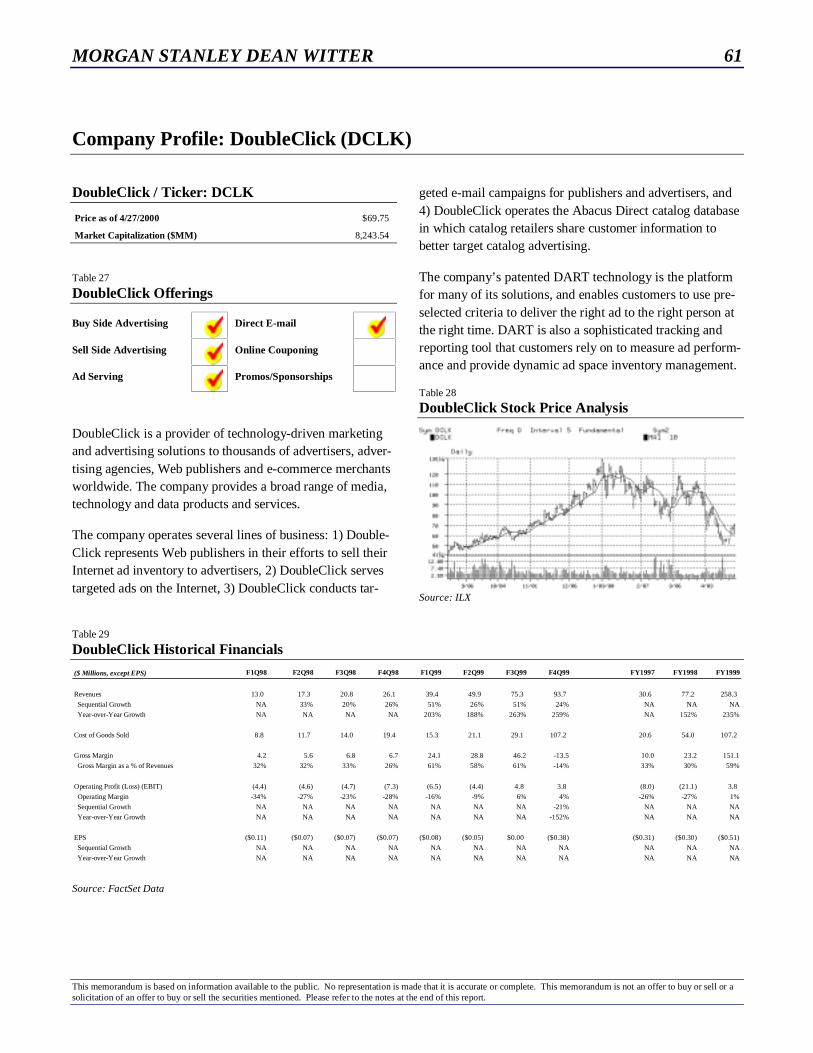
MORGAN STANLEY DEAN WITTER 61
This memorandum is based on information available to the public. No representation is made that it is accurate or complete. This memorandum is not an offer to buy or sell or asolicitation of an offer to buy or sell the securities mentioned. Please refer to the notes at the end of this report.
Company Profile: DoubleClick (DCLK)
DoubleClick / Ticker: DCLK
Price as of 4/27/2000 $69.75
Market Capitalization ($MM) 8,243.54
Table 27
DoubleClick Offerings
Buy Side Advertising Direct E-mail
Sell Side Advertising Online Couponing
Ad Serving Promos/Sponsorships
DoubleClick is a provider of technology-driven marketingand advertising solutions to thousands of advertisers, adver-tising agencies, Web publishers and e-commerce merchantsworldwide. The company provides a broad range of media,technology and data products and services.
The company operates several lines of business: 1) Double-Click represents Web publishers in their efforts to sell theirInternet ad inventory to advertisers, 2) DoubleClick servestargeted ads on the Internet, 3) DoubleClick conducts tar-
geted e-mail campaigns for publishers and advertisers, and4) DoubleClick operates the Abacus Direct catalog databasein which catalog retailers share customer information tobetter target catalog advertising.
The company’s patented DART technology is the platformfor many of its solutions, and enables customers to use pre-selected criteria to deliver the right ad to the right person atthe right time. DART is also a sophisticated tracking andreporting tool that customers rely on to measure ad perform-ance and provide dynamic ad space inventory management.
Table 28
DoubleClick Stock Price Analysis
Source: ILX
Table 29
DoubleClick Historical Financials
($ Millions, except EPS) F1Q98 F2Q98 F3Q98 F4Q98 F1Q99 F2Q99 F3Q99 F4Q99 FY1997 FY1998 FY1999
Revenues 13.0 17.3 20.8 26.1 39.4 49.9 75.3 93.7 30.6 77.2 258.3
Sequential Growth NA 33% 20% 26% 51% 26% 51% 24% NA NA NA
Year-over-Year Growth NA NA NA NA 203% 188% 263% 259% NA 152% 235%
Cost of Goods Sold 8.8 11.7 14.0 19.4 15.3 21.1 29.1 107.2 20.6 54.0 107.2
Gross Margin 4.2 5.6 6.8 6.7 24.1 28.8 46.2 -13.5 10.0 23.2 151.1
Gross Margin as a % of Revenues 32% 32% 33% 26% 61% 58% 61% -14% 33% 30% 59%
Operating Profit (Loss) (EBIT) (4.4) (4.6) (4.7) (7.3) (6.5) (4.4) 4.8 3.8 (8.0) (21.1) 3.8
Operating Margin -34% -27% -23% -28% -16% -9% 6% 4% -26% -27% 1%
Sequential Growth NA NA NA NA NA NA NA -21% NA NA NA
Year-over-Year Growth NA NA NA NA NA NA NA -152% NA NA NA
EPS ($0.11) ($0.07) ($0.07) ($0.07) ($0.08) ($0.05) $0.00 ($0.38) ($0.31) ($0.30) ($0.51)
Sequential Growth NA NA NA NA NA NA NA NA NA NA NA
Year-over-Year Growth NA NA NA NA NA NA NA NA NA NA NA
Source: FactSet Data
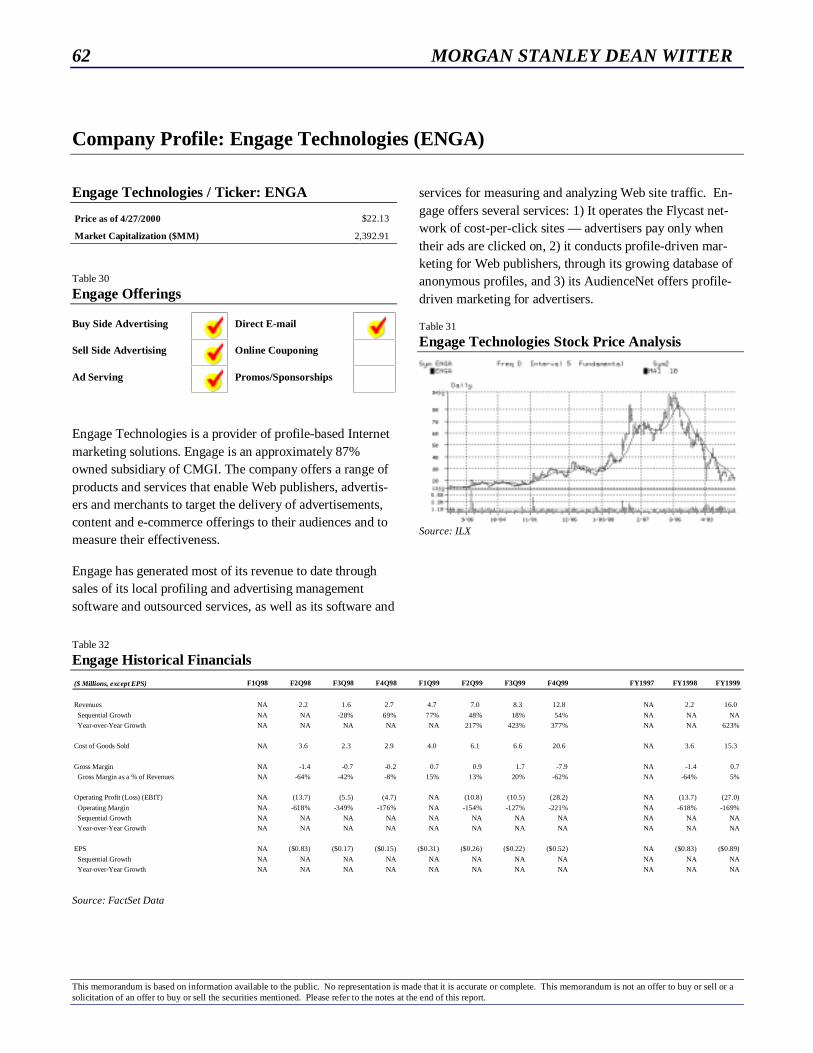
62 MORGAN STANLEY DEAN WITTER
This memorandum is based on information available to the public. No representation is made that it is accurate or complete. This memorandum is not an offer to buy or sell or asolicitation of an offer to buy or sell the securities mentioned. Please refer to the notes at the end of this report.
Company Profile: Engage Technologies (ENGA)
Engage Technologies / Ticker: ENGA
Price as of 4/27/2000 $22.13
Market Capitalization ($MM) 2,392.91
Table 30
Engage Offerings
Buy Side Advertising Direct E-mail
Sell Side Advertising Online Couponing
Ad Serving Promos/Sponsorships
Engage Technologies is a provider of profile-based Internetmarketing solutions. Engage is an approximately 87%owned subsidiary of CMGI. The company offers a range ofproducts and services that enable Web publishers, advertis-ers and merchants to target the delivery of advertisements,content and e-commerce offerings to their audiences and tomeasure their effectiveness.
Engage has generated most of its revenue to date throughsales of its local profiling and advertising managementsoftware and outsourced services, as well as its software and
services for measuring and analyzing Web site traffic. En-gage offers several services: 1) It operates the Flycast net-work of cost-per-click sites — advertisers pay only whentheir ads are clicked on, 2) it conducts profile-driven mar-keting for Web publishers, through its growing database ofanonymous profiles, and 3) its AudienceNet offers profile-driven marketing for advertisers.
Table 31
Engage Technologies Stock Price Analysis
Source: ILX
Table 32
Engage Historical Financials
($ Millions, except EPS) F1Q98 F2Q98 F3Q98 F4Q98 F1Q99 F2Q99 F3Q99 F4Q99 FY1997 FY1998 FY1999
Revenues NA 2.2 1.6 2.7 4.7 7.0 8.3 12.8 NA 2.2 16.0
Sequential Growth NA NA -28% 69% 77% 48% 18% 54% NA NA NA
Year-over-Year Growth NA NA NA NA NA 217% 423% 377% NA NA 623%
Cost of Goods Sold NA 3.6 2.3 2.9 4.0 6.1 6.6 20.6 NA 3.6 15.3
Gross Margin NA -1.4 -0.7 -0.2 0.7 0.9 1.7 -7.9 NA -1.4 0.7
Gross Margin as a % of Revenues NA -64% -42% -8% 15% 13% 20% -62% NA -64% 5%
Operating Profit (Loss) (EBIT) NA (13.7) (5.5) (4.7) NA (10.8) (10.5) (28.2) NA (13.7) (27.0)
Operating Margin NA -618% -349% -176% NA -154% -127% -221% NA -618% -169%
Sequential Growth NA NA NA NA NA NA NA NA NA NA NA
Year-over-Year Growth NA NA NA NA NA NA NA NA NA NA NA
EPS NA ($0.83) ($0.17) ($0.15) ($0.31) ($0.26) ($0.22) ($0.52) NA ($0.83) ($0.89)
Sequential Growth NA NA NA NA NA NA NA NA NA NA NA
Year-over-Year Growth NA NA NA NA NA NA NA NA NA NA NA
Source: FactSet Data
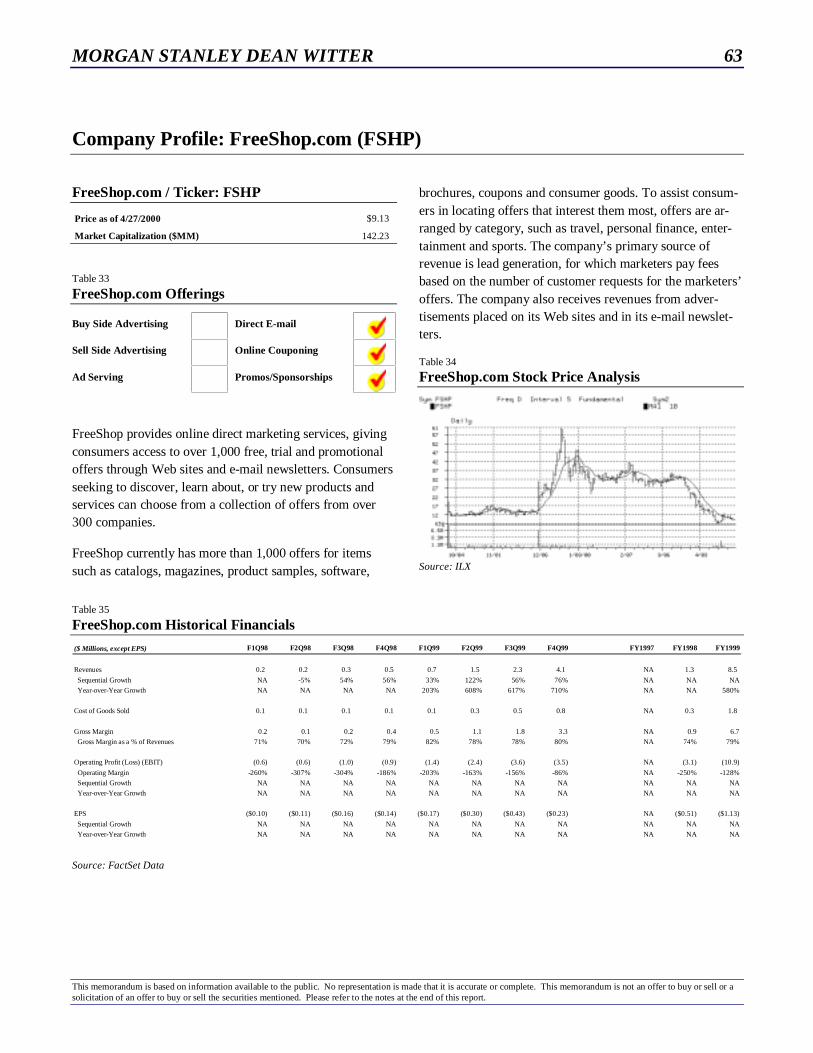
MORGAN STANLEY DEAN WITTER 63
This memorandum is based on information available to the public. No representation is made that it is accurate or complete. This memorandum is not an offer to buy or sell or asolicitation of an offer to buy or sell the securities mentioned. Please refer to the notes at the end of this report.
Company Profile: FreeShop.com (FSHP)
FreeShop.com / Ticker: FSHP
Price as of 4/27/2000 $9.13
Market Capitalization ($MM) 142.23
Table 33
FreeShop.com Offerings
Buy Side Advertising Direct E-mail
Sell Side Advertising Online Couponing
Ad Serving Promos/Sponsorships
FreeShop provides online direct marketing services, givingconsumers access to over 1,000 free, trial and promotionaloffers through Web sites and e-mail newsletters. Consumersseeking to discover, learn about, or try new products andservices can choose from a collection of offers from over300 companies.
FreeShop currently has more than 1,000 offers for itemssuch as catalogs, magazines, product samples, software,
brochures, coupons and consumer goods. To assist consum-ers in locating offers that interest them most, offers are ar-ranged by category, such as travel, personal finance, enter-tainment and sports. The company’s primary source ofrevenue is lead generation, for which marketers pay feesbased on the number of customer requests for the marketers’offers. The company also receives revenues from adver-tisements placed on its Web sites and in its e-mail newslet-ters.
Table 34
FreeShop.com Stock Price Analysis
Source: ILX
Table 35
FreeShop.com Historical Financials
($ Millions, except EPS) F1Q98 F2Q98 F3Q98 F4Q98 F1Q99 F2Q99 F3Q99 F4Q99 FY1997 FY1998 FY1999
Revenues 0.2 0.2 0.3 0.5 0.7 1.5 2.3 4.1 NA 1.3 8.5
Sequential Growth NA -5% 54% 56% 33% 122% 56% 76% NA NA NA
Year-over-Year Growth NA NA NA NA 203% 608% 617% 710% NA NA 580%
Cost of Goods Sold 0.1 0.1 0.1 0.1 0.1 0.3 0.5 0.8 NA 0.3 1.8
Gross Margin 0.2 0.1 0.2 0.4 0.5 1.1 1.8 3.3 NA 0.9 6.7
Gross Margin as a % of Revenues 71% 70% 72% 79% 82% 78% 78% 80% NA 74% 79%
Operating Profit (Loss) (EBIT) (0.6) (0.6) (1.0) (0.9) (1.4) (2.4) (3.6) (3.5) NA (3.1) (10.9)
Operating Margin -260% -307% -304% -186% -203% -163% -156% -86% NA -250% -128%
Sequential Growth NA NA NA NA NA NA NA NA NA NA NA
Year-over-Year Growth NA NA NA NA NA NA NA NA NA NA NA
EPS ($0.10) ($0.11) ($0.16) ($0.14) ($0.17) ($0.30) ($0.43) ($0.23) NA ($0.51) ($1.13)
Sequential Growth NA NA NA NA NA NA NA NA NA NA NA
Year-over-Year Growth NA NA NA NA NA NA NA NA NA NA NA
Source: FactSet Data
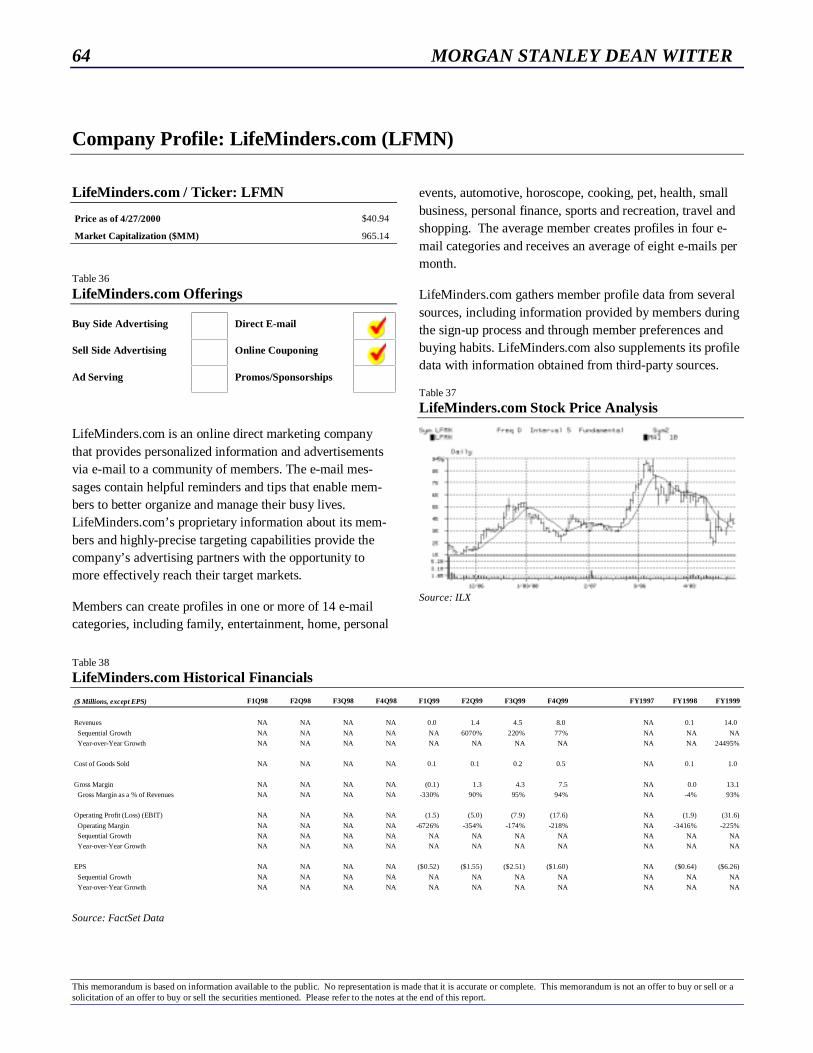
64 MORGAN STANLEY DEAN WITTER
This memorandum is based on information available to the public. No representation is made that it is accurate or complete. This memorandum is not an offer to buy or sell or asolicitation of an offer to buy or sell the securities mentioned. Please refer to the notes at the end of this report.
Company Profile: LifeMinders.com (LFMN)
LifeMinders.com / Ticker: LFMN
Price as of 4/27/2000 $40.94
Market Capitalization ($MM) 965.14
Table 36
LifeMinders.com Offerings
Buy Side Advertising Direct E-mail
Sell Side Advertising Online Couponing
Ad Serving Promos/Sponsorships
LifeMinders.com is an online direct marketing companythat provides personalized information and advertisementsvia e-mail to a community of members. The e-mail mes-sages contain helpful reminders and tips that enable mem-bers to better organize and manage their busy lives.LifeMinders.com’s proprietary information about its mem-bers and highly-precise targeting capabilities provide thecompany’s advertising partners with the opportunity tomore effectively reach their target markets.
Members can create profiles in one or more of 14 e-mailcategories, including family, entertainment, home, personal
events, automotive, horoscope, cooking, pet, health, smallbusiness, personal finance, sports and recreation, travel andshopping. The average member creates profiles in four e-mail categories and receives an average of eight e-mails permonth.
LifeMinders.com gathers member profile data from severalsources, including information provided by members duringthe sign-up process and through member preferences andbuying habits. LifeMinders.com also supplements its profiledata with information obtained from third-party sources.
Table 37
LifeMinders.com Stock Price Analysis
Source: ILX
Table 38
LifeMinders.com Historical Financials
($ Millions, except EPS) F1Q98 F2Q98 F3Q98 F4Q98 F1Q99 F2Q99 F3Q99 F4Q99 FY1997 FY1998 FY1999
Revenues NA NA NA NA 0.0 1.4 4.5 8.0 NA 0.1 14.0
Sequential Growth NA NA NA NA NA 6070% 220% 77% NA NA NA
Year-over-Year Growth NA NA NA NA NA NA NA NA NA NA 24495%
Cost of Goods Sold NA NA NA NA 0.1 0.1 0.2 0.5 NA 0.1 1.0
Gross Margin NA NA NA NA (0.1) 1.3 4.3 7.5 NA 0.0 13.1
Gross Margin as a % of Revenues NA NA NA NA -330% 90% 95% 94% NA -4% 93%
Operating Profit (Loss) (EBIT) NA NA NA NA (1.5) (5.0) (7.9) (17.6) NA (1.9) (31.6)
Operating Margin NA NA NA NA -6726% -354% -174% -218% NA -3416% -225%
Sequential Growth NA NA NA NA NA NA NA NA NA NA NA
Year-over-Year Growth NA NA NA NA NA NA NA NA NA NA NA
EPS NA NA NA NA ($0.52) ($1.55) ($2.51) ($1.60) NA ($0.64) ($6.26)
Sequential Growth NA NA NA NA NA NA NA NA NA NA NA
Year-over-Year Growth NA NA NA NA NA NA NA NA NA NA NA
Source: FactSet Data

MORGAN STANLEY DEAN WITTER 65
This memorandum is based on information available to the public. No representation is made that it is accurate or complete. This memorandum is not an offer to buy or sell or asolicitation of an offer to buy or sell the securities mentioned. Please refer to the notes at the end of this report.
Company Profile: L90 (LNTY)
L90 / Ticker: LNTY
Price as of 4/27/2000 $9.06
Market Capitalization ($MM) 60.66
Table 39
L90 Offerings
Buy Side Advertising Direct E-mail
Sell Side Advertising Online Couponing
Ad Serving Promos/Sponsorships
L90 provides advertising and direct marketing solutions foradvertisers and Web publishers. The company designs andimplements advertising campaigns for clients and placestheir ads on its network of Web sites. The company providesWeb publishing clients with a fully-outsourced solutionwhich includes the sale of advertising space on their Websites, as well as the technology required to deliver adver-tisements to their Web sites.
L90 specializes in creating advertising campaigns that in-corporate sponsorships. Sponsorships integrate advertise-ments into the text or graphic content of a Web page. L90’sadMonitor enables advertising and Web publishing clientsto implement sophisticated advertising campaigns quicklyand to selectively target ads to Web users based upon spe-cific interests and characteristics. adMonitor also enablesclients to track, measure and manage the effectiveness oftheir ad campaigns.
Table 40
L90 Stock Price Analysis
Source: ILX
Table 41
L90 Historical Financials
($ Millions, except EPS) F1Q98 F2Q98 F3Q98 F4Q98 F1Q99 F2Q99 F3Q99 F4Q99 FY1997 FY1998 FY1999
Revenues NA NA NA NA 0.8 1.2 2.1 5.2 NA NA 2.2
Sequential Growth NA NA NA NA NA 55% 76% 155% NA NA NA
Year-over-Year Growth NA NA NA NA NA NA NA NA NA NA NA
Cost of Goods Sold NA NA NA NA 0.0 0.3 1.0 3.4 NA NA 4.8
Gross Margin NA NA NA NA 0.8 0.9 1.0 1.8 NA NA -2.6
Gross Margin as a % of Revenues NA NA NA NA 100% 74% 50% 35% NA NA -117%
Operating Profit (Loss) (EBIT) NA NA NA NA (1.5) (5.0) (7.9) (17.6) NA NA (0.3)
Operating Margin NA NA NA NA -205% -430% -385% -336% NA NA -13%
Sequential Growth NA NA NA NA NA NA NA NA NA NA NA
Year-over-Year Growth NA NA NA NA NA NA NA NA NA NA NA
EPS NA NA NA NA ($0.17) ($0.25) ($0.45) ($0.48) NA NA ($0.05)
Sequential Growth NA NA NA NA NA NA NA NA NA NA NA
Year-over-Year Growth NA NA NA NA NA NA NA NA NA NA NA
Source: FactSet Data

66 MORGAN STANLEY DEAN WITTER
This memorandum is based on information available to the public. No representation is made that it is accurate or complete. This memorandum is not an offer to buy or sell or asolicitation of an offer to buy or sell the securities mentioned. Please refer to the notes at the end of this report.
Company Profile: Media Metrix (MMXI)
Media Metrix / Ticker: MMXI
Price as of 4/27/2000 $33.00
Market Capitalization ($MM) 649.51
Table 42
Media Metrix Offerings
Buy Side Advertising Direct E-mail
Sell Side Advertising Online Couponing
Ad Serving Promos/Sponsorships
Internet Measurement
Media Metrix provides Internet audience measurementproducts and services to leading Internet advertisers andadvertising agencies, Internet properties, technology com-panies, and financial institutions. Media Metrix measuresusage of the entire Internet, including its largest segments,the World Wide Web and proprietary on-line services likeAmerica Online.
Media Metrix collects data by measuring Internet usagefrom a representative sample, or panel, of personal com-
puter users with the company’s proprietary tracking tech-nology. Media Metrix maintains a large panel of Internetusers who report Internet usage at work and at home, as wellas the usage of proprietary online services.
Each panelist is required to fill out a detailed questionnaireto provide background demographic information. MediaMetrix’s proprietary tracking technology collects data fromthe panelist’s personal computer and transmits these data tothe company’s central office for processing. The data arethen used to construct several databases, which are used toprovide products and services.
Table 43
Media Metrix Stock Price Analysis
Source: ILX
Table 44
Media Metrix Historical Financials
($ Millions, except EPS) F1Q98 F2Q98 F3Q98 F4Q98 F1Q99 F2Q99 F3Q99 F4Q99 FY1997 FY1998 FY1999
Revenues 1.2 1.3 1.5 2.3 3.2 4.3 5.5 7.6 NA 3.2 6.3
Sequential Growth NA 16% 11% 56% 36% 34% 29% 38% NA NA NA
Year-over-Year Growth NA NA NA NA 174% 217% 268% 225% NA NA 99%
Cost of Goods Sold 0.8 0.8 0.9 2.1 1.7 5.6 4.3 8.7 NA 3.5 4.6
Gross Margin 0.4 0.5 0.6 0.2 1.5 (1.4) 1.2 (1.2) NA (0.3) 1.7
Gross Margin as a % of Revenues 31% 40% 41% 9% 46% -32% 22% -15% NA -9% 27%
Operating Profit (Loss) (EBIT) (0.9) (0.8) (1.0) (4.5) (2.5) (5.0) (3.4) NA NA (4.6) (5.5)
Operating Margin -73% -62% -64% -194% -77% -118% -63% NA NA -144% -88%
Sequential Growth NA NA NA NA NA NA NA NA NA NA NA
Year-over-Year Growth NA NA NA NA NA NA NA NA NA NA NA
EPS ($0.14) ($0.14) ($0.16) ($0.54) ($0.19) ($0.16) ($0.15) ($0.75) NA ($0.75) ($0.98)
Sequential Growth NA NA NA NA NA NA NA NA NA NA NA
Year-over-Year Growth NA NA NA NA NA NA NA NA NA NA NA
Source: FactSet Data

MORGAN STANLEY DEAN WITTER 67
This memorandum is based on information available to the public. No representation is made that it is accurate or complete. This memorandum is not an offer to buy or sell or asolicitation of an offer to buy or sell the securities mentioned. Please refer to the notes at the end of this report.
Company Profile: Mediaplex (MPLX)
Mediaplex / Ticker: MPLX
Price as of 4/27/2000 $49.63
Market Capitalization ($MM) 1,609.93
Table 45
Mediaplex Offerings
Buy Side Advertising Direct E-mail
Sell Side Advertising Online Couponing
Ad Serving Promos/Sponsorships
Mediaplex conducts media buying for advertisers on theInternet. The company provides technology-based servicesto enable advertisers to deliver customized messages andoffers to Web site visitors. The company’s services encom-pass planning, executing, monitoring and analyzing Web-based advertising and marketing campaigns, and are basedupon Mediaplex’s proprietary technology, trade-named“MOJO.” MOJO is an acronym for "mobile Java objects,"which are discrete pieces of software written in Java code
that perform specialized functions and communicate witheach other.
Mediaplex’s technology draws upon an advertiser’s up-to-the-minute business data to tailor the message. Real-timecustomization of messages increases consumer response toonline advertisements and marketing, thereby improvingcompanies’ returns on advertising and marketing expendi-tures. The company also offers an e-mail product for ad-vertisers.
Table 46
Mediaplex Stock Price Analysis
Source: ILX
Table 47
Mediaplex Historical Financials
($ Millions, except EPS) F1Q98 F2Q98 F3Q98 F4Q98 F1Q99 F2Q99 F3Q99 F4Q99 FY1997 FY1998 FY1999
Revenues 0.6 0.9 1.1 1.0 1.6 5.7 6.6 12.5 NA 3.6 26.4
Sequential Growth NA 60% 14% -7% 64% 248% 16% 88% NA NA NA
Year-over-Year Growth NA NA NA NA 179% 508% 519% 1150% NA NA 636%
Cost of Goods Sold NA 0.5 0.7 0.8 0.8 1.3 4.4 5.2 NA 2.8 20.4
Gross Margin NA 0.5 0.3 0.2 0.8 4.3 2.2 7.3 NA 0.8 6.0
Gross Margin as a % of Revenues NA 49% 32% 24% 51% 76% 33% 58% NA 23% 23%
Operating Profit (Loss) (EBIT) (0.3) (0.5) (0.1) (0.9) (3.0) (2.2) NA (9.9) NA (1.8) (22.7)
Operating Margin -56% -48% -10% -89% -181% -39% NA -79% NA -49% -86%
Sequential Growth NA NA NA NA NA NA NA NA NA NA NA
Year-over-Year Growth NA NA NA NA NA NA NA NA NA NA NA
EPS ($0.04) ($0.05) ($0.04) ($0.13) ($0.23) ($0.19) ($1.64) ($0.41) NA ($0.25) ($2.47)
Sequential Growth NA NA NA NA NA NA NA NA NA NA NA
Year-over-Year Growth NA NA NA NA NA NA NA NA NA NA NA
Source: FactSet Data

68 MORGAN STANLEY DEAN WITTER
This memorandum is based on information available to the public. No representation is made that it is accurate or complete. This memorandum is not an offer to buy or sell or asolicitation of an offer to buy or sell the securities mentioned. Please refer to the notes at the end of this report.
Company Profile: MessageMedia (MESG)
MessageMedia / Ticker: MESG
Price as of 4/27/2000 $4.88
Market Capitalization ($MM) 267.74
Table 48
MessageMedia Offerings
Buy Side Advertising Direct E-mail
Sell Side Advertising Online Couponing
Ad Serving Promos/Sponsorships
MessageMedia is a leading provider of an integrated, com-prehensive set of permission-based e-mail solutions. Mes-sageMedia has a suite of services that utilizes the medium ofe-mail to develop and foster permission-based relationshipswith customers. The company’s e-mail solutions are avail-able either on an outsourced-subscription basis or as an in-house packaged software solution.
The company enables businesses to use e-mail as a strategictool to increase sales, improve customer communication,and develop long-term customer loyalty. Specifically, Mes-sageMedia’s suite of services and products includes Inter-net-based marketing, customer care, and survey and infor-mation distribution solutions, allowing businesses to estab-lish and enhance two-way customer dialogue.
Table 49
MessageMedia Stock Price Analysis
Source: ILX
Table 50
MessageMedia Historical Financials
($ Millions, except EPS) F1Q98 F2Q98 F3Q98 F4Q98 F1Q99 F2Q99 F3Q99 F4Q99 FY1997 FY1998 FY1999
Revenues 0.3 0.2 0.3 0.4 0.8 1.3 3.1 4.9 0.7 1.5 10.0
Sequential Growth NA -23% 60% 28% 70% 73% 134% 61% NA NA NA
Year-over-Year Growth NA NA NA NA 168% 500% 780% 1009% NA 108% 591%
Cost of Goods Sold 0.4 0.5 0.3 1.4 3.5 3.7 10.4 16.0 1.4 2.6 33.5
Gross Margin -0.1 -0.2 0.0 -0.9 -2.8 -2.4 -7.3 -11.0 -0.7 -1.1 -23.5
Gross Margin as a % of Revenues -49% -111% 9% -211% -367% -182% -239% -225% -97% -77% -234%
Operating Profit (Loss) (EBIT) (3.6) (3.1) (1.7) (3.3) (6.0) (6.1) (13.7) (19.7) (15.9) (11.6) (18.7)
Operating Margin -1263% -1434% -476% -750% -791% -468% -450% -401% -2278% -802% -187%
Sequential Growth NA NA NA NA NA NA NA NA NA NA NA
Year-over-Year Growth NA NA NA NA NA NA NA NA NA NA NA
EPS ($0.38) ($0.32) ($0.05) ($0.13) ($0.17) ($0.14) ($0.29) ($0.36) ($1.94) ($0.63) ($1.00)
Sequential Growth NA NA NA NA NA NA NA NA NA NA NA
Year-over-Year Growth NA NA NA NA NA NA NA NA NA NA NA
Source: FactSet Data

MORGAN STANLEY DEAN WITTER 69
This memorandum is based on information available to the public. No representation is made that it is accurate or complete. This memorandum is not an offer to buy or sell or asolicitation of an offer to buy or sell the securities mentioned. Please refer to the notes at the end of this report.
Company Profile: MyPoints.com (MYPT)
MyPoints.com / Ticker: MYPT
Price as of 4/27/2000 $14.88
Market Capitalization ($MM) 419.85
Table 51
MyPoints.com Offerings
Buy Side Advertising Direct E-mail
Sell Side Advertising Online Couponing
Ad Serving Promos/Sponsorships
MyPoints.com is a provider of Internet direct marketingservices and customer loyalty infrastructure. The company’sdatabase-driven direct marketing service, MyPoints, offersdirect marketers an approach to Internet advertising that isdesigned to enhance customer acquisition and retention ef-forts by integrating targeted e-mail and Web-based offerswith incentives. MyPoints.com’s rewards-based shoppingchannel, MyPoints Shopping!, provides Web users with theability to earn points for every dollar spent at select retailsites. Points earned in the MyPoints program may be re-deemed for a wide variety of products and services, such asgift certificates, travel awards and prepaid phone cards.
MyPoints.com also builds and manages co-branded andprivate label online customer loyalty programs.
When consumers enroll in the MyPoints program, they givethe company permission to send them targeted online offers,and they receive rewards points for completing surveys thatprovide the company with demographic and behavioral in-formation. MyPoints members earn additional points byresponding to direct marketing offers, making online andoffline purchases, and providing the company with addi-tional demographic and behavioral data through surveys ona secure, confidential basis.
Table 52
MyPoints.com Stock Price Analysis
Source: ILX
Table 53
MyPoints.com Historical Financials
($ Millions, except EPS) F1Q98 F2Q98 F3Q98 F4Q98 F1Q99 F2Q99 F3Q99 F4Q99 FY1997 FY1998 FY1999
Revenues 0.2 0.2 0.3 0.7 1.3 2.7 7.0 13.2 NA 1.3 24.1
Sequential Growth NA 4% 72% 166% 79% 109% 161% 90% NA NA NA
Year-over-Year Growth NA NA NA NA 750% 1607% 2495% 1761% NA NA 1777%
Cost of Goods Sold NA 0.2 0.3 0.9 NA 3.5 2.9 4.1 NA 1.4 10.5
Gross Margin NA -0.1 0.0 -0.2 NA -0.8 4.1 9.1 NA -0.1 13.6
Gross Margin as a % of Revenues NA -57% 5% -26% NA -32% 59% 69% NA -9% 56%
Operating Profit (Loss) (EBIT) NA (2.5) (2.4) (3.3) NA (15.8) (9.8) NA NA (8.2) (25.6)
Operating Margin NA -1608% -893% -464% NA -593% -141% NA NA -638% -106%
Sequential Growth NA NA NA NA NA NA NA NA NA NA NA
Year-over-Year Growth NA NA NA NA NA NA NA NA NA NA NA
EPS ($0.74) ($1.00) ($1.44) ($1.14) ($1.91) ($2.79) ($0.69) ($0.47) NA ($4.37) ($5.86)
Sequential Growth NA NA NA NA NA NA NA NA NA NA NA
Year-over-Year Growth NA NA NA NA NA NA NA NA NA NA NA
Source: FactSet Data

70 MORGAN STANLEY DEAN WITTER
This memorandum is based on information available to the public. No representation is made that it is accurate or complete. This memorandum is not an offer to buy or sell or asolicitation of an offer to buy or sell the securities mentioned. Please refer to the notes at the end of this report.
Company Profile: Netcentives (NCNT)
Netcentives / Ticker: NCNT
Price as of 4/27/2000 $9.94
Market Capitalization ($MM) 321.43
Table 54
Netcentives Offerings
Buy Side Advertising Direct E-mail
Sell Side Advertising Online Couponing
Ad Serving Promos/Sponsorships
Netcentives is a leading provider of Internet loyalty, directmarketing, and promotion products and services used todrive consumer behavior. Netcentives’ flagship program,the ClickRewards Network, is a powerful online promotionand loyalty program that allows e-commerce sites to rewardconsumers with ClickMiles, a digital promotion currency,for making online purchases.
The ClickRewards Network includes e-commerce compa-nies from a broad range of industries. These companies pur-
chase ClickMiles from Netcentives and award them to con-sumers in order to convert browsers to buyers, increase av-erage purchase size, drive repeat purchases and build loyaltyto their sites. The Netcentives technology allows consumersto earn rewards currency at the point of purchase on sitesthroughout the Web and to track and manage them in theirown personal account at a central Web site.
Table 55
Netcentives Stock Price Analysis
Source: ILX
Table 56
Netcentives Historical Financials
($ Millions, except EPS) F1Q98 F2Q98 F3Q98 F4Q98 F1Q99 F2Q99 F3Q99 F4Q99 FY1997 FY1998 FY1999
Revenues 0.0 0.1 0.4 0.2 1.7 1.4 2.0 2.8 NA 0.6 7.8
Sequential Growth NA 647% 225% -57% 962% -18% 47% 41% NA NA NA
Year-over-Year Growth NA NA NA NA 10940% 1119% 450% 1706% NA NA 1112%
Cost of Goods Sold NA 5.3 3.5 6.3 9.4 10.3 14.0 22.8 NA 15.1 56.3
Gross Margin NA -5.2 -3.1 -6.1 -7.7 -8.9 -12.0 -19.9 NA -14.4 -48.5
Gross Margin as a % of Revenues NA -4661% -851% -3913% -465% -651% -597% -708% NA -2227% -619%
Operating Profit (Loss) (EBIT) (2.1) (5.1) (3.0) (5.9) (8.3) (8.4) (11.5) (19.0) NA (14.0) (14.0)
Operating Margin NA -4544% -818% -3782% -502% -618% -574% -674% NA -2159% -178%
Sequential Growth NA NA NA NA NA NA NA NA NA NA NA
Year-over-Year Growth NA NA NA NA NA NA NA NA NA NA NA
EPS ($1.63) ($2.01) ($1.71) ($2.85) ($2.53) ($2.56) ($3.12) ($0.70) NA ($8.58) ($8.91)
Sequential Growth NA NA NA NA NA NA NA NA NA NA NA
Year-over-Year Growth NA NA NA NA NA NA NA NA NA NA NA
Source: FactSet Data

MORGAN STANLEY DEAN WITTER 71
This memorandum is based on information available to the public. No representation is made that it is accurate or complete. This memorandum is not an offer to buy or sell or asolicitation of an offer to buy or sell the securities mentioned. Please refer to the notes at the end of this report.
Company Profile: NetCreations (NTCR)
NetCreations / Ticker: NTCR
Price as of 4/27/2000 $34.75
Market Capitalization ($MM) 521.25
Table 57
NetCreations Offerings
Buy Side Advertising Direct E-mail
Sell Side Advertising Online Couponing
Ad Serving Promos/Sponsorships
NetCreations provides Internet-based opt-in e-mail directmarketing services that enable direct marketers to targetpromotional campaigns to consumers who have given theirpermission to receive e-mail messages in any of over 3,000topical categories.
NetCreations’ technology allows real-time, online e-mailaddress selection and ordering by direct marketers, as wellas response-tracking. The company provides these servicesthrough its own postmasterdirect.com Web site and throughthird-party Web sites whose e-mail address lists NetCrea-tions manages.
Table 58
NetCreations Stock Price Analysis
Source: ILX
Table 59
NetCreations Historical Financials
($ Millions, except EPS) F1Q98 F2Q98 F3Q98 F4Q98 F1Q99 F2Q99 F3Q99 F4Q99 FY1997 FY1998 FY1999
Revenues 0.5 0.7 0.9 1.4 1.7 3.6 4.9 10.5 NA 3.4 3.4
Sequential Growth NA 49% 24% 58% 22% 111% 38% 112% NA NA NA
Year-over-Year Growth NA NA NA NA 255% 405% 463% 655% NA NA 0%
Cost of Goods Sold 0.1 0.3 0.4 0.7 0.8 1.8 2.4 5.6 NA 1.5 1.5
Gross Margin 0.3 0.4 0.5 0.7 0.9 1.8 2.5 4.8 NA 1.9 1.9
Gross Margin as a % of Revenues 70% 60% 54% 49% 50% 50% 51% 46% NA 56% 55%
Operating Profit (Loss) (EBIT) 0.1 0.1 0.1 0.3 0.3 1.2 1.4 2.6 NA 0.6 0.7
Operating Margin 26% 19% 16% 20% 20% 32% 29% 25% NA 17% 20%
Sequential Growth NA 11% 2% 99% 19% 248% 23% 82% NA NA NA
Year-over-Year Growth NA NA NA NA 169% 741% 912% 827% NA NA 17%
EPS $0.01 $0.01 $0.01 $0.02 $0.03 $0.09 $0.11 $0.14 NA NA $0.05
Sequential Growth NA 0% 0% 100% 50% 200% 22% 27% NA NA NA
Year-over-Year Growth NA NA NA NA 200% 800% 1000% 600% NA NA NA
Source: FactSet Data

72 MORGAN STANLEY DEAN WITTER
This memorandum is based on information available to the public. No representation is made that it is accurate or complete. This memorandum is not an offer to buy or sell or asolicitation of an offer to buy or sell the securities mentioned. Please refer to the notes at the end of this report.
Company Profile: Net Perceptions (NETP)
Net Perceptions / Ticker: NETP
Price as of 4/27/2000 $19.75
Market Capitalization ($MM) 435.01
Table 60
Net Perceptions Offerings
Buy Side Advertising Direct E-mail
Sell Side Advertising Online Couponing
Ad Serving Promos/Sponsorships
Net Perceptions is a leading provider of marketing solutionsthat enable Internet retailers to market to customers on apersonalized, one-to-one basis in real time. Using Net Per-ceptions’ software solutions, a retailer learns from eachcustomer interaction and, based on the information received,adjusts marketing messages and product offerings to thatcustomer in real time. This allows retailers to attract morecustomers, generate more products per order, and increasecustomer loyalty. To date, the company has focused on pro-viding solutions to electronic commerce retailers.
The company’s products enable effective real-time relation-ship marketing by analyzing past and current customer be-havior, including purchase history, stated preferences,demographic information, and Internet browsing behavior.Based on this analysis, the company’s products use pro-prietary collaborative filtering technology to anticipate othermerchandise or information a customer is likely to be inter-ested in purchasing or viewing.
Table 61
Net Perceptions Stock Price Analysis
Source: ILX
Table 62
Net Perceptions Historical Financials
($ Millions, except EPS) F1Q98 F2Q98 F3Q98 F4Q98 F1Q99 F2Q99 F3Q99 F4Q99 FY1997 FY1998 FY1999
Revenues 0.7 1.0 1.2 1.7 1.9 2.8 4.1 6.3 NA 0.3 4.5
Sequential Growth NA 48% 17% 44% 14% 48% 46% 53% NA NA NA
Year-over-Year Growth NA NA NA NA 183% 185% 256% 279% NA NA 1312%
Cost of Goods Sold 1.6 2.0 2.4 3.5 0.3 0.6 0.8 1.3 NA 5.1 0.4
Gross Margin -0.9 -1.1 -1.2 -1.9 1.5 2.3 3.3 5.0 NA -4.7 4.1
Gross Margin as a % of Revenues -135% -106% -104% -113% 82% 80% 80% 79% NA -1497% 91%
Operating Profit (Loss) (EBIT) (0.9) (1.0) (1.2) (1.9) (2.9) (3.1) (3.0) (3.3) NA (4.7) (4.9)
Operating Margin -131% -102% -102% -114% -152% -111% -73% -53% NA -1472% -109%
Sequential Growth NA NA NA NA NA NA NA NA NA NA NA
Year-over-Year Growth NA NA NA NA NA NA NA NA NA NA NA
EPS ($0.31) ($0.31) ($0.32) ($0.45) ($0.64) ($0.20) ($0.15) ($0.14) NA ($3.01) ($1.40)
Sequential Growth NA NA NA NA NA NA NA NA NA NA NA
Year-over-Year Growth NA NA NA NA NA NA NA NA NA NA NA
Source: FactSet Data

MORGAN STANLEY DEAN WITTER 73
This memorandum is based on information available to the public. No representation is made that it is accurate or complete. This memorandum is not an offer to buy or sell or asolicitation of an offer to buy or sell the securities mentioned. Please refer to the notes at the end of this report.
Company Profile: NetRatings (NTRT)
NetRatings / Ticker: NTRT
Price as of 4/27/2000 $24.50
Market Capitalization ($MM) 786.70
Table 63
NetRatings Offerings
Buy Side Advertising Direct E-mail
Sell Side Advertising Online Couponing
Ad Serving Promos/Sponsorships
Internet Measurement
NetRatings provides Internet audience measurement infor-mation and analysis. Information is collected from a repre-sentative sample of consumer and business Internet users.Detailed, flexible reporting and analysis provides customerswith up-to-date information on Internet usage and advertis-ing.
NetRatings has formed strategic relationships with NielsenMedia Research (the leading source of television audiencemeasurement and related services in the United States andCanada) and ACNielsen (a leading provider of market re-search information and analysis to the consumer productsand services industries). Through NetRatings’ relationshipwith Nielsen Media Research, the company markets itsproducts and services under the Nielsen//NetRatings brandin the U.S., Canada and Japan.
Table 64
NetRatings Stock Price Analysis
Source: ILX
Table 65
NetRatings Historical Financials
($ Millions, except EPS) F1Q98 F2Q98 F3Q98 F4Q98 F1Q99 F2Q99 F3Q99 F4Q99 FY1997 FY1998 FY1999
Revenues 0.0 0.1 0.1 0.1 0.2 0.5 0.8 1.6 NA 0.2 0.2
Sequential Growth NA 1600% 53% 35% 58% 187% 77% 84% NA NA NA
Year-over-Year Growth NA NA NA NA 5433% 833% 982% 1380% NA NA 0%
Cost of Goods Sold 0.1 0.1 0.2 0.7 1.0 1.1 2.1 2.7 NA 1.1 1.1
Gross Margin -0.1 0.0 -0.1 -0.6 -0.9 -0.6 -1.3 -1.1 NA -0.8 -0.8
Gross Margin as a % of Revenues -3333% -90% -108% -566% -521% -136% -150% -71% NA -348% -348%
Operating Profit (Loss) (EBIT) (0.9) (0.7) (0.7) (1.5) (2.1) (3.5) NA (8.1) NA (3.8) (3.8)
Operating Margin -28333% -1402% -928% -1390% -1271% -745% NA -524% NA -1582% -1582%
Sequential Growth NA NA NA NA NA NA NA NA NA NA NA
Year-over-Year Growth NA NA NA NA NA NA NA NA NA NA NA
EPS ($0.65) ($0.56) ($0.57) ($0.99) ($1.06) ($1.75) ($2.38) ($0.56) NA ($2.78) ($2.78)
Sequential Growth NA NA NA NA NA NA NA NA NA NA NA
Year-over-Year Growth NA NA NA NA NA NA NA NA NA NA NA
Source: FactSet Data
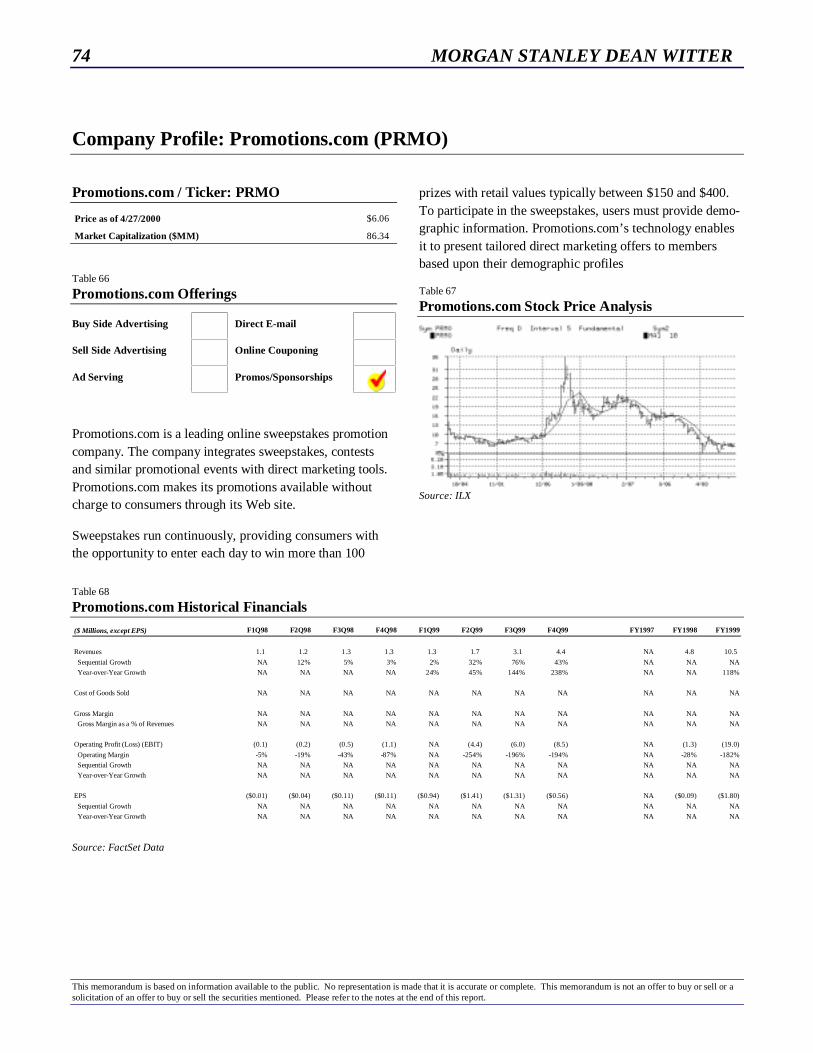
74 MORGAN STANLEY DEAN WITTER
This memorandum is based on information available to the public. No representation is made that it is accurate or complete. This memorandum is not an offer to buy or sell or asolicitation of an offer to buy or sell the securities mentioned. Please refer to the notes at the end of this report.
Company Profile: Promotions.com (PRMO)
Promotions.com / Ticker: PRMO
Price as of 4/27/2000 $6.06
Market Capitalization ($MM) 86.34
Table 66
Promotions.com Offerings
Buy Side Advertising Direct E-mail
Sell Side Advertising Online Couponing
Ad Serving Promos/Sponsorships
Promotions.com is a leading online sweepstakes promotioncompany. The company integrates sweepstakes, contestsand similar promotional events with direct marketing tools.Promotions.com makes its promotions available withoutcharge to consumers through its Web site.
Sweepstakes run continuously, providing consumers withthe opportunity to enter each day to win more than 100
prizes with retail values typically between $150 and $400.To participate in the sweepstakes, users must provide demo-graphic information. Promotions.com’s technology enablesit to present tailored direct marketing offers to membersbased upon their demographic profiles
Table 67
Promotions.com Stock Price Analysis
Source: ILX
Table 68
Promotions.com Historical Financials
($ Millions, except EPS) F1Q98 F2Q98 F3Q98 F4Q98 F1Q99 F2Q99 F3Q99 F4Q99 FY1997 FY1998 FY1999
Revenues 1.1 1.2 1.3 1.3 1.3 1.7 3.1 4.4 NA 4.8 10.5
Sequential Growth NA 12% 5% 3% 2% 32% 76% 43% NA NA NA
Year-over-Year Growth NA NA NA NA 24% 45% 144% 238% NA NA 118%
Cost of Goods Sold NA NA NA NA NA NA NA NA NA NA NA
Gross Margin NA NA NA NA NA NA NA NA NA NA NA
Gross Margin as a % of Revenues NA NA NA NA NA NA NA NA NA NA NA
Operating Profit (Loss) (EBIT) (0.1) (0.2) (0.5) (1.1) NA (4.4) (6.0) (8.5) NA (1.3) (19.0)
Operating Margin -5% -19% -43% -87% NA -254% -196% -194% NA -28% -182%
Sequential Growth NA NA NA NA NA NA NA NA NA NA NA
Year-over-Year Growth NA NA NA NA NA NA NA NA NA NA NA
EPS ($0.01) ($0.04) ($0.11) ($0.11) ($0.94) ($1.41) ($1.31) ($0.56) NA ($0.09) ($1.80)
Sequential Growth NA NA NA NA NA NA NA NA NA NA NA
Year-over-Year Growth NA NA NA NA NA NA NA NA NA NA NA
Source: FactSet Data

MORGAN STANLEY DEAN WITTER 75
This memorandum is based on information available to the public. No representation is made that it is accurate or complete. This memorandum is not an offer to buy or sell or asolicitation of an offer to buy or sell the securities mentioned. Please refer to the notes at the end of this report.
Company Profile: 24/7 Media (TFSM)
24/7 Media / Ticker: TFSM
Price as of 4/27/2000 $17.88
Market Capitalization ($MM) 400.81
Table 69
24/7 Media Offerings
Buy Side Advertising Direct E-mail
Sell Side Advertising Online Couponing
Ad Serving Promos/Sponsorships
24/7 Media is an Internet advertising and direct marketingfirm that operates internationally. The company primarilygenerates revenue by representing Web publishers and sell-ing advertisements and promotions for them. The companyoperates two ad networks, designed for different sized cli-ents. 24/7 Media also conducts e-mail campaigns for adver-tisers.
24/7 Media’s customized solutions allow advertisers anddirect marketers to tailor their ad campaigns to reach desired
audiences, while reducing costs, easing time pressures, andalleviating the need to purchase a series of ad campaignsfrom numerous Web sites. The company is increasing its adtargeting capabilities through the development of its Profilzdatabase and proprietary ad serving technology.
24/7 Media has a cross-promotion agreement withShopNow.com — 24/7 Media owns 15% of ShopNow.com.ShopNow.com provides e-commerce services, an onlineshopping network, creative design services, and productfulfillment to approximately 30,000 merchants.
Table 70
24/7 Media Stock Price Analysis
Source: ILX
Table 71
24/7 Media Historical Financials
($ Millions, except EPS) F1Q98 F2Q98 F3Q98 F4Q98 F1Q99 F2Q99 F3Q99 F4Q99 FY1997 FY1998 FY1999
Revenues 1.2 4.0 5.8 9.6 11.5 17.2 24.3 37.1 3.1 20.9 90.0
Sequential Growth NA 230% 46% 65% 20% 50% 42% 53% NA NA NA
Year-over-Year Growth NA NA NA NA 851% 332% 319% 288% NA 563% 331%
Cost of Goods Sold 1.3 4.7 6.5 9.3 11.1 15.2 22.0 26.4 1.7 16.1 65.7
Gross Margin -0.1 -0.7 -0.7 0.3 0.4 2.0 2.4 10.7 1.5 4.7 24.3
Gross Margin as a % of Revenues -7% -18% -13% 3% 3% 11% 10% 29% 47% 23% 27%
Operating Profit (Loss) (EBIT) (2.2) (4.9) (6.0) (6.7) (7.2) (7.1) (11.7) (14.8) (4.2) (25.7) (43.1)
Operating Margin -183% -124% -103% -70% -63% -42% -48% -40% -133% -123% -48%
Sequential Growth NA NA NA NA NA NA NA NA NA NA NA
Year-over-Year Growth NA NA NA NA NA NA NA NA NA NA NA
EPS ($0.64) ($1.17) ($0.49) ($0.43) ($0.42) ($0.37) ($0.55) ($0.58) ($4.88) ($2.48) ($1.96)
Sequential Growth NA NA NA NA NA NA NA NA NA NA NA
Year-over-Year Growth NA NA NA NA NA NA NA NA NA NA NA
Source: FactSet Data

76 MORGAN STANLEY DEAN WITTER
This memorandum is based on information available to the public. No representation is made that it is accurate or complete. This memorandum is not an offer to buy or sell or asolicitation of an offer to buy or sell the securities mentioned. Please refer to the notes at the end of this report.

77MORGAN STANLEY DEAN WITTER
This memorandum is based on information available to the public. No representation is made that it is accurate or complete. This memorandum is not an offerto buy or sell or a solicitation of an offer to buy or sell the securities mentioned. Please refer to the notes at the end of this report.
http://www.msdw.com/
MORGAN STANLEY DEAN WITTER
Background: Internet Direct Marketing & Advertising Services (pg. 62)
The Internet is the first media to collapse the sales cycle, from gaining awareness to gathering information toshopping and making a purchase. It also blurs the lines between advertising and direct marketing.
Online advertisers have generally focused on the top ten sites when allocating their online spending.Meanwhile, the aggregate power of the growing number of niche sites (ranked 50+) has been gaining. Bothcategories are squeezing the mid-sized sites (ranked 11�50).
E-advertising is positioned to go well beyond banners as bandwidth and technology allow. As the audienceevolves from higher-demographic, early tech adopters into more of a mass market, then mass market advertis-ing methods will be utilized more.
Industry Forecast: Internet Direct Marketing & Advertising Services (pg. 72)
We forecast that U.S. e-advertising will reach over $32 billion in 2005 � representing a CAGR of 42%. Atthat time, we estimate that the Internet will account for 14% of all U.S. advertising, up from 3% in 1999.
Global e-advertising and direct e-marketing should be over $50 billion in 2005, up from $5 billion in 1999 �a CAGR of 49%.
We believe the global addressable market of advertising and marketing services is much larger than many U.S.media followers currently believe.
List price CPMs (cost per thousand impressions) for the Internet will likely come down, but effective CPMsare reasonable compared to other media. Effective CPMs should go up as more inventory is sold and bettercomparisons with other media are made.
Industry Forecast: Traditional Advertising & Marketing Services (pg. 78)
The traditional advertising and marketing services market is enormous. In the U.S., we estimate advertisingand marketing spending to reached nearly $389 billion in 1999, and we expect $420 billion in 2000.
The U.S. represents about 42% of the $363 billion global advertising budget and 76% of the $315 billionglobal marketing services budget. Combining advertising & marketing services, the U.S. represents 57% ofthe $678 billion market, we forecast for 2000.
In the U.S. in 2000, we expect 8.3% growth in advertising and 7.8% growth in marketing services, for a totalof 8.0%, up 70 basis points from 1999E. Globally in 2000, we expect advertising growth of 7.6%, up 140basis points from 1999.
The Internet Holdings of �Traditional� Advertising Agencies (pg. 82)
msdw.com X
OKThe Industry
Chapter 1 Chapter 2 Chapter 3 Chapter 4 Chapter 5

78 MORGAN STANLEY DEAN WITTER
This memorandum is based on information available to the public. No representation is made that it is accurate or complete. This memorandum is not an offer to buy or sell or asolicitation of an offer to buy or sell the securities mentioned. Please refer to the notes at the end of this report.

MORGAN STANLEY DEAN WITTER 79
This memorandum is based on information available to the public. No representation is made that it is accurate or complete. This memorandum is not an offer to buy or sell or asolicitation of an offer to buy or sell the securities mentioned. Please refer to the notes at the end of this report.
Background: Internet Direct Marketing & Advertising Services
KEY POINTS:
½ The Internet is the first media to collapse the sales cycle,
from gaining awareness to gathering information to shop-
ping and making a purchase. It also blurs the lines be-
tween advertising and direct marketing.
½ Online advertisers have generally focused on the top ten
sites when allocating their online spending. Meanwhile,
the aggregate power of the growing number of niche sites
(ranked 50+) has been gaining. Both categories are
squeezing the mid-sized sites (ranked 11–50).
½ E-advertising is positioned to go well beyond banners as
bandwidth and technology allow. As the audience evolves
from higher-demographic, early tech adopters into more
of a mass market, then mass market advertising methods
will be utilized more.
Online Advertising vs. Direct Marketing:The Lines Are Blurred
The Internet is “a new medium for traditional directmarketing.”— H. Robert Wientzen, President of the Direct Mar-keting Association.
In the online world, even the simple banner ad can be (andoften is intended to be) both an advertisement and a directmarketing service. The banner raises the passive con-sumer’s awareness of a product. Yet it also encourages theconsumer to pursue action by clicking on the ad. Manybuyers of Internet banners are justifying their expenditurebased on direct marketing models.
It is widely accepted that in both online and offline worlds,the average viewer requires nine exposures to an ad befores/he begins to recognize the company and associate it withthe product or service it provides. In addition, two out ofthree ads go unnoticed (particularly on the Internet) by peo-ple who are more interested in reading content than adver-tising. Thus, one could argue that brand recognition re-quires that a consumer be exposed to an ad 27 times beforebranding begins to occur.
Figure 19
Direct Marketing vs. Advertising on the Internet
64%
36%
80%
20%
76%
24%
71%
29%
65%
35%
0%
10%
20%
30%
40%
50%
60%
70%
80%
1998 1999E 2000E 2001E 2002E
Direct Response Branding
Source: Forrester Research
The interactivity of the Web lends itself more to response-oriented advertising than branding. In fact, DoubleClickreports that 90% of the ads served through its network areresponse-driven, while only 10% are intended to brand.24/7 Media reports that about 20% of its ads served are in-tended to brand, while the remaining 80% are response-oriented. That differs slightly from conclusions from For-rester Research, detailed below.
Figure 20
Branding and Direct Marketing
Awareness
Interest
Deep Interest
Lead
Sale
Branding/Advertising
Direct Response
Source: Morgan Stanley Dean Witter Research
However, the lines between advertising, direct marketingand promotional marketing, and the retail sales generatedhave been blurred by the Internet categories. A portion of
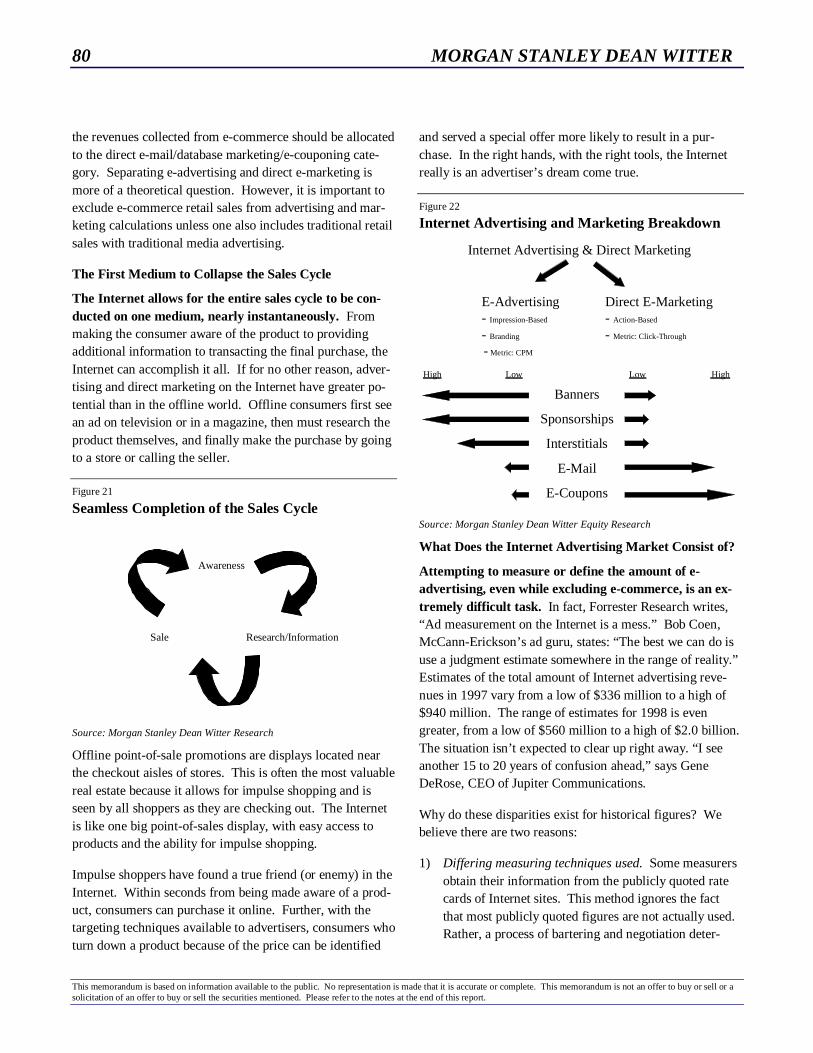
80 MORGAN STANLEY DEAN WITTER
This memorandum is based on information available to the public. No representation is made that it is accurate or complete. This memorandum is not an offer to buy or sell or asolicitation of an offer to buy or sell the securities mentioned. Please refer to the notes at the end of this report.
the revenues collected from e-commerce should be allocatedto the direct e-mail/database marketing/e-couponing cate-gory. Separating e-advertising and direct e-marketing ismore of a theoretical question. However, it is important toexclude e-commerce retail sales from advertising and mar-keting calculations unless one also includes traditional retailsales with traditional media advertising.
The First Medium to Collapse the Sales Cycle
The Internet allows for the entire sales cycle to be con-ducted on one medium, nearly instantaneously. Frommaking the consumer aware of the product to providingadditional information to transacting the final purchase, theInternet can accomplish it all. If for no other reason, adver-tising and direct marketing on the Internet have greater po-tential than in the offline world. Offline consumers first seean ad on television or in a magazine, then must research theproduct themselves, and finally make the purchase by goingto a store or calling the seller.
Figure 21
Seamless Completion of the Sales Cycle
Awareness
Sale Research/Information
Source: Morgan Stanley Dean Witter Research
Offline point-of-sale promotions are displays located nearthe checkout aisles of stores. This is often the most valuablereal estate because it allows for impulse shopping and isseen by all shoppers as they are checking out. The Internetis like one big point-of-sales display, with easy access toproducts and the ability for impulse shopping.
Impulse shoppers have found a true friend (or enemy) in theInternet. Within seconds from being made aware of a prod-uct, consumers can purchase it online. Further, with thetargeting techniques available to advertisers, consumers whoturn down a product because of the price can be identified
and served a special offer more likely to result in a pur-chase. In the right hands, with the right tools, the Internetreally is an advertiser’s dream come true.
Figure 22
Internet Advertising and Marketing Breakdown
Internet Advertising & Direct Marketing
E-Advertising- Impression-Based
- Branding
- Metric: CPM
Direct E-Marketing- Action-Based
- Metric: Click-Through
Banners
Sponsorships
Interstitials
E-Coupons
High Low Low High
Source: Morgan Stanley Dean Witter Equity Research
What Does the Internet Advertising Market Consist of?
Attempting to measure or define the amount of e-advertising, even while excluding e-commerce, is an ex-tremely difficult task. In fact, Forrester Research writes,“Ad measurement on the Internet is a mess.” Bob Coen,McCann-Erickson’s ad guru, states: “The best we can do isuse a judgment estimate somewhere in the range of reality.”Estimates of the total amount of Internet advertising reve-nues in 1997 vary from a low of $336 million to a high of$940 million. The range of estimates for 1998 is evengreater, from a low of $560 million to a high of $2.0 billion.The situation isn’t expected to clear up right away. “I seeanother 15 to 20 years of confusion ahead,” says GeneDeRose, CEO of Jupiter Communications.
Why do these disparities exist for historical figures? Webelieve there are two reasons:
1) Differing measuring techniques used. Some measurersobtain their information from the publicly quoted ratecards of Internet sites. This method ignores the factthat most publicly quoted figures are not actually used.Rather, a process of bartering and negotiation deter-

MORGAN STANLEY DEAN WITTER 81
This memorandum is based on information available to the public. No representation is made that it is accurate or complete. This memorandum is not an offer to buy or sell or asolicitation of an offer to buy or sell the securities mentioned. Please refer to the notes at the end of this report.
mines the actual pricing. Results also vary dependingon which party’s results are being measured, the adver-tiser’s or the publisher’s.
2) Different technology used for measurement. Thiscauses particular problems for the relationship betweenthe advertiser/measurer and the Web publisher. Ratingscompanies miss 7% of a small site’s and 34% of a largesite’s audited log files, according to the IAB, ARF, andFAST’s data reconciliation project. Further, Web pub-lishers typically use server log measurements to moni-tor Web traffic. On the other hand, advertisers prefer touse audience measurement techniques. The two tech-niques come up with different calculations of the effec-tiveness of an Internet campaign. The differences canbe broken down into two areas:
• International Traffic: Server log analyses includeinternational traffic in their calculations, whereas audi-ence measurement techniques do not. Internationaltraffic currently accounts for up to 40% of traffic, andthis number is only going to grow, causing further dis-tortions.
• Cached Pages: Cached pages are stored and servedto multiple users. Audience measurement systems in-clude cached pages in their data collection; server loganalyses do not. Media Metrix estimates that by not in-cluding cached pages, server log analyses miss 20–40%of a site’s usage.
“Audience measurement is perhaps one of the mostfrustrating business issues facing agencies and pub-lishers today ... Credible and reliable online adver-tising is key to the continuing growth of the me-dium.”— Rich LeFurgy, Chairman FAST, IAB
Table 72
Type of Advertising Conducted Online
1997 1998 1999 2000E 2001E 2002E 2003E
Banner 80% 52% 50% 46% 42% 41% 40% Sponsorship 15% 40% 39% 39% 34% 32% 30% Interstitial 5% 3% 4% 5% 6% 7% 8% e-mail 0% 1% 3% 6% 10% 13% 15% Other 0% 4% 4% 4% 8% 7% 7%
Source: eMarketer
How Are Advertisers Using the Web?
Banners are currently by far the most common type ofadvertising on the Web. Banners accounted for well overhalf of all ads served on the Internet in 1998 (eStats calcu-lates that banners accounted for 52% of Internet advertising;Jupiter calculates the figure as 61%; IAB calculates 55%).Sponsorships took second place, with interstitials and otherforms taking third and fourth, respectively. This mix is ex-pected to change over time, with banners’ share declining.Due to greater bandwidth, we expect more rich-media appli-cations to take over, giving sponsorships and interstitials adecided advantage.
Banners: Banners were originally a static billboard-type addisplayed at the top of a Web page. No longer are they nec-essarily static, nor are they always at the top of pages.Greater bandwidth has allowed for the use of audio andmoving images, and allowed consumers to click on the ban-ner and be taken to more in-depth information, to the com-pany’s Web site, or directly to an area where s/he can pur-chase the product. Buttons serve basically the same purposebut are usually smaller and arranged along the side of apage.
Side Frames/Sponsorships: A side frame is displayedalong the side of requested content (instead of at the top likethe traditional banner). Side frames are most often used inconjunction with sponsorships, allowing companies to“sponsor” content that a user has requested. Like banners,side frames allow users to click-through to more informa-tion, the company’s site, or to purchase the product. Addi-tionally, however, sponsorships often create an interactiveexperience for the user.
Pop-Up Windows: This type of ad “pops up” in anotherbrowser window when a user enters a site. The new win-dow containing the ad can be closed immediately or used torequest more information/purchase a product. Pop-up win-dows are very similar (and sometimes identical to) intersti-tials.
Interstitials: Interstitials are large, nearly full-screen adsthat often appear on browsers as a new page is loading.Obviously, this works best when the page being loaded isheavy on graphics or movement, forcing it to load moreslowly.
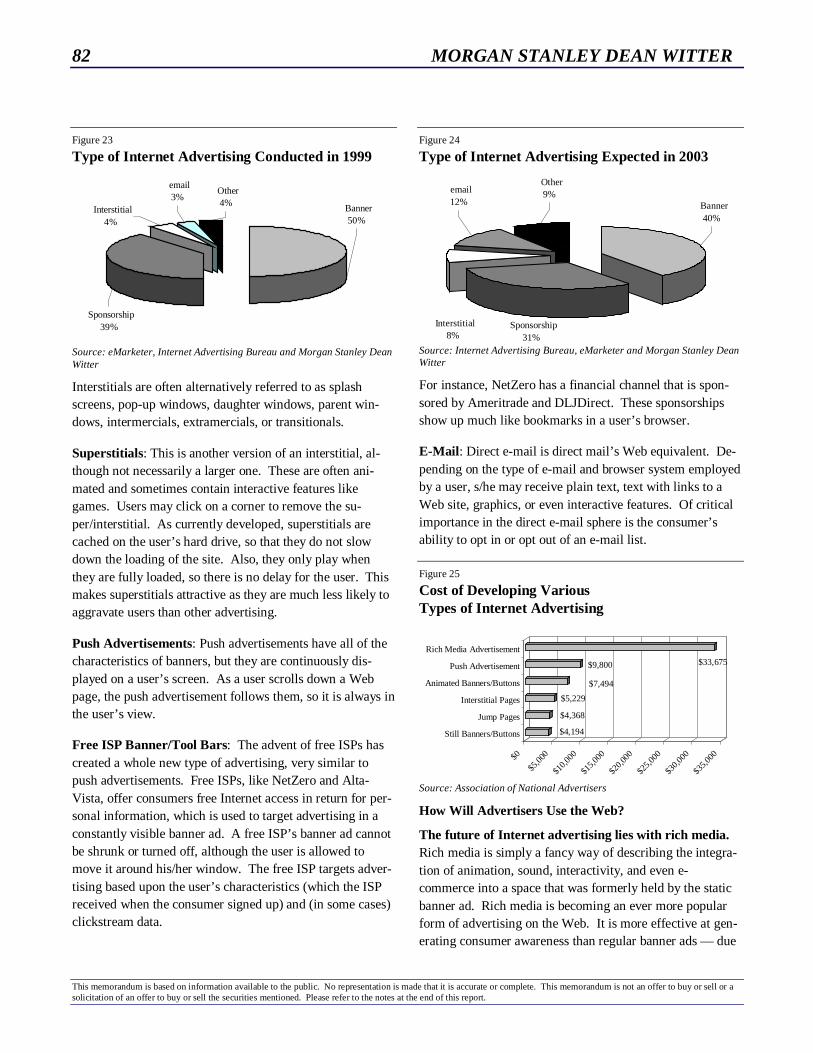
82 MORGAN STANLEY DEAN WITTER
This memorandum is based on information available to the public. No representation is made that it is accurate or complete. This memorandum is not an offer to buy or sell or asolicitation of an offer to buy or sell the securities mentioned. Please refer to the notes at the end of this report.
Figure 23
Type of Internet Advertising Conducted in 1999
Banner50%
Sponsorship39%
Interstitial4%
email3%
Other4%
Source: eMarketer, Internet Advertising Bureau and Morgan Stanley DeanWitter
Interstitials are often alternatively referred to as splashscreens, pop-up windows, daughter windows, parent win-dows, intermercials, extramercials, or transitionals.
Superstitials: This is another version of an interstitial, al-though not necessarily a larger one. These are often ani-mated and sometimes contain interactive features likegames. Users may click on a corner to remove the su-per/interstitial. As currently developed, superstitials arecached on the user’s hard drive, so that they do not slowdown the loading of the site. Also, they only play whenthey are fully loaded, so there is no delay for the user. Thismakes superstitials attractive as they are much less likely toaggravate users than other advertising.
Push Advertisements: Push advertisements have all of thecharacteristics of banners, but they are continuously dis-played on a user’s screen. As a user scrolls down a Webpage, the push advertisement follows them, so it is always inthe user’s view.
Free ISP Banner/Tool Bars: The advent of free ISPs hascreated a whole new type of advertising, very similar topush advertisements. Free ISPs, like NetZero and Alta-Vista, offer consumers free Internet access in return for per-sonal information, which is used to target advertising in aconstantly visible banner ad. A free ISP’s banner ad cannotbe shrunk or turned off, although the user is allowed tomove it around his/her window. The free ISP targets adver-tising based upon the user’s characteristics (which the ISPreceived when the consumer signed up) and (in some cases)clickstream data.
Figure 24
Type of Internet Advertising Expected in 2003
Other9% email
12%
Interstitial8%
Sponsorship31%
Banner40%
Source: Internet Advertising Bureau, eMarketer and Morgan Stanley DeanWitter
For instance, NetZero has a financial channel that is spon-sored by Ameritrade and DLJDirect. These sponsorshipsshow up much like bookmarks in a user’s browser.
E-Mail: Direct e-mail is direct mail’s Web equivalent. De-pending on the type of e-mail and browser system employedby a user, s/he may receive plain text, text with links to aWeb site, graphics, or even interactive features. Of criticalimportance in the direct e-mail sphere is the consumer’sability to opt in or opt out of an e-mail list.
Figure 25
Cost of Developing VariousTypes of Internet Advertising
$4,194
$4,368
$5,229
$7,494
$9,800 $33,675
$0
$5,00
0
$10,0
00
$15,0
00
$20,0
00
$25,0
00
$30,0
00
$35,0
00
Still Banners/Buttons
Jump Pages
Interstitial Pages
Animated Banners/Buttons
Push Advertisement
Rich Media Advertisement
Source: Association of National Advertisers
How Will Advertisers Use the Web?
The future of Internet advertising lies with rich media.Rich media is simply a fancy way of describing the integra-tion of animation, sound, interactivity, and even e-commerce into a space that was formerly held by the staticbanner ad. Rich media is becoming an ever more popularform of advertising on the Web. It is more effective at gen-erating consumer awareness than regular banner ads — due
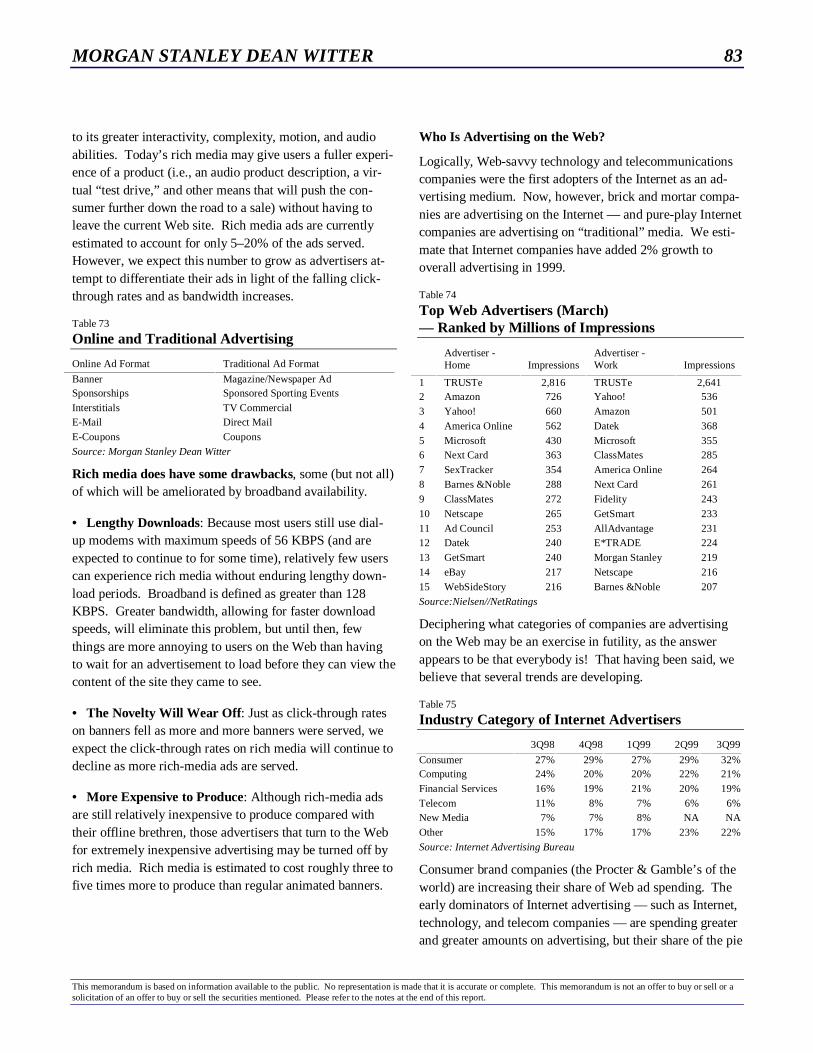
MORGAN STANLEY DEAN WITTER 83
This memorandum is based on information available to the public. No representation is made that it is accurate or complete. This memorandum is not an offer to buy or sell or asolicitation of an offer to buy or sell the securities mentioned. Please refer to the notes at the end of this report.
to its greater interactivity, complexity, motion, and audioabilities. Today’s rich media may give users a fuller experi-ence of a product (i.e., an audio product description, a vir-tual “test drive,” and other means that will push the con-sumer further down the road to a sale) without having toleave the current Web site. Rich media ads are currentlyestimated to account for only 5–20% of the ads served.However, we expect this number to grow as advertisers at-tempt to differentiate their ads in light of the falling click-through rates and as bandwidth increases.
Table 73
Online and Traditional Advertising
Online Ad Format Traditional Ad Format
Banner Magazine/Newspaper AdSponsorships Sponsored Sporting EventsInterstitials TV CommercialE-Mail Direct MailE-Coupons CouponsSource: Morgan Stanley Dean Witter
Rich media does have some drawbacks, some (but not all)of which will be ameliorated by broadband availability.
• Lengthy Downloads: Because most users still use dial-up modems with maximum speeds of 56 KBPS (and areexpected to continue to for some time), relatively few userscan experience rich media without enduring lengthy down-load periods. Broadband is defined as greater than 128KBPS. Greater bandwidth, allowing for faster downloadspeeds, will eliminate this problem, but until then, fewthings are more annoying to users on the Web than havingto wait for an advertisement to load before they can view thecontent of the site they came to see.
• The Novelty Will Wear Off: Just as click-through rateson banners fell as more and more banners were served, weexpect the click-through rates on rich media will continue todecline as more rich-media ads are served.
• More Expensive to Produce: Although rich-media adsare still relatively inexpensive to produce compared withtheir offline brethren, those advertisers that turn to the Webfor extremely inexpensive advertising may be turned off byrich media. Rich media is estimated to cost roughly three tofive times more to produce than regular animated banners.
Who Is Advertising on the Web?
Logically, Web-savvy technology and telecommunicationscompanies were the first adopters of the Internet as an ad-vertising medium. Now, however, brick and mortar compa-nies are advertising on the Internet — and pure-play Internetcompanies are advertising on “traditional” media. We esti-mate that Internet companies have added 2% growth tooverall advertising in 1999.
Table 74
Top Web Advertisers (March)— Ranked by Millions of Impressions
Advertiser -Home Impressions
Advertiser -Work Impressions
1 TRUSTe 2,816 TRUSTe 2,6412 Amazon 726 Yahoo! 5363 Yahoo! 660 Amazon 5014 America Online 562 Datek 3685 Microsoft 430 Microsoft 3556 Next Card 363 ClassMates 2857 SexTracker 354 America Online 2648 Barnes &Noble 288 Next Card 2619 ClassMates 272 Fidelity 24310 Netscape 265 GetSmart 23311 Ad Council 253 AllAdvantage 23112 Datek 240 E*TRADE 22413 GetSmart 240 Morgan Stanley 21914 eBay 217 Netscape 21615 WebSideStory 216 Barnes &Noble 207Source:Nielsen//NetRatings
Deciphering what categories of companies are advertisingon the Web may be an exercise in futility, as the answerappears to be that everybody is! That having been said, webelieve that several trends are developing.
Table 75
Industry Category of Internet Advertisers
3Q98 4Q98 1Q99 2Q99 3Q99
Consumer 27% 29% 27% 29% 32%Computing 24% 20% 20% 22% 21%Financial Services 16% 19% 21% 20% 19%Telecom 11% 8% 7% 6% 6%New Media 7% 7% 8% NA NAOther 15% 17% 17% 23% 22%Source: Internet Advertising Bureau
Consumer brand companies (the Procter & Gamble’s of theworld) are increasing their share of Web ad spending. Theearly dominators of Internet advertising — such as Internet,technology, and telecom companies — are spending greaterand greater amounts on advertising, but their share of the pie

84 MORGAN STANLEY DEAN WITTER
This memorandum is based on information available to the public. No representation is made that it is accurate or complete. This memorandum is not an offer to buy or sell or asolicitation of an offer to buy or sell the securities mentioned. Please refer to the notes at the end of this report.
is shrinking as others ramp up their Web advertising. Fi-nancial companies have also been increasing their share ofInternet advertising.
Looking forward, we believe that three broadly definedcategories of advertisers will advertise heavily on the Inter-net. These three categories share several characteristics, themost important of which is that their products can be moreeasily purchased online. It is precisely for this reason thatwe believe they will also advertise heavily online. After all,when the sales cycle can be completed so quickly, over onemedium, it makes sense for the companies that have the bestability to sell items online to also advertise online.
Figure 26
Top Internet Advertising Categories of 3Q99
Consumer32%
Computing21%
Financial Services19%
Telecom6%
Other22%
Source: Internet Advertising Bureau
The three categories that we see dominating Internet adver-tising going forward are:
1) Considered Purchases: These are goods or servicesthat require research before a purchase is made. Auto-mobiles and travel are two such areas, as consumers areapt to do extensive research before purchasing thesehigh-cost items.
2) Highly Varied Items and Services: Items for whichmany different variations exist are likely to be adver-tised heavily on the Internet. Jobs fit this category, asconsumers can use the Internet’s search abilities to digdeeply into databases to find what they are looking for.
3) Electronic Delivery Services: Services that can beconducted electronically will also be big advertisers on
the Internet. Financial services, insurance, and creditcard issuers fit this category.
Who Is Receiving Web Advertising? Attractive Demos
Internet users have some very appealing demographics foradvertisers. The typical Internet user is in one of the morecoveted age groups: 32% are between the ages of 35–44 and23% are 25–34, according to eMarketer.
Figure 27
Appealing Demographics:Internet Usage by Age Group
18-2414%
35-4432%
45-5417%
55-649%
65+5%
25-3423%
Source: eMarketer
More important than age groups to advertisers, Internetusers have money! 29% of users earn $50,000–75,000 ayear, and 18% earn over $100,000 per year, according toJupiter Communications.
While 18% of Internet users earn over $100,000 annually,only 13% of the general U.S. population earns that much.Only 21% of the general population falls in the $50,000–75,000 range, compared with 29% of Internet users.Interestingly, the bottom end of the spectrum (those earningunder $30,000) are also over-represented in the Internetpopulation.
Best of all for technology advertisers, Internet users areearly adopters of technology and (obviously) have access toa personal computer, making them ideal for certain types oftechnology advertisers.
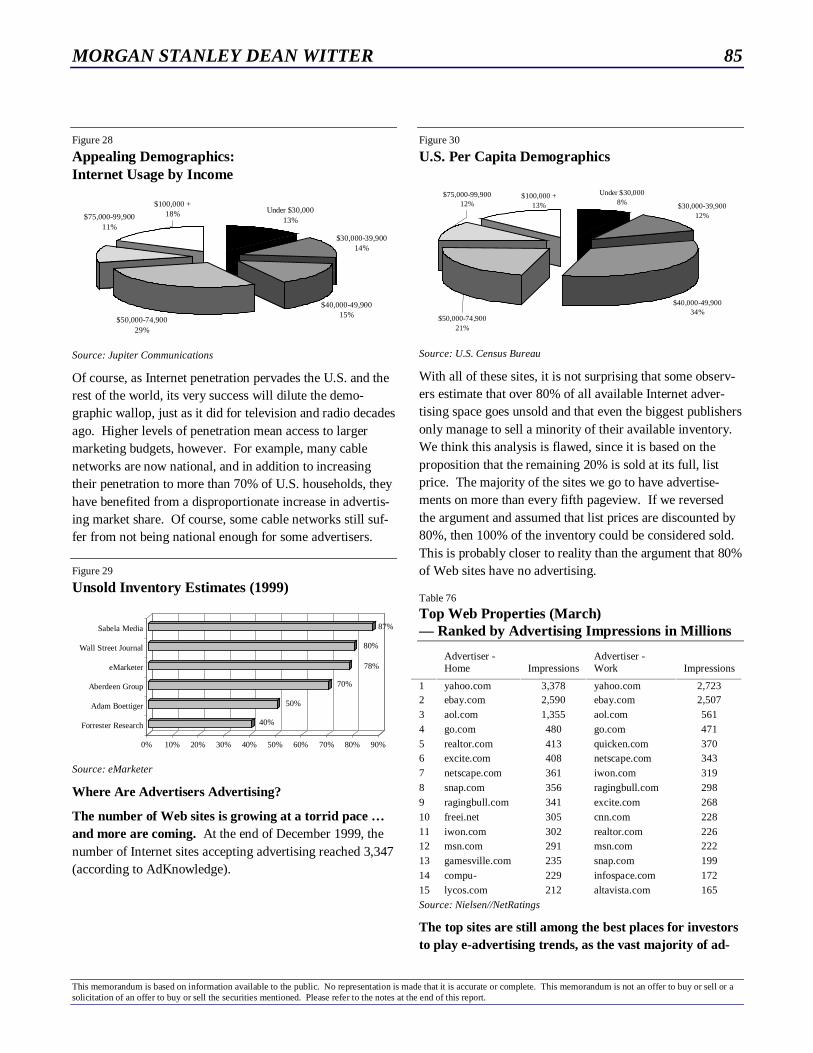
MORGAN STANLEY DEAN WITTER 85
This memorandum is based on information available to the public. No representation is made that it is accurate or complete. This memorandum is not an offer to buy or sell or asolicitation of an offer to buy or sell the securities mentioned. Please refer to the notes at the end of this report.
Figure 28
Appealing Demographics:Internet Usage by Income
Under $30,00013%
$30,000-39,90014%
$40,000-49,90015%
$50,000-74,90029%
$75,000-99,90011%
$100,000 +18%
Source: Jupiter Communications
Of course, as Internet penetration pervades the U.S. and therest of the world, its very success will dilute the demo-graphic wallop, just as it did for television and radio decadesago. Higher levels of penetration mean access to largermarketing budgets, however. For example, many cablenetworks are now national, and in addition to increasingtheir penetration to more than 70% of U.S. households, theyhave benefited from a disproportionate increase in advertis-ing market share. Of course, some cable networks still suf-fer from not being national enough for some advertisers.
Figure 29
Unsold Inventory Estimates (1999)
40%
50%
70%
78%
80%
87%
0% 10% 20% 30% 40% 50% 60% 70% 80% 90%
Forrester Research
Adam Boettiger
Aberdeen Group
eMarketer
Wall Street Journal
Sabela Media
Source: eMarketer
Where Are Advertisers Advertising?
The number of Web sites is growing at a torrid pace …and more are coming. At the end of December 1999, thenumber of Internet sites accepting advertising reached 3,347(according to AdKnowledge).
Figure 30
U.S. Per Capita Demographics
Under $30,0008% $30,000-39,900
12%
$40,000-49,90034%
$50,000-74,90021%
$100,000 +13%
$75,000-99,90012%
Source: U.S. Census Bureau
With all of these sites, it is not surprising that some observ-ers estimate that over 80% of all available Internet adver-tising space goes unsold and that even the biggest publishersonly manage to sell a minority of their available inventory.We think this analysis is flawed, since it is based on theproposition that the remaining 20% is sold at its full, listprice. The majority of the sites we go to have advertise-ments on more than every fifth pageview. If we reversedthe argument and assumed that list prices are discounted by80%, then 100% of the inventory could be considered sold.This is probably closer to reality than the argument that 80%of Web sites have no advertising.
Table 76
Top Web Properties (March)— Ranked by Advertising Impressions in Millions
Advertiser -Home Impressions
Advertiser -Work Impressions
1 yahoo.com 3,378 yahoo.com 2,7232 ebay.com 2,590 ebay.com 2,5073 aol.com 1,355 aol.com 5614 go.com 480 go.com 4715 realtor.com 413 quicken.com 3706 excite.com 408 netscape.com 3437 netscape.com 361 iwon.com 3198 snap.com 356 ragingbull.com 2989 ragingbull.com 341 excite.com 26810 freei.net 305 cnn.com 22811 iwon.com 302 realtor.com 22612 msn.com 291 msn.com 22213 gamesville.com 235 snap.com 19914 compu- 229 infospace.com 17215 lycos.com 212 altavista.com 165Source: Nielsen//NetRatings
The top sites are still among the best places for investorsto play e-advertising trends, as the vast majority of ad-
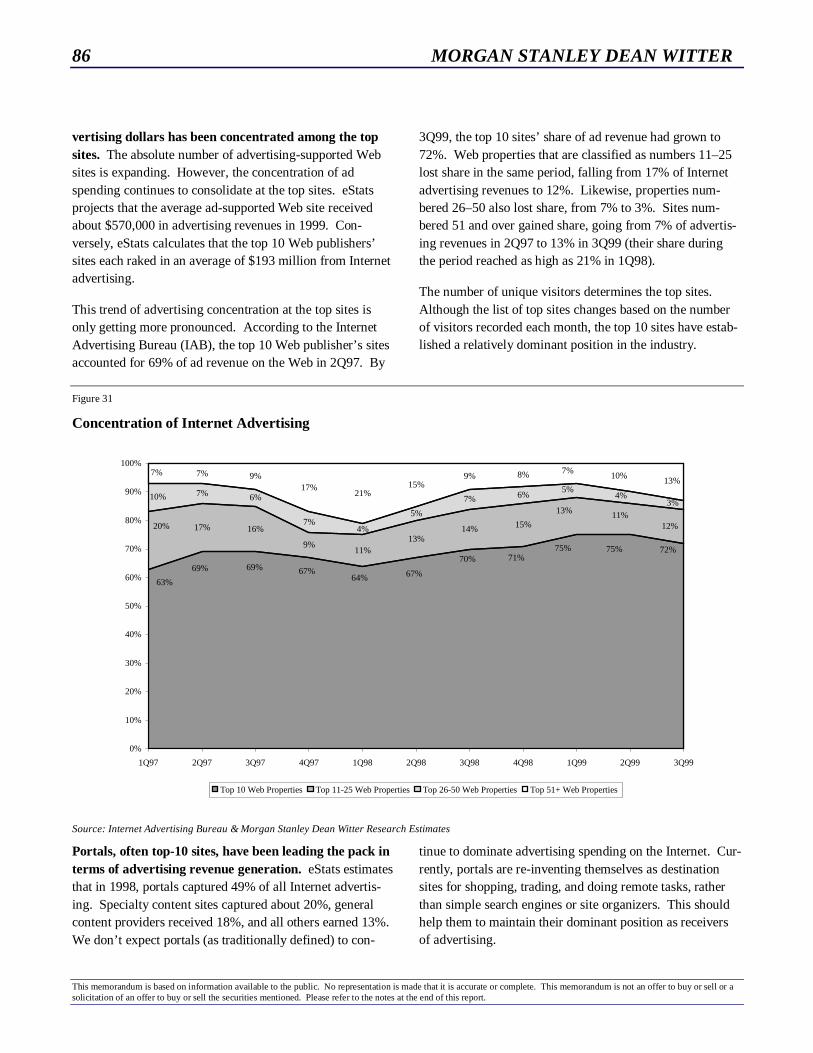
86 MORGAN STANLEY DEAN WITTER
This memorandum is based on information available to the public. No representation is made that it is accurate or complete. This memorandum is not an offer to buy or sell or asolicitation of an offer to buy or sell the securities mentioned. Please refer to the notes at the end of this report.
vertising dollars has been concentrated among the topsites. The absolute number of advertising-supported Websites is expanding. However, the concentration of adspending continues to consolidate at the top sites. eStatsprojects that the average ad-supported Web site receivedabout $570,000 in advertising revenues in 1999. Con-versely, eStats calculates that the top 10 Web publishers’sites each raked in an average of $193 million from Internetadvertising.
This trend of advertising concentration at the top sites isonly getting more pronounced. According to the InternetAdvertising Bureau (IAB), the top 10 Web publisher’s sitesaccounted for 69% of ad revenue on the Web in 2Q97. By
3Q99, the top 10 sites’ share of ad revenue had grown to72%. Web properties that are classified as numbers 11–25lost share in the same period, falling from 17% of Internetadvertising revenues to 12%. Likewise, properties num-bered 26–50 also lost share, from 7% to 3%. Sites num-bered 51 and over gained share, going from 7% of advertis-ing revenues in 2Q97 to 13% in 3Q99 (their share duringthe period reached as high as 21% in 1Q98).
The number of unique visitors determines the top sites.Although the list of top sites changes based on the numberof visitors recorded each month, the top 10 sites have estab-lished a relatively dominant position in the industry.
Figure 31
Concentration of Internet Advertising
17% 16%
9%11%
13%14% 15%
7% 6%
7%4%
5%
7% 6%
7% 9%17%
21%15%
9% 8%
72%75%75%71%70%
67%64%67%69%69%
63%
12%11%
20%
13%3%
4%10%5%
13%10%7% 7%
0%
10%
20%
30%
40%
50%
60%
70%
80%
90%
100%
1Q97 2Q97 3Q97 4Q97 1Q98 2Q98 3Q98 4Q98 1Q99 2Q99 3Q99
Top 10 Web Properties Top 11-25 Web Properties Top 26-50 Web Properties Top 51+ Web Properties
Source: Internet Advertising Bureau & Morgan Stanley Dean Witter Research Estimates
Portals, often top-10 sites, have been leading the pack interms of advertising revenue generation. eStats estimatesthat in 1998, portals captured 49% of all Internet advertis-ing. Specialty content sites captured about 20%, generalcontent providers received 18%, and all others earned 13%.We don’t expect portals (as traditionally defined) to con-
tinue to dominate advertising spending on the Internet. Cur-rently, portals are re-inventing themselves as destinationsites for shopping, trading, and doing remote tasks, ratherthan simple search engines or site organizers. This shouldhelp them to maintain their dominant position as receiversof advertising.
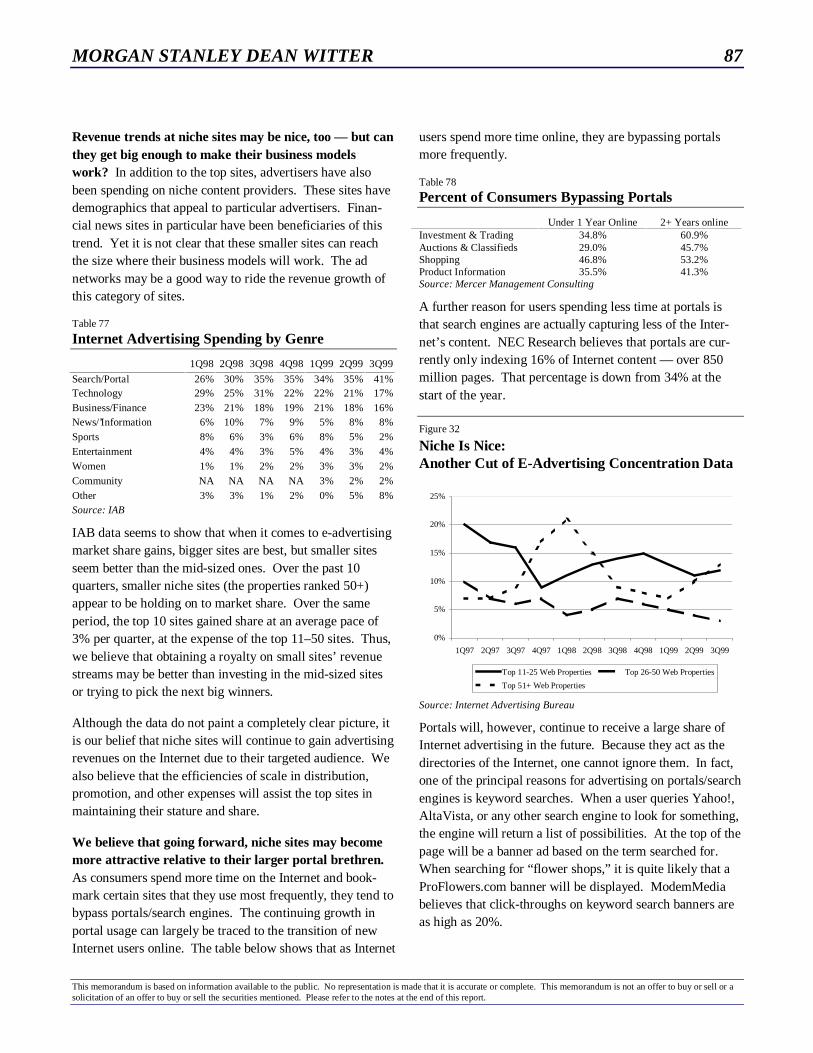
MORGAN STANLEY DEAN WITTER 87
This memorandum is based on information available to the public. No representation is made that it is accurate or complete. This memorandum is not an offer to buy or sell or asolicitation of an offer to buy or sell the securities mentioned. Please refer to the notes at the end of this report.
Revenue trends at niche sites may be nice, too — but canthey get big enough to make their business modelswork? In addition to the top sites, advertisers have alsobeen spending on niche content providers. These sites havedemographics that appeal to particular advertisers. Finan-cial news sites in particular have been beneficiaries of thistrend. Yet it is not clear that these smaller sites can reachthe size where their business models will work. The adnetworks may be a good way to ride the revenue growth ofthis category of sites.
Table 77
Internet Advertising Spending by Genre
1Q98 2Q98 3Q98 4Q98 1Q99 2Q99 3Q99
Search/Portal 26% 30% 35% 35% 34% 35% 41%Technology 29% 25% 31% 22% 22% 21% 17%Business/Finance 23% 21% 18% 19% 21% 18% 16%News/’Information 6% 10% 7% 9% 5% 8% 8%Sports 8% 6% 3% 6% 8% 5% 2%Entertainment 4% 4% 3% 5% 4% 3% 4%Women 1% 1% 2% 2% 3% 3% 2%Community NA NA NA NA 3% 2% 2%Other 3% 3% 1% 2% 0% 5% 8%Source: IAB
IAB data seems to show that when it comes to e-advertisingmarket share gains, bigger sites are best, but smaller sitesseem better than the mid-sized ones. Over the past 10quarters, smaller niche sites (the properties ranked 50+)appear to be holding on to market share. Over the sameperiod, the top 10 sites gained share at an average pace of3% per quarter, at the expense of the top 11–50 sites. Thus,we believe that obtaining a royalty on small sites’ revenuestreams may be better than investing in the mid-sized sitesor trying to pick the next big winners.
Although the data do not paint a completely clear picture, itis our belief that niche sites will continue to gain advertisingrevenues on the Internet due to their targeted audience. Wealso believe that the efficiencies of scale in distribution,promotion, and other expenses will assist the top sites inmaintaining their stature and share.
We believe that going forward, niche sites may becomemore attractive relative to their larger portal brethren.As consumers spend more time on the Internet and book-mark certain sites that they use most frequently, they tend tobypass portals/search engines. The continuing growth inportal usage can largely be traced to the transition of newInternet users online. The table below shows that as Internet
users spend more time online, they are bypassing portalsmore frequently.
Table 78
Percent of Consumers Bypassing Portals
Under 1 Year Online 2+ Years onlineInvestment & Trading 34.8% 60.9%Auctions & Classifieds 29.0% 45.7%Shopping 46.8% 53.2%Product Information 35.5% 41.3%Source: Mercer Management Consulting
A further reason for users spending less time at portals isthat search engines are actually capturing less of the Inter-net’s content. NEC Research believes that portals are cur-rently only indexing 16% of Internet content — over 850million pages. That percentage is down from 34% at thestart of the year.
Figure 32
Niche Is Nice:Another Cut of E-Advertising Concentration Data
0%
5%
10%
15%
20%
25%
1Q97 2Q97 3Q97 4Q97 1Q98 2Q98 3Q98 4Q98 1Q99 2Q99 3Q99
Top 11-25 Web Properties Top 26-50 Web Properties
Top 51+ Web Properties
Source: Internet Advertising Bureau
Portals will, however, continue to receive a large share ofInternet advertising in the future. Because they act as thedirectories of the Internet, one cannot ignore them. In fact,one of the principal reasons for advertising on portals/searchengines is keyword searches. When a user queries Yahoo!,AltaVista, or any other search engine to look for something,the engine will return a list of possibilities. At the top of thepage will be a banner ad based on the term searched for.When searching for “flower shops,” it is quite likely that aProFlowers.com banner will be displayed. ModemMediabelieves that click-throughs on keyword search banners areas high as 20%.
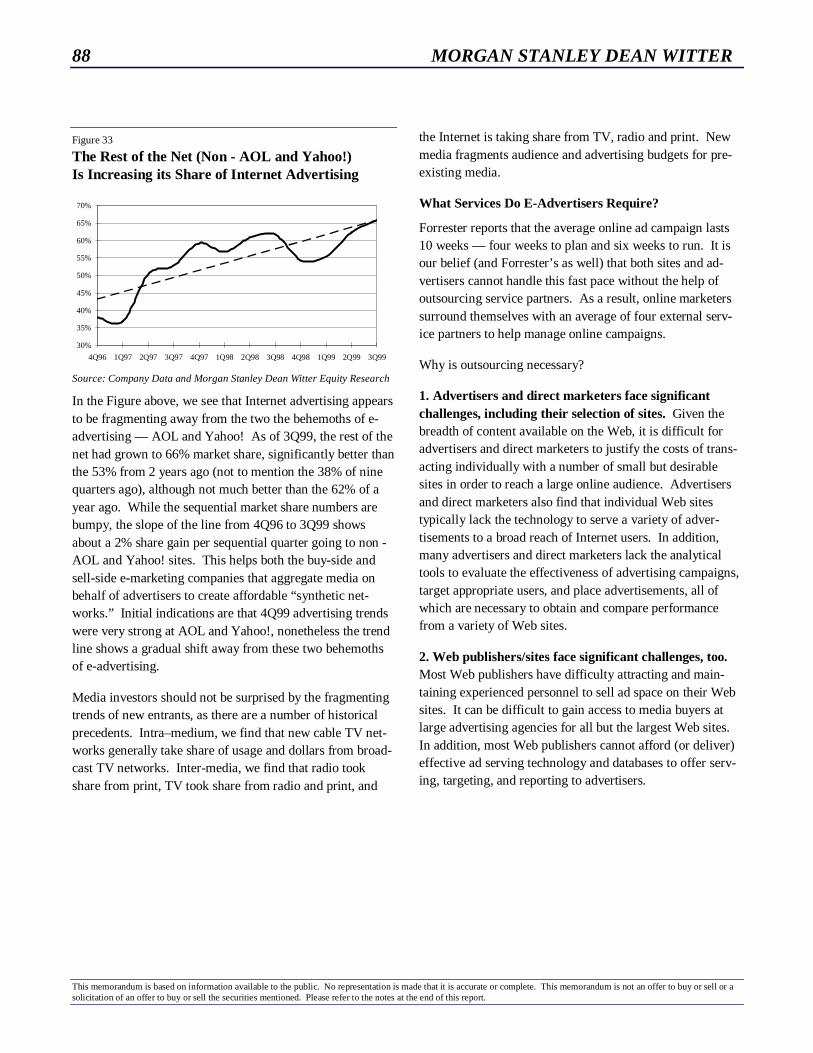
88 MORGAN STANLEY DEAN WITTER
This memorandum is based on information available to the public. No representation is made that it is accurate or complete. This memorandum is not an offer to buy or sell or asolicitation of an offer to buy or sell the securities mentioned. Please refer to the notes at the end of this report.
Figure 33
The Rest of the Net (Non - AOL and Yahoo!)Is Increasing its Share of Internet Advertising
30%
35%
40%
45%
50%
55%
60%
65%
70%
4Q96 1Q97 2Q97 3Q97 4Q97 1Q98 2Q98 3Q98 4Q98 1Q99 2Q99 3Q99
Source: Company Data and Morgan Stanley Dean Witter Equity Research
In the Figure above, we see that Internet advertising appearsto be fragmenting away from the two the behemoths of e-advertising — AOL and Yahoo! As of 3Q99, the rest of thenet had grown to 66% market share, significantly better thanthe 53% from 2 years ago (not to mention the 38% of ninequarters ago), although not much better than the 62% of ayear ago. While the sequential market share numbers arebumpy, the slope of the line from 4Q96 to 3Q99 showsabout a 2% share gain per sequential quarter going to non -AOL and Yahoo! sites. This helps both the buy-side andsell-side e-marketing companies that aggregate media onbehalf of advertisers to create affordable “synthetic net-works.” Initial indications are that 4Q99 advertising trendswere very strong at AOL and Yahoo!, nonetheless the trendline shows a gradual shift away from these two behemothsof e-advertising.
Media investors should not be surprised by the fragmentingtrends of new entrants, as there are a number of historicalprecedents. Intra–medium, we find that new cable TV net-works generally take share of usage and dollars from broad-cast TV networks. Inter-media, we find that radio tookshare from print, TV took share from radio and print, and
the Internet is taking share from TV, radio and print. Newmedia fragments audience and advertising budgets for pre-existing media.
What Services Do E-Advertisers Require?
Forrester reports that the average online ad campaign lasts10 weeks — four weeks to plan and six weeks to run. It isour belief (and Forrester’s as well) that both sites and ad-vertisers cannot handle this fast pace without the help ofoutsourcing service partners. As a result, online marketerssurround themselves with an average of four external serv-ice partners to help manage online campaigns.
Why is outsourcing necessary?
1. Advertisers and direct marketers face significantchallenges, including their selection of sites. Given thebreadth of content available on the Web, it is difficult foradvertisers and direct marketers to justify the costs of trans-acting individually with a number of small but desirablesites in order to reach a large online audience. Advertisersand direct marketers also find that individual Web sitestypically lack the technology to serve a variety of adver-tisements to a broad reach of Internet users. In addition,many advertisers and direct marketers lack the analyticaltools to evaluate the effectiveness of advertising campaigns,target appropriate users, and place advertisements, all ofwhich are necessary to obtain and compare performancefrom a variety of Web sites.
2. Web publishers/sites face significant challenges, too.Most Web publishers have difficulty attracting and main-taining experienced personnel to sell ad space on their Websites. It can be difficult to gain access to media buyers atlarge advertising agencies for all but the largest Web sites.In addition, most Web publishers cannot afford (or deliver)effective ad serving technology and databases to offer serv-ing, targeting, and reporting to advertisers.

MORGAN STANLEY DEAN WITTER 89
This memorandum is based on information available to the public. No representation is made that it is accurate or complete. This memorandum is not an offer to buy or sell or asolicitation of an offer to buy or sell the securities mentioned. Please refer to the notes at the end of this report.
Industry Forecast: Internet Direct Marketing & Advertising Services
Key Points
½ We forecast that U.S. e-advertising will reach over $32 bil-
lion in 2005 — representing a CAGR of 42%. At that time,
we estimate that the Internet will account for 14% of all
U.S. advertising, up from 3% in 1999.
½ Global e-advertising and direct e-marketing should be over
$50 billion in 2005, up from $5 billion in 1999 — a CAGR
of 49%.
½ We believe the global addressable market of advertising
and marketing services is much larger than many U.S. me-
dia followers currently believe.
½ List price CPMs (cost per thousand impressions) for the
Internet will likely come down, but effective CPMs are rea-
sonable compared to other media. Effective CPMs should
go up as more inventory is sold and better comparisons
with other media are made.
Summary of Forecast
We believe that worldwide e-advertising growth trendscan be sustained at extraordinary levels for some time.We have developed a forecast for Internet advertising anddirect marketing in the U.S., Europe, Asia, and LatinAmerica, using internal Morgan Stanley Dean Witter Re-search forecasts, as well as external forecasts. We havedeveloped these forecasts through the help of Mary Meekerand Mark Mahaney in the Internet space and Jeff Camp,Stephen Flynn and April Henry in the Internet and DataServices space. We detail our U.S. forecasts below, buthave limited our international forecasts due to a lack of dataregarding international Internet usage and advertising.
Table 79
Global e-Advertising and Direct e-Marketing Summary
($ Millions) 1996 1997 1998 1999E 2000E 2001E 2002E 2003E 2004E
U.S. Internet Advertising 301 843 1,800 3,982 6,600 11,100 17,600 23,700 28,300
% growth 447% 180% 114% 121% 66% 68% 59% 35% 19%
Europe Internet Advertising 6 40 84 215 658 1,341 2,000 4,000 5,500
% growth NA 533% 111% 155% 206% 104% 49% 100% 38%
Asia Pacific Internet Advertising 0 0 90 166 347 691 1,236 2,070 3,321
% growth NA NA NA 84% 109% 99% 79% 67% 60%
Latin America Internet Advertising 0 0 0 51 121 260 517 949 1,646
% growth NA NA NA NA 137% 115% 99% 84% 73%
World Internet Advertising 307 883 1,974 4,414 7,726 13,392 21,353 30,719 38,767
% growth NA 187% 124% 124% 75% 73% 59% 44% 26%
U.S. Direct E-Marketing 0 0 17 97 289 751 1,322 1,994 2,800
% growth NA NA NA NA 198% 160% 76% 51% 40%
Europe Direct E-Marketing 0 0 0 10 30 90 150 340 540
% growth NA NA NA NA 200% 200% 67% 127% 59%
Asia Pacific Direct E-Marketing 0 0 0 0 0 0 62 86 175
% growth NA NA NA NA NA NA NA 40% 102%
Latin America Direct E-Marketing 0 0 0 0 0 0 0 9 40
% growth NA NA NA NA NA NA NA NA NA
World Direct E-Marketing 0 0 17 107 319 841 1,534 2,429 3,555
% growth NA NA NA NA 198% 164% 82% 58% 46%
Total World E-Ad and E-DM 307 883 1,991 4,521 8,045 14,233 22,887 33,148 42,322
187% 126% 127% 78% 77% 61% 45% 28%
Source: Morgan Stanley Dean Witter Research
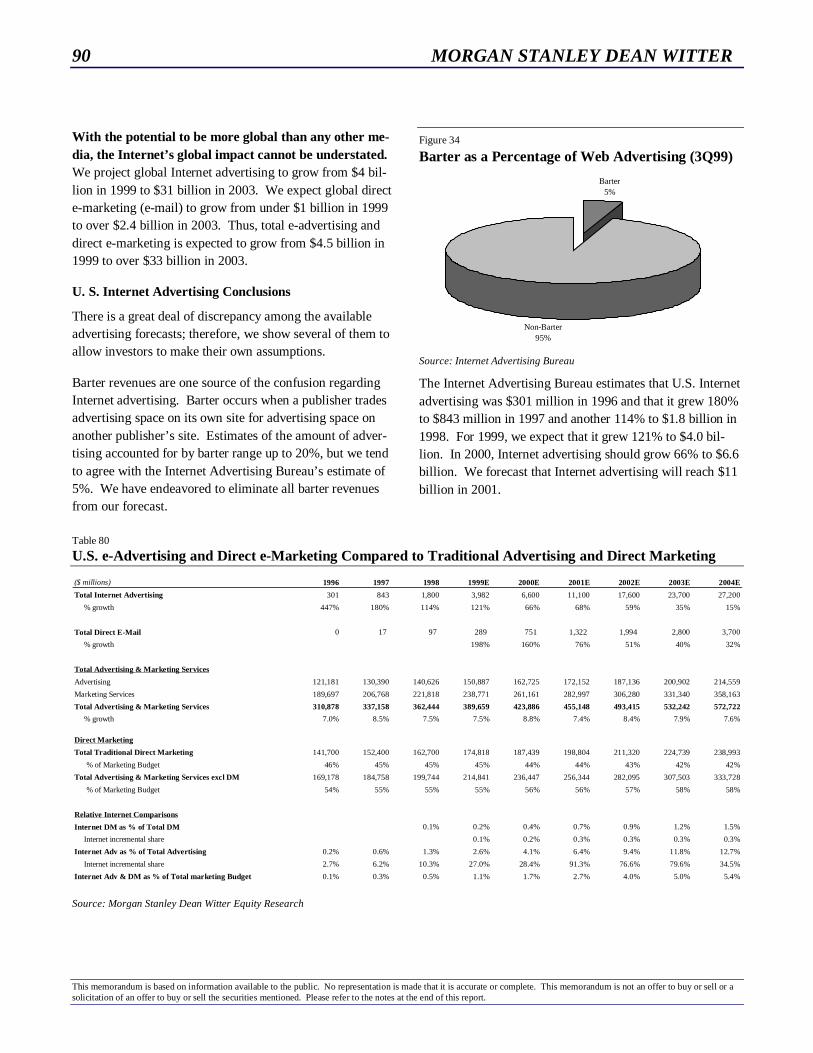
90 MORGAN STANLEY DEAN WITTER
This memorandum is based on information available to the public. No representation is made that it is accurate or complete. This memorandum is not an offer to buy or sell or asolicitation of an offer to buy or sell the securities mentioned. Please refer to the notes at the end of this report.
With the potential to be more global than any other me-dia, the Internet’s global impact cannot be understated.We project global Internet advertising to grow from $4 bil-lion in 1999 to $31 billion in 2003. We expect global directe-marketing (e-mail) to grow from under $1 billion in 1999to over $2.4 billion in 2003. Thus, total e-advertising anddirect e-marketing is expected to grow from $4.5 billion in1999 to over $33 billion in 2003.
U. S. Internet Advertising Conclusions
There is a great deal of discrepancy among the availableadvertising forecasts; therefore, we show several of them toallow investors to make their own assumptions.
Barter revenues are one source of the confusion regardingInternet advertising. Barter occurs when a publisher tradesadvertising space on its own site for advertising space onanother publisher’s site. Estimates of the amount of adver-tising accounted for by barter range up to 20%, but we tendto agree with the Internet Advertising Bureau’s estimate of5%. We have endeavored to eliminate all barter revenuesfrom our forecast.
Figure 34
Barter as a Percentage of Web Advertising (3Q99)
Barter5%
Non-Barter95%
Source: Internet Advertising Bureau
The Internet Advertising Bureau estimates that U.S. Internetadvertising was $301 million in 1996 and that it grew 180%to $843 million in 1997 and another 114% to $1.8 billion in1998. For 1999, we expect that it grew 121% to $4.0 bil-lion. In 2000, Internet advertising should grow 66% to $6.6billion. We forecast that Internet advertising will reach $11billion in 2001.
Table 80
U.S. e-Advertising and Direct e-Marketing Compared to Traditional Advertising and Direct Marketing
($ millions) 1996 1997 1998 1999E 2000E 2001E 2002E 2003E 2004E
Total Internet Advertising 301 843 1,800 3,982 6,600 11,100 17,600 23,700 27,200
% growth 447% 180% 114% 121% 66% 68% 59% 35% 15%
Total Direct E-Mail 0 17 97 289 751 1,322 1,994 2,800 3,700
% growth 198% 160% 76% 51% 40% 32%
Total Advertising & Marketing Services
Advertising 121,181 130,390 140,626 150,887 162,725 172,152 187,136 200,902 214,559
Marketing Services 189,697 206,768 221,818 238,771 261,161 282,997 306,280 331,340 358,163
Total Advertising & Marketing Services 310,878 337,158 362,444 389,659 423,886 455,148 493,415 532,242 572,722
% growth 7.0% 8.5% 7.5% 7.5% 8.8% 7.4% 8.4% 7.9% 7.6%
Direct Marketing
Total Traditional Direct Marketing 141,700 152,400 162,700 174,818 187,439 198,804 211,320 224,739 238,993
% of Marketing Budget 46% 45% 45% 45% 44% 44% 43% 42% 42%
Total Advertising & Marketing Services excl DM 169,178 184,758 199,744 214,841 236,447 256,344 282,095 307,503 333,728
% of Marketing Budget 54% 55% 55% 55% 56% 56% 57% 58% 58%
Relative Internet Comparisons
Internet DM as % of Total DM 0.1% 0.2% 0.4% 0.7% 0.9% 1.2% 1.5%
Internet incremental share 0.1% 0.2% 0.3% 0.3% 0.3% 0.3%
Internet Adv as % of Total Advertising 0.2% 0.6% 1.3% 2.6% 4.1% 6.4% 9.4% 11.8% 12.7%
Internet incremental share 2.7% 6.2% 10.3% 27.0% 28.4% 91.3% 76.6% 79.6% 34.5%
Internet Adv & DM as % of Total marketing Budget 0.1% 0.3% 0.5% 1.1% 1.7% 2.7% 4.0% 5.0% 5.4%
Source: Morgan Stanley Dean Witter Equity Research
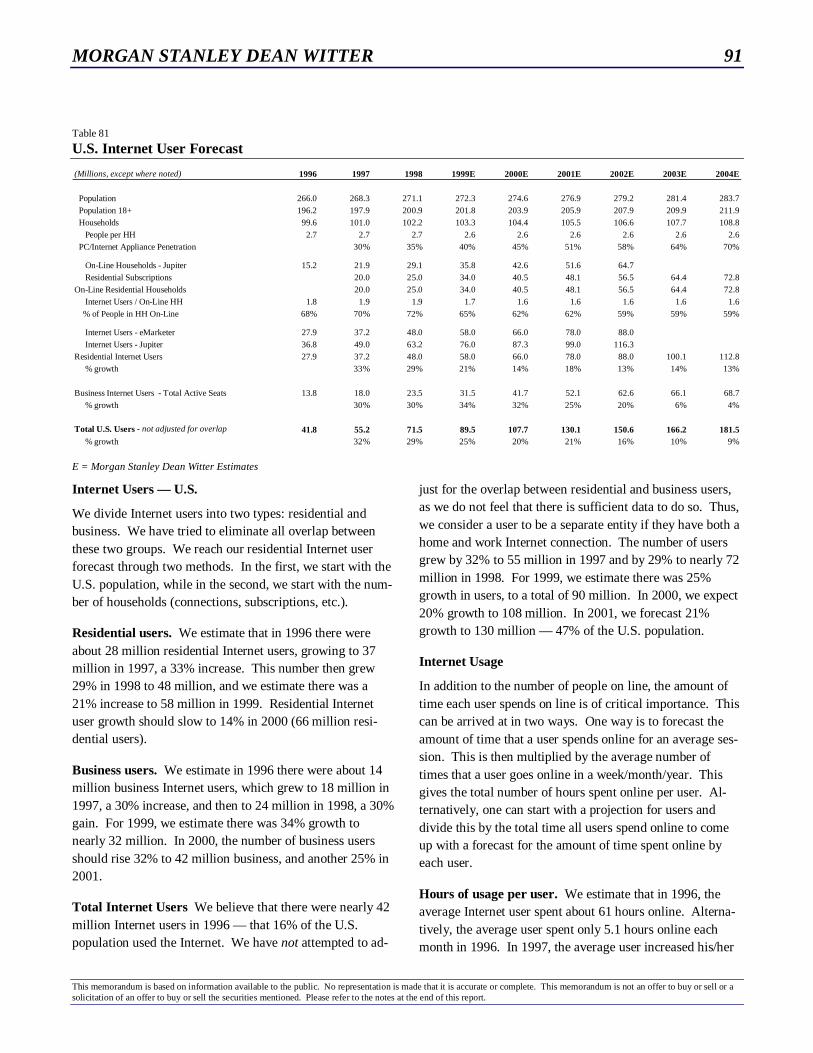
MORGAN STANLEY DEAN WITTER 91
This memorandum is based on information available to the public. No representation is made that it is accurate or complete. This memorandum is not an offer to buy or sell or asolicitation of an offer to buy or sell the securities mentioned. Please refer to the notes at the end of this report.
Table 81
U.S. Internet User Forecast
(Millions, except where noted) 1996 1997 1998 1999E 2000E 2001E 2002E 2003E 2004E
Population 266.0 268.3 271.1 272.3 274.6 276.9 279.2 281.4 283.7 Population 18+ 196.2 197.9 200.9 201.8 203.9 205.9 207.9 209.9 211.9 Households 99.6 101.0 102.2 103.3 104.4 105.5 106.6 107.7 108.8 People per HH 2.7 2.7 2.7 2.6 2.6 2.6 2.6 2.6 2.6 PC/Internet Appliance Penetration 30% 35% 40% 45% 51% 58% 64% 70%
On-Line Households - Jupiter 15.2 21.9 29.1 35.8 42.6 51.6 64.7 Residential Subscriptions 20.0 25.0 34.0 40.5 48.1 56.5 64.4 72.8On-Line Residential Households 20.0 25.0 34.0 40.5 48.1 56.5 64.4 72.8 Internet Users / On-Line HH 1.8 1.9 1.9 1.7 1.6 1.6 1.6 1.6 1.6 % of People in HH On-Line 68% 70% 72% 65% 62% 62% 59% 59% 59%
Internet Users - eMarketer 27.9 37.2 48.0 58.0 66.0 78.0 88.0 Internet Users - Jupiter 36.8 49.0 63.2 76.0 87.3 99.0 116.3Residential Internet Users 27.9 37.2 48.0 58.0 66.0 78.0 88.0 100.1 112.8 % growth 33% 29% 21% 14% 18% 13% 14% 13%
Business Internet Users - Total Active Seats 13.8 18.0 23.5 31.5 41.7 52.1 62.6 66.1 68.7 % growth 30% 30% 34% 32% 25% 20% 6% 4%
Total U.S. Users - not adjusted for overlap 41.8 55.2 71.5 89.5 107.7 130.1 150.6 166.2 181.5 % growth 32% 29% 25% 20% 21% 16% 10% 9%
E = Morgan Stanley Dean Witter Estimates
Internet Users — U.S.
We divide Internet users into two types: residential andbusiness. We have tried to eliminate all overlap betweenthese two groups. We reach our residential Internet userforecast through two methods. In the first, we start with theU.S. population, while in the second, we start with the num-ber of households (connections, subscriptions, etc.).
Residential users. We estimate that in 1996 there wereabout 28 million residential Internet users, growing to 37million in 1997, a 33% increase. This number then grew29% in 1998 to 48 million, and we estimate there was a21% increase to 58 million in 1999. Residential Internetuser growth should slow to 14% in 2000 (66 million resi-dential users).
Business users. We estimate in 1996 there were about 14million business Internet users, which grew to 18 million in1997, a 30% increase, and then to 24 million in 1998, a 30%gain. For 1999, we estimate there was 34% growth tonearly 32 million. In 2000, the number of business usersshould rise 32% to 42 million business, and another 25% in2001.
Total Internet Users We believe that there were nearly 42million Internet users in 1996 — that 16% of the U.S.population used the Internet. We have not attempted to ad-
just for the overlap between residential and business users,as we do not feel that there is sufficient data to do so. Thus,we consider a user to be a separate entity if they have both ahome and work Internet connection. The number of usersgrew by 32% to 55 million in 1997 and by 29% to nearly 72million in 1998. For 1999, we estimate there was 25%growth in users, to a total of 90 million. In 2000, we expect20% growth to 108 million. In 2001, we forecast 21%growth to 130 million — 47% of the U.S. population.
Internet Usage
In addition to the number of people on line, the amount oftime each user spends on line is of critical importance. Thiscan be arrived at in two ways. One way is to forecast theamount of time that a user spends online for an average ses-sion. This is then multiplied by the average number oftimes that a user goes online in a week/month/year. Thisgives the total number of hours spent online per user. Al-ternatively, one can start with a projection for users anddivide this by the total time all users spend online to comeup with a forecast for the amount of time spent online byeach user.
Hours of usage per user. We estimate that in 1996, theaverage Internet user spent about 61 hours online. Alterna-tively, the average user spent only 5.1 hours online eachmonth in 1996. In 1997, the average user increased his/her

92 MORGAN STANLEY DEAN WITTER
This memorandum is based on information available to the public. No representation is made that it is accurate or complete. This memorandum is not an offer to buy or sell or asolicitation of an offer to buy or sell the securities mentioned. Please refer to the notes at the end of this report.
usage to 68 hours, or 11% growth. On a monthly basis, theaverage user spent 5.6 hours online. In 1998, Internet usageincreased 16% to an estimated 78 hours per user. On amonthly basis, the average user spent 6.5 hours on line. Weestimate that Internet usage climbed 21% to 95 hours peruser per year in 1999, or 7.9 hours per month. For 2000 and2001, we expect that the average user will spend 119 and143 hours online, respectively. This represents 26% and20% growth in usage. On a monthly basis, we expect thatthe average user will spend 9.9 and 11.9 hours on line in2000 and 2001, respectively.
Usage is the critical assumption underlying a great manyInternet projections. We have taken a look at the availablehistorical usage figures provided by Media Metrix and Niel-sen//NetRatings, as well as projections of future Internetusage by Jupiter, Forrester, and others to arrive at our ownforecast for usage. There is a great deal of discrepancy be-tween forecasts, and more surprisingly, between the histori-cal data as well.
Media Metrix and Nielsen//NetRatings differ in their meth-odologies. Media Metrix claims to have a 70,000-userpanel, consisting of 50,000 home users, 7,000 work users,and 20,000 international users. Nielsen//NetRatings claimsto have a 85,000-user panel, consisting of 43,000 home us-ers, 7,000 work users and 35,000 international users.
Media Metrix began life as a PC monitoring firm, keepingtabs on all of the computer programs that were in operation.From this sprang the idea to monitor Web sites. On theother hand, Nielsen//NetRatings is an independent arm ofNielsen Media Research, which is the #1 television meas-urement service.
In comparing the data, we come to several general conclu-sions. We find that Nielsen//NetRatings typically hashigher days of usage than Media Metrix (an average of 4+days a month and 50 days a year). However, Media Metrixtypically calculates a longer online session (about 11 min-
utes longer than Nielsen//NetRatings). This is long enoughto make up for the greater number of times that Niel-sen//NetRatings believes people go on line. In fact, MediaMetrix calculates that users spend more time on line permonth (an average of about 14 minutes longer) and per yearthan Nielsen//NetRatings. Media Metrix also calculates ahigher number of pageviews than Nielsen//NetRatings on aper session (about 17 more pageviews), per hour (about 12more pageviews), per month, and per year basis.
Table 82
Nielsen//NetRatings vs. Media Metrix Usage(Average Month — September 1999)
Nielsen// NetRatings Media Metrix
Days of usage per person, per month 16 12Days of Usage per Year 192 144Minutes of UsageMinutes of usage per session 28.3 38.5Minutes of usage per month 450.9 463.3Minutes of usage per year 5,410.2 5,559.6PageviewsPageviews per hour 55.4 61.6Pageviews per session 26.0 39.5Pageviews per month 409.0 476.0Pageviews per year 4,908.0 5,293.5Sources: Nielsen//NetRatings and Media Metrix
Pageviews Pageviews are critical, because they determinethe number of ads that a user views during his/her time on-line. (Of a course, a single page — one pageview — mayhave several, or no, ads on it. We have assumed an averageof two ads per Web page.) For calculating pageviews, westart with the number of pageviews that an average userviews in an hour. We then gross this number up to the totalnumber of pageviews in a year. In 1996, we believe that theaverage user viewed 25 pages per hour. This numberjumped about 48% to 37 pages per hour in 1997. In 1998,pageviews per hour climbed about 34% to 50. In 1999, webelieve that this increased 21%, to 60 pageviews per hour.Assuming an average of two ads per page, we calculate thenumber of ads served.
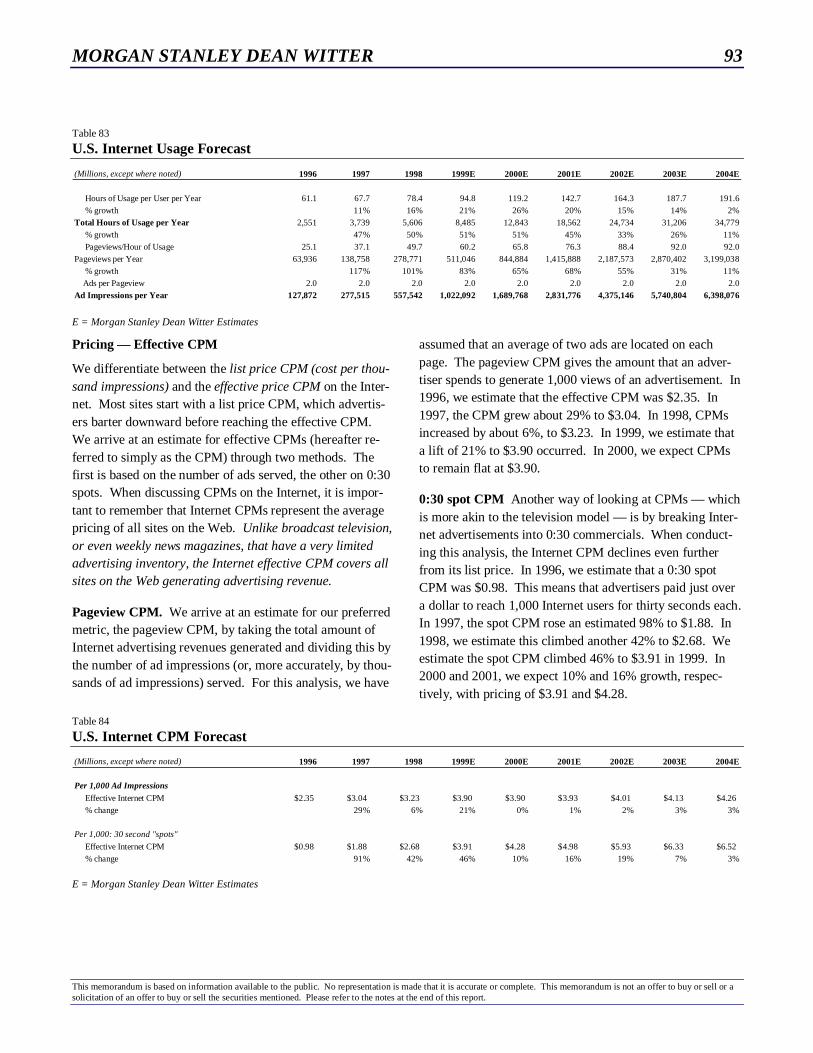
MORGAN STANLEY DEAN WITTER 93
This memorandum is based on information available to the public. No representation is made that it is accurate or complete. This memorandum is not an offer to buy or sell or asolicitation of an offer to buy or sell the securities mentioned. Please refer to the notes at the end of this report.
Table 83
U.S. Internet Usage Forecast
(Millions, except where noted) 1996 1997 1998 1999E 2000E 2001E 2002E 2003E 2004E
Hours of Usage per User per Year 61.1 67.7 78.4 94.8 119.2 142.7 164.3 187.7 191.6 % growth 11% 16% 21% 26% 20% 15% 14% 2%Total Hours of Usage per Year 2,551 3,739 5,606 8,485 12,843 18,562 24,734 31,206 34,779 % growth 47% 50% 51% 51% 45% 33% 26% 11% Pageviews/Hour of Usage 25.1 37.1 49.7 60.2 65.8 76.3 88.4 92.0 92.0Pageviews per Year 63,936 138,758 278,771 511,046 844,884 1,415,888 2,187,573 2,870,402 3,199,038 % growth 117% 101% 83% 65% 68% 55% 31% 11% Ads per Pageview 2.0 2.0 2.0 2.0 2.0 2.0 2.0 2.0 2.0Ad Impressions per Year 127,872 277,515 557,542 1,022,092 1,689,768 2,831,776 4,375,146 5,740,804 6,398,076
E = Morgan Stanley Dean Witter Estimates
Pricing — Effective CPM
We differentiate between the list price CPM (cost per thou-sand impressions) and the effective price CPM on the Inter-net. Most sites start with a list price CPM, which advertis-ers barter downward before reaching the effective CPM.We arrive at an estimate for effective CPMs (hereafter re-ferred to simply as the CPM) through two methods. Thefirst is based on the number of ads served, the other on 0:30spots. When discussing CPMs on the Internet, it is impor-tant to remember that Internet CPMs represent the averagepricing of all sites on the Web. Unlike broadcast television,or even weekly news magazines, that have a very limitedadvertising inventory, the Internet effective CPM covers allsites on the Web generating advertising revenue.
Pageview CPM. We arrive at an estimate for our preferredmetric, the pageview CPM, by taking the total amount ofInternet advertising revenues generated and dividing this bythe number of ad impressions (or, more accurately, by thou-sands of ad impressions) served. For this analysis, we have
assumed that an average of two ads are located on eachpage. The pageview CPM gives the amount that an adver-tiser spends to generate 1,000 views of an advertisement. In1996, we estimate that the effective CPM was $2.35. In1997, the CPM grew about 29% to $3.04. In 1998, CPMsincreased by about 6%, to $3.23. In 1999, we estimate thata lift of 21% to $3.90 occurred. In 2000, we expect CPMsto remain flat at $3.90.
0:30 spot CPM Another way of looking at CPMs — whichis more akin to the television model — is by breaking Inter-net advertisements into 0:30 commercials. When conduct-ing this analysis, the Internet CPM declines even furtherfrom its list price. In 1996, we estimate that a 0:30 spotCPM was $0.98. This means that advertisers paid just overa dollar to reach 1,000 Internet users for thirty seconds each.In 1997, the spot CPM rose an estimated 98% to $1.88. In1998, we estimate this climbed another 42% to $2.68. Weestimate the spot CPM climbed 46% to $3.91 in 1999. In2000 and 2001, we expect 10% and 16% growth, respec-tively, with pricing of $3.91 and $4.28.
Table 84
U.S. Internet CPM Forecast
(Millions, except where noted) 1996 1997 1998 1999E 2000E 2001E 2002E 2003E 2004E
Per 1,000 Ad Impressions
Effective Internet CPM $2.35 $3.04 $3.23 $3.90 $3.90 $3.93 $4.01 $4.13 $4.26 % change 29% 6% 21% 0% 1% 2% 3% 3%
Per 1,000: 30 second "spots"
Effective Internet CPM $0.98 $1.88 $2.68 $3.91 $4.28 $4.98 $5.93 $6.33 $6.52 % change 91% 42% 46% 10% 16% 19% 7% 3%
E = Morgan Stanley Dean Witter Estimates
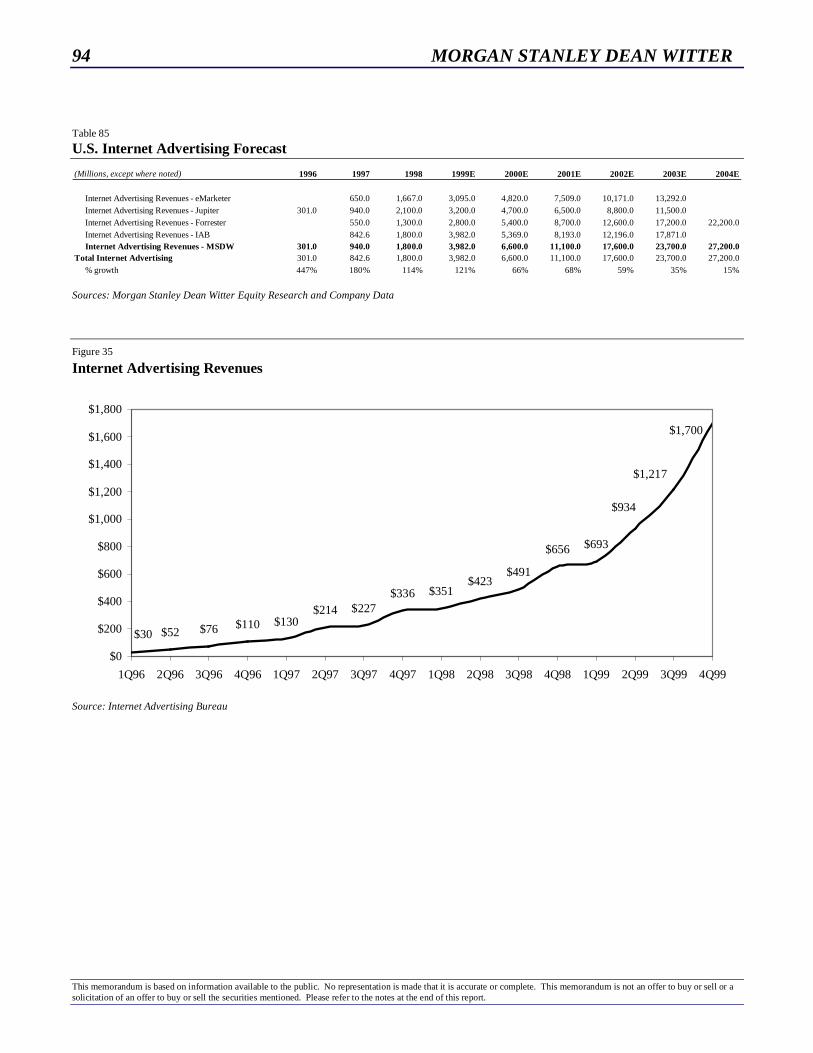
94 MORGAN STANLEY DEAN WITTER
This memorandum is based on information available to the public. No representation is made that it is accurate or complete. This memorandum is not an offer to buy or sell or asolicitation of an offer to buy or sell the securities mentioned. Please refer to the notes at the end of this report.
Table 85
U.S. Internet Advertising Forecast
(Millions, except where noted) 1996 1997 1998 1999E 2000E 2001E 2002E 2003E 2004E
Internet Advertising Revenues - eMarketer 650.0 1,667.0 3,095.0 4,820.0 7,509.0 10,171.0 13,292.0 Internet Advertising Revenues - Jupiter 301.0 940.0 2,100.0 3,200.0 4,700.0 6,500.0 8,800.0 11,500.0 Internet Advertising Revenues - Forrester 550.0 1,300.0 2,800.0 5,400.0 8,700.0 12,600.0 17,200.0 22,200.0 Internet Advertising Revenues - IAB 842.6 1,800.0 3,982.0 5,369.0 8,193.0 12,196.0 17,871.0 Internet Advertising Revenues - MSDW 301.0 940.0 1,800.0 3,982.0 6,600.0 11,100.0 17,600.0 23,700.0 27,200.0Total Internet Advertising 301.0 842.6 1,800.0 3,982.0 6,600.0 11,100.0 17,600.0 23,700.0 27,200.0 % growth 447% 180% 114% 121% 66% 68% 59% 35% 15%
Sources: Morgan Stanley Dean Witter Equity Research and Company Data
Figure 35
Internet Advertising Revenues
$52 $76 $110 $130$214 $227
$336 $351$423
$491
$656 $693
$1,700
$1,217
$934
$30
$0
$200
$400
$600
$800
$1,000
$1,200
$1,400
$1,600
$1,800
1Q96 2Q96 3Q96 4Q96 1Q97 2Q97 3Q97 4Q97 1Q98 2Q98 3Q98 4Q98 1Q99 2Q99 3Q99 4Q99
Source: Internet Advertising Bureau

MORGAN STANLEY DEAN WITTER 95
This memorandum is based on information available to the public. No representation is made that it is accurate or complete. This memorandum is not an offer to buy or sell or asolicitation of an offer to buy or sell the securities mentioned. Please refer to the notes at the end of this report.
Background: Traditional Advertising & Marketing Services
KEY POINTS:
½ The traditional advertising and marketing services market
is enormous. In the U.S., we estimate that advertising and
marketing spending reached nearly $389 billion in 1999,
and we expect $420 billion in 2000.
½ The U.S. represents about 42% of the $363 billion global
advertising budget and 76% of the $315 billion global
marketing services budget. Combining advertising &
marketing services, the U.S. represents 57% of the $678
billion market we forecast for 2000.
½ In the U.S. in 2000, we expect 8.3% growth in advertising
and 7.8% growth in marketing services, for a total of
8.0%, up 70 basis points from 1999E. Globally in 2000,
we expect advertising growth of 7.6%, up 140 basis points
from 1999.
Advertising & Marketing Services: A Big Market
The traditional advertising, direct marketing, and other mar-keting services sectors represent a large global market of$678 billion of gross media spending. Developed mediamarkets tend to demand more in marketing services —“below the line” alternatives to traditional media advertis-ing. Marketing services include non-media direct market-ing, promotions, public relations, and other specialty com-munications.
Figure 36
Global Advertising& Marketing Services (2000E $ Billions)
39%
61%
60%
40%
85%
15%
85%
15%
54%
46%
0%
20%
40%
60%
80%
100%
United States Europe Asia LatinAmerica
World
Advertising Marketing Services
$389 $146 $92 $678$33
Source: Morgan Stanley Dean Witter Research
Advertising vs. Direct Marketing: Distinct Yet Blurred
In the offline world, advertising and direct marketingoverlap, but can be differentiated from retail sales. A tele-vision commercial that shows a fancy SUV driving throughpristine wilderness is termed advertising — the consumer isexpected to associate the advertiser’s brand with the SUVand the beautiful scenery viewed on television. A televisioncommercial for a magazine subscription that is 50% off thecover price and offers a free video and an 800 phone num-ber as a call to action is termed direct marketing. The con-sumer is driven to respond by the video and phone number.
The following diagram demonstrates the overlap and size ofdirect marketing with advertising in the U.S..
Figure 37
Direct MarketingOverlap with Advertising (2000E)
Non-Media Direct Marketing (Direct Mail, Email, and Telephone): $117
Billion
Image/Brand Advertising: $94
Billion
Direct Response Advertising: $94
Billion
Source: Direct Marketing Association, McCann Erickson and MorganStanley Dean Witter Equity Research
We expect the direct marketing budget in the U.S. to be$187 billion in 2000. Direct marketing will likely represent40% of all TV advertising, 56% for magazines, 37% fornewspapers, and 40% for radio.
Direct mail and telemarketing have been considered non-media direct marketing outside of the traditional media. In2000 we expect this to represent spending of $117 billion inthe U.S.
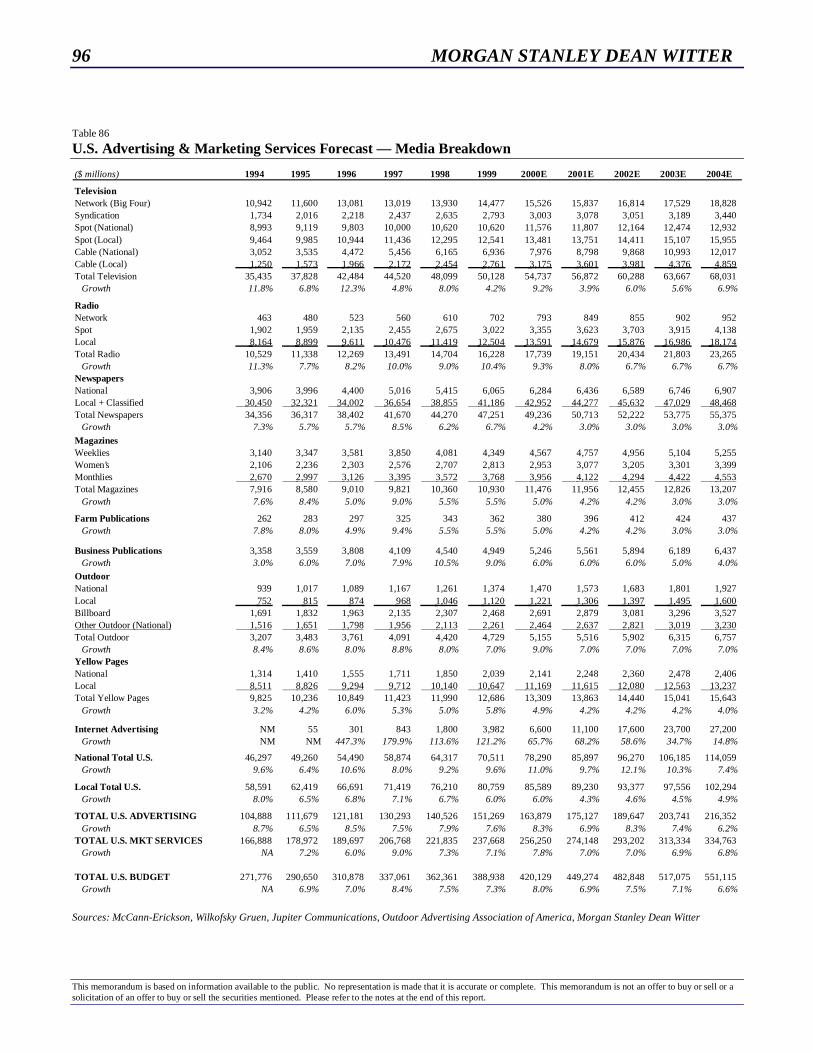
96 MORGAN STANLEY DEAN WITTER
This memorandum is based on information available to the public. No representation is made that it is accurate or complete. This memorandum is not an offer to buy or sell or asolicitation of an offer to buy or sell the securities mentioned. Please refer to the notes at the end of this report.
Table 86
U.S. Advertising & Marketing Services Forecast — Media Breakdown
($ millions) 1994 1995 1996 1997 1998 1999 2000E 2001E 2002E 2003E 2004E
TelevisionNetwork (Big Four) 10,942 11,600 13,081 13,019 13,930 14,477 15,526 15,837 16,814 17,529 18,828 Syndication 1,734 2,016 2,218 2,437 2,635 2,793 3,003 3,078 3,051 3,189 3,440 Spot (National) 8,993 9,119 9,803 10,000 10,620 10,620 11,576 11,807 12,164 12,474 12,932 Spot (Local) 9,464 9,985 10,944 11,436 12,295 12,541 13,481 13,751 14,411 15,107 15,955 Cable (National) 3,052 3,535 4,472 5,456 6,165 6,936 7,976 8,798 9,868 10,993 12,017 Cable (Local) 1,250 1,573 1,966 2,172 2,454 2,761 3,175 3,601 3,981 4,376 4,859 Total Television 35,435 37,828 42,484 44,520 48,099 50,128 54,737 56,872 60,288 63,667 68,031 Growth 11.8% 6.8% 12.3% 4.8% 8.0% 4.2% 9.2% 3.9% 6.0% 5.6% 6.9%
RadioNetwork 463 480 523 560 610 702 793 849 855 902 952 Spot 1,902 1,959 2,135 2,455 2,675 3,022 3,355 3,623 3,703 3,915 4,138 Local 8,164 8,899 9,611 10,476 11,419 12,504 13,591 14,679 15,876 16,986 18,174 Total Radio 10,529 11,338 12,269 13,491 14,704 16,228 17,739 19,151 20,434 21,803 23,265 Growth 11.3% 7.7% 8.2% 10.0% 9.0% 10.4% 9.3% 8.0% 6.7% 6.7% 6.7%NewspapersNational 3,906 3,996 4,400 5,016 5,415 6,065 6,284 6,436 6,589 6,746 6,907 Local + Classified 30,450 32,321 34,002 36,654 38,855 41,186 42,952 44,277 45,632 47,029 48,468 Total Newspapers 34,356 36,317 38,402 41,670 44,270 47,251 49,236 50,713 52,222 53,775 55,375 Growth 7.3% 5.7% 5.7% 8.5% 6.2% 6.7% 4.2% 3.0% 3.0% 3.0% 3.0%
MagazinesWeeklies 3,140 3,347 3,581 3,850 4,081 4,349 4,567 4,757 4,956 5,104 5,255 Women’s 2,106 2,236 2,303 2,576 2,707 2,813 2,953 3,077 3,205 3,301 3,399 Monthlies 2,670 2,997 3,126 3,395 3,572 3,768 3,956 4,122 4,294 4,422 4,553 Total Magazines 7,916 8,580 9,010 9,821 10,360 10,930 11,476 11,956 12,455 12,826 13,207 Growth 7.6% 8.4% 5.0% 9.0% 5.5% 5.5% 5.0% 4.2% 4.2% 3.0% 3.0%
Farm Publications 262 283 297 325 343 362 380 396 412 424 437 Growth 7.8% 8.0% 4.9% 9.4% 5.5% 5.5% 5.0% 4.2% 4.2% 3.0% 3.0%
Business Publications 3,358 3,559 3,808 4,109 4,540 4,949 5,246 5,561 5,894 6,189 6,437 Growth 3.0% 6.0% 7.0% 7.9% 10.5% 9.0% 6.0% 6.0% 6.0% 5.0% 4.0%
OutdoorNational 939 1,017 1,089 1,167 1,261 1,374 1,470 1,573 1,683 1,801 1,927 Local 752 815 874 968 1,046 1,120 1,221 1,306 1,397 1,495 1,600 Billboard 1,691 1,832 1,963 2,135 2,307 2,468 2,691 2,879 3,081 3,296 3,527 Other Outdoor (National) 1,516 1,651 1,798 1,956 2,113 2,261 2,464 2,637 2,821 3,019 3,230 Total Outdoor 3,207 3,483 3,761 4,091 4,420 4,729 5,155 5,516 5,902 6,315 6,757 Growth 8.4% 8.6% 8.0% 8.8% 8.0% 7.0% 9.0% 7.0% 7.0% 7.0% 7.0%Yellow PagesNational 1,314 1,410 1,555 1,711 1,850 2,039 2,141 2,248 2,360 2,478 2,406 Local 8,511 8,826 9,294 9,712 10,140 10,647 11,169 11,615 12,080 12,563 13,237 Total Yellow Pages 9,825 10,236 10,849 11,423 11,990 12,686 13,309 13,863 14,440 15,041 15,643 Growth 3.2% 4.2% 6.0% 5.3% 5.0% 5.8% 4.9% 4.2% 4.2% 4.2% 4.0%
Internet Advertising NM 55 301 843 1,800 3,982 6,600 11,100 17,600 23,700 27,200 Growth NM NM 447.3% 179.9% 113.6% 121.2% 65.7% 68.2% 58.6% 34.7% 14.8%
National Total U.S. 46,297 49,260 54,490 58,874 64,317 70,511 78,290 85,897 96,270 106,185 114,059 Growth 9.6% 6.4% 10.6% 8.0% 9.2% 9.6% 11.0% 9.7% 12.1% 10.3% 7.4%
Local Total U.S. 58,591 62,419 66,691 71,419 76,210 80,759 85,589 89,230 93,377 97,556 102,294 Growth 8.0% 6.5% 6.8% 7.1% 6.7% 6.0% 6.0% 4.3% 4.6% 4.5% 4.9%
TOTAL U.S. ADVERTISING 104,888 111,679 121,181 130,293 140,526 151,269 163,879 175,127 189,647 203,741 216,352 Growth 8.7% 6.5% 8.5% 7.5% 7.9% 7.6% 8.3% 6.9% 8.3% 7.4% 6.2%TOTAL U.S. MKT SERVICES 166,888 178,972 189,697 206,768 221,835 237,668 256,250 274,148 293,202 313,334 334,763 Growth NA 7.2% 6.0% 9.0% 7.3% 7.1% 7.8% 7.0% 7.0% 6.9% 6.8%
TOTAL U.S. BUDGET 271,776 290,650 310,878 337,061 362,361 388,938 420,129 449,274 482,848 517,075 551,115 Growth NA 6.9% 7.0% 8.4% 7.5% 7.3% 8.0% 6.9% 7.5% 7.1% 6.6%
Sources: McCann-Erickson, Wilkofsky Gruen, Jupiter Communications, Outdoor Advertising Association of America, Morgan Stanley Dean Witter

MORGAN STANLEY DEAN WITTER 97
This memorandum is based on information available to the public. No representation is made that it is accurate or complete. This memorandum is not an offer to buy or sell or asolicitation of an offer to buy or sell the securities mentioned. Please refer to the notes at the end of this report.
Table 87
U.S. Advertising & Marketing Services Forecast — Marketing Services Breakdown
($ millions) 1994 1995 1996 1997 1998 1999 2000E 2001E 2002E 2003E 2004EMedia advertising 104,888 111,679 121,181 130,293 140,526 151,269 163,879 175,127 189,647 203,741 216,352 % growth 8.7% 6.5% 8.5% 7.5% 7.9% 7.6% 8.3% 6.9% 8.3% 7.4% 6.2% Direct E-Mail 0 0 0 0 17 97 289 751 1,322 1,994 2,800 % growth NA NA NA NA NA NA 197.9% 159.9% 76.0% 50.8% 40.4% Direct Mail 29,638 32,866 34,509 36,888 39,655 42,233 44,555 47,451 50,536 54,023 57,480 % growth 8.7% 10.9% 5.0% 6.9% 7.5% 6.5% 5.5% 6.5% 6.5% 6.9% 6.4% Direct Telephone 46,938 50,345 54,000 58,100 62,600 66,982 72,341 77,043 82,050 87,384 93,064 % growth 7.3% 7.3% 7.3% 7.6% 7.7% 7.0% 8.0% 6.5% 6.5% 6.5% 6.5%Direct Marketing - Non-Media 76,576 83,211 88,509 94,988 102,272 109,312 117,185 125,245 133,908 143,401 153,344 % growth 7.8% 8.7% 6.4% 7.3% 7.7% 6.9% 7.2% 6.9% 6.9% 7.1% 6.9%
Point-of-purchase 11,098 12,024 12,600 13,100 13,703 14,401 15,150 15,999 16,799 17,605 18,450 % growth 8.8% 8.3% 4.8% 4.0% 4.6% 5.1% 5.2% 5.6% 5.0% 4.8% 4.8% Premiums 4,350 4,400 4,200 4,360 4,500 4,662 4,853 5,052 5,304 5,553 5,814 % growth 1.2% 1.1% -4.5% 3.8% 3.2% 3.6% 4.1% 4.1% 5.0% 4.7% 4.7% Promotional licensing 4,900 4,850 4,990 5,140 5,238 5,400 5,573 5,746 5,895 6,042 6,193 % growth 4.3% -1.0% 2.9% 3.0% 1.9% 3.1% 3.2% 3.1% 2.6% 2.5% 2.5% Product sampling 704 774 856 925 1,010 1,120 1,250 1,350 1,450 1,550 1,657 % growth 19.9% 9.9% 10.6% 8.1% 9.2% 10.9% 11.6% 8.0% 7.4% 6.9% 6.9% In-store marketing 829 990 652 748 800 860 901 931 975 1,036 1,100 % growth 12.0% 19.4% -34.1% 14.7% 7.0% 7.5% 4.7% 3.3% 4.8% 6.2% 6.2% Couponing 6,017.9 6,076.5 6,040.0 6,240.0 6,260.7 6,316.7 6,360.4 6,419.4 6,494.5 6,579.7 6,691.6 % growth 1.0% -0.6% 3.3% 0.3% 0.9% 0.7% 0.9% 1.2% 1.3% 1.7% Specialty Printing 5,336.4 5,283.0 5,600.0 5,300.0 5,287.9 5,275.9 5,263.9 5,251.9 5,239.9 5,228.0 5,216.1 % growth -1.0% 6.0% 0.0% -0.2% -0.2% -0.2% -0.2% -0.2% -0.2% -0.2% Promotional Fulfillment 2,128.9 2,109.7 2,500.0 2,860.0 3,155.8 3,450.6 3,738.4 4,012.9 4,307.5 4,623.7 4,963.2 % growth -0.9% 18.5% 14.5% 10.3% 9.3% 8.3% 7.3% 7.3% 7.3% 7.3% Consumer Promotion 35,364 36,507 37,438 38,673 39,955 41,487 43,089 44,761 46,465 48,218 50,086 % growth 0.5% 3.2% 2.5% 3.3% 3.3% 3.8% 3.9% 3.9% 3.8% 3.8% 3.9% Incentives 15,650 16,400 16,300 19,740 20,806 22,408 24,313 26,015 27,914 29,812 31,839 % growth 3.0% 4.8% -0.6% 21.1% 5.4% 7.7% 8.5% 7.0% 7.3% 6.8% 6.8% Promotional products 7,008 8,037 9,490 11,900 13,197 14,992 17,496 19,403 20,897 22,297 23,791 % growth 11.0% 14.7% 18.1% 25.4% 10.9% 13.6% 16.7% 10.9% 7.7% 6.7% 6.7% Business-to-Business Promotion 22,658 24,437 25,790 31,640 34,003 37,400 41,808 45,417 48,810 52,108 55,629 % growth 5.3% 7.9% 5.5% 22.7% 7.5% 10.0% 11.8% 8.6% 7.5% 6.8% 6.8%Promotions 58,022 60,944 63,228 70,313 73,958 78,887 84,898 90,178 95,275 100,326 105,715 % growth 2.3% 5.0% 3.7% 11.2% 5.2% 6.7% 7.6% 6.2% 5.7% 5.3% 5.4%
Event Sponsorships 4,250 4,700 5,400 5,900 6,756 7,350 8,247 9,038 10,331 11,571 12,959 % growth 14.9% 10.6% 14.9% 9.3% 14.5% 8.8% 12.2% 9.6% 14.3% 12.0% 12.0%
Trade Shows & Exhibitions 5,133 5,895 6,479 7,182 7,958 8,769 9,752 10,668 11,628 12,803 14,096 % growth 13.4% 14.8% 9.9% 10.9% 10.8% 10.2% 11.2% 9.4% 9.0% 10.1% 10.1%
Business Information - Marketing 9,407 10,021 10,881 11,785 12,692 13,695 14,941 16,091 17,298 18,492 19,768 % growth 4.5% 6.5% 8.6% 8.3% 7.7% 7.9% 9.1% 7.7% 7.5% 6.9% 6.9%
Public Relations 13,500 14,200 15,200 16,600 18,200 19,656 21,228 22,927 24,761 26,742 28,881 % growth 5.2% 7.0% 9.2% 9.6% 8.0% 8.0% 8.0% 8.0% 8.0% 8.0%
TOTAL MARKETING SERVICES 166,888 178,972 189,697 206,768 221,835 237,668 256,250 274,148 293,202 313,334 334,763 % growth NA 7.2% 6.0% 9.0% 7.3% 7.1% 7.8% 7.0% 7.0% 6.9% 6.8%
TOTAL MARKETING BUDGET 271,776 290,650 310,878 337,061 362,361 388,938 420,129 449,274 482,848 517,075 551,115 % growth NA 6.9% 7.0% 8.4% 7.5% 7.3% 8.0% 6.9% 7.5% 7.1% 6.6%
Sources: McCann-Erickson, Wilkofsky Gruen, Jupiter Communications, Outdoor Advertising Association of America, Morgan Stanley Dean Witter

98 MORGAN STANLEY DEAN WITTER
This memorandum is based on information available to the public. No representation is made that it is accurate or complete. This memorandum is not an offer to buy or sell or asolicitation of an offer to buy or sell the securities mentioned. Please refer to the notes at the end of this report.
Table 88
U.S. Traditional Direct Marketing Market
(Billions of Dollars) 1994 1995 1996 1997 1998 1999E 2000E 2001E 2002E 2003E 2004E
Non-Media Types Direct Mail 29.7 32.8 34.5 37.0 39.3 42.2 44.6 47.5 50.5 54.0 57.5Telephone Marketing 46.7 50.3 54.0 58.1 62.0 67.0 72.3 77.0 82.1 87.4 93.1
Media Types Newspaper 12.2 13.1 13.9 14.9 16.0 17.2 18.1 18.8 19.5 20.1 20.8Magazine 6.2 6.8 7.2 7.9 8.4 9.0 9.6 10.2 10.8 11.4 12.1Television 13.0 14.0 16.0 17.2 18.6 19.6 21.7 22.7 24.4 26.1 28.2Radio 3.8 4.4 4.8 5.3 5.7 6.4 7.0 7.7 8.3 8.9 9.6Other 9.7 10.5 11.3 12.0 12.7 13.4 14.2 15.1 15.9 16.9 17.8
Total Direct Marketing 121.3 131.9 141.7 152.4 162.7 174.8 187.4 198.9 211.4 224.8 239.1% Change 8.8% 8.7% 7.4% 7.6% 6.8% 7.4% 7.2% 6.1% 6.3% 6.3% 6.3% % of Mktng Budget 73% 74% 75% 74% 73% 74% 73% 73% 72% 72% 71%
Sources: Direct Marketing Association, McCann Erickson and Morgan Stanley Equity Research; E = Morgan Stanley Dean Witter Research Estimates
Table 89
Share of Direct Marketing Held by Traditional Media
(Billions of Dollars) 1994 1995 1996 1997 1998 1999E 2000E 2001E 2002E 2003E 2004E
DM as % of Total Advertising 116% 118% 117% 117% 116% 116% 114% 113% 111% 109% 109% % of Mktng Budget 73% 74% 75% 74% 73% 74% 73% 73% 72% 72% 71%% share shift NA 1.0% 1.0% -1.0% -0.4% 0.2% -0.4% -0.6% -0.5% -0.4% -0.3%
Newspaper 35.5% 36.1% 36.2% 35.8% 36.1% 36.4% 36.6% 36.8% 37.0% 37.1% 37.3%% share shift 0.2% 0.6% 0.1% -0.4% 0.4% 0.2% 0.2% 0.2% 0.2% 0.2% 0.1%Magazine 53.7% 54.7% 54.9% 55.4% 55.1% 55.4% 55.7% 56.0% 56.4% 56.7% 56.9%% share shift 0.3% 1.0% 0.2% 0.5% -0.3% 0.3% 0.3% 0.3% 0.3% 0.3% 0.2%Television 36.7% 37.0% 37.7% 38.6% 38.7% 39.1% 39.6% 40.0% 40.5% 40.9% 41.4%% share shift 0.4% 0.3% 0.7% 1.0% 0.0% 0.5% 0.4% 0.4% 0.5% 0.5% 0.5%Radio 36.1% 38.8% 39.1% 39.3% 38.8% 39.2% 39.5% 40.0% 40.5% 41.0% 41.3%% share shift 0.1% 2.7% 0.3% 0.2% -0.5% 0.4% 0.3% 0.5% 0.5% 0.5% 0.3%
Sources: Direct Marketing Association, McCann Erickson and Morgan Stanley Equity Research; E = Morgan Stanley Dean Witter Research Estimates

MORGAN STANLEY DEAN WITTER 99
This memorandum is based on information available to the public. No representation is made that it is accurate or complete. This memorandum is not an offer to buy or sell or asolicitation of an offer to buy or sell the securities mentioned. Please refer to the notes at the end of this report.
The Internet Holdings of “Traditional” Advertising Agencies
Table 90
Interpublic Group Internet Holdings
Consolidated Operations OwnershipZentropy > 80%
C-E Interactive 100%Creatid 100%
Decipher 100%Draft Data and Tech Service 100%Head New Media 100%Hypermedia Solutions 100%ISD 100%Jack Morton Interactive Media Group 100%Lowe Lintas Interactive 100%Martin Interactive 100%Western Media New Media 100%
Internet Investments Ownership21st Century Internet Fund < 10.0%Broadband Sports NACollege Enterprises NAE-Ink Corp. < 5.0%Interlane < 10.0%Replay TV NASky Alland NAStarVest Partners NA
Internet Stock Holdings Ticker OwnershipAGT AGTX < 0.5%Alliance Communications / Atlantis AAC’A < 5.0%America Online AOL < 0.1%
CMGI CMGI < 0.1%Engage ENGA < 0.1%Icon Medialab ICONF 16.5%Mediaplex MPLX < 0.2%Whittman-Hart WHIT < 1.0%Yahoo! warrant YHOO < 0.1%Source: Company Data
Table 91
Omnicom Internet Holdings
Consolidated Operations Ownership@tmosphere 100%CareerMosaic 100%DDB Digital 100%Ross Roy Communications 100%
Unconsolidated Investments Ticker OwnershipAgency.com ACOM 53%AnswerThink ANSR 2%Atmosphere Interactive 100%Brand Wired 100%Career Mosaic 100%Critical Mass 50%Dash.com 28%DDB Digital 100%G-CME 100%L-90 LNTY 2%Live Tech 20%Nuforia 20%Organic Online OGNC 93%PostPromoCity 100%Rapp Digital 100%Razorfish RAZF 18%Recruit Soft 20%Red Sky Interactive 40%Replay TV < 1%World Media Leaders 30%Source: Company Data

100 MORGAN STANLEY DEAN WITTER
This memorandum is based on information available to the public. No representation is made that it is accurate or complete. This memorandum is not an offer to buy or sell or asolicitation of an offer to buy or sell the securities mentioned. Please refer to the notes at the end of this report.
Table 92
True North Internet Holdings
Consolidated Operations Ticker OwnershipModemMedia MMPT 46%60-Foot Spider 100R/GA Interactive 100%
Unconsolidated Investments Ticker OwnershipDoubleClick DCLK < 1%International PR 5%Source: Company Data
Table 93
WPP Internet Holdings
Consolidated Operations OwnershipCole and Weber 100%JWT Digital 100%Ogilvy Interactive 100%
Unconsolidated Investments Ticker OwnershipAsatsu - Japan 20.0%Chime Communications - UK 29.9%
High Co. - Europe 29.9%Newsedge - US NEWZ 0.1%Singleton - Europe 11.0%Tempus - UK 18.1%
Internet Stock Holdings Ticker OwnershipConcept 15-20%E-Rewards 15-20%Intraspect 5-10%Lycos LCOS < 1%Media / Netforce 35-40%MTEP Funds 5-10%MTV 5-10%MTV III 5-10%Newsedge NEWZ 5-10%Syzygy / United 35-40%TWI Interactive 15-20%Visible World 5-10%Source: Company Data
Table 94
Young & Rubicam Internet Holdings
Unconsolidated Investments Ticker OwnershipCyber Dialogue 12.5%Digital Convergence 6.5%Emotion 14.8%Harris Interactive 5.0%
iWeb 19.0%Luminant LUMT 22.0%Mediaplex MPLX 1.0%Naviant 5.5%Streampipe 28.0%Team Holdings 25.0%Source: Company Data

MORGAN STANLEY DEAN WITTER 101
This memorandum is based on information available to the public. No representation is made that it is accurate or complete. This memorandum is not an offer to buy or sell or asolicitation of an offer to buy or sell the securities mentioned. Please refer to the notes at the end of this report.
Appendix 1: Slide Presentation
MORGAN STANLEY DEAN WITTER
MORGAN STANLEY DEAN WITTER
���������������������� ������������ ��������
0LFKDHO�-��5XVVHOO���������������PLFKDHO�UXVVHOO#PVGZ�FRP
5REHUW�-��.HLWK���������������UREHUW�NHLWK#PVGZ�FRP
[email protected] 212-761-635222MORGAN STANLEY DEAN WITTER
:HE·V�VOLFH�RI�8�6��DG�VXSSO\�LVVPDOO�EXW�JURZLQJ
1999E 2005E
Other Media Advertising
97%
Internet3%
$4.0 of $151 Billion
Internet13%
Other Media Advertising
87%
$32 of $233 Billion

102 MORGAN STANLEY DEAN WITTER
This memorandum is based on information available to the public. No representation is made that it is accurate or complete. This memorandum is not an offer to buy or sell or asolicitation of an offer to buy or sell the securities mentioned. Please refer to the notes at the end of this report.
[email protected] 212-761-635223MORGAN STANLEY DEAN WITTER
06':�:HE�$G��(�PDLO�)RUHFDVW
($ Billions) 1999 2000E 2001E 2005E 2010E
E-Advertising $4.0 $6.6 $11.1 $31 $47
Direct E-Mail $0.1 $0.3 $0.8 $4 $11
E = Morgan Stanley Dean Witter Estimates
[email protected] 212-761-635224MORGAN STANLEY DEAN WITTER
������������������������
● 1RQ���$2/�DQG<DKRR��VLWHVFRQWLQXH�WR�JDLQDGYHUWLVLQJVKDUH�IURP�$2/DQG�<DKRR�
30%
35%
40%
45%
50%
55%
60%
65%
70%
4Q96 1Q97 2Q97 3Q97 4Q97 1Q98 2Q98 3Q98 4Q98 1Q99 2Q99 3Q99

MORGAN STANLEY DEAN WITTER 103
This memorandum is based on information available to the public. No representation is made that it is accurate or complete. This memorandum is not an offer to buy or sell or asolicitation of an offer to buy or sell the securities mentioned. Please refer to the notes at the end of this report.
MORGAN STANLEY DEAN WITTER
����� �
/LVW�SULFH�,QWHUQHW�&30PD\�GHFOLQH���
���EXW�ZH�H[SHFW�WKHHIIHFWLYH�&30 �WR�ULVH�
7KH�HIIHFWLYH�&30�DVVXPHV�DOO�DGYHUWLVLQJ�LV�VROG
[email protected] 212-761-635226MORGAN STANLEY DEAN WITTER
&30��/LVW�3ULFH�YV��(IIHFWLYH�3ULFH
● /LVW�3ULFH�&30��������������VHOORXW�
● (IIHFWLYH�,QWHUQHW�&30�����������VHOORXW�
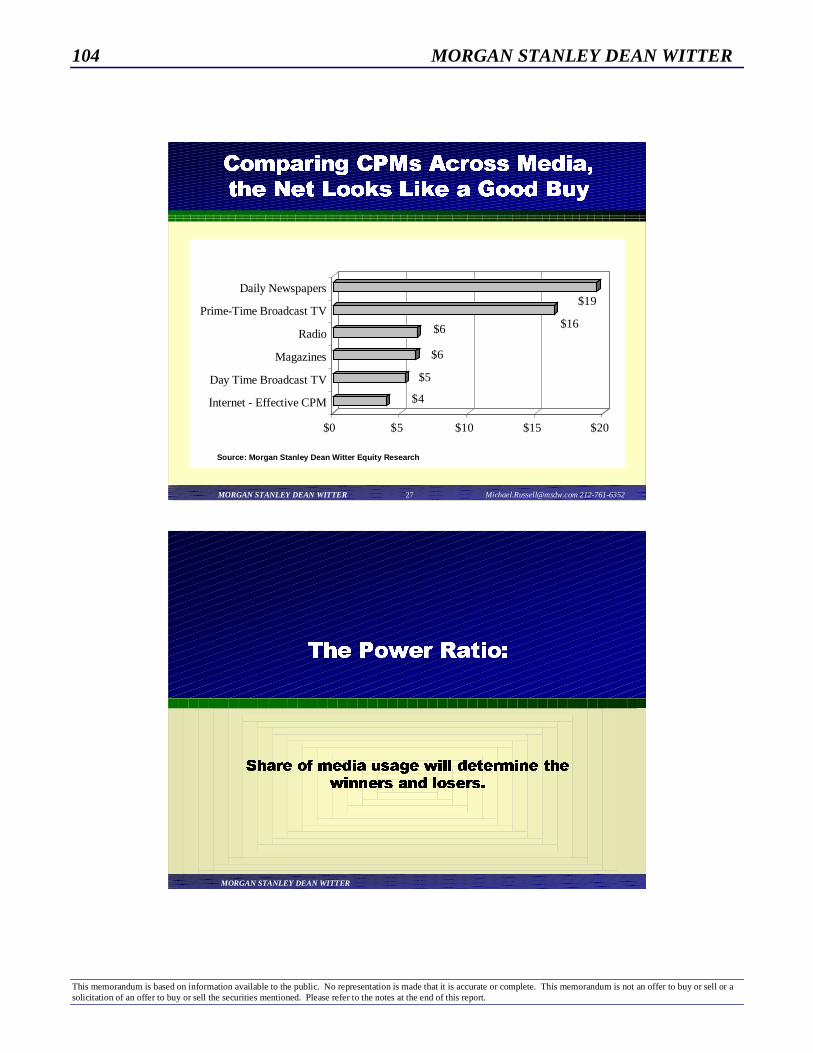
104 MORGAN STANLEY DEAN WITTER
This memorandum is based on information available to the public. No representation is made that it is accurate or complete. This memorandum is not an offer to buy or sell or asolicitation of an offer to buy or sell the securities mentioned. Please refer to the notes at the end of this report.
[email protected] 212-761-635227MORGAN STANLEY DEAN WITTER
$4
$5
$6
$6 $16
$19
$0 $5 $10 $15 $20
Internet - Effective CPM
Day Time Broadcast TV
Magazines
Radio
Prime-Time Broadcast TV
Daily Newspapers
&RPSDULQJ�&30V�$FURVV�0HGLD�WKH�1HW�/RRNV�/LNH�D�*RRG�%X\
Source: Morgan Stanley Dean Witter Equity Research
MORGAN STANLEY DEAN WITTER
7KH�3RZHU�5DWLR�
6KDUH�RI�PHGLD�XVDJH�ZLOO�GHWHUPLQH�WKHZLQQHUV�DQG�ORVHUV�
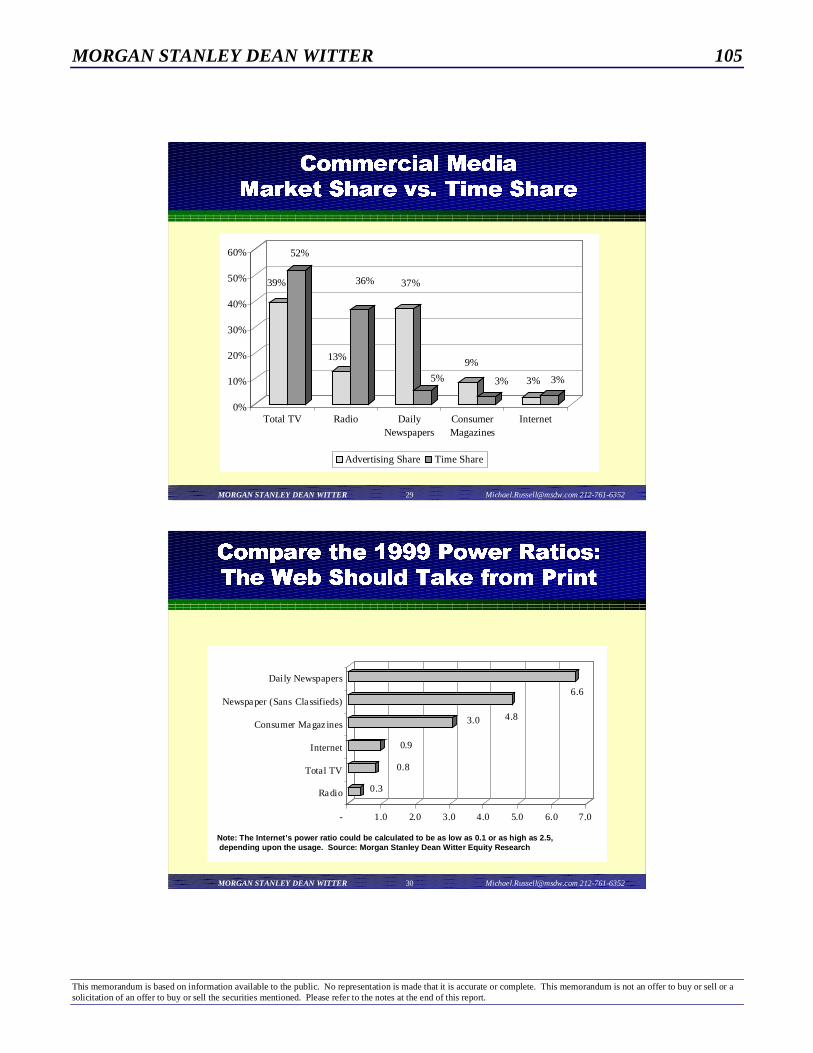
MORGAN STANLEY DEAN WITTER 105
This memorandum is based on information available to the public. No representation is made that it is accurate or complete. This memorandum is not an offer to buy or sell or asolicitation of an offer to buy or sell the securities mentioned. Please refer to the notes at the end of this report.
[email protected] 212-761-635229MORGAN STANLEY DEAN WITTER
39%
52%
13%
36% 37%
5%
9%
3% 3% 3%
0%
10%
20%
30%
40%
50%
60%
Total TV Radio DailyNewspapers
ConsumerMagazines
Internet
Advertising Share Time Share
&RPPHUFLDO�0HGLD0DUNHW�6KDUH�YV��7LPH�6KDUH
[email protected] 212-761-635230MORGAN STANLEY DEAN WITTER
0.3
0.8
0.9
3.0 4.8
6.6
- 1.0 2.0 3.0 4.0 5.0 6.0 7.0
Radio
Total TV
Internet
Consumer Magaz ines
Newspaper (Sans Classifieds)
Daily Newspapers
&RPSDUH�WKH������3RZHU�5DWLRV�7KH�:HE�6KRXOG�7DNH�IURP�3ULQW
Note: The Internet’s power ratio could be calculated to be as low as 0.1 or as high as 2.5, depending upon the usage. Source: Morgan Stanley Dean Witter Equity Research
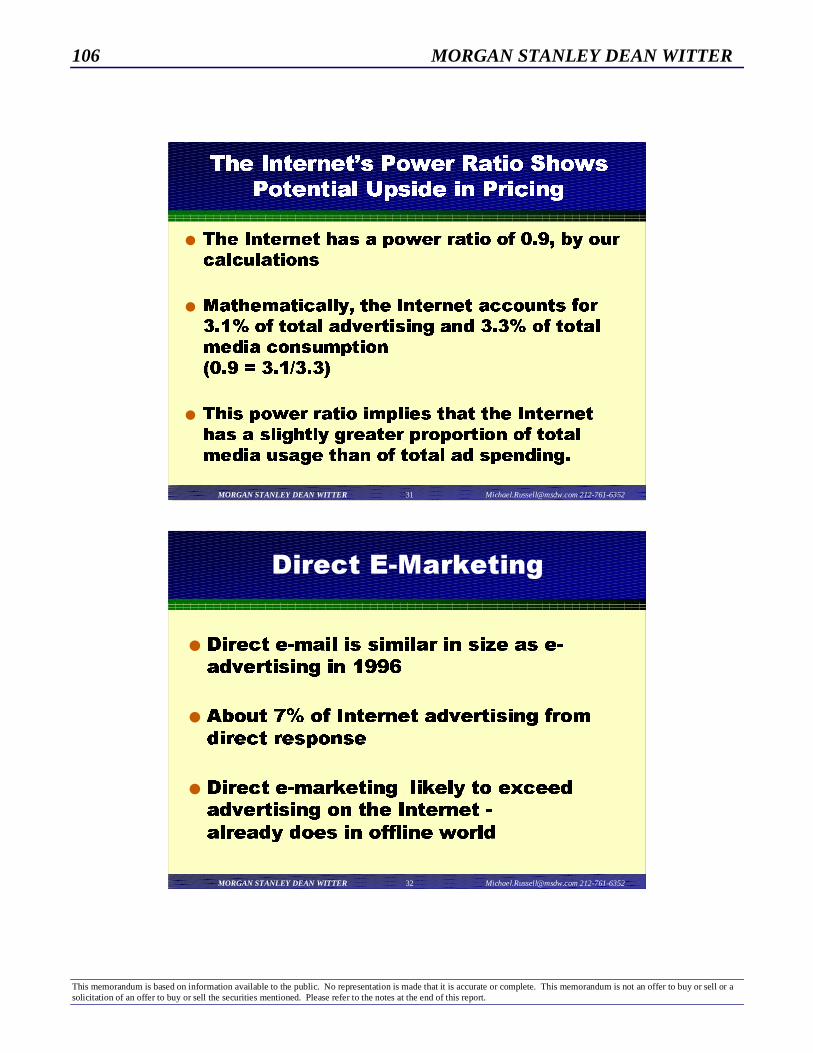
106 MORGAN STANLEY DEAN WITTER
This memorandum is based on information available to the public. No representation is made that it is accurate or complete. This memorandum is not an offer to buy or sell or asolicitation of an offer to buy or sell the securities mentioned. Please refer to the notes at the end of this report.
[email protected] 212-761-635231MORGAN STANLEY DEAN WITTER
7KH�,QWHUQHW·V�3RZHU�5DWLR�6KRZV3RWHQWLDO�8SVLGH�LQ�3ULFLQJ
● 7KH�,QWHUQHW�KDV�D�SRZHU�UDWLR�RI������E\�RXUFDOFXODWLRQV
● 0DWKHPDWLFDOO\��WKH�,QWHUQHW�DFFRXQWV�IRU�����RI�WRWDO�DGYHUWLVLQJ�DQG������RI�WRWDOPHGLD�FRQVXPSWLRQ����� ���������
● 7KLV�SRZHU�UDWLR�LPSOLHV�WKDW�WKH�,QWHUQHWKDV�D�VOLJKWO\�JUHDWHU�SURSRUWLRQ�RI�WRWDOPHGLD�XVDJH�WKDQ�RI�WRWDO�DG�VSHQGLQJ�
[email protected] 212-761-635232MORGAN STANLEY DEAN WITTER
���������������
● 'LUHFW�H�PDLO�LV�VLPLODU�LQ�VL]H�DV�H�DGYHUWLVLQJ�LQ�����
● $ERXW����RI�,QWHUQHW�DGYHUWLVLQJ�IURPGLUHFW�UHVSRQVH
● 'LUHFW�H�PDUNHWLQJ��OLNHO\�WR�H[FHHGDGYHUWLVLQJ�RQ�WKH�,QWHUQHW��DOUHDG\�GRHV�LQ�RIIOLQH�ZRUOG

MORGAN STANLEY DEAN WITTER 107
This memorandum is based on information available to the public. No representation is made that it is accurate or complete. This memorandum is not an offer to buy or sell or asolicitation of an offer to buy or sell the securities mentioned. Please refer to the notes at the end of this report.
[email protected] 212-761-635233MORGAN STANLEY DEAN WITTER
,Q�WKH�86��GLUHFW�(�PDLO�LV�ZKHUHH�DGYHUWLVLQJ�ZDV���\HDUV�DJR
U.S. (millions) ‘96 ‘97 ‘98 ‘99 ‘00E
Internet Advertising 301 843 1,800 3,982 6,600
Direct e-mail 17 97 289
MORGAN STANLEY DEAN WITTER
���������������������� ������������ ��������
,QGXVWU\�&RQFHUQV
108 MORGAN STANLEY DEAN WITTER
This memorandum is based on information available to the public. No representation is made that it is accurate or complete. This memorandum is not an offer to buy or sell or asolicitation of an offer to buy or sell the securities mentioned. Please refer to the notes at the end of this report.
[email protected] 212-761-635236MORGAN STANLEY DEAN WITTER
����������������
● 'HFOLQLQJ�FOLFN�WKURXJKV�FDXVH�PRUHLPDJLQHG�WKDQ�DFWXDO�FRQFHUQ
� 2WKHU�PHWULFV�OLNH�&30�&32�&3$�DUHPRUH�LPSRUWDQW
● $G�EORFNLQJ�VRIWZDUH�DQG�FRRNLH�FXWWHUVZRXOG�EH�ZRUULVRPH�GHYHORSPHQWV«�LI�DQ\RQH�XVHG�WKHP
● 3ULYDF\�FRQFHUQV�DUH�UHDO�DQG�JOREDO
MORGAN STANLEY DEAN WITTER
«DQG�DYRLGLQJ�WKH�/RVHUV
����� �� ��!������"""

MORGAN STANLEY DEAN WITTER 109
This memorandum is based on information available to the public. No representation is made that it is accurate or complete. This memorandum is not an offer to buy or sell or asolicitation of an offer to buy or sell the securities mentioned. Please refer to the notes at the end of this report.
[email protected] 212-761-635238MORGAN STANLEY DEAN WITTER
,QWHJUDWHG��*OREDO�DQG�6HQVLWLYH�*RRG�3ROLF\�IRU�0RUH�6KDUH
● ,QWHJUDWHG�GLUHFW�PDUNHWLQJ��DGYHUWLVLQJ�VHUYLFHV
● *OREDO�DFFHVV�WR�PDVV�WDUJHWLQJ�YHKLFOHV
● 6HQVLWLYLW\�WR�SULYDF\�FRQFHUQV�RI�QHW�L]HQV��JRY·W
0RUH�PDUNHW�VKDUH�*URVV�PDUJLQ�SRZHU�IURP�QHWZRUN�HIIHFW
RQ�SULFLQJ�DQG�FRVW�FRQWURO
*RRG�FRPSDQLHV�RIIHU�
[email protected] 212-761-635239MORGAN STANLEY DEAN WITTER
7KH�.H\�$VVHW��7KH�/DUJHVW�)DVWHVW�*URZLQJ�.QRZOHGJHEDVH
● 'DWDEDVH�$Q�HDUO\�OHDG�LQ�VL]H��TXDOLW\�ZLOO�ZLGHQ�RYHU�WLPH
● 6DOHVIRUFH�4XDOLW\�DQG�TXDQWLW\�DUH�NH\
● &OLHQWV�$VVRFLDWLQJ�ZLWK�ZLQQLQJ�FOLHQWV�LV�FULWLFDODQG�JRRG�IRU�ORQJ�WHUP�EXVLQHVV
7KH�NH\�DVVHW�DW�JRRG�FRPSDQLHV�LV�D�OHYHUDJHDEOHDVVHW�ZH�FDOO�WKH�´NQRZOHGJHEDVHµ

110 MORGAN STANLEY DEAN WITTER
This memorandum is based on information available to the public. No representation is made that it is accurate or complete. This memorandum is not an offer to buy or sell or asolicitation of an offer to buy or sell the securities mentioned. Please refer to the notes at the end of this report.
[email protected] 212-761-635240MORGAN STANLEY DEAN WITTER
52,�2EVHVVLRQ�'ULYHV.QRZOHGJHEDVH��6HOI�)XOILOOV
Larger Clients
More Campaigns& More Iterations
Larger Budgets
[email protected] 212-761-635241MORGAN STANLEY DEAN WITTER
���#��������$�����#�
Buy Side Sell Side
DirectMarketing
Data
Advertising
Technology

MORGAN STANLEY DEAN WITTER 111
This memorandum is based on information available to the public. No representation is made that it is accurate or complete. This memorandum is not an offer to buy or sell or asolicitation of an offer to buy or sell the securities mentioned. Please refer to the notes at the end of this report.
Appendix 2: Internet Advertising Data
Table 95
Top Internet Advertisers for Home Users — March 2000
Rank Advertiser Impressions ClickRate Rank Unique Audience Reach % Rank1 TRUSTe 2,816,220,070 << << 33,087,541 40.53 42 Am azon 726,630,619 0.16 1017 41,903,808 51.33 13 Yahoo! 660,936,339 0.14 1057 29,145,697 35.7 54 Am erica Online 562,334,740 0.18 971 37,987,552 46.53 25 M icrosoft 430,567,109 0.19 957 35,885,794 43.96 36 Next Card 363,417,681 0.06 1290 26,157,993 32.04 77 SexTracker 354,674,266 0.22 908 8,607,707 10.54 718 Barnes and Noble 288,387,680 0.35 735 26,383,410 32.32 69 ClassMates 272,244,099 0.05 1309 13,329,514 16.33 3210 Netscape 265,989,537 0.12 1108 25,401,081 31.11 811 Ad Council 253,481,523 0.04 1354 14,080,732 17.25 2912 Datek 240,092,287 0.06 1271 7,592,074 9.3 8813 GetSm art 240,070,196 0.03 1379 19,406,380 23.77 1314 eBay 217,411,837 0.1 1160 20,580,265 25.21 1215 W ebSideStory 216,001,228 0.36 717 15,730,076 19.27 2316 Network Solutions 214,467,244 0.03 1387 24,835,582 30.42 917 AllAdvantage 208,512,367 << << 9,612,651 11.77 5518 E*TRADE 200,147,795 0.14 1052 16,610,090 20.35 1919 AT and T 192,743,122 << << 22,664,205 27.76 1120 Fidelity 178,353,210 << << 7,717,041 9.45 8321 M organ Stanley Dean Wit 177,413,406 0.01 1421 3,384,940 4.15 26322 Am eritrade 172,724,630 0.08 1201 16,484,618 20.19 2023 Casino On Net 170,508,330 0.13 1070 16,743,184 20.51 1824 National Discoun t Brokers 163,252,983 << << 3,947,841 4.84 21625 uBid 146,022,497 0.11 1112 24,628,052 30.17 1026 Homestore 143,995,308 0.05 1327 3,222,178 3.95 27727 Snap 142,075,092 0.2 946 9,268,501 11.35 5928 ShopNow 130,895,186 0.03 1376 12,613,981 15.45 3529 SexSwap 126,327,423 0.02 1404 3,876,710 4.75 22030 CDNOW 123,536,811 0.11 1132 16,993,225 20.82 1731 Better Business Bureau 122,704,997 0.01 1426 15,271,507 18.71 2532 FreeShop 117,659,181 0.19 952 15,595,980 19.1 2433 AltaVista 114,819,974 0.23 893 15,793,484 19.35 2134 Lycos 114,097,356 0.05 1330 12,097,316 14.82 4235 Excite 112,851,065 0.07 1257 10,218,235 12.52 5236 Enews 111,808,003 0.01 1420 13,583,805 16.64 3137 APB Online 105,893,128 0.17 984 10,971,465 13.44 4438 FreeLotto 102,112,453 0.2 942 9,161,912 11.22 6239 W ebMD 100,877,896 0.14 1054 17,035,570 20.87 1640 The Sports Authority 100,456,987 << << 15,064,924 18.45 2641 ZDNet 98,246,028 0.24 869 9,047,644 11.08 6442 M asters Institute 97,632,688 0.07 1238 9,616,155 11.78 5443 Uproar 96,478,391 0.51 590 17,371,590 21.28 1444 M ail.com 95,163,166 << << 5,681,758 6.96 13045 RJB Telcom 95,141,138 0.75 469 6,482,153 7.94 11146 OnHealth 94,077,278 0.22 909 17,072,341 20.91 1547 DealTime 93,302,171 0.04 1338 9,455,587 11.58 5648 Essentials 90,710,065 0.01 1424 2,997,614 3.67 30049 In terClick 90,652,695 0.34 738 4,901,677 6 16350 SmartAge 88,546,051 0.01 1417 5,584,420 6.84 133
Source: Nielsen//NetRatings

112 MORGAN STANLEY DEAN WITTER
This memorandum is based on information available to the public. No representation is made that it is accurate or complete. This memorandum is not an offer to buy or sell or asolicitation of an offer to buy or sell the securities mentioned. Please refer to the notes at the end of this report.
Table 96
Top Internet Advertisers for Work Users — March 2000
Rank Advertiser Impressions ClickRate Ranks Unique Audience Reach % Rank1 TRUSTe 2,641,057,251 << << 18,764,200 59.93 32 Yahoo! 536,861,260 0.15 398 15,404,781 49.2 53 Amazon 501,474,456 0.14 409 21,063,551 67.27 14 Datek 368,944,804 0.03 550 6,876,255 21.96 475 Microsoft 355,456,746 0.15 394 20,321,356 64.9 26 ClassMates 285,457,045 0.03 546 8,445,614 26.97 327 America Online 264,497,901 0.13 415 17,411,369 55.61 48 Next Card 261,849,475 0.06 506 14,775,200 47.19 79 Fidelity 243,930,377 << << 6,700,125 21.4 4910 GetSmart 233,524,047 0.01 594 12,863,344 41.08 911 AllAdvantage 231,615,904 0.06 491 6,124,683 19.56 5512 E*TRADE 224,870,100 0.11 429 11,733,369 37.47 1413 Morgan Stanley Dean Wit 219,915,617 0.01 583 2,880,135 9.2 17614 Netscape 216,002,649 0.17 382 15,366,376 49.08 615 Barnes and Noble 207,146,450 0.11 437 11,969,864 38.23 1316 Ad Council 200,362,305 << << 8,842,632 28.24 3017 Ameritrade 181,446,841 0.09 451 12,614,300 40.29 1018 Network Solutions 158,933,260 0.03 549 14,623,546 46.7 819 National Discount Brokers 136,577,756 << << 3,842,711 12.27 12020 AT and T 125,828,325 << << 12,259,818 39.16 1221 Mail.com 121,687,455 0.01 587 4,664,266 14.9 8622 DealTime 118,135,826 << << 5,223,234 16.68 7223 eBay 117,867,532 0.07 488 10,313,681 32.94 1824 Intuit 109,238,886 0.41 246 9,321,643 29.77 2425 APB Online 107,686,931 0.21 352 7,060,575 22.55 4326 Better Business Bureau 102,704,453 0.03 557 10,706,531 34.19 1627 uBid 102,560,664 0.04 538 12,347,341 39.43 1128 FreeShop 100,202,494 0.13 422 10,265,999 32.79 1929 TD Waterhouse 100,153,335 0.09 464 4,110,950 13.13 10630 AltaVista 99,723,931 0.23 338 9,068,930 28.96 2931 Weather Channel 97,503,912 0.1 446 5,197,974 16.6 7332 WebSideStory 96,101,633 0.45 233 7,758,291 24.78 3833 SexTracker 94,812,848 0.24 328 2,916,104 9.31 17134 FreeLotto 93,886,663 0.09 471 6,696,071 21.39 5035 ESPN 88,142,765 0.04 527 3,192,716 10.2 14636 The Sports Authority 87,651,405 << << 9,316,728 29.76 2537 OnHealth 85,181,050 0.08 480 11,263,344 35.97 1538 Casino On Net 84,472,151 0.2 356 10,045,840 32.08 2139 ShopNow 83,387,197 0.13 423 7,127,178 22.76 4140 Essentials 83,169,464 << << 1,970,972 6.29 26641 Homestore 81,007,658 0.02 565 2,080,446 6.64 25142 WebMD 79,105,555 0.27 307 10,220,451 32.64 2043 SmartAge 79,088,036 0.06 504 3,586,785 11.46 13044 Snap 78,543,302 0.09 463 5,236,264 16.72 7145 Excite 77,658,222 0.01 580 6,136,150 19.6 5446 CDNOW 77,179,837 0.17 386 9,261,038 29.58 2747 Enews 76,632,525 0.09 459 7,652,444 24.44 3948 Doubleday 75,240,566 0.09 457 4,289,025 13.7 9649 ZDNet 73,389,483 0.18 377 6,450,686 20.6 5150 Travelscape 73,150,685 0.06 505 8,235,391 26.3 34
Source: Nielsen//NetRatings

MORGAN STANLEY DEAN WITTER 113
This memorandum is based on information available to the public. No representation is made that it is accurate or complete. This memorandum is not an offer to buy or sell or asolicitation of an offer to buy or sell the securities mentioned. Please refer to the notes at the end of this report.
Table 97
Top Internet Advertising Locations for Home Users — March 2000
Rank Domain Impressions ClickRate Unique Audience Reach % Rank # of Banners1 yahoo.com 3,378,205,869 0.1 36,919,471 45.22 1 2,428 2 ebay.com 2,590,645,976 << 9,255,425 11.34 9 206 3 aol.com 1,355,330,627 0.31 28,840,963 35.33 2 1,839 4 go.com 480,113,127 0.18 14,907,580 18.26 4 1,079 5 realtor.com 413,043,078 0.06 1,844,332 2.26 63 483 6 excite.com 408,097,987 0.11 9,777,566 11.98 7 1,132 7 netscape.com 361,992,216 0.2 13,708,181 16.79 5 993 8 snap.com 356,548,965 0.15 6,879,498 8.43 12 572 9 ragingbull.com 341,041,566 0.02 717,238 0.88 210 150 10 freei.net 305,624,346 << 1,130,905 1.39 121 763 11 iwon.com 302,569,359 0.8 3,914,106 4.79 27 797 12 msn.com 291,707,261 0.24 16,331,522 20 3 1,390 13 gamesville.com 235,942,993 << 1,309,675 1.6 104 315 14 compuserve.com 229,032,039 0.27 2,135,657 2.62 55 501 15 lycos.com 212,597,986 0.07 10,478,477 12.84 6 785 16 cnet.com 210,163,379 0.17 6,337,397 7.76 15 300 17 infospace.com 195,425,624 0.17 6,198,067 7.59 16 487 18 picpost.com 193,937,420 0.07 876,018 1.07 173 99 19 altavista.com 185,050,729 0.14 9,276,466 11.36 8 403 20 webmillion.com 136,006,879 0.37 674,017 0.83 223 7 21 looksmart.com 135,323,708 0.09 5,640,869 6.91 19 371 22 quicken.com 128,098,647 0.03 1,429,194 1.75 94 209 23 thehun.net 120,075,158 0.07 413,367 0.51 374 66 24 mapquest.com 112,404,734 0.1 5,356,027 6.56 20 422 25 porncity.net 108,626,776 0.09 2,689,614 3.29 39 400 26 marketwatch.com 102,916,933 0.06 3,158,448 3.87 32 361 27 usatoday.com 100,530,950 0.05 1,857,388 2.28 62 199 28 cnn.com 100,430,520 0.03 2,711,315 3.32 38 202 29 uproar.com 94,254,033 0.13 1,344,522 1.65 101 67 30 goto.com 91,268,111 0.13 4,050,734 4.96 25 276 31 zdnet.com 91,190,883 0.19 3,814,576 4.67 28 353 32 weather.com 88,235,876 0.12 5,106,692 6.26 22 206 33 ubid.com 85,488,813 0.03 974,737 1.19 151 170 34 freerealtime.com 85,036,847 << 171,716 0.21 921 25 35 gamespot.com 83,229,104 0.05 1,229,625 1.51 113 160 36 monster.com 82,733,046 0.3 2,368,394 2.9 48 245 37 americangreetings.com 82,210,605 0.14 6,196,777 7.59 17 315 38 juno.com 79,626,523 0.08 1,732,106 2.12 69 145 39 siliconinvestor.com 79,513,247 << 181,111 0.22 873 138 40 highschoolalumni.com 76,629,406 << 1,014,747 1.24 141 34 41 ign.com 75,865,614 0.12 3,018,699 3.7 34 198 42 al4a.com 75,057,460 0.09 384,192 0.47 402 11 43 travelocity.com 72,870,207 0.34 2,592,816 3.18 41 424 44 cnnsi.com 69,744,685 0.5 1,993,236 2.44 59 160 45 att.net 69,227,016 0.02 1,717,128 2.1 70 500 46 bluemountain.com 68,716,161 0.81 7,601,359 9.31 10 83 47 digitalcity.com 66,916,912 0.03 3,642,590 4.46 29 281 48 prodigy.net 65,478,533 0.08 1,452,906 1.78 90 147 49 valueclick.com 65,054,811 0.15 6,614,075 8.1 14 512 50 dogpile.com 60,649,420 0.09 2,551,905 3.13 42 415
Source: Nielsen//NetRatings
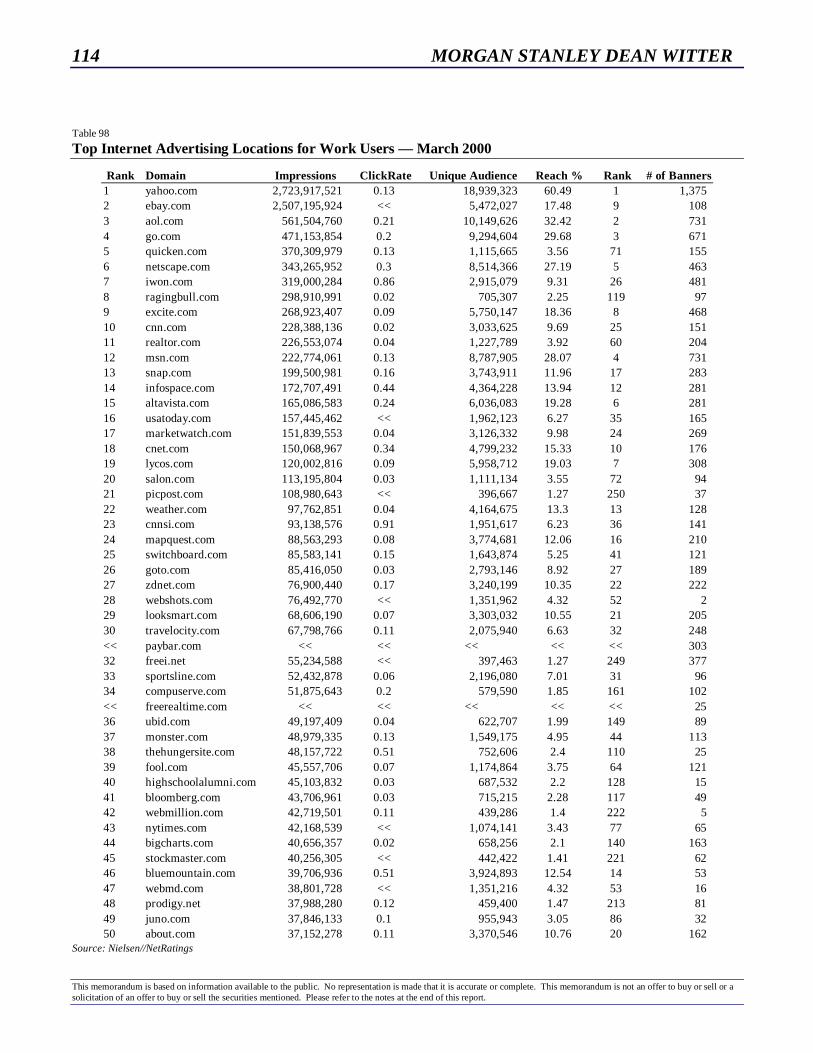
114 MORGAN STANLEY DEAN WITTER
This memorandum is based on information available to the public. No representation is made that it is accurate or complete. This memorandum is not an offer to buy or sell or asolicitation of an offer to buy or sell the securities mentioned. Please refer to the notes at the end of this report.
Table 98
Top Internet Advertising Locations for Work Users — March 2000
Rank Domain Impressions ClickRate Unique Audience Reach % Rank # of Banners1 yahoo.com 2,723,917,521 0.13 18,939,323 60.49 1 1,375 2 ebay.com 2,507,195,924 << 5,472,027 17.48 9 108 3 aol.com 561,504,760 0.21 10,149,626 32.42 2 731 4 go.com 471,153,854 0.2 9,294,604 29.68 3 671 5 quicken.com 370,309,979 0.13 1,115,665 3.56 71 155 6 netscape.com 343,265,952 0.3 8,514,366 27.19 5 463 7 iwon.com 319,000,284 0.86 2,915,079 9.31 26 481 8 ragingbull.com 298,910,991 0.02 705,307 2.25 119 97 9 excite.com 268,923,407 0.09 5,750,147 18.36 8 468 10 cnn.com 228,388,136 0.02 3,033,625 9.69 25 151 11 realtor.com 226,553,074 0.04 1,227,789 3.92 60 204 12 msn.com 222,774,061 0.13 8,787,905 28.07 4 731 13 snap.com 199,500,981 0.16 3,743,911 11.96 17 283 14 infospace.com 172,707,491 0.44 4,364,228 13.94 12 281 15 altavista.com 165,086,583 0.24 6,036,083 19.28 6 281 16 usatoday.com 157,445,462 << 1,962,123 6.27 35 165 17 marketwatch.com 151,839,553 0.04 3,126,332 9.98 24 269 18 cnet.com 150,068,967 0.34 4,799,232 15.33 10 176 19 lycos.com 120,002,816 0.09 5,958,712 19.03 7 308 20 salon.com 113,195,804 0.03 1,111,134 3.55 72 94 21 picpost.com 108,980,643 << 396,667 1.27 250 37 22 weather.com 97,762,851 0.04 4,164,675 13.3 13 128 23 cnnsi.com 93,138,576 0.91 1,951,617 6.23 36 141 24 mapquest.com 88,563,293 0.08 3,774,681 12.06 16 210 25 switchboard.com 85,583,141 0.15 1,643,874 5.25 41 121 26 goto.com 85,416,050 0.03 2,793,146 8.92 27 189 27 zdnet.com 76,900,440 0.17 3,240,199 10.35 22 222 28 webshots.com 76,492,770 << 1,351,962 4.32 52 2 29 looksmart.com 68,606,190 0.07 3,303,032 10.55 21 205 30 travelocity.com 67,798,766 0.11 2,075,940 6.63 32 248 << paybar.com << << << << << 303 32 freei.net 55,234,588 << 397,463 1.27 249 377 33 sportsline.com 52,432,878 0.06 2,196,080 7.01 31 96 34 compuserve.com 51,875,643 0.2 579,590 1.85 161 102 << freerealtime.com << << << << << 25 36 ubid.com 49,197,409 0.04 622,707 1.99 149 89 37 monster.com 48,979,335 0.13 1,549,175 4.95 44 113 38 thehungersite.com 48,157,722 0.51 752,606 2.4 110 25 39 fool.com 45,557,706 0.07 1,174,864 3.75 64 121 40 highschoolalumni.com 45,103,832 0.03 687,532 2.2 128 15 41 bloomberg.com 43,706,961 0.03 715,215 2.28 117 49 42 webmillion.com 42,719,501 0.11 439,286 1.4 222 5 43 nytimes.com 42,168,539 << 1,074,141 3.43 77 65 44 bigcharts.com 40,656,357 0.02 658,256 2.1 140 163 45 stockmaster.com 40,256,305 << 442,422 1.41 221 62 46 bluemountain.com 39,706,936 0.51 3,924,893 12.54 14 53 47 webmd.com 38,801,728 << 1,351,216 4.32 53 16 48 prodigy.net 37,988,280 0.12 459,400 1.47 213 81 49 juno.com 37,846,133 0.1 955,943 3.05 86 32 50 about.com 37,152,278 0.11 3,370,546 10.76 20 162
Source: Nielsen//NetRatings
MORGAN STANLEY DEAN WITTER 115
This memorandum is based on information available to the public. No representation is made that it is accurate or complete. This memorandum is not an offer to buy or sell or asolicitation of an offer to buy or sell the securities mentioned. Please refer to the notes at the end of this report.
Appendix 3: Glossary of Terms
ADSL Asymmetric Digital Subscriber Line. High-speedtransmission method usable on standard phone lines to ac-commodate graphics, video and sound.
Affiliate A station in contractual agreement with a networkto carry that network’s programs during specific times.
Agency commission The percentage of a media buy —usually 15% — that the advertiser pays to the agency plac-ing the business.
Agent log A server record that shows which programs (e.g.spider, search engine, link verifier) have contacted a server.
Alternate delivery Methods of delivering direct mail orsample products to households without using the UnitedStates Postal Service.
Alternate media Any means of reaching consumers otherthan by using solo direct mail and telemarketing, includingcooperative mailings, card decks, package inserts and free-standing inserts (FSIs), home-shopping programs, computeronline services and broadcast.
Applets Small application programs that can be embeddedwithin a Web page. Applets cannot be directly activatedfrom the operating system.
Arbitron A national research firm primarily engaged intelevision audience data; it surveys individual markets, syn-dicated programming, network delivery, etc.
Area of dominant influence (ADI) An exclusive geo-graphic area of counties in which the home market televi-sion stations hold a dominance of total hours viewed. (Ar-bitron’s definition; similar to Nielsen’s DMA definition).
Average audience (AA) The percentage of national televi-sion homes that view the average minute of a given telecast.This is the standard television rating that is generally used todetermine national network performance. Locally, the rat-ings are usually per average quarter hour.
AVI Microsoft’s format for packaging and playing videounder the Windows operating system.
Backbone Very high-speed, wide-bandwidth transmissionline forming a major pathway in a network.
Bandwidth The information capacity, usually measured inmegahertz or bits per second, that can be transmitted by aparticular line or cable or managed by a piece of hardwareor software.
Banner Web advertisement generally displayed at the top ofa Web page, that often links to the advertiser’s site.
Bar code The nine-digit ZIP code translated into a codingstructure of vertical bars and half bars used in order to speedthe sorting of mail and enabling mailers to take a discounton postage.
Basic cable The basic, multiple-channel program servicedistributed to the cable subscriber for a monthly servicecharge averaging about $9.75 per subscriber nationwide.
Batching The gathering and organizing of incoming or-ders.
Baud Bits per second, also known as the baud rate. Meas-ures the rate of data transfer within a specific time. (Alsosee BPS.)
BBS Bulletin Board System. Special-purpose electroniccommunications system in which messages can be enteredor retrieved either privately or publicly.
Bit Single item of information set to one or zero. It takes 8bits to specify one byte, or one alphanumeric character.
Blurb Short electronic message about a business, product,service or related topic.
Bookmark Online reminder that flags a desired Internetaddress for future reference.
BPS Bits per second. Rate of information transfer. Mo-dem speed is measured in K (kilo) BPS. (See band.)
Broadband communication systems A distribution net-work that can carry many channels spread over a wide band.It also refers to cable-TV systems.
116 MORGAN STANLEY DEAN WITTER
This memorandum is based on information available to the public. No representation is made that it is accurate or complete. This memorandum is not an offer to buy or sell or asolicitation of an offer to buy or sell the securities mentioned. Please refer to the notes at the end of this report.
Broadcast satellite service (BSS) A radio communicationsservice that transmits or retransmits signals via space sta-tions for direct reception by receivers in individual homes orby community receivers for multiple users at one location.
Browser Software that accesses Internet resources.
Buying service A company whose principal function is thepurchase of media exposure.
Cable modem Modem that uses coaxial cable to achievegreater bandwidth and thus faster information transfer.
Cable penetration The percentage of TV households in agiven area that subscribe to cable television.
Cable television (CATV) A television delivery system thatprovides from 12 to more than 125 channels of video pro-gramming to subscribers through a coaxial cable or opticalfiber rather than by over-the-air transmission. Subscribersreceive basic cable service and have the option of subscrib-ing to additional channels for extra monthly fees. Cabletelevision distribution systems consist of four parts: (1)headend, (2) trunk lines, (3) feeder lines, and (4) drop lines.(See individual entries.)
Cablecasting Programming originated by cable systemsand fed directly to cable subscribers, also known as localorigination or program origination.
Cache Download information and store in memory for fu-ture use.
Caging The opening and sorting of orders and the han-dling of checks and cash; term refers to cages in which peo-ple work for security purposes.
Call center A site that houses a telemarketing operation.
Card deck A pack of postcards, usually mailed in a clearpoly outer envelope, that is used in both consumer and busi-ness-to-business direct marketing. The postcards, whicheither order the product or ask for more information, can bemailed back to the individual advertiser.
CD-R (Write Once Recordable) Currently available. Sameas CD-ROM; however, user can write data to the disk onetime and read it many times.
CD-ROM (Read Only) Currently available. User can onlyread the disk. Can hold up to 650 megabytes of data. Usedfor data or music, not for movie-length video.
CD-RW (Rewritable Compact Disk) Similar to CD-ROM;however, user can write, erase, and rewrite data to the diskmany times.
Centerless network Network architecture that uses a re-dundant design so that multiple nodes remain running evenif one becomes inoperative.
CGI Common Gateway Interface. Web programmingmethod that turns non-Web information into a Web docu-ment on the fly and vice versa. Used for interactive onlineelements.
Chat room Online communication exchanges where typedmessages can be exchanged in real time.
Churn The turnover in cable subscribers caused by partialand full-service disconnects and new customers.
Circulation The number of copies (newspapers and maga-zines) sold or distributed. For the more than 90% of week-day circulation audited by the Audit Bureau of Circulation,the term always denotes paid circulation. Circulation alsorefers to the number of households or individuals that actu-ally view the schedule of a network or station during aspecified period of time.
Classifieds Short text advertisements organized by cate-gory.
Cluster The grouping of commercial messages into a singlesegment to preserve continuity of program material.
Clutter The negative aspect of “cluster,” i.e., ads losingimpact because they are grouped with other ads.
Coding Accuracy Support System (CASS) Created by theU.S. Postal Service to ensure the accuracy of software pro-grams used by service bureaus to check addresses and codemailings for delivery.
Common carrier A telecommunications company thatprovides communications transmission services to the pub-lic.

MORGAN STANLEY DEAN WITTER 117
This memorandum is based on information available to the public. No representation is made that it is accurate or complete. This memorandum is not an offer to buy or sell or asolicitation of an offer to buy or sell the securities mentioned. Please refer to the notes at the end of this report.
Communications Act of 1934 This legislation created theFederal Communications Commission (FCC) to regulate allinterstate and foreign communications by wire and radio. Itcovers all common carrier and broadcast communicationswithin the U.S. and its territories. There are three phases tothe FCC’s regulation of broadcasting: (1) the allocation ofspace in the radio frequency spectrum, (2) the assignment ofstations in each service area within the allocated frequencybands, and (3) the regulation of existing stations.
Communications satellite A space vehicle located in afixed orbit that can receive radio and TV signals and trans-mit them back to earth.
Community antenna television (CATV) The original ca-ble TV system in which signals were picked up by a singlehigh antenna and relayed by cable to subscribers. Theservice was developed in the late 1940s in communitiesunable to receive TV signals because of terrain or distancefrom TV stations. The term CATV now refers to cable tele-vision in general.
Computer network Two or more computers connectedtogether to share resources.
Computer service bureau A company that will maintainlists for list owners. Services may include updating the list,merge/purge, data overlays and preparing the list for mailingor rentals.
Concatenate Chain together in a sequence.
Continuity program An offer of a series of products to bereceived in timed intervals. Most often used for books,tapes/CDs and recipe cards.
Cookie Software implemented on client’s machine to makeit easier for a server and client to remember previous trans-actions.
Cooperative advertising (Co-Op) Advertising (includingdirect mail, inserts, stuffers, card decks) where offers fromseveral different mailers are included.
Cooperative broker A person/company who recommendsand takes orders for marketers who want to be part of a co-operative effort.
Cooperative manager A person/company who sells spacein the co-op for the cooperative owner.
Coupons A promotional device used by marketers to in-crease sales or store traffic by offering a discount when thecoupon is redeemed.
Coverage The potential number of homes able to receivetelevision programming aired by a given station or network.
CPM Cost per thousand. The calculation of the advertisingcost to reach 1,000 households or viewers. Computed bydividing the advertising cost by the number of householdsor viewers. It measures cost efficiency and is used to com-pare programs with different audience appeal.
Currency exchange A service that changes money fromone currency to another.
Custom publisher Any publisher who will, for a fee, cre-ate a publication for a direct marketer that is most often usedfor self-promotion or as a premium.
Cyberspace Term coined by William Gibson in his bookNecromancer to describe an area that exists only online.
Data compression Method of reducing the amount ofbandwidth required to transmit information, thus increasingthe speed of transmission.
Database A file that is maintained on a computer com-prised of pertinent information such as a company’s pros-pects or customers. The file can serve multiple applicationsand be manipulated for various purposes. The followingdefinitions apply to databases used for direct marketing pur-poses:
• Database analysis Interpreting information within thedatabase in order to gain customer insight and improvemarketing efficiency.
• Commercial database management Professionalmanagement of large compiled databases for list seg-mentation and rental.
• Database modeling Using statistical techniques inorder to predict future customer behavior.

118 MORGAN STANLEY DEAN WITTER
This memorandum is based on information available to the public. No representation is made that it is accurate or complete. This memorandum is not an offer to buy or sell or asolicitation of an offer to buy or sell the securities mentioned. Please refer to the notes at the end of this report.
Data entry The entering of names, addresses and otherinformation into a data storage and retrieval system. Datacan be entered via manual keying, electronic data transfer,or by scanning.
Demographics Social and economic information abouthuman populations including age, sex, income, education,type of residence, ownership of cars, etc.
Dayparts Specific segments of a broadcast schedule, e.g.,morning, daytime, early fringe, prime time, and late night.
Decoder An apparatus that converts a purposely scrambledTV signal into a viewable picture.
Delivery sequence file A computerized file of more than125 million records containing all the addresses the U.S.Postal Service serves throughout the U.S. Each addressrecord features ZIP+4, carrier route, delivery sequence, de-livery type and seasonal delivery information that can helpmailers maintain accurate and complete addresses on thelists they own and rent as well as code their mail for walksequence discounts from the postal service.
Designated marketing area (DMA) This represents anexclusive geographic area of countries in which the homemarket stations are estimated to have the largest quarter-hour audience share. (Nielsen’s term; comparable to Arbi-tron’s ADI.)
Digital cash Electronic money purchased in advance ofexpenditures, as with a debit card. Usually stored as en-crypted data in a digital wallet.
Digital certificate Piece of identity in an online environ-ment, often stored in a digital wallet.
Digital wallet Secure encrypted envelope that seals per-sonal information including bank accounts, credit cardnumbers, expiration dates, shipping and billing addresses,and digital identification.
Direct broadcast satellite (DBS) A high-powered satellitesystem that works the same way that cable satellites do.Since it operates with more power, its signal can be receivedwith much smaller, and therefore more affordable, earthstations. A DBS transmits several signals directly to homesfor pickup by way of a small roof-top dish antenna. This
new generation of high-powered satellites was authorized inthe summer of 1982.
Direct response advertising Commercial messages thatseek direct and prompt response from the viewer by exhib-iting telephone numbers, box numbers, etc., to get theviewer to order or inquire about products or services.
Directory Alphabetically arranged list of categories, used,for example, to locate sites on the Web.
Display Large Web advertisement, generally varying insize from quarter-, half- to full-screen, which links to an-other site.
Domain name Web site identification registered with In-terNIC, usually ending in .com, .edu, .gov, .mil, .net, or.org.
Downlink An earth station used to receive signals fromsatellites.
Download Send a file or program from online storage to apersonal computer for later use.
DVD-RAM (Rewritable Digital Video Disk) Similar toDVD-ROM; however, user can write, erase, and rewritedata to the disk many times.
DVD-ROM (DVD Read Only) Able to store 4.7 (single-layer) to 9 gigabytes (multiple-layer) and later 17 gigabytes(double-sided), (multiple layer), or 4,700, 9,000, and 17,000megabytes, respectively. Can be used for data, music, ormovie-length video. Cost $2.50 per disk to manufacture.
E-mail Electronic mail. System that lets users exchangemessages across a network.
EDI Electronic Data Interchange. The structured exchangeof standard business information.
EFT Electronic funds transfer.
Encryption Coding of confidential, personal, or financialinformation for secure transmission.
Extranet Wide area network with Weblike operations.
FAQ Frequently Asked Questions. Appear often on newsgroups, mailing lists, forums, and technical support sites.

MORGAN STANLEY DEAN WITTER 119
This memorandum is based on information available to the public. No representation is made that it is accurate or complete. This memorandum is not an offer to buy or sell or asolicitation of an offer to buy or sell the securities mentioned. Please refer to the notes at the end of this report.
Feed Transmission of a program by a network to a localstation.
Feeder lines Coaxial cables that branch from trunk linespast individual cable subscriber homes.
Firewall Security procedure that sets up a barrier betweenan internal LAN (local area network) and the Internet.
Fixed rate Price set by a station or network for a specifictime slot. It guarantees that a commercial message will runin that position without any possibility of preemption.
Flame Send online communication involving personal at-tacks and/or derogatory remarks.
Forum Open discussion on an online service. Similar tonews groups on the Net.
Forum message Announcement in message section of aforum.
Free-Standing Insert (FSI) A promotional piece that isloosely inserted into a newspaper or magazine.
Frequency The average number of times an audienceviews a given television schedule; programs, announce-ments, or both.
Fringe time That portion of the network broadcast dayimmediately preceding prime time (early fringe) and imme-diately following prime time (late fringe).
Fulfillment All activities involved in the processing andservicing of mail, FAX and telephone orders.
• Literature fulfillment Refers to the sorting and quali-fying of leads, sending the appropriate information,and, if outsourced, forwarding leads to the marketer forfollow-up.
• Subscription fulfillment A specialized service forperiodical publishers. Services include maintaining thesubscriber list, generating invoices and renewals andrecording payments.
• Product fulfillment The storage and shipping of sam-ples and merchandise.
FTP File Transfer Protocol. Method used to upload anddownload files between a computer and Internet servers.
GIF Graphics Interchange Format. Compressed, bit-mapped graphics file.
Geocoding The process of appending latitude and longi-tude coordinates to a database record so it can be properlyplaced on a geographical map.
Gross audience The total number of homes or people whoview a certain television schedule, without regard to anypossible duplication that may occur.
Gross rating point (GRP) Sum of individual telecast rat-ing points on a total program basis or advertiser commercialschedule, without regard for duplication.
Hacker Individual who forces unauthorized entry into acomputer system. Also slang for computer enthusiast oramateur.
Headend Comprises cable system facilities. This equip-ment is used to receive, amplify, and convert incoming sig-nals (whether broadcast, via satellite, or local origination)and redistributes them to subscribers.
Hertz A unit of frequency equal to one cycle per second.One kilohertz is 1,000 hertz; one megahertz is one millionhertz; one gigahertz is one billion hertz.
Hits Number of times an online site is visited.
Home page Main page or welcome image for a Web site.Often shows a table of contents or refers to documents onother pages.
Home passed Homes that are, or could be, connected to acable system because feeder lines are in the area.
Homes using television (HUT) The percentage of televi-sion homes that are watching television during a given timeperiod.
Horizontal saturation A heavy commercial announcementschedule on multiple channels, placed at the same time orthereabouts for several consecutive days. This is used totarget a specific segment of the viewing audience (see “ver-tical saturation”).

120 MORGAN STANLEY DEAN WITTER
This memorandum is based on information available to the public. No representation is made that it is accurate or complete. This memorandum is not an offer to buy or sell or asolicitation of an offer to buy or sell the securities mentioned. Please refer to the notes at the end of this report.
Host Computer system (of any size) with a direct, high-speed transmission link to the Internet. Individual usersconnect to a host via LAN or dial-up modem.
HTML Hypertext Markup Language. Used to author Webdocuments containing links, graphics, and multimedia.
HTTP Hypertext Transport Protocol. Method used totransmit hypertext files.
Hypertext Any document with a link or links to otherdocuments.
Icon Graphical interface that, when clicked, accesses anobject or program.
Impressions (or “gross impressions”) The total number oftimes an advertisement is viewed; usually expressed inhomes or viewers.
Independent stations Stations not affiliated with any net-work; usually refers to commercial stations only.
Ink jet printing Superheated dots of ink are sprayed froman ink reservoir on the printhead to form full characters.
Insert Preprinted literature (usually advertising) that is in-serted inside the newspaper.
Interactive cable A cable system that provides two-waycommunication in which the viewer can respond, e.g., bypushing a button to give an opinion on a program or prod-uct, or to order a product.
Interconnects Several cable systems in a specific area con-nected together for programming and or advertising/salesreasons
InterNIC Shared activity between the National ScienceFoundation, AT&T (for directory service support), andNetwork Solutions for domain name registration.
Intranet Internal network with Web-like operations.
ISDN Integrated Services Digital Network. High-speed,wide-bandwidth, dial-up phone line for transmission of text,graphics and sound.
ISP Internet service provider. Company that maintainspowerful servers and high-speed transmission lines to accessthe Internet.
Keyword Main word in text. Entered in search engines tolocate information in a database.
Labels Paper printed with a name and address that is af-fixed to a mailing piece and serves as the mailing addressvehicle. Different types of labels include: peel-off or pres-sure-sensitive, gummed and paper (or Cheshire).
LAN Local area network. Links computers in the samebuilding or area, generally less than one mile.
Laser printing Similar to a photocopy machine, the laserprinter uses a laser beam, toner and fuser to “etch” the im-age onto a photoelectric drum.
Leased line Telephone line set up between any two sitesfor dedicated, continuously active transmission.
Lettershop A company that will assemble and insert thevarious printed elements of a direct mail piece, label, sort,tag and deliver the mailings to the post office for mailing.The lettershop will provide the mailer with written proof ofdelivery to the U.S. Postal Service.
Link Jump from one location on the Web to another.
List Services
List broker A list specialist hired by a mailer to make thenecessary arrangements to use other companies’ lists. Bro-kerage services usually include research, list selections, rec-ommendations and logistics so that the rented lists arrive atthe proper time. The standard commission to a list broker is20 percent.
List cleaning The process of updating a list in order to re-move any undeliverable addresses. Other cleaning activitiescould include removing duplicates, bad debts, names on theDMA Mail Preference Service, prison ZIPs, etc.
List maintenance The ongoing process of keeping a mail-ing list up-to-date by adding, editing and deleting data.
List manager Whereas a list broker works for a mailer, thelist manager works for the list owner. The primary function
MORGAN STANLEY DEAN WITTER 121
This memorandum is based on information available to the public. No representation is made that it is accurate or complete. This memorandum is not an offer to buy or sell or asolicitation of an offer to buy or sell the securities mentioned. Please refer to the notes at the end of this report.
is to promote the list to mailers and list brokers for listrental. List managers can be either an internal employee ofthe list owner or part of an outside list management com-pany paid a commission by the list owner. Managementservices usually include marketing of the list, coordinatingand controlling rental activity, and accounting. The stan-dard commission for a list manager is 10 percent.
List server Software that manages mailing lists on mailinglist servers. Listserv and Majordomo are two of the primarymailing list servers.
• Data overlays The matching of two or more lists thatcontain the same names or addresses but where one listadds additional data such as demographics orgeographics to the other.
• Enhancement Any additional information that can beappended to a list to increase its value to the mailer.
• Merge-purge The process of combining two or morelists into one while at the same time identifying and re-moving any duplicates.
• Mail Preference Service (DMA MPS) The DirectMarketing Association (DMA) offers a service for indi-viduals who want their names removed from mailingslists so they will stop receiving direct mail.
• Psychographics The qualities or characteristics ofindividuals which indicate lifestyle, purchasing habits,attitudes and personal values.
• Seeding False or “dummy” names are added to amailing list as a way to check delivery and to uncoverany unauthorized list usage.
Local advertising The time sold by individual stations tolocal advertisers at local rates.
Local program Station-originated, non-network program.
Logo Name-only, paid advertisement on the Web, usuallysmaller and less expensive than a banner. May not link tonamed site.
Low-power television (LPTV) A new TV service(authorized in 1982) licensed by the FCC to broadcast asingle, over-the-air signal of low power to a small geo-
graphic area. These new stations operate on existing VHFand UHF bands and can originate programming — eitherpay TV, advertiser-supported, or the rebroadcast signal of aconsenting station. They are subject to fewer regulatoryrestrictions than conventional full-service stations. LPTVstations have traditionally rebroadcast the signals of full-service stations.
Mail bomb Useless e-mail that clogs an electronic mail-box.
Mailbot Cross between mail and robot. A program thatresponds automatically to routine e-mail.
Mailing list List of participants who exchange electronicmail message regularly, usually focused on a particular topicor concern.
Mail monitoring Mailers track their mail in order to verifycontent within the direct mail package and to determine thelength of delivery time.
Mall Virtual area on a server or online service where peo-ple can sell or advertise their goods or services.
Market section audience (MSA) Nielsen term referring toaudience market breakdowns by county size, income, occu-pation, etc.
Master antenna television (MATV) Delivery method forpay programming to multi-unit dwellings.
Media Any form of communication. Direct response me-dia would include: space advertising, direct mail, TV, radio,take-ones, card decks, package inserts, cooperative efforts,on-line shopping services.
Media mix Utilization of more than one medium for anadvertiser to achieve marketing goals.
Merge-purge See List Services
Microwave The portion of the radio spectrum above 1,000megahertz (the frequency range between infrared andshortwave radio). It can be used to carry TV signalsthrough the air for long distances. These signals do notfollow the earth’s curvature and are not reflected by theionosphere. They may pass through buildings and otherobstacles, but are subject to absorption or interference.
122 MORGAN STANLEY DEAN WITTER
This memorandum is based on information available to the public. No representation is made that it is accurate or complete. This memorandum is not an offer to buy or sell or asolicitation of an offer to buy or sell the securities mentioned. Please refer to the notes at the end of this report.
Microwave relay system A system used to move a broad-cast signal from one location to another without the use ofland lines. TV signals have characteristics that precludetheir being sent over ordinary wire lines; their transmissiondepends on coaxial cable, satellites, or microwave relay.TV signals are carried coast to coast mostly by microwave,with cable used for local loops where microwave is not fea-sible. Although some private microwave TV relay exists,most live networking is over the facilities of common carri-ers.
Mirror Copy and display the material from one Web siteon another.
Modem Modulator-demodulator. Converts computer datato a form that can be transmitted over phone lines and viceversa.
Moderated When a news group or forum is checked by anindividual with the authority to censor messages.
Multimedia Combination of text, virtual reality, graphics,video, animation, and/or sound.
Multiple system operator (MSO) A company that ownsmore than one cable system.
Multipoint distribution service (MDS) An over-the-air,super-high-frequency microwave service providing omnidi-rectional transmission to selected customer locations withina 10–20 mile radius. Since the FCC licenses MDS opera-tors as common carriers, they must lease their transmissionfacilities to service providers. They generally lease most oftheir station time to pay-movie entrepreneurs, who provideprogramming to hotels, apartment buildings, and homes.They also transmit video, data text, or other services to sub-scribers, who must be equipped with special antennas andconverters to receive the signals.
Narrowcasting Providing special-interest programming forsmall, target audiences via a variety of channels; frequentlyused to describe cable programming.
National Change of Address (NCOA) A service providedby the U.S. Postal Service, through licensed computer serv-ice bureaus, that enables mailers to make any necessary ad-dress corrections prior to their mailing being dropped. Themailer provides a magnetic tape that is run against the na-
tional change of address bank and then is returned to themailer with all the corrections made.
National spot A form of broadcast advertising in whichnational advertisers, through their agency or buying service,select their own markets and stations. The station usuallyhas a contract with one station rep firm to represent it toadvertising agencies.
Net names See List Services
Netiquette Guidelines for appropriate communication innews groups.
Network address Electronic mail address.
Network advertising The sale of network time to nationaladvertisers.
Network feed The transmission of program material by thenetwork to its affiliate stations nationwide. The feed can beaired live by the stations or taped for broadcast at anothertime.
News group One of thousands of discussion groups onUSEnet. Requires a full-service Internet account and newsgroup reader software provided by an ISP.
Nielsen Media Research (now owned by VNU) A firmengaged in local and national measurement of the televisionaudience. Also involved in other research and marketingactivities.
Nixies Pieces of mail returned as “undeliverable as ad-dressed”
Node Any computer connected to a network.
Nonlink Advertisement on the Web without a hypertextlink. Usually less expensive than a linked ad.
O&O stations (owned and operated) Refers specificallyto those stations that are owned and operated by a nationalnetwork.
Offset printing Using a metal or paper plate, ink is firsttransferred to an offset drum and then passed to the paper.
Optical fiber Very thin glass fibers used to transmit lightwave signals (as opposed to radio waves or coaxial cable).
MORGAN STANLEY DEAN WITTER 123
This memorandum is based on information available to the public. No representation is made that it is accurate or complete. This memorandum is not an offer to buy or sell or asolicitation of an offer to buy or sell the securities mentioned. Please refer to the notes at the end of this report.
Outsourcing Using an outside service rather than per-forming the work in-house.
Package A complete program or series of programs readyfor airing; produced and sold as a unit.
Package inserts Any promotional offer included with theshipment of a customer’s order. Offers may be from thesame mailer shipping the product or other vendors who payto be included.
Packets Means of dividing up and structuring informationin a computer message for reliable Internet transmission tothe correct address.
Participating program A television program sponsored byseveral advertisers.
Participation A commercial announcement within a pro-gram versus one between different programs.
Pay cable Premium program services for which the sub-scriber is charged fees above the cost of the monthly basicsubscription. Such services are provided by about 20 pro-grammers, including Home Box Office (HBO), The DisneyChannel, etc.
Pay-per-view television (PPV) Pay television in whichsubscribers pay for individual programs rather than for amonthly subscription.
Pay television Premium television entertainment deliveredto subscribers for a monthly fee via pay cable, over-the-airsubscription television (STV), multipoint distribution serv-ice (MDS), and/or satellite master antenna systems(SMATV).
Penetration The proportion of TV households to totalhouseholds in a given locale. Also, the percentage ofhouseholds subscribing to a given service.
Personalization Using/printing personal information, suchas a first or last name, in a direct mail campaign. See Vari-able Imaging
Piggyback An advertisement promoting two separateproducts in a 60-second commercial.
Plug-in Applet integrated with a browser that enables usersto view text, images, sound, and/or video in special formats.
Pointcast A push technology that delivers requested infor-mation to a specific site. Also the name of a proprietarynews/advertising product.
Poly bag An outside mailing envelope made of polyethyl-ene instead of paper.
POP Post Office Protocol. Allows users to read e-mailfrom their operating system without logging onto a server.
Post Enter a message on a news group or mailing list.
Postage-paid reply service A service allowing mailers touse a lettershop's postage-paid permit and have the business-reply mail sent there instead of opening their own accountwith the USPS.
PPP Point-to-point protocol. Type of Internet accountneeded to access FTP servers.
Predictive dialing See Telemarketing Services
Pre-emptible spots Air time sold at reduced rates, with thestation keeping the option to sell that time to any intercedingadvertiser willing to pay full price.
Premium A free gift offered to a prospect to induce agreater response to the main product or service that is beingsold. A premium need not bear any relationship to theproduct being offered.
Pre-press services The various steps necessary, up to finalprinting, to transform original copy and art into the formrequired for printing. Services include:
• Color proofing Proofs made from the separate platesin color process work, showing the sequence of printingand the result after each additional color has been ap-plied.
• Digital color proofing An off-press color proof pro-duced from digital data without the need for separationfilms.
• Image manipulation Custom alterations of digitalimages.

124 MORGAN STANLEY DEAN WITTER
This memorandum is based on information available to the public. No representation is made that it is accurate or complete. This memorandum is not an offer to buy or sell or asolicitation of an offer to buy or sell the securities mentioned. Please refer to the notes at the end of this report.
• Imagesetter A typesetting system that can processboth text and images.
• Scanning: Desktop, high-end, mid-range Electronicprocess used to make color and tone-corrected separa-tions of images.
• Thermal dye sublimation Proof-making processwhere pigments are vaporized and float to desiredproofing stock.
Preprint An all-advertising or advertising/editorial circularthat is printed separately and usually inserted inside news-papers.
Prime access Peak viewing hours, Monday-Saturday, 8:00-11:00 pm in Eastern and Pacific time zones, and 7:00-10:00pm in the Central and Mountain time zones. On Sunday,the times are 7:00-11:00 pm and 6:00-9:00 pm, respectively.
Protocol Standard procedure for processing data.
Psychographics See List Services
Public Access Rule FCC regulation requiring cable sys-tems with 3,500 or more subscribers to make at least onenon-commercial channel available to the public on a non-discriminatory basis.
Public TV Television programming supported by the pub-lic at large through government funds, corporate grants, andprivate donations, without standard commercial advertising.
Pull technology Typical Internet interaction in which anindividual must specifically request desired information.(Compare to push technology.)
Push technology Internet interaction that enables data to besent to an individual without a specific request. (Compareto pull technology.)
Quartile In a TV context, refers to a group of viewers thathas been divided into fourths (or quartiles), ranging from theheaviest viewers to the lightest. These groups are then ana-lyzed separately, based on frequency levels of viewing.Quintile is used to describe the subdivision of a viewingaudience into fifths.
Quicktime Apple Computer’s format for packaging andplaying video and animation.
Q score A testing term that indicated the inherent appeal ofa program or personality.
Radio common carrier (RCC) Common carriers whosemajor businesses include radio paging and mobile telephoneservices.
Rating Program audience expressed as a percentage of allhouseholds or a demographic category.
Rating service Research organization that offers a syndi-cated service of periodic measurements of the televisionaudience.
Raw hit Visit to a single file on a Web page.
Reach The number of unduplicated households or peopleexposed to a program, a group of programs, or an adver-tiser’s schedule over a specific period. Same as cumulativeaudience.
Referrer log Server record of which sources or URL ad-dresses have launched a link to a file on that server.
Response booster Any device, token, premium or sweep-stakes that will help raise the response rate.
RFC Request for comment. Method of open communica-tion adopted in 1969 as part of the development of the Inter-net.
Roadblock Airing commercials on all stations simultane-ously in the same time period for maximum “reach.”
ROP Originally, ROP (or “run-of-press”) denoted an ad-vertisement position anywhere in a newspaper (as opposedto a preferred position). Now ROP is generally applied toads that appear on a newspaper page (as opposed to insertsor preprints).
Roulette Link on a page that sends visitors randomly toanother page on the same site or to another site.
Run-of-schedule (ROS) Scheduling of commercials at anytime of the station’s choosing.

MORGAN STANLEY DEAN WITTER 125
This memorandum is based on information available to the public. No representation is made that it is accurate or complete. This memorandum is not an offer to buy or sell or asolicitation of an offer to buy or sell the securities mentioned. Please refer to the notes at the end of this report.
Satellite master antenna system (SMATV) A pay-TVdistribution system serving large apartment buildings, con-dominiums, private housing complexes, or mobile homeparks. SMATV is technically similar to cable and pay TVin that it uses an earth station to pick up broadcast signals,pay cable, and other programming from space satellites,then transmits them through a master antenna TV system tosubscribers. The difference is that SMATV wires only thecomplex that will receive the signal from a master rooftopantenna. This avoids two problems: obtaining a franchisefrom local municipalities, which regular cable TV compa-nies must do to string or bury wire along streets, and ac-quiring rights of way from local municipalities. Anotherbenefit is that operators are free from federal regulationsince they do not come under the FCC’s definition of a ca-ble system, and they are free from local regulation sincethey do not need a municipal franchise. They have contractsonly with property owners. These systems are sometimescalled private cable systems or minicable systems.
Saturation Many announcements within a short period oftime to give maximum impact to an advertiser’s message.
Scanner A device that interprets the reflected light from aphysical image and digitizes it so it can be stored on a com-puter. Using a scanner can eliminate the need for humancontact with individual documents.
Scanning See Pre-Press Services
Scatter buying Network advertising time bought after thestart of the broadcast season and for short periods of time incontrast to up-front buying.
Scrambler An electronic device that alters the TV signal sothat the resulting picture cannot be viewed on a subscriber’sset without a decoder.
Search engine Software designed for the rapid location ofinformation in one or more databases.
Seeding See List Services
Selective binding The process which allows an advertise-ment to be inserted into only certain select issues of a maga-zine, or allows selected pages to be inserted in a catalog.
Server Computer used to control or manage a network.
Server report Operational information for host computer.
Service bureaus See Computer Service Bureaus
SET Secure Electronic Transactions. Standard for securecredit card transactions online that integrates SSL (SecureSocket Layer), digital signatures, digital wallets, and en-cryption technologies.
Share Audience during the average minute of a program,expressed as a percentage of households using television.Computed by dividing average audience rating by house-holds using television.
Shared mail A direct mail term generally referring to twoor more advertisements wrapped around each other, orwrapped together with any accompanying coupons, that aremailed out at third-class mail rates as a single piece.ADVO-System uses the trademarked terms “network mail”and “marriage mail.”
Sheet-fed press An offset printer that prints on paperwhich is fed one sheet at a time. Used primarily for shortruns or higher-quality printing.
Shockwave Macromedia’s format for incorporating multi-media objects on Web pages.
Shopper Circulars distributed free of charge that look likenewspapers, but generally have little editorial content, run-ning between 75% and 100% advertising.
Signature file Three- to six-line, text-only, electronic fileused as an online identity. Like an online business card.
Simmons Market Research Bureau Research organiza-tion that provides data for media and market planning. Itcovers media audiences, marketing data, demography, me-dia imperatives, psychographics, and brand decision-makinginvolvement.
Sitecast A Web-based event that incorporates real timevideo and chat lines with pre-recorded information.
SLIP Serial Line Internet Protocol. Type of Internet ac-count needed to access Web servers.
Sorting The computerized process of reorganizing a listfrom one sequence to another. For example, a file can be

126 MORGAN STANLEY DEAN WITTER
This memorandum is based on information available to the public. No representation is made that it is accurate or complete. This memorandum is not an offer to buy or sell or asolicitation of an offer to buy or sell the securities mentioned. Please refer to the notes at the end of this report.
sorted by last name, company name, ZIP code, high donors,multi-buyers, recent buyers, etc
Spam Unwanted advertisements sent through e-mail orposted on inappropriate news groups.
Spider Also known as a robot or wanderer. A Web searchprogram that automatically collects and stores keyword in-formation.
Split-30 Two 15-second commercials aired during thestandard 30-second commercial time slot.
Sponsor Cost-effective type of advertising on the Web,usually featuring a small banner ad linked to another site.
Spot Commercial time available for sale to local and na-tional advertisers.
Spot advertising Time sold by individual stations to na-tional advertisers.
SSL Secure Socket Layer. Netscape’s protocol for sendingconfidential information, such as credit card numbers, overthe Internet.
Station lineup The total assemblage of stations carrying anetwork program.
Streaming audio Sound files audible as they are transmit-ted over the Internet.
Streaming video Video images that can be viewed as theyare transmitted over the Internet.
Strip A program or commercial announcement scheduledat the same time on successive days of the week (same as“across the board”).
Subscribe Add one’s e-mail address onto a mailing list ornews group.
Subscription television (STC) A pay TV system thattransmits scrambled signals over the air to a standard broad-cast channel. To receive the program, subscribers musthave a decoder attached to their sets.
Superstation An independent TV station whose signal istransmitted via satellite to cable systems in distant markets.
Sweeps A term used to describe those times of the yearwhen all individual markets are measured by the ratingservices. In TV, it commonly refers to the four-week meas-urement periods in November, February, and May.
Syndication The market-by-market method of distributingprograms, as opposed to networking.
Syntax checker Program that checks for “grammaticalerrors” in the structure of HTML code.
Sysop Systems operator. Manager of a bulletin board sys-tem, news group, online service, or special interest groupsite.
Take-ones Promotional literature found in racks, often atthe grocery store.
Target audience The audience most desired by an adver-tiser in terms of potential product consumption or serviceusage. Sought-after segments may be defined by sex, age,income, occupation, county size, etc.
Tariff Common carrier’s statement describing services itoffers and rates it charges.
TCP/IP Transmission Control Protocol/Internet Protocol.The communications protocol for connecting hosts to theInternet.
Telemarketing Services
• Inbound Any phone calls that come into a telemar-keting call center.
• Interactive Voice Response (IVR) The various re-corded or digitized text messages that can be accessedelectronically by using a telephone.
• Outbound Any phone calls made out of a telemar-keting call center.
• Voice Response Unit (VRU) Hardware that is con-nected to the telephone through which Interactive VoiceResponse messages are generated.
• Predictive dialing The automatic dialing by a com-puter of telephone numbers on a pre-selected list. Thesystem can, with great accuracy, discern an answeringmachine from a human voice and will instantly connect

MORGAN STANLEY DEAN WITTER 127
This memorandum is based on information available to the public. No representation is made that it is accurate or complete. This memorandum is not an offer to buy or sell or asolicitation of an offer to buy or sell the securities mentioned. Please refer to the notes at the end of this report.
a respondent to a TSR. If there is no answer or a busysignal, the computer will know to redial later.
• Telephone Service Representative (TSR) Anyonewho sells or services customers over the phone, eitherinbound or outbound.
• Telephone Preference Service (DMA TPS) A serviceof the Direct Marketing Association for consumers whowant to have their names removed from telemarketinglists.
Teletext One-way selective information system that trans-mits text and graphic information in a continuous cycle via astandard video signal to the user’s home or office.
Thermal dye sublimation See Pre-Press Services
Tokens An action device, the purpose of which is to in-volve the prospect in the offer. It can be anything from acoin, peel-off stamp, or a punch-out paper piece that is in-serted into the order form.
Total market coverage (TMC) A method newspapers useto reach newspaper subscribers and non-subscribers to at-tract advertisers. The TMC is usually a weekly or monthly“shopper”; it can be heavy on ads and light on editorial, orvice versa. The goal is always the same — to give market-ers a blanketed or total market coverage approach to reach100% of a newspaper’s area. The term is used inter-changeably with “alternate distribution system” (ADS).
Trade books Books marketed primarily (50% or more)through trade channels, i.e., to bookstores and libraries di-rectly or through wholesalers and jobbers.
Transponder An electronic device on a satellite that re-ceives audio and video signals beamed upward from earthand transmits them back to earth.
Trunk Coaxial cable that distributes signals from theheadend of a cable system to feeder lines in the community.
Turnover Frequency with which the audience for a pro-gram changes over a given period of time.
TVQ A national survey of the opinions that people expressabout TV programs or personalities.
Ultra high frequency (UHF) In TV broadcasting, thewave bands that carry programs over the air and are re-ceived on channels 14 through 83 (see “very high fre-quency”).
Unduplicated audience The number of different people orhomes reached by a TV schedule or program over a specificperiod of time (same as “cumulative audience” or “reach”)and usually expressed as a percent.
Up-front buying Major commitment by national advertis-ers to network purchases, often for an entire year, either on afirm basis or on a six-month firm basis. Such buying takesplace after a network announces its new season schedule.
Uplink An earth station used for transmitting to a satellite.
Upload Send a file or program from a personal computer toon-line storage.
URL Uniform Resource Locator. Address designating thelocation of resources on the Web.
Variable imaging Personalization done on a digital press.
Vertical saturation Multiple commercial announcementsplaced on one or more days in various dayparts to reachmany different people quickly (see “horizontal frequency”)
Very high frequency (VHF) In TV broadcasting, the wavebands that carry programs over the air and are received onchannels 2 through 13 (see “ultra high frequency”).
Videocassette recorder (VCR) Instrument used to playvideocassettes containing programming. It can play back,erase, and record. Also known as videotape recorder(VTR).
Videodisc Similar to a record, it stores a video program toplay back on a videodisc player.
Videodisc player The instrument that plays the videodiscvia a stylus or laser beam. It can neither record nor erase.
Videotape Magnetic tape on which both sound and pictureare recorded simultaneously, in contrast to audio tape,which records only sound.

128 MORGAN STANLEY DEAN WITTER
This memorandum is based on information available to the public. No representation is made that it is accurate or complete. This memorandum is not an offer to buy or sell or asolicitation of an offer to buy or sell the securities mentioned. Please refer to the notes at the end of this report.
Videotex The generic or collective term for all forms ofelectronic information and/or services via telephony lines,broadcast signals, or cable TV.
Viewdata Textual information displayed on the TV set thatis transmitted over telephone lines from a computer databank. It is two-way, enabling subscribers to respond.
Virtual bank Online financial system that acts as an inter-mediary in purchasing transactions.
Virtual reality Computer-mediated method for interactingwith a three-dimensional environment.
VRML Virtual Reality Modeling Language. Programminglanguage for displaying three-dimensional objects.
WAN Wide area network. Links distant computer systems.
Web press A printing press that is fed by a large roll ofpaper instead of individual sheets.
Whois Computer database of domain names.
WWW World Wide Web. Portion of the Internet thatcontains data, graphics, sound, and video, and is accessedthrough a graphical interface.
Zapping When a TV viewer uses a remote-control deviceto change channels to avoid seeing commercials.

MORGAN STANLEY DEAN WITTER 129
This memorandum is based on information available to the public. No representation is made that it is accurate or complete. This memorandum is not an offer to buy or sell or asolicitation of an offer to buy or sell the securities mentioned. Please refer to the notes at the end of this report.
Price Table
Company Ticker Price as of 4/28 Rating Target PriceADVO AD.N 30.00 Outperform 33.00Akamai Technologies, Inc. AKAM.O 98.88 Outperform NAAmazon.com AMZN.O 55.19 Outperform NAAmerica Online AOL.N 59.81 ++ ++Ariba Inc. ARBA.O 74.19 Outperform NAARTISTdirect Network ARTD.O 4.75 Outperform NAAsk Jeeves Inc. ASKJ.O 30.38 Outperform NAAT&T T.N 46.69 Neutral NAAvenue A Inc AVEA.O 31.75 Outperform NACablevision Systems CVC.N 67.69 Neutral NACatalina Marketing POS.N 101.25 Strong Buy 130.00Charter Communications CHTR.O 14.69 Strong Buy 29.00CNET CNET.O 34.56 Outperform NAComcast Corporation CMCSK.O 40.06 Outperform 52.00Concentric Network Corp. CNCX.O 43.50 Neutral NACovad Communications Grp COVD.O 27.75 Outperform 55.00Cox Communications COX.N 42.81 Neutral NACSG Systems International CSGS.O 46.13 Outperform 100.00DELL DELL.O 50.13 Outperform NADigitas Inc. DTAS.O 15.44 Outperform 30.00DoubleClick Inc. DCLK.O 75.88 Outperform 150.00drugstore.com Inc. DSCM.O 7.81 Outperform NAEarthLink Inc. ELNK.O 18.88 Strong Buy 34.00eBay Inc. EBAY.O 159.19 Outperform NAElectronic Arts ERTS.O 60.50 Outperform NAExcite@Home ATHM.O 18.63 ++ ++Exodus Communications EXDS.O 88.44 Strong Buy 190.00Expedia Inc. EXPE.O 15.06 Outperform NAFox Entertainment Group FOX.N 25.75 Strong Buy 41.00FreeMarkets Inc. FMKT.O 72.19 Outperform NAGetty Images Inc. GETY.O 30.38 Outperform NAGrupo Televisa TV.N 63.44 Outperform 83.00Harte-Hanks HHS.N 24.75 Outperform 32.00Healtheon/WebMD HLTH.O 21.06 ++ ++HomeGrocer.com HOMG.O 5.00 Outperform NAHomestore.com HOMS.O 18.25 Outperform NAHughes GMH.N 96.31 Outperform 152.00IDG Books Worldwide IDGB.O 10.06 Outperform 18.00Inktomi Corporation INKT.O 153.94 Outperform 140.00Insight Communications ICCI.O 20.38 Neutral NAInterNAP Network Services INAP.O 38.50 Outperform 70.00Internet Initiative Japan IIJI.O 60.00 Outperform 100.00Internet Initiative Japan(C) IIJI.O 60.00 Outperform 100.00Interpublic Group IPG.N 41.00 Strong Buy 60.00Intuit INTU.O 35.94 Outperform NALastminute.com LMC.L 215.00 Outperform NALiberty Media LMGa.N 49.94 Strong Buy NAMarchFirst Inc. MRCH.O 21.31 Outperform 45.00Marimba Inc. MRBA.O 19.81 Outperform NAMartha Stewart Living MSO.N 14.25 Outperform 35.00MediaOne UMG.N 75.63 Neutral NA

130 MORGAN STANLEY DEAN WITTER
This memorandum is based on information available to the public. No representation is made that it is accurate or complete. This memorandum is not an offer to buy or sell or asolicitation of an offer to buy or sell the securities mentioned. Please refer to the notes at the end of this report.
Price Table (continued)
Company Ticker Price as of 4/28 Rating Target PriceMicrosoft MSFT.O 69.75 Outperform NANDS Group NNDS.O 56.50 Neutral NANetwork Solutions NSOL.O 148.00 ++ ++News Corp. NWSa.N 44.00 Strong Buy 74.00NorthPoint Communications NPNT.O 16.13 Outperform 37.00Omnicom Group Inc. OMC.N 91.06 Strong Buy 115.00Pixar Inc. PIXR.O 37.19 Neutral NApriceline.com Inc PCLN.O 63.25 Outperform NAPSINet Inc. PSIX.O 23.19 Outperform 32.00RCN Corporation RCNC.O 28.63 Outperform 78.00Rogers Communications RG.N 26.00 Outperform 34.00Savvis Communications SVVS.O 14.13 Outperform 34.00Scient Corporation SCNT.O 54.00 Outperform NASeagram VO.N 54.00 Outperform 68.00Tickets.com TIXX.O 4.00 ++ ++Time Warner TWX.N 89.94 ++ ++TMP Worldwide TMPW.O 65.38 Outperform 90.00True North Communications TNO.N 41.19 Strong Buy 50.00UnitedGlobalCom Inc. UCOMA.O 53.13 Outperform 109.00Valassis VCI.N 34.06 Outperform 50.00Ventro Corporation VNTR.O 27.50 Outperform NAVerio Inc. VRIO.O 37.56 Outperform 66.00Verisign VRSN.O 139.38 ++ NAVIA NET.WORKS, Inc. VNWI.O 19.94 Outperform 81.00Viacom VIA.N 54.81 Strong Buy 70.00Vignette Corp. VIGN.O 48.19 Outperform NAWalt Disney DIS.N 43.31 Strong Buy 40.00webMethods, Inc. WEBM.O 90.00 Outperform NAWomen.com Networks Inc. WOMN.O 5.00 Outperform NAWPP Group WPPGY.O 77.38 ++ ++WPP Group Plc WPP.L 1,023.73 ++ ++Yahoo! YHOO.O 130.25 Outperform NAYoung & Rubicam Inc. YNR.N 55.69 ++ ++Ziff-Davis ZD.N 9.81 ++ ++
Source: Morgan Stanley Dean Witter Research†† Estimates for this company have been removed from consideration in this report because, under applicable law and/or Morgan Stanley Dean Witter policy, MorganStanley Dean Witter may be precluded from issuing such information with respect to this company at this time.

MORGAN STANLEY DEAN WITTER 131
This memorandum is based on information available to the public. No representation is made that it is accurate or complete. This memorandum is not an offer to buy or sell or asolicitation of an offer to buy or sell the securities mentioned. Please refer to the notes at the end of this report.
____________________________________________________
The information and opinions in this report were prepared by Morgan Stanley & Co. Incorporated (“Morgan Stanley Dean Witter”). Morgan Stanley DeanWitter does not undertake to advise you of changes in its opinion or information. Morgan Stanley Dean Witter and others associated with it may make mar-kets or specialize in, have positions in and effect transactions in securities of companies mentioned and may also perform or seek to perform investmentbanking services for those companies. This memorandum is based on information available to the public. No representation is made that it is accurate orcomplete. This memorandum is not an offer to buy or sell or a solicitation of an offer to buy or sell the securities mentioned.
Within the last three years, Morgan Stanley & Co. Incorporated, Dean Witter Reynolds Inc. and/or their affiliates managed or co-managed a public offeringof the securities of Amazon.com, Avenue A, DoubleClick, Excite@Home, Priceline.com, TMP Worldwide, Walt Disney, Omnicom, Interpublic and Young& Rubicam.
Morgan Stanley & Co. Incorporated, Dean Witter Reynolds Inc. and/or their affiliates make a market in the securities of Comcast Corporation, CMGI,Excite@Home, Microsoft, Priceline.com, TMP Worldwide, Yahoo! and DoubleClick.
Morgan Stanley & Co. Incorporated, Dean Witter Reynolds Inc. and/or their affiliates or their employees have or may have a long or short position or hold-ing in the securities, options on securities, or other related investments of issuers mentioned herein.
The investments discussed or recommended in this report may not be suitable for all investors. Investors must make their own investment decisions basedon their specific investment objectives and financial position and using such independent advisors as they believe necessary. Where an investment is de-nominated in a currency other than the investor’s currency, changes in rates of exchange may have an adverse effect on the value, price of, or income de-rived from the investment. Past performance is not necessarily a guide to future performance. Income from investments may fluctuate. The price or value ofthe investments to which this report relates, either directly or indirectly, may fall or rise against the interest of investors.
To our readers in the United Kingdom: Morgan Stanley Dean Witter, regulated by the Securities and Futures Authority Limited, and/or its affiliates may beproviding or may have provided significant advice or investment services, including investment banking services, for any company mentioned in this report.Private investors should obtain the advice of their Morgan Stanley Dean Witter representative about the investments concerned.
This publication is disseminated in Japan by Morgan Stanley Dean Witter Japan Limited and in Singapore by Morgan Stanley Dean Witter Asia (Singapore)Pte.
To our readers in the United States: While Morgan Stanley Dean Witter has prepared this report, Morgan Stanley & Co. Incorporated and Dean Witter Rey-nolds Inc. are distributing the report in the US and accept responsibility for it contents. Any person receiving this report and wishing to effect transactions inany security discussed herein should do so only with a representative of Morgan Stanley & Co. Incorporated or Dean Witter Reynolds Inc.
To our readers in Spain: AB Asesores Bursatiles Bolsa SVB, S.A., a Morgan Stanley Dean Witter group company, supervised by the Spanish SecuritiesMarkets Commission (CNMV), hereby states that this document has been written and distributed in accordance with the rules of conduct applicable to finan-cial research as established under Spanish regulations.
To our readers in Australia: This publication has been issued by Morgan Stanley Dean Witter but is being distributed in Australia by Morgan Stanley DeanWitter Australia Limited A.C.N. 003 734 576, a licensed dealer, which accepts responsibility for its contents. Any person receiving this report and wishingto effect transactions in any security discussed in it may wish to do so with an authorized representative of Morgan Stanley Dean Witter Australia Limited.
To our readers in Canada: This publication has been prepared by Morgan Stanley Dean Witter and is being made available in certain provinces of Canadaby Morgan Stanley Canada Limited. Morgan Stanley Canada Limited has approved of, and has agreed to take responsibility for, the contents of this infor-mation in Canada.
Additional information on recommended securities is available on request.
© Copyright 2000 Morgan Stanley Dean Witter & Co.

MORGAN STANLEY DEAN WITTERMORGAN STANLEY DEAN WITTER
The e-Marketing Report
Equity ResearchGlobal
May 2000
May 2000
MO
RG
AN
STA
NLE
YD
EA
N W
ITT
ER
The e-M
arketing Report
EQ
UIT
YR
ES
EA
RC
H
The Americas Europe Japan Asia Pacific1585 Broadway 25 Cabot Square, Canary Wharf 20-3, Ebisu 4-chome, Shibuya-ku Three Exchange Square 4th Floor Forbes BuildingNew York, New York 10036-8293 London E14 4QA, England Tokyo 150-6008, Japan Hong Kong Charanjit Rai Marg FortTel: (1) 212 761 4000 Tel: (44 171) 425 8000 Tel: (81) 3 5424 5000 Tel: (852) 2848 5200 Mumbai 400 001, India
Tel: (91 22) 209 6600
BCE Place, 181 Bay Street, AB Asesores 23 Church Street The Chifley Tower, Level 33Suite 3700 Plaza de la Lealtad, 3 #16-01 Capital Square 2 Chifley SquareToronto, Ontario M5J 2T3, Canada Madrid 28014, Spain Singapore 049481 Sydney NSW 2000, AustraliaTel: (1) 416 943 8400 Tel: (34 91) 580 1100 Tel: (65) 834 6888 Tel: (61 2) 9770 1111
msdw.com X
OKWant to Profit from e-Marketing?
http://www.msdw.com


