132


ii
The CSP Alliance
The CSP Alliance is a public policy advocacy organization dedicated to bringing increased awareness and visibility to this sustainable, dispatchable technology. Our membership includes many of the world’s largest CSP corporations and their supply‐chain partners. Our objectives include advancing the industry’s value proposition, addressing issues of job creation and environmental sustainability, and setting the foundation for future uses of the technology.

iii
Contents Acronyms ............................................................................................................................... vi
Foreword ................................................................................................................................ vii
Executive Summary ................................................................................................................. x
Key Categories of Utility Value and Calculation of Net System Costs ..................................................... xi
Design and Operation of CSP with Thermal Energy Storage .................................................................. xii
Energy and Ancillary Services ................................................................................................................. xii
Capacity ................................................................................................................................................... xv
Integration and Curtailment Costs ........................................................................................................ xviii
Greenhouse Gas Emissions Reductions ................................................................................................... xx
Power Quality and Other Reliability Services ......................................................................................... xxi
Incorporating Economic and Reliability Valuation into CSP Plant Design .............................................. xxi
CSP with Thermal Storage and Solar PV in Renewable Energy Portfolios ............................................. xxii
Conclusions ............................................................................................................................................ xxii
1. Introduction ..................................................................................................................... 1
The Design of Clean Power Systems ......................................................................................................... 2
Value of CSP with Thermal Storage .......................................................................................................... 3
Report Overview ....................................................................................................................................... 5
2. Design and Operational Attributes of CSP with Thermal Energy Storage .......................... 7
Background on CSP Plant Design and Operations .................................................................................... 7
Types of CSP Power Plants and Implications for Storage and Dispatch Flexibility ................................... 9
Assessing Different CSP Plant Designs .................................................................................................... 10
Solar Multiple ...................................................................................................................................... 11
Thermal Storage Capacity ................................................................................................................... 11
Key Operational Attributes ..................................................................................................................... 12
CSP Production Modeling and Plant Valuation ....................................................................................... 12
Definition of Utility or Market Services and Other Operational Attributes Offered by CSP with Thermal Energy Storage ........................................................................................................................................ 13
Energy on Hourly and Sub‐Hourly Time Intervals ............................................................................... 14

iv
Regulation ........................................................................................................................................... 15
Spinning Reserves ............................................................................................................................... 15
Non‐Spinning Reserves ....................................................................................................................... 16
Capacity ............................................................................................................................................... 16
Frequency Response ........................................................................................................................... 17
Reactive Power and Voltage Support ................................................................................................. 17
3. Valuation of Renewable Resources – Definition of Net System Cost and Quantitative Methods ................................................................................................................................ 19
Utility Valuation and Net System Cost .................................................................................................... 20
Quantitative Methods for Economic Valuation ...................................................................................... 23
Baseline Measurements .......................................................................................................................... 24
4. Valuation of Renewable Resources – Implication of Regulatory and Market Regimes .... 27
Valuation in U.S. Markets ....................................................................................................................... 28
Valuation in Other Regions ..................................................................................................................... 29
5. Looking to the Future: Simulating Power Systems under High Renewable Scenarios ..... 32
Energy Deliveries for Alternative Renewable Resource Portfolios ......................................................... 33
Resource Adequacy ................................................................................................................................. 34
System Operations .................................................................................................................................. 36
6. Energy and Ancillary Services ......................................................................................... 38
Energy ..................................................................................................................................................... 38
Subhourly Energy Dispatch and Ramping Reserves ............................................................................ 44
Ancillary Services .................................................................................................................................... 45
Conclusions ............................................................................................................................................. 51
7. Resource Adequacy and Long‐term Reliability ................................................................ 52
Comparing Capacity Value of Incremental CSP to PV Under Current Conditions .................................. 54
Comparing Capacity Value of Incremental Solar Generation at Higher Penetrations ........................... 56
Capacity Resources with Flexible Operational Attributes ...................................................................... 61
Conclusions ............................................................................................................................................. 61
8. Integration and Curtailment Costs .................................................................................. 62
Renewable Integration Requirements .................................................................................................... 63
Integration Costs ..................................................................................................................................... 63

v
Allocation of Integration Costs ............................................................................................................... 64
Focus on Integration Requirements and Costs under California’s 33% RPS ........................................... 65
Using CSP with Thermal Energy Storage to Mitigate System Ramps ..................................................... 70
Example 1 – Reducing the Late Afternoon Net Load Ramp ................................................................ 72
Example 2 – Intermittently Cloudy Day, Large Variation in Solar Generation .................................... 73
Example 3 – Rapid Changes in Net Load Ramp Direction ................................................................... 73
Curtailment of Solar Energy .................................................................................................................... 77
Conclusions ............................................................................................................................................. 79
9. Greenhouse Gas Emissions Reductions ........................................................................... 80
Quantifying the Mitigating Impacts of Storage on Emissions ................................................................. 80
Life Cycle Emissions................................................................................................................................. 83
Conclusions ............................................................................................................................................. 83
10. Power Quality and Other Reliability Attributes ............................................................... 84
Static Voltage Control ............................................................................................................................. 85
Dynamic Voltage Control ........................................................................................................................ 85
Inertia Response ..................................................................................................................................... 85
Primary Frequency Control, or Frequency Response ............................................................................. 86
Secondary Frequency Control ................................................................................................................. 86
Visibility and Control ............................................................................................................................... 87
Conclusions ............................................................................................................................................. 87
11. The Total Benefits of CSP with Thermal Storage ............................................................. 91
Sum of economic and reliability benefits ............................................................................................... 91
12. Incorporating Market and Reliability Valuation into CSP Plant Design ............................ 94
13. Conclusions and Next Steps ............................................................................................ 96
Next Steps ............................................................................................................................................... 97
References............................................................................................................................. 98
Acknowledgments ............................................................................................................... 102
Appendix A: Calculation of Annual Solar Energy Production as a Percentage of Total Load in California 33% RPS Scenarios ............................................................................................... 103
A
ppendix B – Methodology for Calculating California ISO Integration Costs ........................ 104
vi
Acronyms
CAISO California Independent System Operator
CPUC California Public Utilities Commission
CSP Concentrating Solar Power
DNI Direct Normal Irradiance
ERCOT Electricity Reliability Council of Texas
IOU Investor‐owned utility
NERC North American Electric Reliability Corporation
NREL National Renewable Energy Laboratory
PV Photovoltaic
SM Solar Multiple
SAM System Advisor Model (NREL)

vii
Fore
s the penetration of wind and solar generation becomes a significant portion of grid power, utilities and government policy makers have begun to sponsor analyses to compare alternative renewable resource portfolios. This has resulted in ions of net system costs in order to capture the full range of costs and benefits of t renewable technologies. This report surveys the recent research literature on the ic and reliability benefits of Concentrating Solar Power (CSP) with thermal energy , especially in comparison with other solar technologies. Its objective is to ize in one report the major findings and conclusions of those analyses.
Attribu
calculatdiffereneconomstoragesummar
CSP plafluid in a
Aword
tes of CSP with Thermal Energy Storage
nts use mirrors to focus sunlight into an intense solar beam that heats a working solar receiver, which typically boils water to drive a conventional steam turbine
that produces electricity. In many ways, it is like a fossil‐fueled steam power plant, the main difference being that its fuel supply is from the sun. The inclusion of thermal energy storage with a CSP plant removes, to a great extent, interruptions to its production that result from the intermittency of the solar resource. Storage also enables its power to be shifted to periods of highest demand and aids system flexibility, which is becoming increasingly important for grid operation.
Specifically, the combination of a steam turbine backed by stored thermal energy enables the plant to provide many of the functions necessary to support the transmission of power, short‐term energy balancing, protection against system contingencies, and resource adequacy. These include:
• ancillary services such as spinning or non‐spinning power reserves that could be brought quickly onto the grid if needed, and regulation (the plant’s ability to automatically increase or decrease its power on time‐frames of seconds to account for variability in demand or supply);
• flexibility in meeting capacity needs such that, similarly to a conventional gas‐fired plant, its energy can meet resource adequacy requirements at different times of day and in response to evolving needs;
• reduced requirements for integration into the grid, which is made easier by using storage or varying its production to lessen grid ramps (the rate of increase/decrease in grid system power) and reduce operator uncertainty due to solar forecast errors; and

viii
• upport for power quality, such as reactive power support, dynamic voltage support, nd primary frequency control that is needed to prevent blackouts. sa
General Conclusions
Although utilities and regulators are beginning to calculate net system costs when valuing alternative renewable resources, a number of reviewed studies show that more comprehensive methods are needed. Each renewable technology needs detailed simulations of its operations under a range of future scenarios for the grid, including comparison with the performance of alternative renewable technologies. The studies reviewed that did this analysis came to similar conclusions on the system costs and benefits of CSP when compared to alternative solar technologies. Nearly all of the referenced studies identified further analysis needed to better understand the implications to grid operation and performance due to variable solar and wind as it reaches 33% penetration. This could result in the need for additional ancillary services, increased operational flexibility, and improved forecasting of wind and solar. CSP with storage fits these forthcoming needs.
Storage Value
Storage generally allows CSP plants to shift electricity generation to whenever it is most needed throughout the day, overnight, or the next day as determined by the utility or system operator. At low penetrations of solar power on the grid, solar correlates well with daily peak demands. As solar penetration increases, however, analyses show that the peak demand net of renewable energy then shifts to the evening hours. CSP with storage obtains the highest capacity value of any solar resource as these grid changes take place, because
eits storage capability allows for shifting energy into the periods of high st capacity need.
To make procurement decisions that include a balance of both solar PV and CSP, utilities need to see reasonable estimates of quantifiable economic benefits. In simulations of the California power system, for example, recent studies by the Lawrence Berkeley National Labs (LBNL) reviewed in this report found that the comparative value of CSP with storage increases as the amount of solar on the grid increases. If CSP with 6 hours of storage and PV with no storage were each providing 5% of the grid’s power, CSP power would have an additional value of $19/MWh (1.9¢/kWh). At grid penetrations of 10% each, CSP power would be worth an additional $35/MWh (3.5¢/kWh). The added value results from a calculation of grid integration costs and market benefits. The National Renewable Energy Laboratory (NREL), in recent simulations of part of the Colorado/Wyoming power system, found similar results to LBNL: the comparative value of CSP storage increases as the penetration of wind and solar increases, and the value of CSP power increases relative to

ix
that of PV. Another NREL study shows that a renewable energy portfolio that includes CSP with storage provides operational flexibility that may enable both increased PV penetration and a reduction in investment in fossil‐fuel generation.
Looking Ahead
Renewable energy provides clean, sustainable power from abundant U.S. resources. The technologies to generate it are constantly improving and becoming less expensive. The grid into which these new technologies must integrate will also have to change to accommodate them. That change will come about with the help of analysts who model the grid to predict how it will operate under all possible conditions using the entire portfolio of generation and non‐generation resources. Work continues on improving the computer models, making them more accurate and running more scenarios. This report is meant to provide a source for the latest information on CSP integration into the grid and quantifiable benefits. As such, it is the intention of the CSP Alliance to update this report at least once a ear to incorporate the latest studies. y
Frank (Tex) Wilkins Executive Director CSP Alliance www.cspalliance.org

x
Exe
oncentrating Solar Power (CSP) plants both with and without thermal energy storage – and possibly, hybrid fuel capability – are unique renewable resources that provide not only clean electric power, but also a range of operational capabilities that support ntinued reliability of electric power systems. Thermal energy storage allows these to store some of the solar energy captured during the daylight hours, and, with some ions among designs, shift energy production into subsequent hours overnight or the ay as needed by the utility or regional system operator. Utilizing the stored thermal to operate a conventional synchronous generator, they can also support power and provide ancillary services, including voltage support, frequency response, tion and spinning reserves, and ramping reserves – which would otherwise be ed, at least in part, by conventional fossil‐fuel generation. Finally, both by being
available during peak demand in sunlight hours and by providing the capability to shift energy to other hours, the addition of thermal energy storage to CSP plants improves their contribution to resource adequacy, or capacity, requirements, especially as solar
the coplantsvariatnext denergyqualityregulaprovid
Ccutive Summary
penetration increases.
The current interest in CSP with thermal energy storage is arising due to the dramatic penetration of renewable energy expected soon in many power systems around the world. Conventional wind and solar plants produce energy on a variable basis and have lower contributions to resource adequacy relative to nameplate capacity than fossil‐fuel generation (NERC 2009). As more investment is planned in wind and solar generation, utilities and government regulators have sought more sophisticated types of cost‐benefit analysis, incorporating scenario‐based resource planning, to compare alternative renewable resource portfolios. This has resulted in evolution towards more comprehensive calculation of net system costs on a portfolio basis, due in part to research that has clarified certain elements of value (e.g., Joskow 2010; Mills and Wiser, 2012a,b). However, in most regions surveyed, this trend has not yet captured the full, long‐term benefits of CSP with thermal energy storage, which could result in a procurement bias towards portfolios of lower cost solar projects that also have lower long‐term economic and reliability benefits.
To advance valuation of CSP technologies, this report surveys the recent research literature on the economic and reliability benefits of CSP with thermal energy storage, including consideration of system integration costs incurred by other renewable resources. As the valuation of net system costs becomes more precise, the latest generation of CSP plants

xi
comes on‐line, and the next generation CSP technology shows evidence of cost reductions,1 utilities and regulators should gain confidence that CSP with thermal energy storage is a desirable investment within a growing renewable resource portfolio when compared to other renewable energy and integration solutions, including other types of storage. However, the report does not examine trends in CSP plant costs, nor the costs of other solutions to renewable integration.
Key Categories of Utility Value and Calculation of Net System Costs When comparing CSP with thermal energy storage to alternative renewable technologies (including CSP without storage), there are several primary categories of additional benefits provided by thermal energy storage, as well as lower system integration costs when compared to other variable energy resources, as listed below:
Energy Hourly optimization of energy schedules Subhourly energy dispatch Ramping reserves
Ancillary services (for secondary frequency control)
Regulation 10minute spinning reserves Operating reserves on greater than 10 minute timeframes from synchronized generator
Power quality and other ancillary services
Voltage control Frequency response Blackstart
Capacity Generic MW shifted to meet evolving system needs Operational attributes
Integration and curtailment costs compared to solar PV and ind w
Reduced production forecast error and associated reserve requirements
Reduced curtailment due to greater dispatch flexibility without production losses
Ramp mitigation
There are also other categories of additional benefits which may arise on a system‐specific basis, such as improved long‐term reductions in greenhouse gas emissions provided by a flexible, clean resource. Generally, these benefits are converted into a common metric of total economic value per year divided by total energy output from the plant, such as $/MWh or €/MWh. The sum of these values allows for calculation of the net system cost, which is the costs minus the benefits, and can be compared to the net system costs of alternative investments to achieve the same levels of renewable energy production, operational performance and reliability (Joskow 2010; Mills and Wiser, 2012a,b).
1 Given the highly competitive state of the CSP industry, the most recent cost reductions are typically only revealed through bid submission into solicitations or bilateral negotiations.

xii
Design and Operation of CSP with Thermal Energy Storage There are several viable CSP designs used when simulating market or utility value, some of which are described in this paper. Generally, CSP technology uses reflectors to focus sunlight onto a small area to heat a working fluid. The heat thus captured can then be efficiently converted to mechanical work in a steam turbine, which can then drive a generator to produce electricity. The two prominent commercial designs for a CSP plant are parabolic troughs and power towers, with several other designs in stages of development.
The thermal energy storage systems integrated into the CSP technology consist of a collection method, a reservoir, and a storage medium, for which all the current commercial applications use molten salts. Depending on CSP plant configuration and design, the storage medium may also be the working fluid of the CSP cycle or it can be a separate loop that communicates with the working fluid through a heat exchanger. A key feature is that the thermal storage is not charged at all from the electric power system, but only from the solar field. Hence, there is no or minimal cost for charging during daily operations, but only the decision on how to utilize the stored thermal energy for maximum economic benefit, within the operational constraints of the plant.
While different CSP designs with thermal storage will have different net system costs, this report is focused on the calculation of economic and reliability benefits. For that purpose, the key operational characteristics that need to be modeled include the storage capacity, the minimum and maximum operating levels, start times and the allowable number of starts per day, ramp rates, regulating range, and the plant’s capability to shift between storing and discharging. Not all CSP plants with thermal energy storage in operation or under construction offer equal operational flexibility, but all future designs can be modified to meet system needs. Those needs can range from providing a few hours of stored energy to serve early evening loads, to adding storage until the plant is essentially “base‐loaded,” meaning that it operates at relatively stable output throughout the day.
Energy and Ancillary Services The energy and ancillary services benefits of solar thermal storage are the most straightforward to calculate, as researchers can use historical market prices or utility costs as a baseline (e.g., Sioshansi and Denholm, 2010; Madaeni et al, 2012), before analyzing the changes in benefits that may occur under future system conditions (Mills and Wiser, 2012b; Denholm and Hummon, 2012). All CSP with thermal energy storage provides utilities with the capability to shift energy production from storage to the highest value hours across the operating day, and in principle, with appropriate designs, should also be able to provide energy dispatch in real‐time operations as well as spinning reserves and regulation. As the availability of dispatchable energy and ancillary services would in part

xiii
be a function of solar insolation and storage capacity, provision of these services would also need to be forecast by the system operator for daily operations.
When calculating the economic value that can be obtained by optimally dispatching a CSP plant, the typical benchmark calculation is the average value ($/MWh) of production from a CSP plant without storage – or a solar PV plant – compared to one with storage. The value of the energy from thermal storage is calculated as the plants’s simulated additional wholesale market revenues or power system avoided costs (primarily fuel). Table ES‐1 summarizes study results on the U.S. markets, using different types of simulation models. The results from models using historical market data or low renewable energy scenarios are generally in the range of $5‐ 10/MWh for energy and ancillary services.
As additional solar generation is added to the power system, the progressive displacement of fossil‐fired generation actually leads to lower energy value for incremental solar additions without storage, whether CSP or solar PV. However, CSP with thermal storage can continue to shift energy to the highest value hours. In simulations of the California power system conducted by Mills and Wiser (2012b), the marginal energy value of an incremental parabolic trough plant with 6 hours of thermal storage declines at a low rate as solar penetration increases, but when compared to CSP plants without storage which face decreasing revenues during the daylight hours, its revenues are as much as $9/MWh higher by 10% solar energy penetration, $17/MWh by 15%, $20/MWh by 20% and $36/MWh by 30%. Denholm and Hummon (2012) find that solar thermal storage provides $16.70/MWh higher revenues than CSP without storage when modeling the Colorado‐Wyoming power system at high renewable penetration of around 34% annual energy from wind and solar. The revenue difference with solar PV in these simulations is similar, but with some differences depending on whether the PV plant has tracking or not.
Ancillary service and other operational flexibility requirements are expected to increase in power systems with increasing penetration of wind and solar (CAISO, 2011; GE Energy and Exeter Associates 2012). There is less convergence in estimates of the value of ancillary services, since these are smaller markets or system requirements, and can be fulfilled by many competing resources. However, simulations by the California ISO have shown that in California, barring introduction of new resources that provide operational flexibility, fossil generation continues to provide the bulk of ancillary services under 33% RPS in 2020 (CAISO 2011). The opportunity is there for CSP to provide these services and earn revenues (Madaeni et al., 2012; Usaola 2012). Optimizing against 2005 spinning reserve prices in California and Texas, Madaeni et al., (2012) find that sales of spinning reserves can comprise 2 – 7% of CSP plant revenues. Helman and Sioshansi used the same model with 2011 California ISO prices and found a joint added value of $8.50/MWh for energy and spin from a parabolic trough with 6 hours of thermal storage, of which most of the added value is from spinning reserves. However, using a system model, Mills and Wiser (2012b)

xiv
find a lower average value for ancillary services provided by a parabolic trough with 6 hours of storage, in the range of $1‐1.50/MWh, or 1‐2 % of plant revenues. To advance this research agenda, the CSP industry also needs to clarify the operational capabilities to provide different ancillary services of thermal storage designs (Usaola, 2012).
Table ES‐1: Energy and spinning reserve value from selected studies of CSP with thermal storage
Study Location and Date
Technology Methodology/ Metric
Baseline Solar
Renewable penetration
Added Market Value
Sioshansi and Denholm, 2010
California ISO, Dagget, CA, 2005 prices
Trough with 6 Hrs storage, SM 2.0
Plant revenue optimization against exogenous fixed market prices
Trough with no storage, SM 1.5
N/A, but assume existing renewables in 2005
$9.40/MWh [Energy]
Sioshansi and Denholm, 2010
ERCOT (Texas), western zone, 2005
Trough with 6 Hrs storage, SM 2.0
Plant revenue optimization against exogenous fixed market prices
Trough with no storage, SM 1.5
N/A, but assume existing renewables in 2010
$9.00/MWh [Energy]
Helman and Sioshansi, 2012 (unpublished)
California ISO, Dagget, CA, 2011 prices
Trough with 6 Hrs storage, SM 2.0
Plant revenue optimization against exogenous fixed market prices
Trough with no storage, SM 1.5
Existing renewables in 2011
$8.50/MWh [Energy + Spinning Reserves]
Denholm and Hummon, 2012
Colorado‐Wyoming
Trough with 6 hours of storage, SM 2.0
Production simulation, change in production costs from baseline
Trough with no storage, SM 1.3
12.4% wind, 0.8% PV
$6.6/MWh [Energy]
Denholm and Hummon, 2012
Colorado‐Wyoming
Trough with 6 hours of storage, SM 2.0
Production simulation, change in production costs from baseline
Trough with no storage, SM 1.3
25.5% wind, 8.2% PV
$13.3/MWh [Energy]
Mills and Wiser, 2012b
California Trough with 6 hours of storage, SM 2.5
Modified capacity expansion model with simplified dispatch
Single‐axis tracking PV
10% PV (no other renewable energy)
$6/MWh [Energy]; $1.2/MWh [Ancillary services]
Mills and Wiser, 2012b
California Trough with 6 hours of storage, SM 2.5
Modified capacity expansion model with simplified dispatch
Single‐axis tracking PV
15% PV (no other renewable energy)
$13/MWh [Energy]; $1/MWh [Ancillary services]
SM = Solar Multiple

xv
Capacity A primary economic benefit of solar energy is the correlation of its production with both daily peak demands (depending on the location and season) and annual peak demands. Solar’s daily production pattern thus correspondingly provides a high resource adequacy, or capacity credit.2
Different types of solar technologies obtain different capacity credits, depending on their location. Generally, for any particular location, fixed tilt solar PV obtains the lowest capacity credit because its peak output is focused in a few midday hours. Solar PV with single‐ and dual‐axis tracking gets a higher credit, because its production can be better shaped to fit the hours with the highest capacity requirements. CSP without storage obtains a similar or slightly higher capacity credit to tracking PV. Finally, CSP with thermal storage obtains the highest capacity credit of any solar resource, as a function of location and storage capacity, because its storage capability allows for shifting of additional energy
e ,into the highest valued capacity hours (Sioshansi and D nholm 2011).
The capacity value of a solar resource is measured as the avoided cost of alternative capacity, whether procured from existing or new generation. In the United States, long‐term capacity value is typically based on the avoided costs of combustion turbine generation.
As solar penetration increases, a region’s incremental capacity needs begin to shift to the evening hours (Denholm and Mehos, 2011; Mills and Wiser, 2012b). This happens because without storage, solar can only serve demand during the sunlight hours, and as long as demand growth increases capacity requirements within those hours, additional PV and CSP without storage will continue to accrue capacity value. However, when additional demand growth creates capacity needs outside the sunlight hours, conventional solar production – PV or CSP without thermal storage – face diminishing capacity value. Mills and Wiser (2012a) have summarized the findings of a number of western U.S. and Canadian studies that show the declining capacity credits available to solar PV as penetration increases, as shown in Figure ES‐1. While the methodologies used in these studies differ, there is consistency in the general finding.
A number of recent studies have examined the comparative capacity value of solar PV and CSP in high solar penetration scenarios. Mills and Wiser (2012b) have simulated this changing capacity value by solar technology type, including CSP with 6 hours of thermal energy storage.3 As shown in Figure ES‐2, the value of capacity for the plants with 6 hours o nergy) to f thermal storage ranges from $37/MWh at low penetration (5% annual solar e 2 The terms “Resource adequacy,” “capacity” or “installed capacity” are used here interchangeably. 3 For valuation purposes, Mills and Wiser use the net costs of a new CCGT in California, which is estimated at $170‐180/kW‐year.

xvi
$15/MWh at high penetration (30% solar energy). In contrast, the capacity value for non‐dispatchable solar resources may diminish to almost $0/MWh at such high penetrations. Denholm and Mehos (2011) show similar results for a model of California and neighboring states, with PV capacity value diminishing rapidly between 6 – 10% penetration.
Figure ES‐1: Survey of PV capacity credit estimates with increasing penetration levels
Source: Mills and Wiser, 2012a
A key issue for research is to resolve the differences between regional studies in the rate of change of incremental solar PV capacity value as solar penetration increases. The studies of the California power system appear to agree that major declines take place between 5 – 10% solar PV penetration by annual energy (Mills and Wiser, 2012b; Denholm and Mehos, 2011), which is within the solar production forecast under the 33% RPS.
Another forthcoming development in capacity valuation is the incorporation of operational attributes as wind and solar penetration increases (Lannoye et al., 2012). Although the designs of such “flexible capacity” requirements and markets are still nascent, they are intended to either set aside quantities of particular needed attributes or provide financial incentives for their provision. Due to the fast ramp rates on the plants, CSP with thermal energy storage, depending on the design, will at least partially qualify as flexible capacity resources.

xvii
Figure ES‐2: Marginal Capacity Value ($/MWh) by Penetration of Solar and Wind Technologies – Mills and Wiser (2012b)
05
1015202530354045
0% 2.5% 5% 10% 15% 20% 30%
$/MWh
% of Annual Energy, By Technology
50
CSP with 6 hours of storage CSP with no storage PV Wind
Source: Mills and Wiser, 2012b
Table ES‐2: Capacity value results from selected studies of CSP with thermal storage that model increasing solar penetration
Study Location and Date
Technology Methodology/ Metric
Baseline Solar
Renewable penetration
Added Capacity Value
Denholm and Hummon, 2012
Colorado‐Wyoming
Trough with 6 hours of storage, SM 2.0
Capacity factor approximation during peak hours
Single axis tracking PV
25.5% wind, 8.2% PV
$11.7 – 30.5/MWh
Mills and Wiser, 2012
California Trough with 6 hours of storage, SM 2.5
Modified capacity expansion model with simplified dispatch
Single axis tracking PV
5% PV (no other renewable energy)
$10/MWh
Mills and Wiser, 2012
California Trough with 6 hours of storage, SM 2.5
Modified capacity expansion model with simplified dispatch
Single axis tracking PV
10% PV (no other renewable energy)
$22/MWh
Mills and Wiser, 2012
California Trough with 6 hours of storage, SM 2.5
Modified capacity expansion model with simplified dispatch
Single axis tracking PV
15% PV (no other renewable energy)
$16/MWh

iii
xv
Integration and Curtailment Costs Significant penetration by wind and solar generation creates new integration requirements for existing power systems. Both wind and solar generation are variable, meaning that electric power is only produced when the fuel source is available, and have higher forecast errors than conventional generation (NERC 2009). In addition, these technologies generally cannot be actively controlled, or “dispatched,” by system operators without loss of production, often called “curtailment”.4 As a result, additional reserves are needed, as well as more substantial ramping of the available flexible resources.
The cost of wind and solar integration will vary by power system and the scenario being evaluated. When existing power systems are modeled, at low penetration, wind and, more recently, solar PV integration costs are often calculated in the range of $3‐5/MWh, while higher penetrations can reach $5‐11/MWh (U.S. DOE 2009; Milligan et al., 2009; Mills and Wiser, 2012b; Navigant et al., 2011). If further investment to improve operational flexibility is needed – whether retrofits of existing plants, construction of new generation or storage – then the associated fixed costs could increase substantially over these estimates. Other costs would result from curtailment of solar PV energy at higher penetrations due to periods of surplus solar generation, which could be avoided by dispatching CSP from thermal energy storage (Denholm and Mehos, 2011; Navigant et al., 2011)
CSP with thermal energy storage provides the capability to reduce the variability of its production, and possibly also provide services to integrate other renewable resources, particularly by mitigating system ramps. Recent studies of solar integration into power systems have shown that the major operational impacts take place in the morning and evening solar ramps. As additional solar resources are interconnected, these ramps have higher magnitude and require faster response by other resources. Figure ES‐3 shows that at 33% renewable energy, many of the top power system ramps in California, especially the late afternoon upwards ramps, will be closely correlated with solar production ramps in he morning and evening. t
4 As a general rule, utilities or regional system operators can always control plant production to preserve reliability. However, such control is greatly improved when plants offer bids for efficient dispatch, but for wind and solar PV plants, such bids are typically representation of lost contract costs or lost production incentives, which can very expensive. In contrast, CSP with thermal energy storage allows for some degree of flexible production without significant lost production.

xix
Figure ES‐3: Top 10% of upward and downward net load ramp hours in California under 33% RPS, by hour of day
Source: CAISO 33% RPS simulation data‐sets, 2011
Figure ES‐4: CSP with thermal energy storage support for ramp mitigation, illustrative example from California at 33% RPS
Source: CAISO 33% RPS simulation data‐sets, 2011, BrightSource assumptions about hourly net load.

xx
Depending on the number of hours of storage, at the very least, a CSP plant should incur greatly reduced or even zero integration costs on a plant level, giving it an average avoided integration cost in the ranges discussed above. Moreover, the energy from thermal storage could be used to mitigate cumulative system impacts – that is, integration impacts not tied to individual plant variability and forecast error but to the cumulative impact on power system operations – in the highest integration cost hours. For example, while formal studies of CSP plants with thermal storage are not yet complete, BrightSource has conducted some simple dispatch simulations with the public data provided in California to show how 2500 MW of CSP with different capacities of thermal energy storage could mitigate system ramps in 33% RPS scenarios. Figure ES‐4 illustrates the progressive mitigation of the daily system ramps with an additional 2, 4 and 6 hours of thermal storage.
Greenhouse Gas Emissions Reductions A primary objective of renewable energy policies is to reduce greenhouse gas emissions, as well as other air pollutants that can be jointly reduced. For any particular power system, different renewable technologies, and portfolios of those technologies, are likely to result in different patterns of emissions reductions. These patterns will depend on many factors, including the fossil generation mix and how it is operated when integrating renewables, as well as load profiles and the forecast daily renewable profiles. Clearly, solar production without storage will primarily back down fossil generation during the sunlight hours. As solar penetration increases, in some power systems, there may be lower marginal emissions reductions for incremental solar resources, because higher emissions generation has been displaced during those daylight hours (Mills and Wiser 2012b). For example, this would appear to be the case for California, where in‐state solar generation is primarily displacing natural gas‐fired generation. However, in other regions, it may be coal‐fired generation that is displaced last, thus offering an increase in marginal emissions reductions at higher solar penetration (if government policy includes carbon pricing, the economic merit order of coal and natural gas fired generation, which usually favors coal, may reverse) (Denholm et al., 2008) .
Whether CSP with thermal energy storage, which tends to shift energy away from the daylight hours, can provide higher marginal emissions reductions than solar resources without storage thus requires region‐specific analysis. A flexible solar resource should be better able to shift production to the hours that provide the highest greenhouse gas emissions reductions. Initial research by Mills and Wiser (2012b) does indeed suggest that at higher solar penetrations in California, CSP with thermal storage provides a higher marginal emissions reduction than other solar technologies. However, they primarily attribute this finding to the more efficient operations of gas‐fired generation when balancing CSP with thermal storage than other solar resources. The simulations of system operations at 33% RPS by the California ISO (2011) suggest that in California, in many

xxi
seasons the higher aggregate hourly emissions will shift to evening hours at higher solar penetrations. Hence, a solar resource that can shift production to those hours may allow for improved emissions reductions. Further work is needed to clarify these results and provide quantitative estimates of emissions reductions.
Power Quality and Other Reliability Services CSP with thermal energy storage provides a range of power quality and other ancillary services that provide economic value, but which may be difficult to quantify or which need additional analysis. When operating a synchronous generator, CSP with or without storage inherently meets power quality standards that could otherwise, if substituted by solar PV, require investment in more capable inverters, other system controls or transmission equipment, as well as lost production. These services include reactive power support, dynamic voltage support, voltage control, inertia response, primary frequency control, frequency and voltage ride‐through, small signal stability damping, fault currents, and the ability to mitigate Sub‐Synchronous Resonance (SSR). With the addition of thermal storage, there is the capability to provide these capabilities over a larger number of hours, given that with a full storage charge, the plant can operate at minimum operating limits from sunset to some point in the next operating day. In the near future, some of these services may be valued more explicitly through markets. For example, the California ISO has recently indicated that a frequency responsive reserve product may be required at higher renewable penetration, which would likely increase commitment of additional thermal generation (CAISO/GE 2011).
Incorporating Economic and Reliability Valuation into CSP Plant Design Historically, the types of economic and reliability valuation reviewed in this report were not direct inputs into the design processes of CSP firms. However, recent studies have shown how both plant‐level and system level studies can guide alignment between CSP plant design and evolving system needs. For example, Madaeni et al., (2012) conduct valuation of a parabolic trough plant by varying the solar multiple and number of hours of storage, and then assess which design options could allow the plant to break‐even using historical market prices (and using estimates of CSP capital costs). However, they do not consider other factors, such as the integration of renewables onto the power system, which could affect the long‐term value of storage capacity. Mills and Wiser (2012b) and Denholm and Hummon (2012) dispatch CSP with thermal storage in power system models that do capture a range of value components, including integration of other renewables, but only evaluate 0 and 6 hours of storage. Hence, further research is needed into the incorporation of valuation in CSP plant design. The CSP industry also needs to engage utilities and regional system operators in a more detailed discussion about plant attributes and potential value.

xxii
CSP with Thermal Storage and Solar PV in Renewable Energy Portfolios Over the past few years, declines in the price of solar PV have led to conversion of several large‐scale CSP projects to PV. At the same time, significant new CSP projects are coming on‐line in the western United States in 2013‐16 and elsewhere, and those with thermal storage will demonstrate the capability for solar energy that also provides utilities and system operators with substantial operational flexibility. In the interim, the studies cited in this paper have clarified the short‐term and long‐term value of CSP with thermal energy storage, allowing for greater confidence in the range of quantifiable and qualitative benefits, particularly as solar penetrations increase.
Moreover, several studies have pointed to the prospects for increasing solar PV curtailment as penetrations increase, due to physical constraints on the power system (Denholm and Mehos, 2011; Mills and Wiser, 2012b; Navigant et al., 2011). Denholm and Mehos (2011) have further concluded that a solar portfolio which includes both PV and CSP with thermal energy storage would support less curtailment of aggregate solar production. Mills and Wiser (2012b), while not modeling solar portfolios that mix technologies, corroborate most of these findings. These results suggest the value of a diverse solar portfolio, which includes both PV and CSP as complementary solar resources. Further analysis is needed to refine the appropriate resource mix.
Conclusions Even as solar PV costs have declined, CSP with thermal storage offers significant quantifiable economic and reliability benefits in regions of the world with sufficient direct normal irradiation, particularly at higher solar penetrations – including operational benefits that have not been sufficiently assessed, such as the capability to mitigate system ramps. The result is that CSP with storage needs to be assessed comprehensively on a net system cost basis. The calculation of net system costs has been aided by a number of recent studies by the U.S. national laboratories (e.g., Sioshansi and Denholm, 2010; Madaeni et al., 2012; Denholm and Hummon, 2012; Mills and Wiser, 2012b).
At low penetrations of renewables, for power systems that have certain demand characteristics, such as load peaks in the evening hours during winter and spring months, thermal energy storage adds energy and ancillary service benefits to a CSP plant, possibly in the range of $5‐10/MWh, as well as higher capacity value, when compared to inflexible solar resources (Madaeni et al., 2012).
As solar penetration increases and displaces fossil‐fuel generation, the energy value of solar generation during the sunlight hours declines, while the capability of CSP with thermal storage to shift energy allows it obtain $13‐25/MWh in higher energy value (Denholm and Hummon, 2012; Mills and Wiser, 2012b). For similar reasons, studies predict a significant decline in capacity value of incremental solar PV and CSP without

xxiii
storage as penetration increases. While U.S. studies appear to agree that solar PV capacity value declines sharply in the range of 5 – 10 % penetration by energy, there are differences in the rate of change among studies of particular regions that need to be resolved. CSP with thermal energy storage has a higher retained capacity value in the high penetration scenarios, in the range of $10‐20/MWh, and possibly higher (Denholm and Hummon, 2012; Mills and Wiser, 2012b).
The sum of these economic benefits is significant at higher solar penetrations (Denholm and Mehos, 2011; Mills and Wiser, 2012b) For example, Mills and Wiser calculate that in California, the benefits of CSP with 6 hours of storage exceed the benefits of solar PV by $19/MWh at 5% penetration of solar energy, and exceed the benefits by $35/MWh at 10% penetration – roughly the penetration levels currently being planned towards in California under the 33% RPS. Similar results have been shown by Denholm and Hummon (2012), with additional studies forthcoming.
Simulation studies of CSP with thermal storage to date (e.g., Mills and Wiser, 2012b) have not determined a high value for avoided integration costs, and accurate analysis of these costs is difficult (Milligan et al., 2011). But studies of integration costs, and other estimates used by utilities, have suggested values for wind and solar integration costs in the range of $5‐10/MWh for higher penetration scenarios (e.g., surveys in DOE 2012, and Mills and Wiser, 2012a; Navigant et al., 2011). Calculations done by BrightSource Energy based on California ISO simulation data (CAISO 2011) suggest that the avoided costs of integration in the late afternoon and early evening hours may be significantly higher than in other hours of the day, providing greater value to resources that can mitigate the system ramps in those hours. Curtailment of solar PV energy due to constraints in power system operations could also increase at higher solar penetrations, and there is the potential for CSP with thermal energy storage to reduce overall solar energy curtailment (Denholm and Mehos, 2011). Studies suggest that these avoided integration and curtailment costs should be considered
able technologies. when comparing CSP with thermal energy storage to other renew
This survey of methods and results leads to two key conclusions:
First, there is a reasonable degree of convergence in the results of quantitative studies of the system costs and benefits of CSP with thermal energy storage, and alternative solar technologies, under a range of power system conditions.
This result suggests that utilities and regulators should give credence to the basic findings of the studies surveyed in this report, and aim to resolve remaining differences.

xxiv
Second, utilities and regulators around the world are beginning to calculate net system costs when valuing alternative renewable resources, but more
scenario a .comprehensive, based methods re needed
The early phases of renewable procurement around the world have tended to focus primarily on rapid deployment of available technologies at the lowest levelized cost of energy (LCOE), and less so on planning towards long‐term, reliable clean power systems. There is wide recognition that LCOE is an incomplete and misleading metric for comparison of alternative renewable technologies (e.g., Joskow 2010). The study findings reviewed here demonstrate that a more comprehensive approach to resource valuation is needed for a cost‐benefit comparison of CSP with thermal energy storage with other renewable technologies and integration solutions. These studies also highlight the need for simulations of changing power system conditions to guide investment decisions. Without conducting such analysis, CSP with thermal energy storage could be significantly under‐valued in renewable procurement.

1
oncentrating Solar Power (CSP) plants both with and without thermal energy storage – and possibly hybrid fuel capability – are unique renewable resources that provide not only clean electric power, but also a range of operational capabilities that support ntinued reliability of electric power systems. Thermal energy storage allows these to store some of the solar energy captured during the daylight hours, and, with some ions among designs, shift energy production into subsequent hours overnight or the ay as needed by the utility or regional system operator. Utilizing the stored thermal to operate a conventional synchronous generator, they can also provide power and ancillary services, including voltage support, frequency response, regulation inning reserves, and ramping reserves – which would otherwise be provided, at least t, by conventional fossil‐fuel generation. Finally, both by being available during peak
demand in sunlight hours and by providing the capability to shift energy to other hours, the addition of thermal energy storage to CSP plants improves their contribution to resource
1
. Introduction
the coplantsvariatnext denergyqualityand spin par
C
adequacy, or capacity, requirements, especially as solar penetration increases.
With the first generation of new large‐scale CSP plants coming into operation in the U.S. and Spain,5 the CSP industry is working to further reduce costs in its next generation plants as well as to work with researchers, regulators and utilities to quantify and enhance the economic benefits to buyers of thermal energy storage. As understanding of these benefits is improved through detailed analysis of actual power systems, there has been continued support for the development of operationally flexible CSP plants.
This report surveys recent research into the economic and reliability benefits of CSP with thermal energy storage, as well as other relevant results from studies of renewable energy valuation and integration. Economic benefits refers here primarily to avoided fixed and variable costs of delivering electric power, whether through competitive power markets or from utility investments, when utilizing CSP with thermal storage to meet renewable energy goals – and especially when determining the composition of solar resource portfolios. Power systems are operated to meet reliability standards, some of which may be translated into market products, but others of which are simply operating requirements whose costs are bundled into overall infrastructure and operating costs. The paper notes 5 Major new CSP plants in California and the southwestern United States under construction with on‐lines dates in 2013 or soon after, include the Abengoa Mojave Solar 250 MW parabolic trough; the Abengoa Solana 250 MW parabolic trough with 6 hours of storage; the BrightSource/NRG/Google Ivanpah 400 MW power tower; the NextEra Genesis 250 MW parabolic trough; and the Solar Reserve Crescent Dunes 110 MW power tower with molten salt receiver. For further discussion of these designs, see Section 2.

2
particular reliability services provided by CSP plants that differ from wind and solar PV plants and could result in lower net system costs of a portfolio with the CSP plants, although quantification of benefits provided by specific projects may be difficult. There is also some discussion of potential additional avoided greenhouse gas emissions due to dispatch of solar energy, which may have additional economic or environmental benefits; carbon taxes or allowances would allow such benefits to be reflected in electric power market prices. The paper also aims to provide insight into the methodologies of these technical studies and how to interpret their results.
Although the report is conceived as a contribution to improved cost‐benefit analysis of CSP, it does not examine trends in CSP plant costs, nor the costs of other solutions to renewable integration, whether storage or demand response. There are surveys of estimated CSP costs available,6 and buyers obviously know competing bid costs for particular solar projects. The case for continued investment in CSP with thermal storage rests on plant costs being reduced sufficiently to remain competitive on a “net system cost” basis with other renewable energy and integration solutions, including other types of storage.
To reach the widest audience, basic concepts about electric power systems and markets are introduced in each section, along with detailed discussion of technical analysis. The term “market benefit” is used here to refer to valuation against wholesale markets or utility procurement processes for electric power products and services – most notably energy, ancillary services, and capacity. The paper also identifies regulatory and policy reforms and additional research needs to support the appropriate economic valuation of CSP technologies.
The Design of Clean Power Systems Historically, questions about power system reliability and operations were considered secondary to the deployment of the least cost renewable technologies to meet renewable policy goals, in large part because renewable resources represented a small percentage of total power system generating capacity. However, renewable resources are no longer marginal contributors to electric power production in some regions. For example, in California and Spain, both regions with substantial solar potential, renewable energy accounts for 15‐20% of annual retail electricity sales7 and California policy aims to increase that share to 33% by 2020. Other regions have deployed wind generation on a large‐scale, including Denmark and Ireland. Many other U.S. states, some countries and
6 For recent surveys of CSP costs, see IEA (2010) and IRENA (2012). However, CSP companies generally do not publicly release cost estimates, and so these studies may not correspond to bid costs. 7 The California Public Utilities Commission (CPUC) publishes quarterly reports on progress towards the State RPS here: http://www.cpuc.ca.gov/PUC/energy/Renewables/index.htm.

3
international institutions have ambitious annual renewable energy targets, some ranging from 20‐25% over the next decade or so.
As penetration of wind and solar energy increases, and scenarios with further additions are being evaluated, other considerations are becoming prominent, such as the impact on the power system of the greater variability, production forecast errors, and minimal controllability and responsiveness to economic dispatch, of many renewable energy facilities (NERC 2009). These considerations are leading to the second step now being evaluated in numerous studies: how to provide cost‐effectively the operational and reliability requirements that will be affected by wind and solar interconnection and integration. Historically, the power system relies on the control (or “dispatch”) of generator output to meet fluctuations of demand on various time‐scales – seconds, minutes, hours – as well as to ensure reliability during annual peak loads and provide reserves set aside in the event of possible system failures. The power system operator generally does not have economic dispatch control over conventional wind and solar plants,8 except in the event of system emergencies or otherwise to preserve reliability, meaning that other generation must be utilized to balance them. Moreover, many small scale power plants – especially distributed solar PV – are not currently controllable by the system operator and will require further investments in achieving such controls (CAISO/KEMA, 2012).
The operational and reliability solutions for high renewable energy power systems now being contemplated are varied, including more flexible utilization of hydro, coal and natural gas generation, more flexible demand response, and various types of electrical storage. CSP with thermal energy storage has the capability to reduce the operational impact of the aggregate renewable portfolio, while simultaneously providing several advantages over other solutions in that it offers the most cost‐effective bulk storage solution to date, and can potentially be hybridized with other fuels – either “brown” or “green”9 – to complement the storage and further improve reliability. Moreover, all stored thermal energy is gathered from the solar field, and is therefore eligible as certified renewable energy.
Value of CSP with Thermal Storage Competition between and among alternative renewable technologies has increased substantially over the past few years, due to downward cost pressures within each technology subsector and trends in policy support and financial incentives. For CSP with
8 Even where there is dispatch control, these plants can typically only reduce production, whereas a fully dispatchable plant can also be positioned to increase production. 9 The hybridization of thermal power plants with solar and brown fuels, gas or coal, is well researched. In addition, the plants can be hybridized with green fuels, such as biomass. There are a number of hybrid CSP‐biomass projects under development in Spain and North Africa.

4
thermal energy storage, these developments have made appropriate valuation all the more critical. When focused only on levelized cost of energy (LCOE), 10 conventional comparisons of CSP with thermal storage to other renewable technologies are highly misleading (Joskow 2010). Rather, the comparative costs of CSP with thermal energy storage are shown to be much more competitive when the comprehensive net system costs11 of the CSP plant are compared to wind or PV, including its long‐term wholesale market and reliability value. In studies of future clean power systems, a CSP plant with thermal storage can have significantly higher economic benefits than incremental wind or PV, especially at higher penetrations of those technologies (e.g., Mills and Wiser, 2012b). In addition, there is sufficient convergence in the results of CSP valuation studies that a reasonable range of economic value can be determined, and a research agenda formulated to refine and extend the estimates.
The net system cost of dispatchable CSP plants with thermal storage was not an initial focus of utility renewable procurement. The early literature on CSP did mention its reliability and load‐following capability, and several of the parabolic trough plants constructed in the 1980s had auxiliary gas capability as well as some thermal storage, which was later dismantled. However, the recent utility‐scale CSP plants with thermal storage built in Spain did not have economic incentives to participate in power markets or system operations, but instead were designed to provide a steady production of power across the hours of operations (Usaola 2012). So there has been no working commercial example of a dispatchable CSP plant operating purely from thermal storage.
This perception of the value of thermal storage is changing due both to detailed technical studies (e.g., Madaeni et al., 2012; Mills and Wiser, 2012b) and new projects being approved for dispatchable CSP. In the United States, where the first new utility‐scale CSP both with and without storage will come on‐line in 2013‐14, there is increasing interest on the part of policymakers and utilities to develop technologies that can provide operational flexibility and ensure long‐term reliability without increasing emissions. Valuation methods are also changing to better capture these benefits, with LCOE being extended to consider some, but not all, components of net system costs, as shown in a number of papers (Joskow 2010; Mills and Wiser, 2012a). These concepts are introduced in the next sections.
10 The levelized cost of energy (LCOE) is a detailed calculation of the capital and operating costs of a project divided by its forecast energy production. 11 Net system cost is essentially the cost minus the benefits of a renewable project, where the benefits include any market products and operational attributes that can be quantitatively or qualitatively evaluated. Section 3 provides further definition.

5
Report Overview This report summarizes some of the recent findings on the value of CSP with and without thermal storage. Some of the first U.S. studies using detailed simulations to help characterize both the operational need and the potential value for CSP with thermal storage have been conducted by the U.S. national laboratories, including the National Renewable Energy Laboratory (NREL) and the Lawrence Berkeley National Lab (LBNL).12 In addition, the paper reviews some other studies in California and other U.S. states and countries that provide other indications of potential value in different renewable generation scenarios.
The remainder of this report is organized as follows, with the intention that readers can skip sections with familiar material. Sections 2 – 5 provide background on CSP technology, valuation methods and some of the challenges in simulating high penetration renewable scenarios. Sections 6 – 12 summarize the results of recent studies on valuation of economic and reliability benefits. Section 13 concludes.
Section 2 Survey of the technology and engineering aspects of CSP, with an emphasis on thermal energy storage
CSP with and Definition of market and reliability services potentially provided by without thermal energy storage
Section 3 Valuation of renewable resources ‐ survey of quantitative methods
Section 4 Valuation of renewable resources – implication of alternative regulatory and market regimes
Section 5 Characteristics of power systems under high renewable penetration (with implications for CSP with thermal energy storage)
Section 6 Energy and ancillary service valuation and initial study results
Section 7 Capacity valuation methods and initial study results
Section 8 Integration costs of variable generation of wind and solar technologies How some or all of those costs can be avoided with CSP with thermal energy storage
Section 9 Opportunities for more efficient reduction in greenhouse gas emissions using dispatchable CSP, compared to non‐dispatchable solar power
12 See, e.g., Denholm, Madaeni and Sioshansi (2011); Madaeni, Sioshansi, and Denholm (2011); Denholm and Mehos (2011); Mills and Wiser (2012a,b).

6
Section 10 Evaluation of power quality and other reliability services that are difficult to quantify through economic models
Section 11 Summary of the total economic and reliability value of CSP with thermal energy storage, based on current studies
Section 12 Incorporating economic and reliability valuation into the design of CSP plants with thermal energy storage
Section 13 Conclusions and next steps for research
In addition, the report includes a list of references and some appendices with additional explanation of some findings. Finally, for ease of reading, the report minimizes the use of acronyms, including the common acronym of “TES” to represent thermal energy storage. All acronyms used are included in the Acronym section.

7
2
SP technology uses reflectors to focus sunlight onto a small area to heat a working fluid. The heat thus captured can then be efficiently converted to nical work in a turbine which can then drive a tor to produce electricity. Because heat can be more efficiently than electricity, CSP technology akes an excellent foundation for a thermal energy e system that can support plant operations ing to market and power system needs rather than
. Design and Operational Attributes of CSP with Thermal Energy Storage
mechagenerastoredalso mstoragaccordthe im
C
mediate availability of sunlight.
This section first briefly reviews the basic design of CSP plants with thermal energy storage and then defines the set of operational and reliability attributes that are discussed in subsequent sections.
Background on CSP Plant Design and Operations All CSP plants focus sunlight to heat a working fluid, which captures the heat of sunlight and ultimately transfers its heat to a heat engine that can convert the heat into mechanical energy. The working fluid is heated by pumping it through a solar receiver, upon which sunlight is focused.
Table 1 summarizes the four CSP technology categories. In trough style plants, the receiver is a tube that runs along the focus of a parabolic trough of mirrors. All sunlight that hits the trough directly is focused onto the receiver tube. Coatings on the receiver tube maximize absorption of this energy and in some cases, a glass envelope around the tube provides some insulation, thus minimizing the loss of captured heat back to the ambient atmosphere. A compact linear Fresnel reflector (CLFR) system is similar to a trough, except that an array of long flat mirrors on single‐axis trackers focus the sunlight onto a receiver rather than parabolic mirrors. In power‐tower machines, an array of flat mirrors on two‐axis tracking mounts reflect sunlight onto a receiver which has
CSP with thermal energy
storage can provide the
same operational attributes
as a fossilfueled thermal
power plant, but subject to
availability of the solar
insolation. When operated
from thermal storage, CSP
plants are actually more
flexible than many existing
coal and gas plants, with
greater capability to utilize
the full operating range of
the turbine and fast ramp
rates. For utilities and
power markets, these plants
can offer dispatchable
energy and ancillary
services as well as the
flexibility to meet changing
capacity requirements and
wind and solar penetration
increases.

8
been mounted on a tall tower near the center of the mirror field. The design of the receiver varies, but in all cases, its purpose is the same: to absorb solar flux and transfer the heat to the working fluid. Temperatures between 400‐ 800° C are common.
Table 1: The four CSP technology families
Receiver Type
Focus Type Line Focus Collectors track the sun along a single axis and focus irradiance on a linear receiver. This makes tracking the sun simpler.
Point focus Collectors track the sun along two axes and focus irradiance at a single point receiver. This allows for higher temperatures.
Fixed Fixed receivers are stationary
devices that remain independent of the plant’s focusing device. This eases
ected the transport of the collheat to the power block.
Linear Fresnel Reflectors
Towers
Mobile
Mobile receivers move together with the focusing device. In both line focus and point focus designs, mobile Receivers collect more energy.
Parabolic Troughs
Parabolic Dishes
Source: IEA (2010), pg. 11.
Once the working fluid is heated, the heat must be converted to mechanical motion to make electricity. If the working fluid is water (now steam) and operation without storage is desired, the steam can be sent directly to a turbine where it is converted into rotary motion to turn a generator. The steam exiting the turbine is then cooled in a condenser and sent back to the receiver to be reheated in a continuous cycle.
In some systems however, the heat collection fluid is not water, but another substance such as high temperature fluid (HTF, essentially, oil) or molten salts (usually a mixture of KNO3 and NaNO3 salts in their molten state.) In this case, the primary working fluid must first pass through a heat exchanger through which a secondary working fluid, water is also passed. The heat is transferred from the primary fluid to the water, thus creating steam to drive the turbine. The need for thermal energy transfer between the primary working fluid and a secondary fluid, water, introduces an inefficiency, as there are losses in this transfer, but it also enables energy storage, since the heated primary working fluid can be stored for later use rather than used to make steam immediately.
CSP plants that use water/steam as their primary working fluid can also store energy for later production. They do so by making use of a heat exchanger twice. First, they pass heat from the directly‐generate steam to a storage medium, which is then stored. Later, the

9
process can be reversed, using the heat exchanger to pass heat from the storage medium back to water, which generates steam to produce power. In this case, energy produced through the storage goes through two heat exchanges rather than one: first, from steam to storage medium, later from storage medium to steam again. Thus, this type of system experiences a heat conversion loss twice when operating from storage. However, when operating in non‐storage direct mode, there are no heat exchanges, and thus no extra losses.
To date, CSP plants with thermal storage have been designed to offer different quantities of stored energy. The emphasis has been less on operational flexibility than on increasing production of solar energy at a particular plant (or “capacity factor”). This is because each plant has been designed to meet particular regulatory or utility requirements, and only recently have detailed studies about the operation of power systems stimulated the growing interest in using CSP with thermal storage to provide “dispatchable” solar energy (e.g., Denholm and Sioshansi, 2010; Denholm and Mehos, 2011).
Types of CSP Power Plants and Implications for Storage and Dispatch Flexibility The different types of CSP with thermal energy storage systems are each at different phases of technology development and demonstration, and each has their own set of costs and benefits, with implications for their operational constraints. It is outside the scope of this paper to examine all the technical and economic tradeoffs associated with these options and other design decisions necessary to assemble an entire working system. However, a short discussion of storage media options is worthwhile.
In general, a thermal energy storage system includes a collection method, a reservoir, and a storage medium. Depending on CSP plant configuration and design, the storage medium may also be the working fluid of the CSP cycle (as described above) or it can be a separate loop that communicates with the working fluid through a heat exchanger. This medium is heated (directly or indirectly) by sunlight and held in reserve until some later time, when it is used to generate steam to drive a turbine for electricity production.13 The choice of medium is very important, since the mechanical, bulk and thermal properties of the medium determine the operational characteristics, and therefore the overall cycle
13 The amount of energy that can be transferred by a storage medium can be approximated by these formulas:
; , where Q is energy, m is mass, Cp is specific heat of the storage medium, and Δt is the temperature differential that the storage material goes through between its “cold” state (tl) and its “hot” state (th). Cp is a quality of the material itself. Thus, if one wants to store more heat, the amount of storage medium can be increased (m), a storage material with a higher specific heat can be selected, or the temperature delta for storage can be increased. However, there are tradeoffs. For example, it may not be possible to increase th because the storage material degrades or begins to become reactive with the plant. Similarly, it may not be possible to reduce tl because the storage material would turn to solid.

10
efficiencies. The ideal medium is inexpensive, extremely stable through a large temperature range, non‐reactive with piping and turbine blades, environmentally benign, has a high specific heat (ability to store heat per unit of mass), has a high heat density (heat per unit of volume), and is easy and safe to handle and pump. Additionally, it is convenient if the material does not experience a phase change over a large temperature range which could complicate handling – though in certain circumstances a phase change can theoretically be exploited to allow more energy to be stored within a temperature range.
Steam was an early storage medium and is still used in some plants. For example, the PS10 plant in Seville, Spain has a steam accumulator. Unfortunately, it is difficult to store large quantities of energy with steam cost‐efficiently. However, an advantage of steam is that it can drive a turbine directly, and therefore avoids losses associated with heat exchangers.
Later designs used special oils or other heat transfer fluids (HTF) as a heat storage and transfer medium. For example, the original parabolic trough plants built in Southern California by Luz and many other trough facilities use Therminol VP (or Dowtherm A)14, a special oil formulated for this purpose. An advantage of HTF over steam is that, although it does exhibit relatively high vapor pressures at high temperatures, it does not require the high pressures and volumes associated with steam accumulators. However, oil has temperature limits before it begins to coke and otherwise chemically decompose. This limits the rate of energy transfer that the oil can provide, thus requiring higher flow rates and greater volumes (both of which have limitations) or limiting the heat capacity of the system overall.
Several existing and planned CSP plants use molten salt as a heat transfer and storage medium. The salts are typically a mixture of nitrate salts designed to be close to eutectic point (lowest melting point). The salts are stable up to extremely high temperatures, and therefore can support relatively efficient steam cycles. A requirement of molten salt is that the temperature must be maintained to prevent solidification. This requires sufficient insulation on the piping and tanks, and potentially supplemental heating at night.
Experimentation continues with new heat storage media. A material under consideration recently is molten glass, which can operate at even higher temperatures than salts, but of course, this requires specific temperature and viscosity requirements compatible with molten glass. Other research includes granular solid mixtures of materials such as granular carbon, and molten salts exhibiting a low solidification temperature (~100C).
Assessing Different CSP Plant Designs The commercialization of CSP with thermal energy storage is currently focused on three d CSP design, esigns using molten salts. The parabolic trough design is the most established 14 A eutectic mixture of biphenyl‐diphenyl oxide still used in some plants as a storage medium.

11
and a plant is under construction in Arizona with 250 MW net capacity and 6 hours of storage. Power towers, initially demonstrated at smaller scales of 20‐50 MW, are now being constructed and designed in the 100‐200 MW individual tower size (and possibly larger). Power towers with molten salt receivers are under construction at 150 MW capacity and up to 8‐10 hours of storage. Power towers with indirect heating of the molten salts are also being designed: a 200‐250 MW power tower design with a steam boiler and 2‐3 hours of thermal storage, has been advanced in California. This design also allows for direct non‐storage operation without any use of the heat exchanger.
Solar Multiple The solar multiple is the ratio of the actual size of a CSP plant’s solar field compared to the field size needed to feed the turbine at design capacity when solar irradiance is at its maximum for that location (typically about 1 kW/m2). A plant with a solar multiple of 1.0 would only be able to produce its nominal rated output at peak hours. Higher multiples allow the plant to maintain full output even when solar input is less than 100%, thus earning a better capacity value and realizing better overall utilization of the power block. Plants without storage have an optimal solar multiple of roughly 1.1 to about 1.5 (up to 2.0 for LFR), depending primarily on the amount of sunlight the plant receives and its variation through the day. Plants with large storage capacities may have solar multiples of up to 3 to 5 so that they have sufficient energy gathering capability to operate the plant at full output and charge the storage system in a typical solar day. As discussed below, studies of market and operational benefits that use explicit models of CSP plant design, can examine the value of alternative solar multiples.
Thermal Storage Capacity The thermal storage capacity of a plant represents the total amount of energy that can be stored. It is technically expressed in terms of MWh‐thermal (MWh‐th), or MWh‐energy (MWh‐e) if adjusted to reflect the efficiency of conversion from thermal to electric energy. However, thermal capacity is often presented in terms of time – the amount of time that the plant could operate from storage at its nominal capacity. For example, a 200 MW plant with “two hours” of storage has 400 MWh of storage capability. CSP projects in operation or under construction include storage capacity that is sized from a few hours of storage, intended primarily to serve early evening loads, to the Spanish Gemasolar plant that is essentially “base‐loaded” in the summer months, meaning that it operates at relatively stable output throughout the day.
Several of the studies presented below (e.g., Sioshansi and Denholm, 2010; Mills and Wiser, 2012b; Denholm and Hummon, 2012) model a parabolic trough plant with 6 hours of thermal storage capacity. While there is one such plant under construction in the United States, the use of 6 hours in modeling studies is primarily a convention and not necessarily the result of optimal design. Other studies, such as Madaeni et al., (2012) model a range of

12
storage capacity, and solar multiple, design parameters. These types of studies shows that determining the optimal storage design for a plant is a complex analysis, requiring not only an understanding of the costs of the storage tanks and medium, but also of the extra solar multiple required to charge the system sufficiently, and perhaps most importantly, the value of energy produced during non‐solar periods. The literature needs additional such valuation studies of CSP design options, including for power towers, that provide both buyers and sellers with additional perspective on CSP portfolio development.
Key Operational Attributes As can be gathered from the descriptions above, CSP with storage actually describes a variety of plant types, all of which have their own cost‐benefit estimates. However, for purposes of market or utility benefit valuation – which is measured on the basis of capability to shift energy and provide ancillary services – the design of the plant matters less than its operational characteristics:
the minimum and maximum operating levels of the power block, the storage capacity, measured in MWh‐energy or MWh‐thermal (and sometimes converted into hours at maximum operations),
start times (in different states of the system), measured in minutes, and the allowable number of starts per day,
heat rate of the power block, including any variations over the operating range under different weather conditions,
ramp rates, measured in MW/min, and including any variations over the operating range of the power block,
regulating range (as defined below), measured in MW, and regulating ramp rate, the plant’s capability to shift between storing and discharging under system operator instructions, and
any other relevant characteristics.
CSP Production Modeling and Plant Valuation In order to properly evaluate a CSP plant, analysts must be able to predict its performance. This is a complex task and a wide variety of tools are used to enable it. Preliminary analyses are often performed using simple thermodynamic models or publicly available tools such as NREL’s System Advisor Model (SAM), which was used in Madaeni, et al. (2012).15 SAM uses detailed models of the physical characteristics of CSP power plants and their sub‐components along with detailed weather data in order to produce output profiles for the plant. The models in SAM have been reviewed publicly and many are econometrically fit to the performance of real existing CSP plants.
15 The SAM model is available at https://sam.nrel.gov/.

13
At more advanced stages of plant design, engineers will typically use a detailed engineering model that reflects their specific design. Depending on the model, it may be able to predict not only energy output, but also dynamic plant variables such as ramp rates, startup times and other state‐changing times, etc.
The weather input to such models is of critical importance. CSP plants are sensitive not only to direct normal irradiance (DNI) but also ambient temperature, wind speed, humidity, and a host of other weather phenomena. NREL and NOAA provide “typical meteorological year” or TMY data for many cities around the US and world.16 This data does not represent any particular year’s observations but is instead synthesized from many years’ observations to represent a “typical” year. Such data is a good starting point, but for robust economic analysis of a plant, highly local data – ideally obtained over several years from a weather station on the site of interest – is desired. Such data is generally not available and by definition requires years to collect, so engineers and project developers resort to other methods, such as extrapolating from nearby weather stations or using satellite data or some combination thereof.
Hence, understanding the output capability of a CSP plant with thermal energy storage will be a somewhat more complex task than doing so for either, on the one hand, a variable energy resource, or on the other, a fully dispatchable plant. However, the actual resulting capability can be much closer to that of the dispatchable plant, as a function of the storage capability of the machine.
Definition of Utility or Market Services and Other Operational Attributes Offered by CSP with Thermal Energy Storage Given this background on partially dispatchable CSP resources, this section turns to some brief definitions of the market and reliability products or services. Due to their designs as thermal power plants, and operational flexibility, CSP plants with thermal energy storage can be designed to provide essentially any current market product or operational attribute that utilities or system operators need for reliable system operations, with one or two possible exceptions as discussed below. Market services include Energy delivered to the grid at a particular location and time – both on fixed hourly schedules and on dispatch within the hour – operating reserves, and capacity to meet Resource Adequacy requirements. The plants can also provide other types of operational needs, including reactive power and voltage support, and provision of frequency response, that are not currently procured as separate wholesale market services but may be in the future (GE/CAISO 2011).
16 See http://rredc.nrel.gov/solar/old_data/nsrdb/1991‐2005/tmy3/.

14
In the remainder of this section, the terminology for U.S. market products predominates, but there are typically relatively direct analogues between market products in different countries. For example, Table 2 provides comparison of different reserve definitions in the European and North American reliability organizations.
Table 2: Mapping of European and North American terminology for reserves
European Union for Coordination of Transmission of Electricity (UCTE)
North American Electric Reliability Corporation (NERC)
Primary control reserves Frequency responsive reserve
Secondary control reserves Regulation
Spinning Reserve
Non‐spinning Reserve
Tertiary control reserves Supplemental Reserves
Source: Ela et al., (2011).
Energy on Hourly and SubHourly Time Intervals Energy is defined as the injection of real power into the grid at a time and location, matched by the utility or system operator with a corresponding withdrawal at another location, net of transmission losses. In most wholesale markets, forward contracts for energy deliveries typically identify the period of the contract, the delivery point, the specified hours and a bundled price ($/MWh). Spot energy sales are typically priced using two or three components: the cost of generator start‐up ($), the cost of operating the spot generator at a minimum operating level ($/MWh), and the cost of energy at several points between the generator’s minimum and maximum operating levels ($/MWh). As described in further detail in Section 6, the wholesale spot markets are typically operated on a day‐ahead and real‐time basis. In these markets, energy is either (a) self‐scheduled by the plant operator or utility owner, or (b) offered as dispatchable (meaning generally that it can be started and operated at any feasible point by the power system operator) using a price function bid, ranging from the allowable negative bid to the allowable positive bid (the bid “cap”). Energy scheduled or offered and accepted in the day‐ahead market obtains an hourly schedule for the next operating day. Energy offered into the real‐time market can be dispatched on a five‐minute basis by the market or system operator.
While all CSP plants with thermal storage will only be partially dispatchable at times because of the variability of sunlight, some may also have certain ranges of production that

15
will be treated as inflexible, or “must take” if the plant is not instructed to curtail and experience a loss in production.17 For example, this situation might occur if the thermal energy storage tanks are fully charged, but the utility asks the plant to continue to withhold production due to surplus generation on the grid. As a practical matter, dispatchable solar energy will likely be bid into the market at a low or zero price during hours when the plant operator wants to maximize revenues, or more rarely at a negative price, during hours when the plant operator prefers to pay rather than be backed down below an operating point.18
Within the operating hour, the real‐time energy supplied under dispatch instruction – and thus potentially to follow the variability within the operating hour in load and the production of wind and solar plants – is sometimes called “load‐following” or “net load following”.19 Some system operators are preparing for the advent of increased wind and solar production by procuring additional reserves of energy that can be dispatched in this fashion.20 CSP with thermal energy storage could be designed to serve this function, which will become more valuable over time. This is discussed further in Section 8 below.
Regulation Regulation is an ancillary service that requires generation or non‐generation resources to be synchronized to the grid and responsive to automatic control signals (e.g., automatic generation control, or AGC) within a pre‐determined regulating range that depends on the unit’s ramp rate. Regulation reserves are carried by the system operator to balance the system on intervals of seconds in between the system operator’s or utility’s dispatch instructions. The quantity carried by the system operator is usually a function of measured or forecast deviations in particular time intervals by demand and supply, as well as by the need to meet applicable reliability standards to manage frequency excursions.
Spinning Reserves Spinning Reserves is an ancillary service that is provided by generation or non‐generation resources that are synchronized to the grid to meet system contingencies. In the United States, a unit’s eligible spinning reserve capacity is generally defined as the resource’s ramp rate × 10 minutes and the capability to provide energy for 1 hour in the event of a call on 17 There are different terms to describe renewable energy that is not dispatchable by the utility or system operator; in the United States, these terms include “must take” and “as available”. 18 A negative bid, submitted as, e.g., ‐ $100/MWh, indicates what the generator is willing to pay to remain on when there is surplus energy or congestion on the grid that requires some units to back‐down. When wind or so ntive, or a fixed contractual price per unit of energy, the plant
to back d lar plants are paid a production based tax ince
operator m a may need to be paid ore than th t price the plant own.19 See, for example, discussion in CAISO (2010). 20 See for example, the discussions about the California ISO’s “flexi‐ramp” product, available here: http://www.caiso.com/informed/Pages/StakeholderProcesses/FlexibleRampingProduct.aspx.

16
energy from spinning reserves. System operators typically carry sufficient spinning reserves to cover the loss of the single largest generator or transmission facility. CSP generators can provide spinning reserves from thermal energy storage by keeping the plant below its maximum operating level, possibly at its minimum operating level, and being able to ramp the turbine up in response to the system operator’s instruction. The duration of the supply of spinning reserves is thus a function of how much stored thermal energy is available to maintain the reserve availability.
NonSpinning Reserves Non‐Spinning Reserves is an ancillary service that is provided by generation or non‐generation resources that are not synchronized to the grid to meet system contingencies. In the United States, a unit’s eligible non‐spinning reserve capacity is generally defined as the resource’s maximum energy production within 10 minutes from start‐up and the capability to provide energy for 1‐2 hours in the event of a call on energy from non‐spinning reserves. Non‐spinning reserves are typically provided by quick‐start generators, such as combustion turbines, but can also be provided by synchronized generators that have surplus reserve capacity after the spinning reserve requirements have been provided. Hence, while most CSP generators under development cannot achieve a cold‐start in 10 minutes from thermal energy storage, they could remain available for warm starts or possibly remain synchronized to cover a system’s non‐spinning reserve requirement.
Capacity Capacity, typically denominated in MW, is the expected output of a generator under particular system conditions for purposes of ensuring resource adequacy (e.g., different seasons due to temperatures or availability of fuel source). This rating is relevant because some regions enforce an aggregate capacity requirement on load‐serving entities. How different types of generation are awarded a capacity credit is discussed further in Section 7 below. Most regions further distinguish capacity eligibility on the basis of location on the transmission network, with capacity closer to load centers being qualified to serve that load, whereas more distant capacity is restricted to supplying only up to the power transfer capability across congested transmission facilities.
In some regions, as additional wind and solar generation comes on‐line, the capacity product may be further differentiated to reflect its operational attributes, such as start‐up times and ramp rates. CSP plants with thermal energy storage can thus provide both capacity and desirable operational attributes, although the variability of their fuel source will need to be considered in valuation across particular times of year and in different locations. As discussed below, the quantity of thermal energy storage will have a significant effect on the capacity credits allocated to particular plants.

17
Frequency Response Utility system frequency, the frequency of oscillations of alternating current (AC), is controlled second‐by‐second and is determined by the balance between system demand and total generation available on the grid. When the amount of electric power produced by the generators exceeds demand, the frequency of the electricity rises. Conversely, when demand exceeds available generation output, the frequency drops, which can lead to grid instability and outages. Generally speaking, grid operators are required to maintain frequency within specified limits, for which they use controls available on primary, secondary and tertiary time‐frames.21
Primary frequency response is provided by generators that provide inertia as well as responsive governors, as well as by quick response storage and demand response. To provide such frequency response, it is particularly important to maintain headroom on resources for upward response capability. In some power systems, such as Spain, an explicit frequency response reserve is required, while in others, that headroom is primarily on conventional generation committed to meet load and operating reserves but not at their maximum operating levels.
CSP plants with thermal energy storage have inherent capabilities to support frequency response, through inertia as well as responsive governors, and can be dispatched to provide upwards frequency response reserves.
Reactive Power and Voltage Support In addition to real power, power systems need provision of reactive power from generators, synchronous condensers or capacitors to support and maintain operating voltage levels under both normal and emergency conditions. Adequate voltage support is required to maintain power quality and to prevent voltage collapse, which can result in wide spread blackouts. Reactive power cannot be transmitted over long distances, and must be supplied locally. In general, injecting reactive power into a transmission system will increase the voltage level around the point of injection, and withdrawing it will decrease the voltage level. Because the system conditions are constantly changing, the need for reactive power will also be constantly changing, requiring the system to have devices capable of constantly and automatically adjusting the reactive power supply at specific locations. Also, under some emergency conditions, when the voltage begins to collapse, automatic increases in reactive power output is required to raise the voltage and
21 Frequency control is typically divided into three categories, with primary control, or frequency response, provided autonomously in response to frequency deviations, secondary control provided through automatic generator controls (i.e., Regulation), and tertiary control provided by dispatch instructions from the system operator.

18
prevent it from collapsing to the point of causing a blackout.22 Although market pricing of reactive power has been considered for several years in the U.S. (e.g., FERC 2005), this service remains an administrative requirement in U.S. regions. However, generators are compensated when they are dispatched to particular operating points to provide reactive power. CSP plants with or without thermal storage will provide automatically adjustable eactive power to the system. r
22 For example, one of the important lessons learned in the blackouts in the U.S. Western Electricity Coordinating Council (WECC) in July and August of 1996 was that operation of generation in a constant reactive power mode increased the risk of voltage collapse and, therefore, should be limited.

19
3. Valuation of Renewable Resources – Definition of Net System Cost and Quantitative Methods
o date, based on the experiences of CSP companies and the survey of the literature in this paper (especially Mills and Wiser, 2012b), CSP with
thermal energy storage has not been valued accurately in renewable energy procurement, although projects have been advanced. This is due to several factors. First, the operational and reliability attributes of CSP with thermal storage are not yet sufficiently well‐defined, and even where they are in operation, there is little experience with dispatching such plants (Usaola, 2012). The CSP industry anticipates that this will change over the next one to two years, with the commercial operations of new utility‐scale CSP plants in the western U.S., including several that
T
include thermal storage.
Second, there hasn’t been sufficient experience in the integration of solar power onto power systems on a large‐scale, and utility assessment of renewable projects has not yet incorporated the findings of solar valuation studies and other integration analyses discussed in this paper. Decision‐makers also need some guidance in interpreting different methodologies used in valuation studies.
Finally, many utilities and regional power systems have not yet determined the mix of new infrastructure – such as more flexible dispatchable generation, storage or demand response – that will be needed for integration of variable energy renewables at higher penetration.23 The attributes of CSP with thermal energy storage thus need to be better understood as support for integration of other renewable resources (e.g., Denholm and Mehos, 2011).
To fully capture its long
term benefits within an
expanding renewable
energy portfolio, CSP with
thermal energy storage
requires regulators, utilities
and other entities to adapt
and extend existing
quantitative methods for
economic and reliability
valuation, as well as
examine the relative
benefits of alternative
renewable generation and
other associated infra
structure investments. The
comparative “net system
cost” is the result of this
comprehensive approach to
renewable costbenefit
analysis.
23 With the notable exception of some small island systems.

20
To assist this comparison of valuation methodologies, this section provides definitions and background on renewable energy valuation, with a focus on issues arising in valuation of CSP with thermal energy storage:
The components of “net system cost” or “net value,” The quantitative methods typically used to calculate components of net system cost; and
Baselines and benchmarking for quantitative analysis of CSP with thermal energy storage.
This section does not attempt to describe the different types of policy, planning and procurement processes and valuation methods in the CSP markets around the world. Mills and Wiser (2012a) provide a useful survey of solar valuation methods used in utility procurement in the western U.S. markets. Readers familiar with these topics can move to the next sections.
Utility Valuation and Net System Cost Renewable resources are interconnected to electric power grids around the world through a range of different policies and programs. Valuation enters into the investment or procurement decision in different ways. Under some of these policies, such as feed‐in tariffs, a government agency or regulatory entity sets a fixed price for delivered renewable energy and reduces barriers to interconnection, and utility planning and procurement processes are typically bypassed. Implicit or explicit valuation of renewable energy production under these types of policies may take place through set‐asides for particular technologies or other measures, such as time‐of‐day price adjustments. Under other types of renewable energy policies, such as renewable portfolio standards (RPS), utilities are given a generic renewable energy goal to fulfill by future date, and possibly also a set of valuation criteria to use when procuring that energy. Under each of these policy approaches, the utility or a separate national or sub‐national energy agency or system operator may also conduct comprehensive resource and transmission planning in conjunction with such procurement.
In any of these policy, planning and procurement processes, decision‐makers may use variants on benefit‐cost analysis, considering both quantitative and qualitative measurements, possibly along with reliability studies, to determine the types and locations of renewable resources that are interconnected. The analysis may consider the costs of other infrastructure, such as transmission upgrades, or other resources to ensure reliable ystem operations. Such analysis may be used ahead of time to set the desired targets for s

21
each type of renewable resource, or after an auction or other type of solicitation for
renewable energy to evaluate the submitted bids and determine the final resource mix.
The metric that has been historically used for comparing renewable investments, the levelized cost of energy (LCOE), is widely recognized to be of limited value for long‐term renewable planning and procurement purposes, particularly at higher penetrations of renewable energy (Joskow 2010). The concept of net system cost aims to compare renewable resource procurement or investment choices more accurately by using a comprehensive analysis of costs and benefits. The basic elements of this calculation, shown in Figure 1, are energy and capacity value, which are typically evaluated by utilities based on the forecast hourly production profiles of the wind and solar resource (e.g., Mills and Wiser, 2012b). As new types of renewable resources enter the market, such as CSP with thermal storage, the calculation has to be expanded to capture the additional attributes offered, such as ancillary services, as well as the costs created by other resources that may not be incurred with a CSP plant, such as integration costs. In addition, studies have shown that, for any particular power system, these costs and benefits are functions of renewable penetration levels and the composition of renewable resource portfolios (e.g., Mills and Wiser, 2012b; Denholm and Mehos, 2011). These are more complicated calculations, that require simulation.
When the costs are greater than the benefits, or equivalently that the net system cost is greater than zero, the difference is sometimes characterized as the “green premium,” namely the additional cost associated with providing clean energy from renewable resources when compared to the cheapest alternative source of electric power. As the green premium is reduced, through renewable technology cost reductions and/or policies that favor clean energy production, such as the greenhouse gas emissions reduction policy in California, renewable energy becomes more competitive with fossil fuels and possibly reaches “grid parity”. Except indirectly, this paper does not examine trends in the green premium and implications for investment in solar power under current natural gas price scenarios or alternative policies; the focus of the paper is primarily on comparative aluation of alternative renewable resources. v

22
Figure 1: Basic net system cost equation for utility‐scale solar PV and CSP projects
*Transmission costs may be difficult to dis‐aggregate for many projects that jointly utilize a set of
Minus
Energy Benefits
Ancillary Services Benefits
Capacity Benefits
LCOE or
Bid Cost
Trans‐mission Costs*
System Integration
Costs
Net System Cost
transmission upgrades, but exist regardless.
At higher penetrations, wind and solar generation could create more significant challenges for system operations and maintaining long‐term reliability. There are currently two primary operational solutions to the variability introduced by rapidly expanding wind and solar production. The first is more flexible utilization, including retro‐fits, of the existing fossil‐fired generation and hydro storage fleet.24 Planned generation additions would likely need to have quick starts, low minimum operating levels, and fast ramp25 capabilities to ensure balancing of renewable production on daily time‐frames (seconds, minutes, hours) (e.g., Lannoye et al., 2012).
The second category of integration solutions are additional non‐generation resources, including distributed and utility‐scale storage capacity and demand response. Generically, storage has the advantage over new fossil generation that, as more renewable energy is produced, it can be charged from the grid, thus providing a better long‐term solution to renewable integration consistent with environmental goals. The disadvantage is that, at least in the near‐term, most existing storage technologies are significantly more expensive to construct than gas plants. Thermal energy storage additions to CSP plants are potentially among the lowest cost energy storage solutions (Turchi et al., 2010). For that reason, the technology has been the subject of the recent analytical studies reviewed here.
24 Including dam and pumped storage. 25 Ramp is the ability of a generator to adjust its output level in a specified amount of time, typically measured in megawatts (MW) per minute.

23
Quantitative Methods for Economic Valuation The remainder of this paper is focused on the valuation of the benefits from CSP with thermal energy storage. Most of the study results surveyed are from simulations of the operations of individual plants or regional power systems that result in quantitative estimates of economic value, denominated in $/MWh of CSP production.
Modeling the value of CSP plants with thermal energy storage involves some straightforward extensions of existing quantitative methods for forecasting prices and economic value in power systems or markets, but also has required the development and application of new types of models, particularly those simulating system integration of wind and solar energy at high penetration (e.g., Mills and Wiser, 2012b). As discussed in more detail below, these forecast changes in system conditions are going to create new operational and reliability requirements for power systems, presenting opportunities for CSP with thermal energy storage to provide additional value both by reducing the integration requirements, compared to other solar technologies, and by providing additional operational flexibility to the grid. Accurate estimates of the total value of CSP with thermal storage thus require the integration of wide‐ranging modeling results.
Table 3 summarizes some of the key modeling methods and identifies papers applicable to solar valuation that are referenced in this survey. One key differentiator is whether only an individual plant is being modeled or a complete power system with multiple generators and loads. When only individual plants are modeled, there is the capability to represent greater operational detail, but market prices or utility costs are generally fixed and external to the model (sometimes called “exogenous” fixed prices) (see, e.g., Denholm and Sioshansi, 2010; Madaeni et al., 2012). Unless the plant is truly marginal to the system – that is, has no significant effect on market prices – this modeling approach has the limitation that it does not consider the effect of thermal storage on market prices. When the dispatch of a power system is modeled, the market price is calculated internally to the model, often based on the assumed fuel cost and heat rate of the marginal generating unit (sometimes called “endogenous” costs or prices). There are many variants on power system models, some used to focus on detailed system operations and power flows on different time‐scales, while others may simplify some aspects of the system to be used for tasks such as evaluating the likely investment in new generation over time in response to forecast changes in fuel prices, market designs and policy drivers (e.g., Mills and Wiser, 2012b). In addition, a specific class of power system models is used to evaluate the capacity credits awarded to different types of renewable resources due to their availability to address loss‐of‐load probabilities (LOLP).

24
Table 3: Types of quantitative modeling methods for CSP with thermal energy storage
Type of model Description Electric power products valued
CSP Valuation Papers reviewed/forthcoming studies
Plantlevel simulation with exogenous fixed prices
Detailed plant‐level model of CSP with thermal energy storage optimized against fixed market prices or utility costs
Energy, ancillary services
Sioshansi and Denholm (2010); Madaeni, Sioshansi, and Denholm (2012)
Power system dispatch models with endogenous system cost or market price formation
Detailed system‐level models with commitment and dispatch of CSP with thermal energy storage to minimize production costs or maximize generator revenues.
Energy, ancillary services, integration requirements/costs
Denholm and Hummon (2012); CAISO (2010)*; CAISO (2011)*
Longterm planning/ investment models
Similar to system‐level models, but with the capability to model investment decisions over time
Energy, ancillary services, capacity
Mills and Wiser (2012b)
Deterministic and probabilistic reliability metric models
Deterministic and probabilistic models that measure the capability of a type of generator to contribute to prevention of loss of electric load
Capacity Sioshansi and Denholm (2010); Madaeni, Sioshansi, and Denholm (2012)
* Note that these studies included CSP without storage but did not dispatch it.
Baseline Measurements The baseline for calculating the benefits of thermal storage is typically a scenario in which CSP and/or solar PV without storage is added to the power system. Slightly different comparative results can be expected if the solar technologies being evaluated are being modeled as incremental additions of energy by the CSP plant with storage, a re‐allocation of a fixed solar energy portfolio resulting in reductions of other solar production, or as equivalent additions of energy by the different solar technologies. This is summarized in Table 4 and explained below.

25
Table 4: Alternative baselines for inclusion of CSP with thermal energy storage
Baseline Scenario Description Study Incremental additions of CSP energy from thermal storage
Additions of thermal storage to baseline CSP plant without storage
Sioshansi and Denholm (2010); Madaeni et al., (2012)
Reallocation of solar portfolio to include CSP with thermal energy storage
Allocation of a portion of the total stock of solar energy to CSP with thermal storage
Denholm and Mehos (2011);
Equal energy from each olar technology s
Equivalent energy from PV, CSP without storage and CSP with storage
Mills and Wiser (2012)
The next two figures provide perspective on the shape of solar production profiles, which helps conceptualize how quantified benefits may differ among them. Figure 2 shows three “clear day” profiles for a solar plant rated at 200 MW of maximum output: a fixed‐tilt PV plant, a CSP plant without storage, and a CSP plant with 4 hours of storage. A tracking PV plant would attain a profile closer in shape to a CSP plant without storage. These profiles are presented illustratively; the thermal storage is simply assumed to be available at maximum output for 4 additional hours after sunset.26
If the utility is seeking to buy a fixed quantity of solar energy (for example, to meet an RPS requirement), then the capacities (MW) of the plants need to be adjusted. Figure 3 shows the same three technologies, but with capacities adjusted to provide essentially equivalent energy, which is arbitrarily fixed to be 2970 MWh on a summer clear day, roughly the daily quantity of energy provided by a 200 MW CSP plant with 4 hours of energy storage. This figure shows that to maintain equivalent energy, the capacity of both the PV plant and the CSP plant without storage are adjusted upwards to produce more energy, while the capacity of the CSP plant with storage remains the same. These adjustments would obviously affect the LCOE of three such equivalent energy projects.
The possible effect of these baseline decisions on comparative value is discussed further in the subsequent sections.
26 The profiles for the PV and CSP without storage were constructed from generic data provided by the California ISO. The CSP daily generation profile is based on parabolic trough plants, but is indicative, for ummer days, to other CSP technologies as well. s

26
Figure 2: Energy production profiles for three 200 MW capacity solar plants: fixed tilt PV plant, CSP plant without storage, and CSP plant with 4 hours of storage
0
50
100
150
200
250HE1
HE2
HE3
HE4
HE5
HE6
HE7
HE8
HE9
HE10
HE11
HE12
HE13
HE14
HE15
HE16
HE17
HE18
HE19
HE20
HE21
HE22
HE23
HE24
MW
PV Output CSP Output CSP Output w/ 4 hr storage
Figure 3: Equivalent energy production profile of 2970 MWh on a clear day for a 200 MW CSP plant with 4 hours of storage, an approx. 275 MW CSP plant without storage, and an approx. 360 MW fixed‐tilt PV plant
0
50
100
150
200
250
300
350
400
HE1
HE2
HE3
HE4
HE5
HE6
HE7
HE8
HE9
HE10
HE11
HE12
HE13
HE14
HE15
HE16
HE17
HE18
HE19
HE20
HE21
HE22
HE23
HE24
MW
PV Output CSP Output CSP Output w/ 4 hr storage

27
4. Valuation of Renewable Resources – Implication of Regulatory and Market Regimes
SP with thermal energy storage has potential applications across a range of countries, and different regions within particular countries, that
may have different market structures and regulatory regimes. Hence, a further issue in comparison of CSP valuation studies is the comparison of results from these
different utility and market structures.
There are two basic institutional structures, with variants, for the power sector globally: competitive wholesale power markets, and vertically‐integrated state‐owned or private utilities. In countries or regions with competitive markets,27 the incumbent electric utilities have typically divested most or all of their generation, new generation investment is privately owned, and the transmission network is operated to provide “open access” by an independent system operator or a regulated transmission company that owns no generation assets. 28 These wholesale markets typically include transparent day‐ahead and real‐time auctions for energy and several ancillary services, including the products described in Section 2. They may also include capacity markets that settle financially on different time‐frames (months, annual, or multi‐year). Many generators bid into these markets competitively and set the market clearing prices.
C Regulatory and market
regimes can affect the
valuation of a dispatchable
and operationally flexible
solar resource. In countries
with transparent wholesale
markets for electric power,
it may be easier to value the
plant’s attributes – although
CSP project development is
affected by many other
factors. On the other hand,
resource planning methods
used by utilities outside
organized power markets
can also use simulations
based on forecasts of fuel
prices to evaluate the net
system cost of alternative
renewable resources.
27 Regions with competitive power markets include about 75% of the United States, England and Wales, Scandinavia, Spain, Australia, New Zealand, Chile, and Brazil, while many others have introduced elements of market competition. 28 An independent system operator owns no assets other than its control room, operating systems and human resources. It is intended to be a true “third party” operator of the power system. A regulated transmission company, sometimes called a “Transco”, does own transmission assets but operates the system impartially among generators.

28
These prices, along with forecasts of fuel prices, then form a historical basis for expectations about market prices in the future, and are also used to estimate the future
procuvalue of renewable plants, when that is guided by utility rement decisions.
In contrast, in a vertically integrated utility, whether under private, municipal or state ownership, the utility owns the generation and the transmission assets as well as serving retail load. These utilities operate their own power systems to self‐provide energy and ancillary services (or buy these services from a neighboring utility or wholesale seller under bilateral contract) and typically serve as their own planning entity with responsibility for meeting future load growth. A vertically integrated utility’s capacity investment decisions are generally subject to oversight by a subnational29 or national regulator. For such utilities, the decision on how to maximize the value of the energy and reserves available from dispatchable CSP will be based on avoided fuel costs as well as estimates of future capacity needs.
Valuation in U.S. Markets In the United States, both of these market/utility structures co‐exist due to a high degree of regional autonomy in implementing aspects of market competition. For example, in the western U.S., where much of the CSP development potential is located, the large investor‐owned utilities in California30 have divested most of their generation assets, and are all within the footprint of the California Independent System Operator (CAISO), which also operates day‐ahead and real‐time wholesale auction markets for energy and ancillary services. The other utilities in the western U.S. are either owned by municipalities, federally owned, or private utilities that remain vertically integrated, although they are required to offer non‐discriminatory transmission access to renewable generation under the federal transmission open access rules. These utilities also often buy/sell power with other regional entities based on bilateral contracts.
The regulatory and market structures in the western U.S. have a mixed record with respect to valuation of CSP with thermal energy storage (Mills and Wiser, 2012a). In California, RPS procurement by the investor‐owned utilities is subject to the oversight of the California Public Utilities Commission (CPUC), and the valuation of CSP with thermal energy storage under the agency’s current regulatory rules has been partial; for example, there has as yet been no consideration of avoided integration costs or the long‐term capacity value of competing solar resources, with consideration of these factors possibly beginning in 2013. At the same time, in the CAISO wholesale markets there is progress in adding pricing mechanisms to value operational flexibility needed for renewable integration, such as payments for faster Regulation response and ramping reserves. As 29 That is, states, provinces, municipalities or other subnational bodies. 30 Pacific Gas & Electric, Southern California Edison, and San Diego Gas & Electric.

29
regulatory and market designs evolve, the CAISO market is expected to provide additional pricing signals for entry of CSP with thermal energy storage.
In other states of the western U.S., CSP plants with thermal storage have been procured by utilities, and while solar valuation methods vary, the analytical approaches are not dissimilar to those in the wholesale market settings (Mills and Wiser, 2012a).
Valuation in Other Regions Outside of the United States, there are many variations along the spectrum between wholesale deregulated markets, regulated privately owned utilities, and nationally or regionally‐owned utilities. Figures 4 and 5 below briefly summarize the market designs and regulatory structures in several countries with high solar resource potential as well as
r details on identified renewable energy targets in those countries o regions.
Despite the differences in market and regulatory structures between countries, the valuation methods and results discussed in this paper have general applicability. First, valuation methods are usually generic, and several of the power system simulation tools discussed here are already used across the world. Modeling methods developed in one
g location can be utilized to study the systems in other re ions (e.g., Brand et al., 2012).
Second, power systems of similar size and resource mix, and with basic similarities in electric power market design, such as California and Spain, can learn from each other’s experiences in system and market operations as renewable penetration increases.
Third, while not all regions have transparent competitive wholesale markets, results of studies from market systems can provide some benchmarks for the value of different services provided by the CSP plants, especially over time, that can be of interest to non‐market regions (see, e.g., Madaeni et al., 2012). In addition, the market regions may provide additional incentives for technology innovation that are relevant to non‐market regions.
However, ultimately, specific regional studies are needed for valuation of CSP with thermal storage. The literature survey that follows has found few analyses of the economic and reliability benefits of CSP outside the United States, with some notable exceptions such as Brand et al., (2012) and Usaola (2012). Government agencies, utilities and the CSP industry should undertake additional studies of CSP with thermal energy storage in different power systems and share the results publicly to expand understanding of the resource. CSP associations, such as SOLARPACES, should expand their research scope to include valuation studies in different countries.

31
Figure 4: Market and Regulatory Regimes in Regions with High Solar Resource – Western Hemisphere

32
Figure 5: Market and Regulatory Regimes in Regions with High Solar Resource – Eastern Hemisphere

32
5
SP with thermal energy storage will generally have higher market or utility benefits than other renewable plants on existing power grids in regions ufficient direct normal insolation, as shown by the s reviewed in subsequent sections that use ical market prices or utility costs to calculate plant es. However, another consistent finding is that the erm comparative value of these plants becomes apparent as components in an expanding clean portfolio, which includes different renewable technologies and other types of storage systems.
Power systems around the world are already undergoing significant operational changes with the introduction of large‐scale wind and solar generation. As these changes accelerate, and simulations help define possible future impacts, a clearer picture is emerging about how CSP with thermal energy storage can address future system needs cost‐effectively, when compared with alternative low or
. Looking to the Future: Simulating Power Systems under High Renewable Scenarios
with sstudiehistorrevenulong‐tmore energyenergy
C
no‐emissions energy technology solutions.
This section briefly discusses three primary dimensions to these power system changes, with further elaboration in the next sections:
Hourly energy deliveries of different types of renewable energy and correlation with forecast demand for electric power;
Long‐term supply adequacy, often called “resource adequacy” or “capacity” requirements, of which the primary objective is to ensure that there is sufficient supply available to meet future demand as well as provide the
As several studies have
shown, CSP with thermal
energy storage obtains
greater value as power
systems enter phases of high
renewable penetration. The
basic characteristics of high
renewable power systems
are (1) greatly increased
variability in the hourly
supply of energy, (2) less
certainty about longterm
supply adequacy, and (3) the
need for much greater
operational flexibility. CSP
with thermal storage helps
reduce the costs of meeting
all these longterm
challenges to clean power
systems.
operating reserves needed to ensure reliability; and
Operational attributes of the future generation and storage fleet, which includes most notably the ability during the operating day to meet existing and forecast ancillary

33
service needs as well as changes to system ramps and new types of imbalances in energy production (such as conditions of overgeneration).
Energy Deliveries for Alternative Renewable Resource Portfolios When utilities evaluate future renewable resource portfolios, the first step is to determine the desired generation mix, based on the types of multi‐criteria planning analysis described in Section 3. In most of these regions, a “portfolio” approach to renewable resource development is thus being pursued, intended to minimize overall portfolio cost, and including how renewable energy with different characteristics is fit as closely as possible to the actual demand for power, which varies across the day, and typically peaks in the late afternoon or early evening. Hence, geothermal production is steady across the day and thus provides renewable energy “base‐load,” a role that can also be played by CSP with substantial thermal energy storage. Wind production tends to be highly variable but with a tendency to produce more on average at night in some regions. Solar production coincides largely with peak demand during the daylight hours in most, but not all, months in many power systems, but obviously cannot serve load outside those hours without storage. A recent report by the U.S. National Renewable Energy Laboratory (NREL) has conceptualized how even higher renewable penetrations could be achieved in the United
fStates by layering production from renewable technologies in this ashion (NREL 2012).
Of particular interest in many regions is the interaction of solar with wind generation at high penetrations, as well as the alignment with load patterns. Solar production patterns are straightforward to predict on clear days, less so on cloudy days. Wind production is highly variable, and may follow a diurnal pattern. At high penetrations, the interaction of these two resources is forecast to greatly increase the frequency and magnitude of system ramps and overgeneration31 conditions, while also creating new types of requirements for the long‐term reliability needs of the power system.
Figure 6 and Figure 7 show representations of how the energy from these resources may be shaped, assuming that all solar production is non‐dispatchable. These profiles are based on scenarios for California under a 33% RPS that combine significant additions of wind and solar. Figure 6 shows a summer day in which the combination of wind and solar are fairly complementary, with wind production being reduced during the daily peak hours just as solar production ramps up. The overall effect is a relatively smooth change in operating conditions, as shown by the “net load” shape. In contrast, Figure 7 is a spring day with lighter load and an evening peak, steady wind and high solar, which in combination creates the very different “net load” shape, shown in the red line. On this day, the solar ramp down in the late afternoon increases the rate and duration of the ramp up of other generation to
31 That is, periods when there is more energy being produced than is being used. Without curtailing some resources, overgeneration would cause the system to collapse.

34
meet the early evening peak load. There are, of course, many variants on how wind and solar production jointly affect operating conditions. These types of new operating condition and several others are examined further in Section 8, where detailed examples are provided to show how solar thermal storage can help mitigate some of these new system ramps. Because of these new dynamics, a new generation of large‐scale power system simulations are being conducted to better understand how operational and reliability requirements will unfold over time, as well as to test alternative resource mixes.32
Resource Adequacy Every utility or regional system operator must be able to meet annual peak loads, as well as to have sufficiently flexible generation to ensure reliability during significant unplanned generator and transmission outages. This has been a classic and straightforward utility planning problem since the beginning of electric power, made somewhat more complicated in recent years by the shift to market‐based generation investment decision‐making in some regions.33 In many power systems, regardless of market structure, a resource adequacy or capacity requirement has been established as insurance for long‐term reliability.
As discussed in more detail below, each generator on the power system has an expected capability to respond to peak system demands, and accordingly gets a “capacity credit”. However, in high renewable generation scenarios, the investment decision has additional dimensions because of uncertainty about the ability of wind and solar generation to meet
arios.evolving capacity requirements in high penetration renewable scen
Renewable resources are quite different from conventional fossil fuel‐based resources in terms of their expected capacity credits. Wind resources have variable production by day, and in many regions the expected wind production is not highly correlated with annual peak loads (e.g., CAISO, 2010; Mills and Wiser, 2012b). As a result, there is greater reliance on more reliable generation to meet annual peak load capacity requirements. In contrast, solar production is generally more highly correlated with both daily and annual peak demand. However, there are two considerations when forecasting how solar production contributes to capacity requirements: the first is that cloud cover could reduce solar production during annual peak hours, which would be a function of the location of the solar plants. Geographical diversity of solar plants can help mitigate this possibility.
32 E.g., CAISO (2011), GE/NREL (2010). 33 In competitive markets, capacity or resource adequacy requirements are in part a vestige of prior reliability rules, but also serve to provide additional payments when energy markets are subject to market power mitigation rules that suppress the price signal for supply scarcity.

35
Figure 6: Simulated California ISO Solar and Wind Production under a 33% RPS, “August 26, 2020”
0.00
10,000.00
20,000.00
30,000.00
40,000.00
50,000.00
60,000.00
70,000.00
1 49 97 145
193
241
289
337
385
433
481
529
577
625
673
721
769
817
865
913
961
1009
1057
1105
1153
1201
1249
1297
1345
1393
MW
Minutes in Operating Day
Load Net Load Wind Solar
Source: CAISO data, based on CPUC “Trajectory” Case (2010)
Figure 7: Simulated California ISO Solar and Wind Production under a 33% RPS, “March 10, 2020”
S
ource: CAISO data, based on CPUC “Trajectory” Case (2010)

The second consideration is that as solar penetration increases during the sunlight hours, a region’s incremental capacity needs begin to shift to the early evening hours, following the solar ramp down (Denhom and Mehos, 2011; Mills and Wiser, 2012b). Figure 8, excerpted from Denholm and Mehos’ (2011) study of the southwestern U.S. power system, shows graphically that as penetration increases, solar progressively displaces the need for other types of generation during the current afternoon peak hours in California. As long as the forecast demand growth increases capacity requirements within those hours, additional PV and CSP without storage will accrue capacity value in those hours. However, when additional demand growth creates capacity needs outside the sunlight hours, conventional solar production – PV or CSP without thermal storage – will face diminishing capacity value. This phenomenon is examined in more detail in Section 7.
Figure 8: Simulated Dispatch in California for a Summer Day with Solar PV Penetration from 0‐10%
Source: Denholm and Mehos, 2011, pg. 3.
36
System Operations In addition to the prior challenges, wind and solar generation are creating new types of system operational requirements at high penetrations. Traditionally, demand has been the primary source of variability in a power system, with dispatchable generators and available bulk storage acting as the resources that respond in the needed time‐frames. With the increasing penetration of wind and solar generation, there is now growing variability of supply – both minute to minute variability and large aggregate fluctuations over the operating day (along with seasonal variations) – along with higher forecast errors in predicting actual output. In response, utilities and regional system operators have to be prepared to start, stop and ramp the available flexible dispatchable resources – primarily natural gas plants and hydro with storage – more frequently and aggressively, as well as

37
carry additional reserves to provide flexibility across the operating day. These new requirements are motivating a range of institutional changes in different regions, including improvements in regional coordination of scheduling and dispatch, additional wholesale market products specifically to address system needs for renewable integration, and evaluation of investment in infrastructure to improve operational flexibility, including different storage technologies.
CSP with thermal energy storage has the capability to address market, operational and reliability issues that can otherwise emerge across all of these dimensions of the resource plannin og pr blem:
The expected renewable production profiles can be altered to better fit load patterns and mitigate system ramps at the power source;
The resource adequacy of the power system can be improved with lower investments needed in other types of back‐up resources; and
The operational dimension of the power system, including maintenance of power quality, can be managed more effectively, utilizing a clean energy resource.
The remainder of this document examines the valuation of CSP’s potential services across enetration scenarios. both current power systems and under high renewable p

38
6. Energy and Ancillary Services
SP plants with thermal energy storage have the capability to shift energy to higher price intervals and supply ancillary services. These capabilities can
provide additional revenues credited to the plant, as well as change the plant’s relative value when compared to other solar resources. For any particular CSP design, this additional value will vary between power systems, depending on the initial resource mix, load patterns, and forecast changes in system resources and conditions. This section examines results from the current literature and points to areas of future research interest.
C
Energy As noted above, dispatchable solar energy is defined as solar energy production that can be scheduled flexibly by a system operator, but within the operational constraints or contractual limitations of any particular CSP plant. Utilities and other system operators will typically schedule energy on an hourly basis (i.e., 60‐minute blocks) day‐ahead, provide adjustments to that hourly block at least one hour prior to real‐time, and then correct energy imbalances in “real‐time” by sending dispatch instructions to controllable resources, typically on time‐frames ranging from 5‐10 minutes.34 In spot power markets, most of the value of energy is determined in the day‐ahead market, while real‐time energy imbalances, which are currently largely a function of load forecast errors, constitute only a few percent of total energy market financial settlements (CAISO 2012a). However, the addition of variable wind and solar production may increase the energy transacted in real‐time, providing more value to operational flexibility.
As discussed below, to date, most simulations of solar thermal storage have used an hourly
CSP with thermal energy
storage can dispatch
energy and ancillary
services to the highest
economic value hours
across the year. In power
systems with low
penetration of renewables,
this added value is
generally calculated as
between $510/MWh. As
renewable penetration
increases, studies suggest
that energy revenues
decrease due to the
reduced utilization of fossil
generation (leading to
lower market prices), but
the value when compared
to incremental solar PV or
CSP plants without storage
increases, to between $10
20/MWh.
34 How utilities provide real‐time balancing will vary around the world, but dispatch intervals are likely to be no more than 15 minutes. In the western U.S., there are also forthcoming requirements to schedule power transactions on 15 minute intervals outside the California ISO markets.

time‐frame optimized over 24‐48 hours, which correlates better to day‐ahead scheduling practices, although some power system models make adjustments to reflect intra‐hourly variability that could affect generator dispatch (e.g., CAISO 2011). The discussion also examines the effects of the baseline modeling decisions reviewed in Section 3.
To illustrate the basic process by which dispatch of energy from thermal storage enhances the average value of CSP energy, Figure 9 from Denholm and Hummon (2012) compares production from CSP without storage on cloudy, winter days (and analogously solar PV) to the shifted production from solar thermal storage of equal energy production.35 The green line represents the system marginal price, that is, the fuel cost or market price of the generating unit needed to meet demand in that interval. The units ($/MWh) are shown on the left y axis. The red and blue lines show CSP production, with the units (MW per hour) shown on the x axis. The red line represents production from CSP without storage, which produces energy in response to available insolation and cannot shift energy. As a result, for the days modeled, production from CSP without storage misses the highest price intervals, as would solar PV. In contrast, the blue line shows production from CSP with thermal energy storage, with production optimized to maximize energy revenues. As a result, production lines up relatively closely with the highest prices, and the average energy value of the energy is higher.
Figure 9: CSP with thermal energy storage dispatched against simulated January 22‐24 energy prices in Colorado
Source: Denholm and Hummon (2012), Figure 10, pg. 19.
39
35 The total energy production from CSP without storage and CSP with 6 hours of storage is equalized in the model, which is why the production profile from the plant without storage reaches a higher maximum production than the plant with storage.

40
This figure illustrates the basis for the more sophisticated energy dispatch models that can be used to evaluate time periods of months or years. There are now several modeling studies of the western U.S. solar markets, and other countries, utilizing different methodologies, which show that the average energy value of CSP with thermal energy storage is greater than solar PV or CSP without storage. These studies can be separated into two categories: incremental CSP additions in scenarios with low penetration of renewables, including dispatch against historical market prices or utility costs; and incremental or portfolio additions in scenarios with high penetration of renewables. These different cases are examined in order.
Modeling the value of CSP with thermal storage against historical or near‐term market prices or conditions provides a benchmark result that is relatively easy to verify, and can be measured against the baseline revenues of other solar or wind renewable plants. The most straightforward modeling approach uses an optimization model of the CSP plant, and dispatches it against fixed historical or simulated hourly prices for energy and ancillary services. Sioshansi and Denholm (2010), and Madaeni et al. (2012) simulated energy value in this way using the NREL SAM model of a parabolic trough plant with thermal energy storage dispatched against 2005 hourly prices in the energy markets operated by the CAISO and the Texas system operator (ERCOT), as well as utility hourly ”system lambdas” elsewhere in the western U.S.36 Table 5 shows Sioshansi and Denholm’s (2010) energy dispatch results for a trough with 6 hours of thermal storage. The average added value in the wholesale markets regions, using 2005 data, is $9‐10/MWh, with lower benefits shown when modeling utility system lambdas. In the later extension of this analysis by Madaeni et al., (2012), a range of thermal storage capacities is modeled, allowing for calculation of market revenues as a function of the solar multiple and number of hours of storage. Helman and Sioshansi (2012, unpublished) used the same model to evaluate revenues using 2011 CAISO market prices, with results discussed in more detail below.
36 The system lambda is a publicly reported value representing the utility’s hourly marginal cost of electric power.

41
Table 5: Valuation of thermal storage (1): energy value results from historical market prices or low renewables simulations
Study Location and Date
Technology Methodology/Metric
Baseline Solar
Renewable penetration
Added Energy Value
Sioshansi and Denholm, 2010
California ISO, Dagget, CA, 2005 prices
Trough with 6 Hrs storage, Solar Multiple 2.0
Plant revenue optimization against exogenous fixed market prices
Trough with no storage, Solar Multiple 1.5
N/A $9.40/MWh
Sioshansi and Denholm, 2010
ERCOT western zone, 2005
Trough with 6 Hrs storage, Solar Multiple 2.0
Plant revenue optimization against exogenous fixed market prices
Trough with no storage, Solar Multiple 1.5
N/A $9.00/MWh
Denholm and Hummon, 2012
Colorado‐Wyoming
Trough with 6 hours of storage, Solar multiple 2.0
Production simulation, change in production costs from baseline
Trough with no storage, Solar Multiple 1.3
12.4% wind, 0.8% PV
$6.6/MWh
A few studies have also examined the dispatch of CSP in low renewable scenarios using detailed power system models, which can consider the effect of shifting energy on market or utility prices. Denholm and Hummon (2012) utilize a production simulation model to examine the dispatch of CSP in a “low renewables” scenario in the Colorado‐Wyoming power system. As shown in Table 6, for the case that they model, the addition of 6 hours of thermal storage adds almost $7/MWh in value to an incremental CSP plant.
The additional value of CSP with thermal energy storage is a function of the availability of higher price or cost hours to which energy can be shifted outside the sunlight hours, as shown in Figure 9. However, as additional renewable energy is interconnected to power systems, it progressively displaces generation with marginal fuel costs (gas and coal), in merit order. Solar production reduces energy prices during the sunlight hours, with hourly prices also reflecting the morning and afternoon solar ramps; wind energy is typically more uniform on average, but with a diurnal effect in some regions that results in greater energy price reductions in the overnight hours. When renewable energy production is on the margin – that is, when it has displaced all other dispatchable generation – it sets market

42
prices that are zero or possibly negative.37 This phenomenon is already observed in many power markets where wind production has suppressed market prices in the off‐peak hours and under certain system conditions. While currently a phenomenon associated primarily with wind production, solar production could eventually contribute to this effect during the morning and even afternoon hours, as solar penetration increases (Denholm and Mehos, 2011; Navigant et al., 2011).
As market prices change, solar plants that do not have storage will face lower energy market revenues. The net load shape shown in Figure 7 helps conceptualize how this will take place. However, CSP with thermal energy storage will have the capability to shift energy to the highest value hours of the day, which increasingly will occur during the evening hours and intervals with the highest system ramps. While all solar plants will earn lower average revenues, the revenue reductions are more pronounced for solar PV or CSP without storage.
One of the studies to provide this insight is Mills and Wiser (2012b), who construct a dispatch model of the California power system which they use to model increasing penetrations of individual renewable technologies – wind, solar PV, CSP without storage, and CSP with 6 hours of storage – beginning from a single marginal plant. This approach does not reflect the mix of wind and solar resources in actual utility portfolios (which will be the subject of further work), but helps clarify how penetration by each technology type drives market value.
With respect to energy value, Mills and Wiser find that as solar PV and CSP without storage increase their share of energy production, they earn lower energy revenues. This is due to the effect noted above: because these plants can only produce during the same hours each day, increasing quantities of solar energy progressively displaces other types of generation from those hours.38 Of all these technologies, CSP with thermal storage is best able to maintain its energy value as penetration increases, because it can move some energy to the highest value hours for each scenario.
Mills and Wiser’s findings are graphed in Figure 10, showing that in their model, CSP with 6 hours of storage initially does not earn a significantly higher marginal energy value 37 Negative prices are set by negative market bids by generators that prefer to remain on‐line in periods of surplus energy. They thus reflect the “willingness to pay” to remain operating. 38 In contrast, wind, although not a technology that can be dispatched flexibly, does not experience the same diminishment in energy value in Mills and Wiser’s model because its production is spread more evenly on average across the day, due in part to assumptions about geographical distribution, such that energy prices during the sunlight hours aren’t suppressed as much (noting again that the wind scenario does not include any solar energy). However, in actual power systems, wind production has been seen to significantly depress market prices overnight, including creating negative prices when there is transmission congestion or excess generation.

($/MWh) than CSP without storage or PV, in the range of $1‐3/MWh higher until penetration levels of 5% annual energy. This is a lower value than the prior studies discussed above, and could be due to the interaction of the quantity of thermal storage being modeled and the hourly prices being calculated in their model.39 However, as solar penetration in California increases, the energy value gap for incremental solar generation increases dramatically. While initially it has a higher value, as penetration increases, CSP without storage has a lower value than PV, presumably because the aggregate PV energy production is more concentrated in different sunlight hours that have slightly higher economic value in their model.40 With respect to the CSP without storage, the difference in value of the incremental CSP plant with storage is $9/MWh by 10% solar energy penetration, $17/MWh by 15%, $20/MWh by 20% and $36/MWh by 30%.
Figure 10: Marginal Energy Value ($/MWh) by Penetration of Solar and Wind Technologies – Mills and Wiser (2012b)
Denholm and Hummon (2012) find similar results for the transition from low to high renewables scenarios when modeling the Colorado‐Wyoming power system. As shown in Table 6, for the low renewable energy case that they model, the addition of 6 hours of thermal storage adds almost $7/MWh in value to the CSP plant. However, in the high
0
10
20
30
40
50
60
70
0% 2.5% 5% 10% 15% 20% 30%
$/MWh
% of Annual Energy, by Technology
CSP with 6 hours of storage Wind CSP with no storage PV
39 Although its hourly price results have not been released, the Mills and Wiser model may not generate the same distributions of hourly prices that are found in the actual CAISO markets. CSP members have noted that some power system models used to forecast prices yield flatter prices across the day (due to relatively similar he hermal energy shifted to
43
at rates of the marginal units), which then results in little added value for stored tthose hours. 40 That is, this result could be different for power systems with different load shapes.

44
renewables case, CSP with 6 hours of thermal energy storage earns almost $17/MWh greater average value than CSP with storage and $13/MWh greater than PV.
Studies of CSP dispatch in other countries have found similar results on the economic value of dispatchable CSP energy. For example, Brand et al., (2012) model parabolic trough plants with and without storage for Morocco and Algeria and project an incremental value for dispatchability from storage of €39‐55/MWh for Morocco and €29‐35/MWh for Algeria. The range is associated with the level of CSP penetration modeled by the year 2025: 5% for the low estimate and 30% for the high estimate. The analysis was performed based on simulations of total cost to operate the respective systems (including investment) over a 30 year time period. There appears to be less literature in other countries with high potential for CSP plants, including those with competitive power markets, such as Australia.
Table 6: Operational Value of Simulated Generators in Colorado‐Wyoming subsystem, low and high renewable penetration cases
Low RE Case High RE Case Flat
Block PV CSP
(no TES)
CSP (6 hr TES)
Flat Block
PV CSP (no TES)
CSP (6 hr TES)
Marginal Value ($/MWh)
Fuel 31.7 35.2 33.9 37.7 22.6 21.2 18.7 31.1 Var. O&M 1.2 1.0 1.0 0.8 2.1 2.0 1.9 1.4 Start 0.4 0.4 0.6 3.5 0.5 ‐0.9 ‐1.7 3.1 Total 33.3 36.6 35.5 42.1 25.2 22.3 18.9 35.6 Source: Denholm and Hummon (2012), Table 4, pg. 17.
Subhourly Energy Dispatch and Ramping Reserves Real‐time energy market prices reflect the bid costs of adjustments that take place between the day‐ahead market and the real‐time market, as a function primarily of demand and supply forecast errors and the transition between the day‐ahead or hour‐ahead block schedules and real‐time intra‐hourly variability. Generally, real‐time market prices are more volatile than day‐ahead prices, due to the effect of operating constraints and actual variability, although integrated hourly prices between the two markets are reasonably similar, due in part to the actions of virtual traders (e.g., CAISO 2012a).
With increasing penetration of wind and solar generation, real‐time markets are being continuously adapted. For example, the California ISO has already added a ramping reservation constraint to its real‐time market operations, and will soon procure additional ramping reserves, provided by units which hold some ramping capacity in reserve, to

45
follow real‐time dispatch when called by the ISO.41 CSP plants that provide dispatchability could participate in these ramping reserve markets; while estimating the potential economic value is premature, it would be expected that at high renewable penetration, the value of ramping capability would increase.
Ancillary Services Ancillary services currently constitute a small segment of utility power system costs, but potentially a source of significant revenues for CSP plants with thermal energy storage. Moreover, as noted, ancillary service and related flexibility requirements are forecast to grow in regions with high penetration of wind and solar power (e.g., CAISO 2010, 2011; see also Section 8). Ancillary services are provided from dispatchable resources, which in many systems are currently either gas‐fired generation or hydro storage, but are also beginning to be provided by demand‐side resources. Similarly to any generator or other storage resource, a CSP plant can offer “upward” services from capacity on the turbine that is not being used to produce energy, and “downward” services when there is the capability to decrement energy from a prior set point. These plants are particularly suited to providing spinning reserves and Regulation, as well as any other ancillary service offered from a synchronous generator, such as frequency response.
For most CSP plants, the capability to provide these services will vary over the operating day, depending primarily on the state of charge of the thermal energy storage system. The operator of the plant will seek to “co‐optimize” the use of the stored thermal energy for energy and different types of ancillary services to obtain the highest value across these products. Box 1 provides a simple example of how this would be done for energy and spinning reserves, and the method would be used for any other ancillary service jointly provided when the generator is on‐line.
In the competitive wholesale markets, historical hourly ancillary service prices are available publicly, allowing for simulation of value using CSP plant models dispatched from thermal storage against those prices (e.g., Madaeni et al., 2012).42 For example, in the California ISO, average ancillary service prices in 2011, in rank order, were $10.84/MW for R , $9.15/MW for spinning reserve, $6.97/MW for Regulation Down and egulation Up 41 See discussion at http://www.caiso.com/informed/Pages/StakeholderProcesses/FlexibleRampingProduct.aspx. 42 In wholesale markets, the ancillary service price is denominated in $/MW, representing the capacity (MW) reserved on the resource to provide the service. The market price is typically calculated as the opportunity cost of the marginal unit providing the service, although in some markets, bids are allowed. Any energy provided by the plant is settled at the wholesale price. Recently, the markets for Regulation in the United States have been required also to pay a “mileage” payment, in which the resource is paid according to a measure of how frequently it responds to Regulation dispatch (allowing, all other things equal, for higher payments to faster Regulation resources).

46
$1.06/MW for Non‐spinning Reserve (CAISO 2012a). However, as shown in Figure 11, the hourly prices for ancillary services vary substantially over the operating day, with higher prices for “upwards” services in the late afternoon and early evening hours. Similar patterns occur in prior years as well as in the simulations of future conditions under the 33% RPS. This demonstrates that in California, based on historical prices, CSP plants charging thermal storage during the sunlight hours are well positioned to obtain the highest value for certain ancillary services in the subsequent hours. Alternatively, for analysis that does not use actual or estimated wholesale market prices, power system models can calculate the change in utility or market production costs when CSP plants are added to the resource mix and allowed to provide ancillary services (e.g., Mills and Wiser, 012b). 2

47
Box 1: Simple Example of CoOptimization of Energy and Spinning Reserves. Co‐optimization of energy and ancillary services requires the dispatch of energy to provide the maximum joint revenues from each market product. This may create counter‐intuitive dispatches in response to market prices. The example below assumes a 100 MW CSP plant with 2 hours of stored thermal energy, a 10 MW/min ramp rate, and a 10 MW minimum operating level. The operator will dispatch the plant for the highest value over Hours 18‐21. To provide spinning reserves, the plant must operate at no less than 10 MW of energy (minimum load), but can then sell the remaining capacity on the turbine as spin. The illustrative prices for energy and spinning reserves in each hour are shown in Table (a) below. Despite the fact that highest energy prices are in Hours 18 and 19, the joint value of the plant’s sales is improved if it instead provides spinning reserve in those hours and sells its remaining energy in Hours 20 and 21 at lower prices. This is because over all the hours, the spinning reserve revenues gained in Hours 18‐19 and the energy revenues gained in Hours 20‐21 are greater than the energy revenues lost in the first two hours. The calculations are illustrated in the following two dispatch cases. In case #1, shown in Table (b), the plant dispatches all its stored energy in Hours 18 and 19, and earns $11,000 over the four hours. In case #2, shown in Table (b), the plant sells as much spinning reserves as it can over Hours 18‐19 and releases the remaining energy subsequently in Hours 20‐21. It then earns $12,450. Note that there are other solutions, but this solution demonstrates the point and is easy to follow. Also, for this simple example, any thermal losses are ignored and the plant does not retain enough energy in storage to respond to a sustained energy dispatch from spin for the hour after Hour 21.
Table (a) Hour 18 Hour 19 Hour 20 Hour 21 Energy price $60 $50 $45 $35 Spinning reserve price $25 $20 $5 $2
Table (b) Hour 18 Hour 19 Hour 20 Hour 21 C#
ase 1
price quantity price quantity price quantity price quantity
Energy
$60 × 100 $50 × 100
Spinning reserve
Total: $6,000 $5,000 $ 11,000
Table (c) Hour 18 Hour 19 Hour 20 Hour 21 C#
ase 2
price quantity price quantity price quantity price quantity
Energy
$60 × 10 [min load]
$50 × 10 [min load]
$45 × 100 $35 × 80
Spinning reserve
$25 × 90 $20 × 90
Total: $2,850 $2,300 $4,500 $2,800 $12,450

48
Figure 11: CAISO 2011 Average Hourly Prices for Spinning Reserves and Regulation
$‐$2.00 $4.00 $6.00 $8.00
$10.00 $12.00 $14.00 $16.00 $18.00 $20.00
1 2 3 4 5 6 7 8 9 10 11 12 13 14 15 16 17 18 19 20 21 22 23 24
$/MW
Hour of Day
Regulation Up Spinning Reserve Regulation Down
Source: CAISO SP15 zone, 2011 price data
Studies of CSP with thermal storage using historical hourly prices from California and hourly utility costs from neighboring states have demonstrated that there is tangible value to be obtained from joint optimization of energy and ancillary services. Optimizing CSP production against external fixed prices from 2005, Madaeni et al., (2012) found that, compared to generic parabolic trough plants with no storage, plants with storage could earn up to an additional 17% of their market value from co‐optimized spinning reserve sales (when compared to plants without storage).
Helman and Sioshansi (2012, unpublished) used the optimization model developed for Madaeni et al., (2012) to examine the changes in energy and spinning reserve revenues in other years in California, and also to look at hourly and monthly distributions of revenues not previously reported.43 In 2010‐11, CAISO energy and spin prices were lower than in 2005, and as a result the solar plant earns less total revenues. However, the value of storage, when comparing the plants with and without storage, remains similar, because the difference between energy prices in the daylight and evening hours remain sufficient to provide the added average revenues. In aggregate, the plant with storage earns an additional $4.50/MWh (2010) to $8.50/MWh (2011). Much of the additional revenues comes from sales of spinning reserves, and the additional value in 2011 is due in most part to higher spin prices than in 2010. In addition, as shown in Figure 12, when providing
43 Ramteen Sioshansi, Ohio State University, ran the simulations, with subsequent data analysis by Udi Helman and David Jacobowitz, BrightSource Energy. The simulations used the weather data for the prior Madaeni et al., (2011) study, and hence the results would be expected to be slightly different if 2011 weather data was used.

spinning reserves the monthly distribution of revenues changes notably, because the plant earns more from spinning reserves in the winter and early spring months than in the summer months. This is because energy prices are higher during the afternoon and early evening hours in the summer months and there is less “co‐optimized” value obtained by ithholding from the energy market in those hours to sell spinning reserves. w
Figure 12: Monthly energy and spinning reserve revenues, optimized against CAISO 2011 prices
Source: Helman and Sioshansi (2012, unpublished); these values are expressed in $/MWh of energy production each month, which slightly skews the calculation of spin $/MWh during months with lower
49
energy production and higher spin revenues.
The models discussed above use fixed market prices and assume that, when optimal, the CSP plant with thermal energy storage would be dispatched by the system operator in place of other plants. This result needs to be demonstrated in power system simulations that consider the effect of CSP with thermal energy storage on ancillary service provision by all eligible resources. Denholm and Hummon (2012) model the Colorado‐Wyoming power system using a production simulation and find low but positive avoided costs when CSP provides spinning reserves, but leave detailed analysis of ancillary services to later research. Mills and Wiser (2012b) also find that CSP with thermal storage provides

50
ancillary services within a simplified dispatch model of California, but the value is small, in the range of $1‐ $1.4/MWh. Preliminary (unpublished) work by BrightSource has found that CSP with thermal storage is allocated substantial provision of spinning reserves in southern California using a regional production simulation model, displacing fossil
a gener tion.
Until more detailed production simulation results are available, Table 7 shows the allocation of ancillary service awards in studies of the California ISO under 33% RPS in 2020 (without dispatchable CSP): gas plants supply the majority of spinning reserves and load‐following reserves, with the remainder provided by hydro plants, including pumped storage. The decision by system operators to utilize solar thermal storage for reserves in place of other plants will be based on the avoided fuel and opportunity costs with respect those other plants. Since CSP plants operated from thermal storage have no fuel cost, low thermal losses in storage, and are not arbitraging energy within the day, they will be lower in the reserve bid stack than gas plants or pumped storage. Hence, it is likely that future system studies will demonstrate that the plants would be selected for reserves in a least‐cost dispatch solution.
Table 7: Ancillary service and Load Following Awards by Unit Type (GWh) in CAISO 33% RPS, Trajectory Case
Market Services Unit Type
CCGT DR Gas Turbine
Hydro Oil Pumped Storage
Steam Turbine
Regulation Up 911 782 3,272 329 0 Spinning Reserve 4,691 1,172 1,385 169 19 Non Spin Reserve 36 151 5,462 1 1,779 7 Load Following Up 10,608 3,007 2,312 0 414 86 Regulation Down 2,716 45 2,552 16 6 Load Following Down 14,188 203 2,065 0 7 12
Source: CAISO, July 2011 33% RPS integration study results
Further research into the provision of ancillary services from CSP plants is needed. One area for examination is detailed modeling of how the plants can provide Regulation, which has been identified as having potentially high value in the future (as discussed further in Section 8). In addition, further simulation of regional power systems is needed to demonstrate how CSP plants will contribute to meeting ancillary service requirements. Ideally, the capability to supply emissions‐free ancillary services will be demonstrated as an outcome of dispatch optimization.

51
Conclusions The added energy and ancillary services value of CSP with thermal storage has been shown to be potentially significant when compared to alternative solar technologies. There are differences among studies on the added value at low solar penetration, where the value difference with PV ranges from insignificant (Mills and Wiser, 2012) to a range of $3‐10/MWh from other studies, including those using historical market price data. However, as solar penetration increases, the studies consistently find a growing value gap, which provides an advantage to incremental CSP with thermal storage of up to $20/MWh and higher in energy value when compared to incremental solar PV (Denholm and Hummon, 2012; Mills and Wiser, 2012b).
The convergence in these study findings suggest that utilities and regulators should assign CSP with thermal energy storage the appropriate credit for its provision of ancillary services and dispatchable energy. They should also recognize the difference in marginal energy value of different incremental solar technologies as solar penetration increases.
While the studies to date have focused on modeling hourly blocks of energy and reserves, in the context of significant renewable penetration, the value of the operational flexibility provided by CSP with thermal energy storage could be higher as operational needs increase. Additional research is needed to improve understanding of the ancillary service ratings of actual CSP plants in development or design, and then model both subhourly energy dispatch and Regulation dispatch from solar thermal storage. These additional services can only increase the plant’s market value, since these are higher value services.44
Related to the analysis of energy and ancillary services is assessment of the likelihood of solar energy curtailment during congestion or overgeneration conditions. These additional potential values are discussed in Section 8.
44 That is, historically Regulation prices are higher than spinning reserve prices; load‐following and ramping reserves will also be worth more than offering inflexible energy blocks.

52
7. Resource Adequacy and Longterm Reliability
primary attribute of solar energy is the correlation of its production with annual peak demands. As noted above, this increases the average energy
value of solar plants to the buyer. Solar generation’s daily production pattern also increases its capacity credits and long‐term capacity value. As briefly introduced in Sections 3 and 5, capacity value can be realized either through high energy market prices during periods of supply scarcity, or by establishing explicit Resource Adequacy requirements based on reliability criteria. The requirement calculated for a regional power system (or utility) is typically measured as the forecast peak load and reserve margins for the next year and possibly several subsequent years.45 The aggregate requirement is then assigned proportionally to individual load‐serving entities,46 which must procure capacity equal to that amount by a deadline each year, and make a showing of
A CSP with thermal energy
storage has a high
capacity value in regions
with sufficient solar
insolation, approaching
the capacity rating of
conventional gasfired
generation as storage
capacity is increased. At
the same time, non
dispatchable solar PV has
rapidly declining capacity
value at higher
penetrations. The
difference in capacity
value can be in the range
of $1030/MWh,
depending on location
and scenario.
that capacity to the jurisdictional regulatory entity.47
The “capacity value” of a solar resource is the avoided cost of meeting a power system’s resource adequacy requirement, each year or on a long‐term basis given expected system conditions, and including known generator retirements and additions. The determination of capacity value for a particular generator (typically denominated in $/kW‐year or month) has two steps: first, the assignment of a capacity credit for the generator 45 For example, in California, load‐serving entities have to comply with the resource adequacy requirement on an annual and monthly basis; in other U.S. markets, the capacity markets include multi‐year requirements. Most regions with resource adequacy requirements also differentiate between requirements closer to the pr ach the primary loads. imary loads, and those isolated to some degree by transmission congestion to re
46 “Load‐serving entities” refers to the entity that serves retail customers. 47 In the U.S., the entity with responsibility for compliance with the resource adequacy requirement is either the independent system operator or the state public utility commission.

53
(denominated in percentage of rated maximum output, MW); and second, the multiplication of that credit by the prevailing market price or replacement capacity cost for a particular region. When capacity is scarce, the convention is to use the cost of a new peaking generator to set the default price.
Generally, the cost of complying with this requirement fluctuates with the availability of capacity: when capacity is tight, because load growth or retirement of existing generation is diminishing reserve margins, then the capacity value increases; conversely, if there is over‐capacity, the capacity value diminishes, signaling no need for new entry.
When utilities are comparing different types of renewable technologies for their portfolio, or a system operator is evaluating the next year’s requirements, they may use different measurement methods for assigning capacity credits, depending in part on regulatory standards. The most common method is to identify the annual peak hours when the utility expects to need all available capacity – and hence when outages or unanticipated low renewable energy production would have the greatest chance of leading to loss of load – and to measure the renewable resource’s forecast or actual capacity factor48 during those hours. For example, the California Public Utility Commission’s measurement hours are shown in Figure 13 (note that none of the hours before 12 noon are measured). As shown, in California, a higher weight is put on the mid‐afternoon hours, hours 14 – 18, from April to October, while in the remaining months, a higher weight is placed on the early evening hours because of the higher loads in those hours. In practice, the annual peak loads occur in the summer in most years in California, and so the summer capacity hours are currently considered more important as a measure of total available system resources.
An alternative approach is to calculate probabilistic reliability metrics, typically based on the loss of load probability (LOLP). These types of models determine the portfolio of generation needed to achieve a reliability standard, such as loss of load for a defined number of hours annually, by estimating the probability of unplanned plant outages under different future hourly loads, representative of a full operating year (e.g., Sioshani and Denholm, 2010). Renewable generation can be introduced into this analytical framework. A variant of this type of model calculates the effective load carrying capacity (ELCC) of a wind or solar plant, which measures the additional load that can be added for a MW of
48 Capacity factor is the percentage of a generator’s total actual or forecast output over some period being measured. For example, a 100 MW gas turbine that only operates for 5% of the year, has a capacity factor of 5%. For a 100 MW wind or solar plant, whose output fluctuates hour to hour, the capacity factor is actual annual production divided by 100 MW × 8760 hours. The annual capacity factor calculation does not indicate in which hours of the day a plant operates, only that it does operate. Capacity factor measured during particular hours, such as those measured to meet resource adequacy requirements, refers to the production in those hours using a statistical measure, such as the average or the production exceeded in a percentage of the hours.

54
wind and solar while maintaining the same reliability standard. For example, if 100 MW of wind generation can support a 30 MW increase in a utility’s load, then wind obtains an ELCC value of 1/3 of nameplate capacity, or 30 MW. As a general finding, if the capacity factor hours shown above are closely correlated with the hours with greatest loss‐of‐load probability, then the two measurement methods would result in similar capacity credits to wind and solar (Denholm and Sioshansi, 2011).
There can be other adjustments made to the calculation of these capacity credits. For example, if there is sufficient data on the correlation of wind and solar production at different locations in a region, then a geographically diverse portfolio could have a better capacity value than an individual plant. The California resource adequacy rules allow utilities to account for this value.
Figure 13: Resource Adequacy hours (orange shading) in California, by month
Hour Ending: Jan Feb Mar Apr May Jun Jul Aug Sep Oct Nov Dec
12 0 0 0 0 0 0 0 0 0 0 0 0 13 0 0 0 0 0 0 0 0 0 0 0 0 14 0 0 0 1 1 1 1 1 1 1 0 0 15 0 0 0 1 1 1 1 1 1 1 0 0 16 0 0 0 1 1 1 1 1 1 1 0 0 17 1 1 1 1 1 1 1 1 1 1 1 1 18 1 1 1 1 1 1 1 1 1 1 1 1 19 1 1 1 0 0 0 0 0 0 0 1 1 20 1 1 1 0 0 0 0 0 0 0 1 1 21 1 1 1 0 0 0 0 0 0 0 1 1 22 0 0 0 0 0 0 0 0 0 0 0 0 23 0 0 0 0 0 0 0 0 0 0 0 0 Source: California Public Utilities Commission
Comparing Capacity Value of Incremental CSP to PV Under Current Conditions Using either of these approaches – the capacity factor methods and the probabilistic reliability standard methods – it is possible to compare solar to wind resources, and also evaluate different solar technologies. In locations with high direct normal irradiation, CSP technologies generally obtain a high capacity value, particularly in the summer months when cloud cover is minimal (e.g., Madaeni et al., 2011). There are also differences among solar technologies. To help illustrate why these differences occur, Figure 14 below compares clear‐day production from a 200 MW fixed‐tilt PV plant to a conventional 200 MW CSP plant with the capability to track sun position but without thermal storage. The figure also shows the summer Resource Adequacy measurement hours in California. As a general matter, because the fixed‐tilt PV production doesn’t match the CSP plant’s ability to

generate as many MW in the highest capacity value hours, the PV plant is rated at a lower capacity credit.
Figure 14: Comparing fixed‐tilt PV to CSP production (without storage) and summer California Resource Adequacy hours
There is an extensive literature quantifying the capacity credits of different renewable resources, which vary by technology and location (as well as the methodology used). Table 8 shows the “on‐peak availability” rating that the California Public Utility Commission determined on the basis of the capacity factors of different renewable resources during the top peak load hours of the year. This shows that CSP obtains the highest capacity credits of any renewable resource, with a range of 77% ‐ 83% of its maximum output, depending on location.
00.10.20.30.40.50.60.70.80.91
0
50
100
150
200
250
HE1
HE2
HE3
HE4
HE5
HE6
HE7
HE8
HE9
HE10
HE11
HE12
HE13
HE14
HE15
HE16
HE17
HE18
HE19
HE20
HE21
HE22
HE23
HE24
MW
Summer NQC Hours PV Output CSP Output
Table 8: California Public Utility Commission rankings of on‐peak availability of different renewable technologies
Resource Type On‐Peak Availability Factor CSP without Storage 71% ‐ 87% Tracking Solar PV 65% Fixed Tilt Solar PV 51% Wind 16%
55
Source: CPUC RPS calculator
With the addition of thermal energy storage, the CSP plant can increase its on‐peak capacity factor or any other reliability metric. Sioshansi and Denholm (2010) and Madaeni

56
et al., (2011. 2012) show the relationship of the solar field size, number of hours of storage and capacity value for a parabolic trough plant with thermal energy storage. As shown in Figure 14, they find that in regions with high direct normal insolation, the capacity rating of the plant increases from 80 – 85% of nameplate, depending on the initial size of the solar field, to close to 100% with the addition of 4‐5 hours of thermal energy storage.
Figure 15: Calculation of capacity value as a percentage of nameplate capacity of a parabolic trough in Southern California (Daggett)
Source: Madaeni et al., (2012), pg. 343.
Comparing Capacity Value of Incremental Solar Generation at Higher Penetrations A large number of studies have shown that as solar penetration increases, incremental additions of PV and CSP plants will face progressively declining capacity value – unless they include types of storage that can shift production to hours of greater resource adequacy

57
need.49 In effect, this raises the net system cost of these incremental resources, because the capacity credits need to be procured from other eligible resources. Mills and Wiser (2012a) have summarized some of these study findings, which are depicted in Figure 15.50 A general finding across systems is that by penetrations of 5 – 10% by energy, the incremental capacity value of PV systems is significantly diminished, although more so in some regions than others.
As regions plan toward significant increases in solar production, this long‐term resource adequacy question needs to be anticipated in planning and procurement decisions earlier rather than later (see also, Mills and Wiser, 2012a). For example, in California, the solar PV energy anticipated under forecasts for 33% RPS, as described in Appendix A, is within the band of 5 – 10% of annual energy, and in some cases more. There is no definitive study yet for any region, so this section instead brings together some available results for California to gain insight both into what is known and what further analysis needs to be done.
49 As solar production increases during the daylight hours, each incremental MW has lower capacity value because the energy being provided is inflexible – it can only occur during sunlight hours. That is, the solar power profiles in Figure 14 can only increase upwards within the graphed production hours, they cannot shift to any other hours. However, as depicted in Figure 8, as energy demand continues to grow over time, each increment of residential and some commercial load creates demand across the day, and these early evening hours and later overnight hours capacity requirements cannot be served by non‐dispatchable solar. Moreover, if new evening and overnight loads emerge, such as electric vehicles that are charged overnight, then this effect will become more marked. These evening “net load” demands that require new generation eventually will be greater than the afternoon peak hour net loads. Hence, eventually, new reliable resources are needed to meet that expanding overnight demand.
50 Please refer to Mills and Wiser (2012a) for the references cited in the figure. In Mills and Wiser (2012a), this figure has the following accompanying notes, which are presented here verbatim: Perez et al (2008) assumes fixed PV with 30 degree tilt. Mills and Wiser (2012b) assume single‐axis tracking with latitude tilt. GE Energy (2010) and Olson and Jones (2012) use solar PV profiles from a mixture of fixed and tracking PV. Original capacity credit from GE Energy (2010) was reported based on DC nameplate capacity, here it is converted to AC nameplate capacity. The scenarios with PV also have increasing penetrations of CSP with thermal storage and wind. Capacity credit reported from Perez et al. (2008) is based on their estimate of the effective load carrying capability of PV (ELCC). Capacity penetration used in Perez et al. (2008) is converted to energy penetration assuming: NV Power load factor is 42% (based on NV Energy 2012 IRP), NV Power PV capacity factor is 23% (estimated from NREL Solar Advisor Model), PGE load factor is 58% (based on PGE 2009 IRP) and PGE PV capacity factor is 17% (based on PGE 2009 IRP).

58
Figure 16: Survey of PV capacity credit estimates with increasing penetration levels
Source: Mills and Wiser, 2012a
The capacity valuation of solar technologies in California is based on the Resource Adequacy rules described above, and does not currently reflect the effect of increasing solar penetration on capacity credits. However, several recent studies have noted significant declines in solar capacity value at higher penetrations in the state, although reaching slightly different conclusions on the rate of value decline. Denholm and Mehos (2011) have conducted an initial evaluation of the effect of increasing energy penetration of different wind and solar technologies on capacity value in California. Figure 8 above, illustrates their finding graphically for the 24 hours of a simulated high load summer day on the California grid. As a starting point, they note that there is very little penetration by other renewable resources in this case – wind and geothermal account for under 3,000 MW of production on the day pictured – but that this does not distract from the objective to measure how PV energy affects the net load. They find that “at fairly low penetration (on an energy basis) the value of PV capacity drops” (pg. 3). In this analysis, the significant decrease in PV capacity value takes place between the 6% and 10% penetration curves. They conclude that “beyond this point PV no longer adds significant amounts of
firm capacity to the system.”
Mills and Wiser (2012b) use a detailed dispatch model of long‐term generation investment in California to calculate capacity value to variable generation based on the ability of those generators to displace additions of conventional generation. In this study, when capacity is tight, the model triggers shortage pricing of energy, allowing alternative types of generation that can meet the capacity need to earn sufficient revenues if they enter. Hence, as non‐dispatchable PV or CSP solar generation increases, the shortage price is triggered when the system runs short on capacity in the shifted net load peak. Notably, between 10‐

59
15% penetration in this model, PV has reached the same capacity value as wind resources, and its remaining incremental value declines rapidly after that.
Figure 16 shows the Mills and Wiser (2012b) results for capacity value by technology type, which are similar to the NREL results, although different in the timing of the decline of incremental PV capacity value. Of the alternative wind and solar resources, only the dispatchable solar resources can earn sufficient capacity credits in high penetration scenarios to retain their capacity revenues. The value of capacity for the plants with 6 hours of thermal storage ranges from $37/MWh at low penetration to $15/MWh at high penetration (30% energy). In contrast, the capacity value for wind and non‐dispatchable
lsolar resources may diminish to a most $0 at such high penetrations.
Denholm and Hummon (2012) model the Colorado‐Wyoming power system using a production simulation model at the renewable penetrations noted in the prior section. They calculate capacity credit for solar resources by examining simulated output during hours of the highest net demand, and then multiplying the credit by the avoided cost of new generation in the region, based on utility estimates. At low penetration, because they model “equivalent energy” scenarios for the solar resources, CSP with 6 hours of thermal storage actually produces less energy during the highest net demand hours and gets a lower capacity value than CSP without storage or PV. However, in the high penetration scenario, due to the shifting net load peak hours, CSP with storage has a $11.7 – 30.5/MWh higher value than PV projects (with the range created by different net costs for new combustion turbines and combined cycles).
These various studies differ also in their assumptions about the cost of new generation, in part due to differences in the regions studied, but also to their data sources. Even with their differences, the findings of these initial studies suggest that CSP with thermal storage would be significantly undervalued when compared to PV as alternative incremental additions to the solar portfolios already contracted in California and other regions considering high solar penetration. Additional research is clearly needed to clarify the range of solar capacity valuations in different penetration scenarios.

60
Figure 17: Marginal Capacity Value ($/MWh) by Penetration of Solar and Wind Technologies – Mills and Wiser (2012b)
05
1015202530354045
0% 2.5% 5% 10% 15% 20% 30%
$/MWh
% of Annual Energy, By Technology
50
CSP with 6 hours of storage CSP with no storage PV Wind
Table 9: Capacity value results from selected studies of CSP with thermal storage that model increasing solar penetration
Study Location and Date
Technology Methodology/ Metric
Baseline Solar
Renewable penetration
Added Capacity Value
Denholm and Hummon, 2012
Colorado‐Wyoming
Trough with 6 hours of storage, Solar multiple 2.0
Capacity factor approximation during peak hours
Single axis tracking PV
25.5% wind, 8.2% PV
$11.7 – 30.5/MWh
Mills and Wiser, 2012b
California Trough with 6 hours of storage, Solar multiple 2.5
Modified capacity expansion model with simplified dispatch
Single axis tracking PV
5% PV (no other renewable energy)
$10/MWh
Mills and Wiser, 2012b
California Trough with 6 hours of storage, Solar multiple 2.5
Modified capacity expansion model with simplified dispatch
Single axis tracking PV
10% PV (no other renewable energy)
$22/MWh
Mills and Wiser, 2012b
California Trough with 6 hours of storage, Solar multiple 2.5
Modified capacity expansion model with simplified dispatch
Single axis tracking PV
15% PV (no other renewable energy)
$16/MWh

61
Capacity Resources with Flexible Operational ttributes In many regions with increasing penetration of wind and solar technologies, new approaches to capacity requirements are under consideration, to ensure adequate operational attributes of retrofitted or new capacity resources (e.g., Lannoye et al, 2012). Such market rules may result in multiple classes of capacity, for example, differentiated by ramp rate and/or start‐up times. This development reflects a concern that future capacity additions may not have the operational flexibility needed to integrate variable energy resources, and that the short‐term price signals sent through energy and ancillary service
A
markets will be insufficient to signal major long‐term operational needs.
CSP with thermal energy storage, depending on the plant design, can contribute towards utilities’ evolving flexible capacity requirements. As noted above, once synchronized with the grid, these plants offer fast ramp rates, subject to any operational or contractual constraints. Based on industry discussions, start‐up times are not especially fast from cold conditions on thermal energy storage systems, but can be reasonably fast from warm or hot conditions.
Conclusions CSP with thermal energy storage is already understood to have potentially (depending on the number of hours of storage), the highest capacity value of any variable renewable resource. In addition, in the California power system, several studies have pointed to the declining capacity value of inflexible solar resources at penetration increases. However, there remains research to be done, including further work on regional power system simulations to clarify the capacity value of high penetration solar energy scenarios with and without CSP with thermal energy storage.
In addition, utilities and regulators should recognize the difference in marginal capacity value of different solar technologies as solar penetration increases, award CSP with thermal energy storage the appropriate credit for its retained capacity value as solar production increases and evaluate the operational attributes of CSP with thermal energy
ements. storage as contributions to future flexible capacity requir

62
8.
to their variability and higher degree of forecast certainty, as well as to their operational lexibility, wind and non‐dispatchable solar n increase certain types of power system al needs as penetrations increase, and possibly physical operating constraints
Integration and Curtailment Costs
ueuninf
productiooperationencounterrequire inrenewablthat can bshould becosts of al
51 that could frastructure upgrades or result in curtailment of e energy. These factors create integration costs e avoided by CSP with thermal storage, and thus considered when considering the net system rte native renewable portfolios.
Integration analysis is generally divided into two key questions:
D
System requirements. What are the system operational needs and binding constraints under different renewable scenarios?
System capabilities. What are the capabilities of existing generation and non‐generation resources to meet those needs and relieve those constraints? When are new resources needed to support additional integration of renewable energy? In addition, what is the optimal mix of such resources needed over time to meet policy goals?
There is now an extensive research literature on these topics.52 As renewable portfolios expand, estimates of these integration requirements and costs are increasingly being used by utilities and regulators to influence the mix of renewable resources that they procure. The integration costs are obviously just one component of the “net system cost” equation described above, but one that has attracted more policy attention recently as some regional power systems move rapidly to very high penetrations of renewable energy. In regions where CSP with thermal energy storage is a viable technology, it should thus be evaluated as a component of a long‐term solution to reduce renewable integration costs (Denholm
CSP with thermal energy
storage has minimal
requirements for system
integration and can also
provide services to
integrate other solar and
wind resources. In
addition, dispatchable
solar energy can reduce
the likelihood of
curtailment of solar
energy as solar PV
penetration increases.
The avoided integration
costs could be in the
range of $510/MWh.
51 Such as system ramping limits or conditions of surplu52 E.g., surveys in Milligan, M., et al., (2009); DOE 2012.
s energy or “overgeneration”.

63
and Mehos, 2011). One method for quantifying this value is to analyze the integration costs of solar portfolios that consist of different mixes of flexible and inflexible generation, a research agenda that has begun but needs further analysis (e.g., Denholm and Mehos, 2011; Mills and Wiser, 2012b).
Renewable Integration Requirements There are several types of integration requirements for variable wind and solar generation. These include most notably the fo oll wing:
Increased system ramps. As renewable penetration increases, both predictable and more variable system ramps will increase in magnitude and duration.
Increased intrahourly loadfollowing. Because of the combination of forecast error and actual real‐time variability, system operators must commitment sufficient flexible generation to fo oll w wind and solar production on a 5 – 10 minute basis.
Increased Regulation. In between dispatch of generation, system operators will require additional automated generation or storage response to solar and wind variability.
The provision of these services may require retrofits of existing conventional generation and hydro plants to provide greater operating flexibility, and consideration of what generation and non‐generation resources are needed over time, as a key component of long‐term resource planning.
Integration Costs Analogously to the calculation of the value of storage, the calculation of integration costs associated with variable energy resources requires determination of a baseline case. In the current literature, several such baselines have been used, including a “flat block” of energy and a base‐case in which no additional renewables are added to the power system to meet some future year’s load growth (Milligan et al. 2011). For calculation of the added integration costs of variable wind and solar is by comparison to a case where the renewable energy is not variable but can be dispatched to the daily load pattern (ignoring any other operational considerations). From that baseline, the added costs of integration would include the start‐up and fuel costs of having to bring more expensive fossil‐fueled units on‐line for purposes of providing additional reserves and ramping flexibility, and additional O&M of existing units due to increased wear and tear.
The costs of integrating wind and solar generation have been assigned a wide range of values, as a function of the region being studied and the level of penetration of one or both technologies. In the northwestern U.S., several utilities charge wind balancing charges, which currently range from $3.60/MWh to about $9.50/MWh.

64
Other estimates of integration costs are from simulations. A semi‐annual survey of wind integration costs (DOE 2012) finds a wide range of values depending on the penetration being modeled, up to about $11/MWh but with most results in the range of $2‐8/MWh.
There are fewer studies focused on solar integration, including CSP. Notably, the impact of solar power appears to be largely in the effect on system ramps of the morning and evening solar ramps, which although largely predictable on most days, creates a major interaction with load and wind variability that appears to cause integration costs to spike up in the late afternoon (see discussion below). Mills and Wiser (2012a) cite a range of $2.50 – 10/MWh used in solar valuation by the utilities that they surveyed. The NV Energy utility in Nevada, U.S., found that integration costs increase from $3/MWh to just under $8/MWh as installed capacity of grid‐based and distributed PV increases from 150 MW to 1042 MW (including the costs of having to curtail some of the PV facilities to maintain reliability). Since NV Energy is a vertically‐integrated utility, the study only calculated changes in production costs.53
Mills and Wiser (2012b) calculate that the day‐ahead forecast errors associated with CSP with 6 hours of thermal storage imposes a cost of $1‐2/MWh, which is $3‐5/MWh less than the corresponding costs of CSP without storage or solar PV.
However, most of these estimates are the additional variable costs of providing additional reserves and ramping, and assume that no new infrastructure is needed for purposes of renewable integration. In addition, some studies add simulated curtailed wind and solar production to the calculation of integration costs (e.g., Navigant et al., 2011). A formal study of how CSP with thermal storage reduces integration costs has not yet been completed, although, as discussed below, some recent and forthcoming studies are providing insight into this question (e.g., Mills and Wiser, 2012b).
Allocation of Integration Costs As noted, in at least some regions, wind integration costs are already allocated directly to renewable projects seeking transmission services to serve external buyers located in a neighboring power system. In other regional systems, such as the California ISO market, there is some sharing of real‐time imbalance charges assigned to wind and solar resources between sellers and buyers, and the wholesale buyers currently pay for all ancillary services; however, rules are being developed to allocate portions of imbalances caused by variable generation back to the scheduler of the generation, including possible ramping reserves.
53 Note that the study does not include other actual integration costs, such as additional O&M costs or emissions associated with increased starts and stops, ramping, or maintaining gas‐fired generation at minimum operating levels, nor does it address the integration costs of distributed PV, as it focused only on grid‐based projects.

65
The CSP sector does not at this time have a uniform view on allocation of integration costs. Direct allocation of integration costs to variable energy resources has the potential result to adjust further the relative net system costs of energy from renewable technologies, which would improve the valuation of CSP with thermal energy storage. On the other hand, calculation of renewable integration costs has been shown to be difficult to implement accurately (e.g., Milligan et al., 2011) and will likely vary from year to year reflecting the costs of the resources used for integration. Hence for purposes of comparative valuation over the next few years, there will be continued uncertainty about long‐term integration costs and debate over how to use such cost estimates for valuing alternative solar resources. For utilities or regulators considering how to factor integration costs into procurement decisions regarding CSP with thermal energy storage, some judgment will be required based on simulations of the power system. To provide further insight into how CSP with thermal storage could provide significant avoided costs of integration, some specific applications are examined in the next section.
Focus on Integration Requirements and Costs under California’s 33% RPS As renewable penetration increases, California, and other parts of the southwestern U.S., will begin to experience a new kind of daily energy production profile, in which wind production often ramps down just as the morning solar ramp up begins, while solar production ramps down in the late afternoon often coinciding with the evening upward ramp of wind, and in some seasons an evening load peak. On some days, the system operators will have to ramp up large amounts of other resources to compensate for these rapid changes in renewable production, and then have to ramp down rapidly as system conditions change within the hour, or vice‐versa. Similar conditions are likely in many regions with high solar potential.
To explore the possible contribution of CSP with thermal storage to mitigating these system ramps, the examples shown here began from the CPUC’s “Trajectory” Scenario54 for renewable resources operational by 2020, which had almost 4,000 MW of CSP (none with dispatchable thermal energy storage) as well as close to 5,000 MW of utility‐scale and distributed PV and just over 9,000 MW of in‐state wind generation. Each renewable project is modeled on an hourly basis with a forecast production profile, allowing for some insight into how production changes on those hourly time‐frames. The California ISO has also released data on the hourly load‐following and Regulation requirements calculated for this portfolio, which can give insight into the expected intra‐hourly variability on time‐scales of minutes.
54 The CPUC’s 2010 version of the Trajectory Scenario is used.

66
To obtain insight into the hourly integration requirements, and how they might be related to the operations of CSP with thermal energy storage, BrightSource examined the data sets for hourly patterns.55 One finding in the data sets is that a large quantity of the additional operational needs appear to be associated with the mid‐morning and late afternoon solar ramps, and the interaction of those ramps with wind ramps and load variations. This is shown in Figure 17 and Figure 18, which plot the average hourly load‐following up and down requirements, respectively, calculated by the CAISO for 33% RPS case used here. Figure 17 shows the spike in load following up requirements in the early evening hours corresponding to the solar ramp down and continued need in the overnight hours due to wind production.56 What is notable is that CSP with thermal storage will have achieved maximum charge for the day just as the system needs the capability to follow net load in the upwards and downwards direction. Since the operational requirements is a function of the actual net load, the next section shows that by modifying the net load ramp, CSP with thermal storage can reduce the quantities of load‐following capacity that the system operator may have otherwise committed, lowering dispatch costs and emissions.
There is also an increase in Regulation requirements in the late afternoon, because similarly to load‐following, Regulation procurement is affected by a combination of forecast error and net load variability. Figure 19 and Figure 20 show the total simulated Regulation Up and Regulation Down requirements by hour and month for the 33% RPS Trajectory case.57 The plants with thermal storage are well suited to address the late afternoon spike in Regulation Up requirements; some plants may also be suited to providing the increased Regulation Down requirements in the mid‐morning. The plants could also provide egulation Down over the evening, depending on their optimal dispatch points. R
55 itz at BrightSource; for additional The analysis was conducted by Udi Helman and David Jacobowmethodological details, see Appendix B. 56 This calculation was done using the CAISO 33% RPS data sets. 57 The improvements in forecast error are shown in CAISO (2011) [Testimony of Mark Rothleder].

67
Figure 18: Estimated Hourly Load Following Up Requirements (MW) Calculated in CAISO 33% RPS Trajectory Case, with (Improved) Hour Ahead Errors, by Month
‐
500
1,000
1,500
2,000
2,500
3,000
3,500
0 1 2 3 4 5 6 7 8 9 10 11 12 13 14 15 16 17 18 19 20 21 22 23
MW
Hour
Jan Feb Mar Apr May Jun
Jul Aug Sep Oct Nov Dec
Figure 19: Estimated Hourly Load Following Down Requirements (MW) Calculated in CAISO 33% RPS Trajectory Case, with (Improved) Hour Ahead Errors, by Month
‐
500
1,000
1,500
2,000
2,500
3,000
3,500
0 1 2 3 4 5 6 7 8 9 10 11 12 13 14 15 16 17 18 19 20 21 22 23
MW
Hour
Jan Feb Mar Apr May Jun
Jul Aug Sep Oct Nov Dec

68
Figure 20: Estimated hourly Regulation Up requirements (MW) calculated in CAISO 33% RPS Trajectory case, with (improved) hour‐ahead errors, by month
‐
200
400
600
800
1,000
1,200
0 1 2 3 4 5 6 7 8 9 10 11 12 13 14 15 16 17 18 19 20 21 22 23
MW
Hour
Jan Feb Mar Apr May Jun
Jul Aug Sep Oct Nov Dec
Figure 21: Estimated hourly Regulation Down requirements (MW) calculated in CAISO 33% RPS Trajectory case, with (improved) hour‐ahead errors, by month
‐
100
200
300
400
500
600
700
800
900
0 1 2 3 4 5 6 7 8 9 10 11 12 13 14 15 16 17 18 19 20 21 22 23
MW
Hour
Jan Feb Mar Apr May Jun
Jul Aug Sep Oct Nov Dec

69
To date, there have been few published estimates of wind and solar integration costs in California as renewable penetration proceeds to the 33% RPS target by 2020. To get a sense of how these costs might be distributed over the day, using the data and cost estimates prepared for 2010 long‐term procurement planning studies conducted by the CPUC and CAISO, BrightSource estimated that total costs of additional reserves and real‐time ramping requirements for renewable integration at 33% RPS is over $200 million per year. The assumptions and methodology are presented in Appendix B. Figure 21 shows how the total integration costs ($ million) are distributed on average by hour of day, as well as in $/MWh of the modeled wind and solar production in that hour. On average, the costs are about $5‐6/MWh. However, they would be higher if not all the assumptions in the CAISO simulations are correct, and particularly if the California IOUs have to make additional investments in flexible generation and non‐generation resources.
During the hours when most solar energy is produced, integration costs can be as low as $1‐2/MWh per unit of renewable production in those hours. However, integration costs can rise as high as $20/MWh during the solar ramp down and evening load pick‐up (due in part to the smaller quantity of renewable energy on the system in that hour). As shown in the blue shading, this is also the period when CSP with storage are fully dispatchable, and when they can have the biggest impact on reducing integration costs.
Figure 22: Estimated hourly distribution of integration costs in $ million and $/MWh, caused by wind and solar resources in California under 33% RPS
0
5
10
15
20
25
02468
101214161820
1 2 3 4 5 6 7 8 9 10 11 12 13 14 15 16 17 18 19 20 21 22 23 24
$/MWh
$ million
HourTotal Cost Average Cost Per MWh of Wind and Solar
Source: CAISO (2011) 33% RPS simulation data

70
Using CSP with Thermal Energy Storage to Mitigate System Ramps A key measure of future operational needs is the rate and persistence of system ramps as wind and solar production increases. As noted above, the key new measure of ramping will be the “net load” ramp – the ramp that occurs from the interaction of load and the sum of wind and solar production. At times, as shown in Figure 7, this interaction will exacerbate current system ramps, particularly in the late afternoon when the ramp down of solar production could coincide in key months with increasing load and in some hours, decreasing wind production. At other times, the significant net load ramps could take place in the mid‐morning, when solar production increases ahead of the load increase, or even in the overnight hours on high wind days.
To illustrate how the net load ramps change over time with increasing solar penetration, Figure 22 by Denhom and Mehos (2011) shows that as PV penetration increases incrementally from 0% ‐ 10%, the frequency of high net load ramps, which they define as 4,000 MW/hour and above, greatly increases. Separately, BrightSource evaluated the net load data in the California ISO 33% RPS data to identify in which hours the highest net load ramps take place. Not surprisingly, as shown in Figure 23, most of the highest upward net load ramps take place in the late afternoon and early evening, coincident with the solar ramp down and, in some seasons, the evening load pick‐up.
Figure 23: Ramp Duration Curve in California with PV Penetration from 0% – 10% ‐‐Denholm and Mehos (2011),
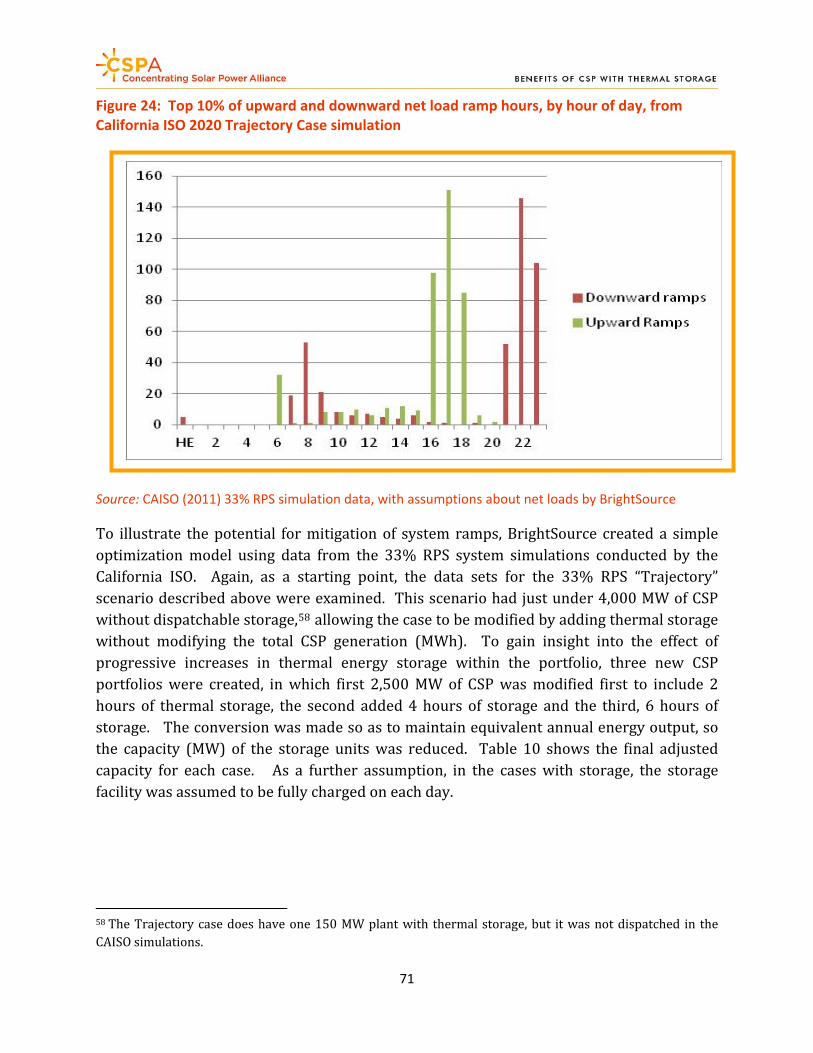
71
Figure 24: Top 10% of upward and downward net load ramp hours, by hour of day, from California ISO 2020 Trajectory Case simulation
Source: CAISO (2011) 33% RPS simulation data, with assumptions about net loads by BrightSource
To illustrate the potential for mitigation of system ramps, BrightSource created a simple optimization model using data from the 33% RPS system simulations conducted by the California ISO. Again, as a starting point, the data sets for the 33% RPS “Trajectory” scenario described above were examined. This scenario had just under 4,000 MW of CSP without dispatchable storage,58 allowing the case to be modified by adding thermal storage without modifying the total CSP generation (MWh). To gain insight into the effect of progressive increases in thermal energy storage within the portfolio, three new CSP portfolios were created, in which first 2,500 MW of CSP was modified first to include 2 hours of thermal storage, the second added 4 hours of storage and the third, 6 hours of storage. The conversion was made so as to maintain equivalent annual energy output, so the capacity (MW) of the storage units was reduced. Table 10 shows the final adjusted capacity for each case. As a further assumption, in the cases with storage, the storage acility was assumed to be fully charged on each day. f
58 The Trajectory case does have one 150 MW plant with thermal storage, but it was not dispatched in the CAISO simulations.
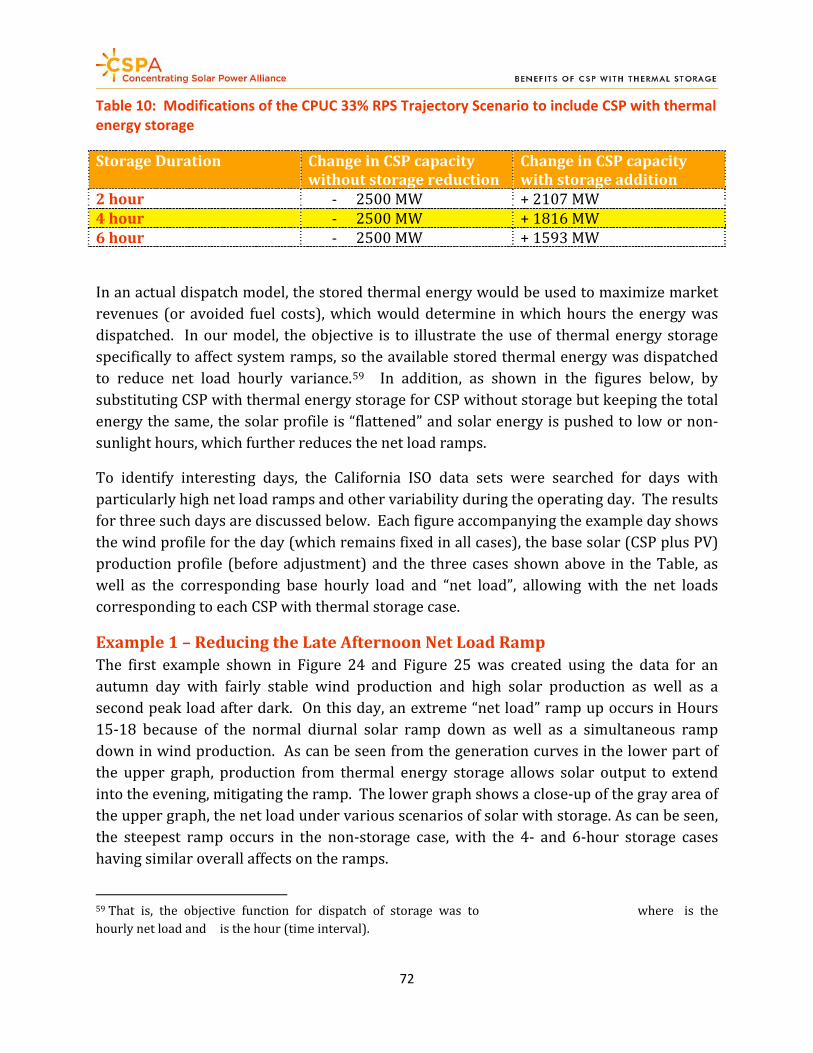
72
Table 10: Modifications of the CPUC 33% RPS Trajectory Scenario to include CSP with thermal energy storage
Storage Duration Change pacity in CSP cawithou reduction t storage
Change in CSP capacity with storage addition
2 hour ‐ 2500 MW + 2107 MW 4 hour ‐ 2500 MW + 1816 MW 6 hour ‐ 2500 MW + 1593 MW
In an actual dispatch model, the stored thermal energy would be used to maximize market revenues (or avoided fuel costs), which would determine in which hours the energy was dispatched. In our model, the objective is to illustrate the use of thermal energy storage specifically to affect system ramps, so the available stored thermal energy was dispatched to reduce net load hourly variance.59 In addition, as shown in the figures below, by substituting CSP with thermal energy storage for CSP without storage but keeping the total energy the same, the solar profile is “flattened” and solar energy is pushed to low or non‐
c sunlight hours, which further redu es the net load ramps.
To identify interesting days, the California ISO data sets were searched for days with particularly high net load ramps and other variability during the operating day. The results for three such days are discussed below. Each figure accompanying the example day shows the wind profile for the day (which remains fixed in all cases), the base solar (CSP plus PV) production profile (before adjustment) and the three cases shown above in the Table, as well as the corresponding base hourly load and “net load”, allowing with the net loads corresponding to each CSP with thermal storage case.
Example 1 – Reducing the Late Afternoon Net Load Ramp The first example shown in Figure 24 and Figure 25 was created using the data for an autumn day with fairly stable wind production and high solar production as well as a second peak load after dark. On this day, an extreme “net load” ramp up occurs in Hours 15‐18 because of the normal diurnal solar ramp down as well as a simultaneous ramp down in wind production. As can be seen from the generation curves in the lower part of the upper graph, production from thermal energy storage allows solar output to extend into the evening, mitigating the ramp. The lower graph shows a close‐up of the gray area of the upper graph, the net load under various scenarios of solar with storage. As can be seen, the steepest ramp occurs in the non‐storage case, with the 4‐ and 6‐hour storage cases having similar overall affects on the ramps.
59 That is, the objective function for dispatch of storage was to where is the hourly net load and is the hour (time interval).

73
Example 2 – Intermittently Cloudy Day, Large Variation in Solar Generation In the next example, shown in Figure 26 and Figure 27, the operational requirements caused by solar output across the day are quite different. Because this is a mid‐summer day in which the load curve correlates well with solar production, the morning and afternoon net load ramps are not significantly different from the load ramps. Instead, cloudy weather causes solar production to vary significantly during the day and thus requires reasonably large back‐up from other resources. In this day, which uses the data from a mid‐summer day, the thermal energy storage has been dispatched primarily to address the large ramp in the afternoon, in Hours 17‐20. The figures show the smoothing effect by which solar storage is dispatched quite effectively to reduce system ramp rates, and 4‐6 hours of storage is practically able to eliminate the solar ramps. However, there is some small smoothing effect even in morning and midday. Though the midday variation remains, the solution was most improved by reducing the afternoon changes.
Example 3 – Rapid Changes in Net Load Ramp Direction System operators are concerned about predictable but rapid ramps in one direction, but they are even more concerned about rapid, significant ramps that change directions in a short time‐interval. This effect was illustrated to some degree in Example 2, but Figure 28 and Figure 29 show a more extreme example. On this spring day in California, light load is combined with relatively stable wind output but more variable solar output. Most notably, solar output drops off sharply in the mid‐morning, around Hour 9, before recovering in the hour after. The coincidence of the solar ramp down with the morning load ramp up exacerbates the “net load” ramp. This creates a “V” shaped system ramp that first requires other generators to be ramped up rapidly and then immediately ramped down rapidly. Uncertainty about the timing and distribution of the cloud cover that caused this situation would lead to even additional generation being placed on reserve. As the figure shows, energy from thermal storage can be dispatched very effectively against such variability. The net load variation under the storage scenarios is greatly diminished. Because the event is of relatively short duration, even the 2 hour storage system is able to significantly improve the ramp. The additional storage from the 4‐ and 6‐hour systems is mostly dispatched in the later hours of the day – Hours 18‐22 – to reduce the net load ramp in those hours.
These examples demonstrate the capabilities of thermal energy storage for individual days, but detailed simulation is needed for more systematic analysis.

74
Figure 25: Example 1(a) ‐ Impact of Thermal Energy Storage on High Late Afternoon Net Load Ramp
Figure 26: Example 1(b) ‐ Impact of Thermal Energy Storage on High Late Afternoon Net Load Ramp – additional detail on net load ramps
Effect of ramp smoothing with additional thermal storage

75
Figure 27: Example 2(a) ‐ Impact of Thermal Energy Storage on High Midday Variability
Figure 28: Example 2(b) ‐ Impact of Thermal Energy Storage on High Midday Variability – additional detail on net load ramps

76
Figure 29: Example 3(a) ‐ Impact of thermal energy storage on rapid changes in net load ramp direction
Figure 30: Example 3(b) ‐ Impact of thermal energy storage on rapid changes in in net load ramp direction – additional detail on net load ramps

77
Curtailment of Solar Energy As additional wind and solar energy is added to power systems, other generation plants have to both be displaced, and operated more flexibly to accommodate the renewable energy, and sufficient transmission capability needs to be available to transmit power from generating plants to the loads. When there are operational or transmission constraints on renewable energy scheduling, which can take place during day‐ahead scheduling or in real‐time operations, then there may be surplus energy on the power system and some renewable generation needs to be backed down or curtailed. This can be seen as another type of integration cost, because the curtailed renewable energy is lost and the capacity factor of the renewable generator is thus reduced (see, e.g., Denholm and Mehos, 2011).
Significant curtailments of wind generation have already been experienced in many power systems, due to different and sometimes transitory system constraints, whether surplus renewable energy, transmission congestion or ramping constraints. In the United States, examples include high curtailments during spring wind production in West Texas due primarily to transmission constraints and in the Bonneville Power Administration (BPA) due to regulatory and operational limitations on hydro flexibility. Based on the survey shown in Table 11 below, over 2010‐11, almost 5% of wind production was curtailed on average each year in the United States, with higher curtailments, as a percentage of total potential energy, in regions with higher wind penetration.
Table 11: Selected Examples of Wind Curtailment in GWh in the United States, 2007‐2011 and as % of Potential Wind Generation
2007 2008 2009 2010 2011 Electric Reliability Council of Texas (ERCOT)
109 (1.2%)
1,417 (8.4%)
3,872 (17.1% )
2,067 (7.7%)
2,622 (8.5%)
Southwestern Public Service Company (SPS)
N/A 0(0.0%)
0 (0.0%)
0.9 (0.0%)
0.5 (0.0%)
Public Service CompanyColorado (PSCo)
of N/A 2.5 (0.1%)
19.0 (0.6%)
81.5 (2.2%)
63.9 (1.4%)
Northern States Power Company (NSP)
N/A 25.4 (0.8%)
42.4 (1.2%)
42.6 (1.2%)
54.4 (1.2%)
Midwest Independent MISO), System Operator (
less NSP
N/A N/A 250 (2.2%)
781 (4.4%)
657 ( 3.0%)
Bonneville Power Administration (BPA)
N/A N/A N/A 4.6 (0.1%)
128.7 (1.4%)
Total Across These Six Areas: 109 (1.2%)
1,445 (5.6%)
4,183 (9.6%)
2,978 (4.8%)
3,526 (4.8%)
Source: GE Consulting and Exeter Associates, (2012), pg. 137. See the source for additional discussion of causes of wind curtailment and other assumptions in these calculations.
With forecasts of increasing solar penetration, there has been some modeling of scenarios that could result in solar curtailments. Denholm and Mehos (2011) model two high

penetration solar portfolios on the southwestern U.S. grid: (a) 20% PV energy and no CSP, and (b) 15% PV energy and 10% energy from CSP with 6 hours of thermal storage, for a total of 25% energy from solar resources. Each scenario also assumes 10% wind penetration. The simulation results suggest that, in the former case, 16% of the PV energy is curtailed during the spring days and 5% of total annual PV energy because dispatchable generators can’t be ramped down sufficiently to accommodate the influx of solar energy; in the latter case, solar energy comprises 5% more of total annual energy needs, but experiences only 2% curtailment of annual solar production due to the energy shifting capability of thermal storage.
Figure 30 illustrates Denholm and Mehos’s results for a particular set of April days in California. As they show, CSP with storage can significantly reduce the very high system ramps that emerge at higher PV penetration, as well as reducing the aggregate minimum operating level of the power system.
Figure 31: Simulated California System Dispatch on April 7‐10 with 15% contribution from PV and 10% contribution from dispatchable CSP
78
Source: Denholm and Mehos (2011), pg. 13.
Another finding of the simulations by Denholm and Mehos (2011) is that in some power systems, such as California, higher levels of PV penetration will begin to impact the operations of other non‐fossil generation needed to meet load, such as nuclear, hydro, and imports. These impacts could be reached by penetration levels of 6 ‐ 10% annual energy

79
from PV on spring days characterized by light loads, high hydro output, and high wind. In the western U.S., these types of impacts can be accommodated over time by changes in the operation of the regional power grid (resulting from new types of operational coordination across balancing authorities or from infrastructure investments), but in the near‐term, they could present significant disruptions to power system operations and curtailments either of PV energy or other types of non‐fossil generation.
Mills and Wiser (2012b) corroborate these general findings and also extend them by calculating not only the amount of renewable curtailment but also the amount of production at very low energy prices ‐‐ in other words, production in hours when economic value is very low, which may also be an indicator that curtailment may be more likely. They find that CSP with 6 hours of thermal storage is required to curtail only at very high penetration, such as 30% of annual energy, and even then at less than 1% of its available energy. Moreover, only 2% of production is sold in hours with low energy prices. In contrast, CSP without storage and PV experience increasing curtailment with greater penetration – approximately 7% by 30% penetration – as well as selling almost half (48%) of their energy during intervals with low energy prices by those higher penetrations.
Conclusions CSP with thermal energy storage offers the potential to provide renewable energy with greatly reduced variability and forecast errors, when compared to other solar and wind generation, and well as potentially provide integration services. To clarify this potential, additional regional power system simulations are needed to evaluate the integration requirements of high penetration scenarios with and without CSP with thermal energy storage. Further work is also needed to validate the subhourly operational capabilities of CSP with thermal energy storage, particularly to provide Regulation and intra‐hourly load‐following.
There continues to be uncertainty about integration costs in high renewables scenarios. If such costs are not considered, then CSP with thermal energy storage is not being assigned an avoided cost of potential significance, especially in regions with high solar production that will be experiencing increasing system ramps. Moreover, CSP with thermal energy storage could be allowing the utility portfolio to avoid some of the highest hourly integration costs of the typical operating day.

80
9.
mary objective of renewable energy policies is to uce greenhouse gas emissions, as well as other pollutants. For any particular power system, ferent renewable technologies, and portfolios of nologies, are likely to result in different patterns ouse gas emissions reductions, depending on tors. These include the fossil generation mix and operated when integrating renewables, the load and the forecast daily renewable profiles (e.g.,
priredairdif
those techof greenhmany fachow it is profiles, Mills and
Clearly, s
A
Greenhouse Gas Emissions Reductions
Wiser, 2012b).
olar production without storage will primarily drive down fossil generation during the sunlight hours. As solar penetration increases, in some power systems, there may be lower marginal emissions reductions for incremental solar resources, because higher emissions generation are displaced first or because increased net‐load variability requires fossil‐fueled generators to be operated more flexibly and at lower production efficiency. This would appear to be the case for California, where in‐state solar generation is primarily displacing natural gas‐fired generation. In other regions, it may be that coal‐fired generation is displaced last, thus offering an increase in marginal emissions reductions at higher solar penetration. In the future, carbon pricing, may change the economic merit order of coal and natural gas fired generation, affecting these emissions results. The impact of adding renewables to power systems will thus vary, with different emissions results taking place over time as different types of generation is displaced.
Although further study is
needed, CSP with thermal
energy storage may
provide additional value
through its capability to
dispatch emissionsfree
energy to the highest
greenhouse gas emissions
hours, as they evolve over
time.
Quantifying the Mitigating Impacts of Storage on Emissions Whether CSP with thermal energy storage can provide meaningfully higher marginal emissions reductions than solar resources without storage requires region‐specific analysis. A flexible solar resource should be better able to shift production to the hours that provide the highest greenhouse gas emissions reductions. If the cost of greenhouse gas emissions allowances (or a carbon tax) are factored into the wholesale market price for energy and ancillary services, then market optimization will find the highest value uses for the dispatchable solar energy. However, significant incremental economic value may only

81
become apparent at higher solar penetrations. At lower solar penetrations, if CSP with thermal storage is compared to solar PV on an energy equivalent basis, the difference in production shape shown in Figure 3 above could allow the PV to obtain higher initial emissions reductions if its production is concentrated in fewer hours but with higher initial marginal emissions reductions. But as additional solar resources are added, the higher marginal emissions reductions could shift to other hours, where CSP with thermal storage would provide greater marginal emissions reductions. In addition, operational factors, such as the need to start‐up additional generation and operate at partial loadings for longer periods, could more significantly affect the emissions reductions at higher penetrations.
Mills and Wiser (2012b) provide some initial findings on emissions reductions for the California power system that are suggestive of some of these factors. To capture the added value that renewable energy would obtain from greenhouse gas policies, they conduct a sensitivity on a $32/tonne carbon tax, which raises the value of renewable energy depending on the quantity of carbon that it displaces. Because California utilizes only natural gas fired generation, and they do not consider emissions from plants outside California, these differential effects will be quite subtle and require significant displacement by different types of renewables to produce measurable differences. As shown in Figure 31 below, all wind and solar technologies have very similar marginal carbon reductions at low penetrations. The expected additional value of CSP with thermal storage becomes more prominent at higher solar penetrations, where the shifted solar energy is able to displace generation with higher emissions in other hours. Mills and Wiser attribute some of the emissions from CSP with thermal storage to fact that storage enables the more efficient operation of the gas‐fired generation fleet in higher penetration scenarios.
What is not clear from the data presented in Mills and Wiser’s study is how hourly emissions are changing on the grid as renewable penetration increases. In addition, they have initially only studied individual technologies, rather than portfolios. To gain further insight into this question, BrightSource analyzed the carbon emissions profile in California for a 33% RPS scenario, adding up the emissions from all natural gas plants within the state (but ignoring emissions from plants outside the state that could be delivering fossil energy under bilateral contract or via system imports). As shown in Figure 32, these clearly show the late afternoon, early evening emissions increase on average in some months, which is likely related to the ramp down of solar production causing fossil generation to ramp up as well as the higher loads in fall and winter months after dark. Further analysis is now needed to clarify how, by allowing for additional choice between solar production across the operating day, the optimization of the solar thermal storage could help reduce greenhouse emissions overnight, further than they would have been without the capability to dispatch clean energy.
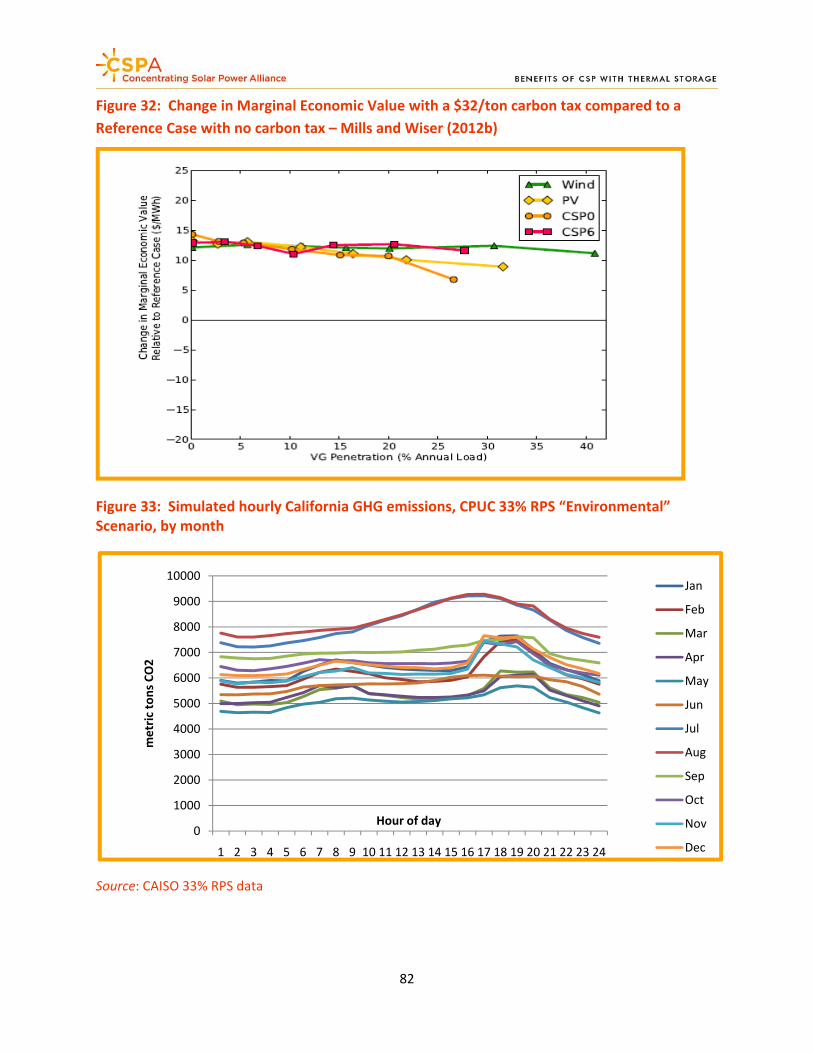
82
Figure 32: Change in Marginal Economic Value with a $32/ton carbon tax compared to a Reference Case with no carbon tax – Mills and Wiser (2012b)
Figure 33: Simulated hourly California GHG emissions, CPUC 33% RPS “Environmental” Scenario, by month
0
1000
2000
3000
4000
5000
6000
7000
8000
9000
10000
1 2 3 4 5 6 7 8 9 10 11 12 13 14 15 16 17 18 19 20 21 22 23 24
metric tons CO2
Hour of day
Jan
Feb
Mar
Apr
May
Jun
Jul
Aug
Sep
Oct
Nov
Dec
Source: CAISO 33% RPS data

83
Life Cycle Emissions An additional consideration in comparing the emissions reductions of different solar technologies is life‐cycle emissions. While renewable resources including CSP avoid emissions from fossil fuel plants, they also have their own emissions associated with their manufacture and deployment. Significant research has been performed on the so called “life cycle” emissions (the summation of their manufacture, operational, and end‐of‐life emissions) of photovoltaics (Fthenakis et al, 2008) but less work has been performed on CSP, with or without storage. The CO2 emissions from a trough plant without storage, expressed on a /kWh basis over the plant’s entire lifetime could be 26 g/kWh, on the order of 5% of the emissions avoided if displacing gas generation (Burkhardt et al., 2011). For photovoltaics, the value could be between 20g/kWh for CdTe to more than 50 g/kWh for monocrystalline silicon (Fthenakis et al, 2008). These numbers are a small, though not
ected per MWh avoided GHinsignificant fraction of the exp Gs.
There are no papers outlining the life‐cycle impacts of adding storage to a CSP plant, but one would expect additional embodied carbon from the tanks, storage medium (salt, typically), piping, and heat exchangers. However, these additional embodied are likely to be outweighed by the increase in capacity factor in solar production. Further research should be done to determine whether thermal storage increases the total lifetime GHG benefit of a CSP resource.
Conclusions The studies completed to date are suggestive of the potential for higher emissions reductions with flexible solar resources procured as part of a solar portfolio, particularly at higher levels of renewable penetration and also taking into account regional differences in the existing and planned fossil generation fleet. Additional regional power system simulations, and possibly also analysis of life‐cycle emissions, are needed to demonstrate this emissions effect and calculate its possibly monetary value under different assumptions or greenhouse gas allowance prices or carbon adders. f

84
10. Power Quality and Other Reliability Attributes
hesynis lred
capabilitrequiringcompensinterconnpossibly and infConsultin
addition of a substantial amount of non‐chronous, variable wind and solar PV generators ikely to adversely affect power quality, notably to uce primary and secondary frequency response ies and increase the need for reactive power, utilities and system operators to take ating actions, including additional refinements to ection standards for such plants as well as operational changes (including market reforms) rastructure investments (LBNL 2010; GE g/CAISO, 2011; Adams 2011). With respect to
solar PV, this is because inverters – the components that convert the direct current (DC) produced by the solar panels to alternating current (AC) for the transmission system – have significantly different behavior than traditional synchronous generators. In contrast, CSP plants utilize synchronous generators that largely avoid creating these operational requirements; Table 13 below provides a brief but reasonably complete survey of the
T CSP with thermal energy
storage utilizes
synchronous, operational
flexible generation that
provides the power
quality attributes of a
conventional generator.
technological differences across a range of power quality and operational attributes.
The question for the valuation of CSP is whether the operational attributes provided by the plants’ synchronous generators (when operating), as well as the ability of thermal storage to extend the daily operations of the plants, has significant economic benefit in terms of both potential avoided costs (when compared to an alternative solar PV investment) and the provision of any new operational or market services. To date, there are few studies that explicitly address valuation across technologies of power quality and associated reliability requirements, but there are several that qualitatively identify different requirements, allowing for perspective on when potential avoided costs could become significant.
This section briefly describes and examines the following operational and reliability issues: Static voltage control Dynamic voltage control
Inertia response Primary frequency control Secondary frequency control Operational visibility and control

85
Static Voltage Control Static voltage control involves the capability to adjust reactive power to maintain a specified voltage profile, possibly in response to operator instructions (which could be very dynamic depending upon the loading conditions on transmission facilities in the grid). The term “static” represents a relatively slow time frame in power system operations which could span up to several minutes. Synchronous generators on CSP plants provide this type of response through the exciter/automatic voltage regulator control. Since PV generators don’t have these controls, either the DC‐AC inverter control of the PV generator must be designed to provide static voltage control (which to date, most do not), or alternatively, reactive devices such as capacitors/reactors can be installed on the grid to increase reactive power capability in the area. The costs of these investments in $/MWh is likely to be small relative to the total cost of renewable energy, but worth considering.
Dynamic Voltage Control During and after sudden changes in grid conditions, such as during a fault or following the outage of transmission facilities, fast and automatic reactive power support is also crucial to reliable operations. Typically, this type of response, which is provided in the range of seconds or less, is provided by the exciter controls of synchronous generators. For PV generators, this type of responses can also be provided through the design and implementation of DC‐AC inverter control. However, unlike the static voltage control, less costly and simple additional reactive devices such as capacitor/reactor cannot be used to satisfy this need. Instead, due to the need to respond to sudden change in system conditions, more expensive and complicated devices such as SVC, DVAR, or STATCOM are needed. Moreover, such devices still are not as capable as the synchronous generator. For example, if a low‐voltage situation is already established, such devices cannot output their rated reactive power while a synchronous generator can (NERC 2009; FERC 2005). This low‐voltage scenario is precisely when such reactive power is most needed, so this is a significant shortcoming when adding other devices to solar PV.
Inertia Response Some amount of inertia on the grid is created by the energy stored in the rotating mass of conventional power plants. Inertia acts as a buffer that helps suppress frequency deviation due to various changes in the system. Currently, inertia response is provided by synchronous generators because they (and their attached turbines) provide rotating mass. PV inverters lack intrinsic inertia, because they have no rotating parts, and instead will need to adapt the software and electronics controlling the inverter to provide synthetic inertia response, though this is not yet common.

86
Primary Frequency Control, or Frequency Response The ability to adjust output rapidly after the outage of other generators is crucial to maintain stability of the grid. With synchronous machines, this feature is provided through the turbine governor control response. For the Solar PV generators, this response can be provided through the design and implementation of this function in the DC‐AC inverter.
To date, the studies of frequency response needs in California and the rest of the western U.S., have provided a mix of quantitative and qualitative assessment (LBL, 2010; GE Consulting, 2012). None of the recent studies explicitly calculate costs associated with maintaining frequency response in high wind and PV scenarios. However, the list of potential mitigation measures is extensive and clearly not costless. Table 12 lists mitigation measures in recent studies by LBNL (2010), NREL/GE (2010) and GE Consulting (2011). The recent GE study of the California ISO’s frequency response noted that new market mechanisms to ensure sufficient frequency response could be needed, or else the system operator “will inevitably be forced to adopt defensive operational strategies, with possible adverse consequences including out‐of‐merit commitment and dispatch of responsive generation, curtailment of wind and solar generation, abrogation of power purchase agreements and may be subjected to fines levied for reliability violations.” (GE, 2011, pg. xi).
CSP with or without thermal storage can provide some but not all of these frequency response capabilities, depending on the time of day and available solar irradiation. First, the plants are inherently capable of providing headroom on its turbine during the sunlight hours, but possibly at a production loss depending on the charge of the thermal energy storage system. Hence, if frequency response is sufficiently valuable, these plants can in principle provide some frequency response reserves without any further investment in equipment. Second, with respect to cloud transients, where the sudden downward change in production could exacerbate frequency deviations that also take place in those hours, the CSP plant will provide some inertia as well as some buffer against production variability through its large solar field. Third, any hybrid fuel capability would of course further minimize production variability and also, when committed, provide more upwards reserve capability for the power system as needed.
Secondary Frequency Control Secondary frequency control refers to response capabilities on time frames of seconds to minutes, also called automatic generation control (AGC), which is a key element to help maintaining operating frequency of an interconnected power system. With insufficient secondary frequency control, system frequency can drift from the design point, making it vulnerable to instability and potentially, collapse. In general, conventional plants can provide this support to the system through AGC. Solar PV could also provide this feature

87
through the design of DC‐AC inverter control with AGC‐like function. However, AGC implies varying the energy (and thus, fuel) going into the machine. For a solar PV system to provide such a capability it would have to incorporate battery storage, or operate most of the time at a design point short of its theoretical capability, which increases the cost of energy produced.
Table 12: Additional Mitigation Measures to Support CAISO and WECC Frequency Response in Recent Studies
GE (2011) LBL (2010) WWSIS (NREL/GE 2010)
Load controls on pumps and pumped storage plants
Fast acting energy storage
Participation by renewables in frequency response (causing lost production opportunities)
Additional, fast acting, flexible demand response
CAISO Frequency Response Product
Investment in improving flexibility of generation fleet
Improved balancing area coordination
Subhourly scheduling outside CAISO
Visibility and Control Large‐scale CSP plants are fully visible to the system operator and always dispatchable in the downward direction as well as in the upward dispatch capability from the thermal energy storage system or auxiliary fuel hybridization. Hence, if these plants are removed from the solar portfolio and substituted for by distributed PV plants, there will some added cost of obtaining visibility and control (CAISO/KEMA, 2012).
Conclusions System operations at increasing penetration of wind and solar PV technologies will create new operational needs and interconnection standards that increase the costs of these technologies, in the case of solar PV through inverter controls or additional of transmission equipment such as capacitors. CSP plants with or without storage utilize synchronous

88
generators, providing similar short‐term reliability and operational benefits to the system as conventional power plants at no additional costs. CSP with thermal energy storage offers an inherent economic and reliability advantage over competing solar technologies because it can provide these benefits over more hours of the day, and does not require additional investments in upgraded equipment or potential loss of production by providing active controls.
Table 13: Solar Installation Design Issues and Challenges
Grid requirement
Design function
Operational need Synchronous unit performance
Solar unit options
Static (slow) Voltage Control
Adjust reactive power to maintain voltage profile or in response to central commands
As loading on transmission elements increase, their reactive losses increase. If not compensated, voltage will fall until the grid becomes unstable.
Provided through exciter /automatic voltage regulator control
Solar PV: through DC‐AC inverter control and/or additional reactive device such as capacitor/reactor banks.
Dynamic Voltage Control
Rapid, automatic reactive output
During, and after contingency events such as fault conditions, voltage is dragged low by the fault conditions in microseconds. If immediate compensation is not provided, the grid can become unstable and collapse.
Provided through exciter controls.
Solar PV: through DC‐AC inverter control and/or additional dynamic reactive device, such as SVC, STATCOM, DVAR…
Inertia Response
Stored energy in the rotating mass
The Inertial Frequency Response provides counter response within seconds to arrest the frequency deviation.
Rotating mass provides inertia support
Synthetic Inertia Response
Primary Frequency Control
Automatic adjust active power in the first seconds in response to a frequency deviation
Primary frequency control is what arrests frequency decline after a loss of generation event. Without it the grid is unstable.
Provided through turbine governor control
Solar PV: through DC‐AC inverter control to provide governor‐like functions.
Secondary Frequency Control
Under central control, restores frequency to nominal and restores the generation/load balance at a secure design frequency.
Without Secondary Frequency Control, normally called AGC, frequency drifts from the grid design point, and makes it vulnerable to instability.
Automatic Generation Control
Solar PV: through DC‐AC inverter control to provide AGC‐like functions.
Ramp Rate Control
The rate of change in MW per minute of a Resource
To prevent a frequency deviation due to larger generation change.
Provided through power regulation
Solar PV: through DC‐AC inverter control.

89
Frequency ride‐through
Avoids destabilizing the grid after loss of generation or load events.
If many units trip during a low or high frequency event the grid may become unstable and collapse.
Per operating guides.
Per operating guides.
Voltage ride‐through
Avoids destabilizing the grid after fault events
If many units trip during a low or high frequency event the grid may become unstable and collapse.
Per operating guides
Per operating guides.
Small Signal Stability damping
Prevents groups of generators from oscillating against other groups
If groups of units oscillate against other groups of units without dampening, the lines between them may twist out of synchronization and island the group
Provided through tuned power system stabilizers
Solar PV: through DC‐AC inverter control to provide PSS‐like functions.
Sub Synchronous Resonance/Interaction (SSR/SSI)
Prevents resonance of units against series capacitors which can cause damage to, or tripping of resources.
Oscillation of turbine shafts, or unit controls at sub‐synchronous frequencies can damage resources and equipment.
Provided through tuning of unit design to avoid sub‐synchronous frequencies or filtering protection, or protective equipment.
Solar PV may have SSI with series capacitors or neighboring wind/solar plants. Can be improved by adjusting the plant controller.
Energy Schedule and Forecast
Provide the energy output potential for adequate system unit commitments.
For intermittent resources (wind and solar), forecast accuracy can affect the system schedule and result in congestion and/or increasing the need of ancillary service .
Able to provide firm energy schedule in combination with load control allows adjustment of generation output under virtually all conditions with controlled
Wind‐powered Generation Resources (WGRs) forecast to provide a reference for wind power energy schedule.Solar Forecast should have the same function.
Dynamic monitoring
Provide high resolution recorded system data (P, Q V, I)
Dynamic performance monitoring allows early detection of system instability and provides a reference for system event investigation after events.
Not provided at this time
To have PMU or DFR for each resource.Not provided at this time.
Short Circuit Current Contribution
Provide fault current during fault condition.
Relay setting based on fault current can mis‐operate or difficult to coordinate with other relays with low or zero short circuit current contribution.
Conventional units generally provides 10‐12 times of rated current during fault condition.
It is known that Solar PV provides zero or minimum short circuit current. Improve inverter size and/or control design to provide short circuit current.

90
Performance when connected to a weak Interconnection Point
Normal response at weak system (for example, low or extre low short circuit ratio)
Minimum short circuit ratio is required for the design units to have normal response.
Help to improve the system strength.
Additional testing and tuning may be needed when connected to weak system.
NERC compliance
Secure system and standard compliance
Energy Scheduling
The ability to schedule energy with reasonable accuracy
Can be scheduled optimally
Based on forecast
Load Following or Tertiary Frequency Control
The ability to increase and decrease electrical power and energy output on command
Allows aggregate resource power output to match demand to maintain adequate system frequency (60Hz).
Controlled fuel feed in combination with load control allows adjustment of generation output under virtually all conditions.
reserve.
Due to the intermittent nature, may not able to increase output without having a active power
Source: Adams (2011), with modifications

11
survey has suggested that the net system cost of CSP with thermal energy storage ould be quantified on the basis of the sum of the economic and reliability benefits t the plants can provide, as well as from estimates of the comparative net system sts of alternative renewable energy technologies. In addition, improved nding of long‐term economic benefits of solar portfolios that include CSP with
will require further assessment of future system conditions, in some cases
. The Total Benefits of CSP with Thermal Storage
hisshthaco
understathermal storage addressing
Mills andwith the cof renewrelatively
T issues that are at the forefront of power systems research.
Wiser (2012b) have provided an example of a power system modeling approach apability to calculate several key types of benefits simultaneously across a range able penetration scenarios, making summation of total economic benefits straightforward. However, for computational tractability, such models may have
less network detail than the power system models used for more detailed integration studies (e.g., CAISO 2011), and may introduce other simplifications that can affect estimates of benefits. Other studies have addressed some but not all categories of benefits. Madaeni et al., (2012) summed energy, spinning reserves and capacity value, but their exogenous fixed price model does not extend to evaluating alternative renewable portfolios. On the other hand, in market regions, the market price results should be a better indicator of value, since they incorporate the effect of additional power system constraints which influence market prices that the system models may not reflect, as well as market behavior.
Denholm and Hummon (2012) advance the application of production simulation models to CSP with thermal energy storage in alternative renewable portfolios, and evaluate both energy and capacity benefits, but did not calculate ancillary service benefits or assess integration costs. And no detailed system integration cost study to date has examined the impact of CSP dispatch. Hence, in some cases, the summation of total market benefits requires consideration of values that derive from different models or settings.
91
Sum of economic and reliability benefits At low penetrations of renewables, for power systems that have certain demand characteristics, such as load peaks in the evening hours during winter and spring months, thermal energy storage adds energy and ancillary service benefits to a CSP plant, possibly in the range of $5‐10/MWh (Sioshansi and Denholm, 2010; Madaeni et al., 2012). Plants with thermal storage also obtain higher capacity credits than solar plants without storage,

92
although this added value when divided by a higher capacity factor may not increase plant benefits significantly.
As solar penetration increases and displaces fossil‐fuel generation, the energy value during the sunlight hours declines, while the capability of CSP with thermal storage to shift energy allows it obtain $13‐25/MWh in higher energy value (Denholm and Hummon, 2012; Mills and Wiser, 2012b). For similar reasons, studies predict a significant decline in capacity value of incremental solar PV and CSP without storage as penetration increases. While U.S. studies appear to agree that solar PV capacity value declines sharply in the range of 5 – 10 % penetration by energy, there are differences in the rate of change among studies of particular regions that need to be resolved. CSP with thermal energy storage has a higher retained capacity value in the high penetration scenarios, in the range of $10‐20/MWh, and possibly higher (Denholm and Hummon, 2012; Mills and Wiser, 2012b).
The sum of these economic benefits is significant at higher solar penetrations (Denholm and Mehos, 2011; Mills and Wiser, 2012b) For example, Mills and Wiser calculate that in California, CSP with 6 hours of storage offers a $19/MWh benefit over solar PV at 5% penetration of solar energy, and a $35/MWh benefit by 10% penetration – roughly the penetration levels currently being planned towards in California under the 33% RPS. Similar results have been shown by Denholm and Hummon (2012), with additional studies forthcoming.
Simulation studies of CSP with thermal storage to date (e.g., Mills and Wiser, 2012b) have not determined a high value for avoided integration costs, and accurate analysis is still difficult (Milligan et al., 2011). But studies of integration costs have suggested values for wind and solar integration costs in the range of $5‐10/MWh for higher penetration scenarios (e.g., survey in Mills and Wiser, 2012a; Navigant et al., 2011). Calculations done by BrightSource Energy based on California ISO simulation data (CAISO 2011) suggest that the avoided costs of integration in the late afternoon and early evening hours may be significantly higher than in other hours of the day, providing greater value to resources that can mitigate the system ramps in those hours. Curtailment of solar PV energy due to constraints in power system operations could also increase at higher solar penetrations, and there is the potential for CSP with thermal energy storage to reduce overall solar energy curtailment (Denholm and Mehos, 2011). Studies suggest that these avoided integration and curtailment costs should be considered when comparing CSP with thermal energy storage to other renewable technologies.
Mills and Wiser (2012b) evaluate the full net system cost calculation shown in Figure 1, with the exception of transmission costs, across scenarios of increasing renewable penetration. The results for different technologies can thus be compared, with implications for portfolio development. The results for the difference in marginal benefits between CSP

93
with 6 hours of thermal storage and PV are shown graphically in Figure 34. The different in total marginal economic benefit is shown in the upper blue line, reaching a value of between $30‐40/MWh by 10% solar penetration. Denholm and Hummon (2012) only sum energy and capacity benefits, but find a $25 – 43.8/MWh increase over solar PV in their scenario with around 33% wind and solar penetration, with the high capacity value based on the avoided cost of a new combined cycle.
Figure 15: Difference in marginal economic value in California between CSP with thermal torage and PV as solar penetration increases – Mills and Wiser (2012b) s
When new types of system requirements are identified, such as frequency response requirements (GE/CAISO 2011), additional re‐formulation of power system simulation models used for valuation will be needed, to add new constraints. As models evolve, utilities and regulators will need to understand the inputs and assumptions for each
0
5
10
15
20
25
30
35
40
45
0% 2.5% 5% 10% 15% 20% 30%
$/MWh
Annual Solar Energy Penetration
Total Marginal Economic Value Energy ValueAncillary Services Capacity ValueDA Forecast Error
iteration of study results.

94
12.
orically, the types of market and reliability valuation reviewed in this report were t direct inputs into the engineering design processes of CSP firms, nor, generally, o the procurement decisions of buyers. However, recent studies have shown w both plant‐level and system level studies can guide innovation in CSP plant otably, Madaeni et al., (2012) and Brand et al., (2012) model market valuation of plant by varying the solar multiple and number of hours of storage, and then he design options that are most likely to result in a positive benefit‐cost ratio public CSP cost estimates.
Incorporating Market and Reliability Valuation into CSP Plant Design
istnointho
design. Na trough estimate tbased on revenues the hoursparabolic
H Figure 33 shows Madaeni et al.’s total simulated
from energy and spinning reserves in the California ISO in 2005 plotted against of storage and solar multiple. The interpretation of this result is that for a trough, given any fixed solar multiple, there will be a maximum revenue available
when increasing thermal storage capacity, for the obvious reason that limiting the solar multiple constrains the charging of thermal storage. Hence, the design choice is to conduct cost‐benefit analysis across a range of design parameters.
Multiple years can be tested to examine the robustness of the design decision. For example, Figure 34 shows same model but run against California ISO market prices in 2010 and 2011 to examine any revenue changes as well gain insight into configuration changes.
Figure 35: Annual revenues from energy and spinning reserves for different configurations of parabolic trough plant, CAISO 2005 prices a
Source: Madaeni et al. (2012)

95
Figure 36: Annual revenues from energy and spinning reserves for different configurations of a parabolic trough plant, CAISO 2010 (a) and 2011 (b) prices
Source: Helman and Sioshansi (2012, unpublished)
The analysis of Madaeni et al., (2012) which includes also valuation of capacity ratings from thermal storage, and Brand et al., (2012), shows the basic structure of how design choices can be affected by market modeling. However, they do not consider other factors, such as the integration of renewables onto the power system, which could affect the value of storage. In contrast, Mills and Wiser (2012b) and Denholm and Hummon (2012) dispatch CSP with thermal storage in power system models that do capture a range of value components, including integration of other renewables, but only evaluate 0 and 6 hours of storage. Research studies need to more closely examine CSP plant design decisions in full power systems. At the same time, the CSP industry needs to engage utilities and regional
nt attributes and potential value.
(b) (a)
system operators in a more detailed discussion about pla

96
13. Conclusions and Next Steps
CSP with thermal energy storage brings significant economic and reliability benefits as a component of an expanding solar portfolio in regions around the world with sufficient direct normal irradiation. These benefits keep the technology competitive in an expanding utility solar portfolio on a net system cost basis.
Studies by the U.S. national labs and other entities have contributed significantly to the quantification of the range of benefits associated with CSP with thermal storage. A crucial finding is that as solar portfolios are developed in regions with high direct normal irradiance, CSP with thermal storage can complement solar PV and provide additional benefits by:
Sustaining capacity value through the flexibility to operate in the hours of greatescapacity requirements even as they shift over time due to renewable penetration
t ,
Optimizing wholesale energy and ancillary service benefits as system conditions change,
Reducing curtailment of aggregate solar energy, and Reducing integration costs and investments in other sources of operational flexibility.
At least in California, but perhaps also in other regions, recent studies have suggested that a high penetration solar portfolio which includes both solar PV and CSP with thermal energy storage would be more operationally flexible and have greater economic benefits than a
Wiser, 2012bportfolio with only solar PV (Denholm and Mehos, 2011; Mills and
This survey of methods and results leads to two key conclusions:
60).
First, there is a reasonable degree of convergence in the results of quantitative studies of the system costs and benefits of CSP with thermal energy storage, and alternative solar technologies, under a range of power system conditions.
This result suggests that utilities and regulators should give credence to the basic findings of the studies surveyed in this report, and aim to resolve remaining differences.
60 The results of the Mills and Wiser simulations, although not examining portfolios of different solar technologies, show that the value gap at higher penetrations between CSP with thermal storage and PV is sufficient that a least‐cost, highest value solar portfolio could incorporate both technologies, depending on the CSP costs.

97
Second, utilities and regulators around the world are beginning to calculate net system costs when valuing alternative renewable resources, but more
scenario a .comprehensive, based methods re needed
The early phases of renewable procurement around the world have tended to focus primarily on rapid deployment of available technologies at the lowest levelized cost of energy (LCOE), and less so on planning towards long‐term, reliable clean power systems. There is wide recognition that LCOE is an incomplete and misleading metric for comparison of alternative renewable technologies with significantly different production characteristics (e.g., Joskow 2010). The study findings reviewed here demonstrate that a more comprehensive approach to resource valuation is needed for a cost‐benefit comparison of CSP with thermal energy storage with other renewable technologies and integration solutions. These studies also highlight the need for simulations of changing power system conditions to guide investment decisions. Without conducting such analysis, CSP with thermal energy storage could be significantly under‐valued in renewable procurement.
Next Steps Next steps in the U.S. research program on CSP include projects by the California Energy Commission (CEC), the National Renewable Energy Lab (NREL), the California ISO (CAISO) and other entities to quantify further some of these benefits. Other research entities are also conducting valuation studies of other types of bulk storage using similar modeling approaches, which will be useful for comparison.
While there are recent studies of the economic benefits of CSP with thermal energy storage in other countries (e.g., Brand et al., 2012; Usaola 2012), additional research is needed, perhaps sponsored by organizations such as SOLARPACES. This is important because several countries, such as South Africa, are proceeding with further deployment of CSP, including plants with thermal storage. Moreover, China has set new targets for CSP development.

98
References
Adams, John (ERCOT). “Planning and Operations Standards for Solar”, ERCOT, Solar Workshop, April 25, 2011. See http://www.ercot.com/content/gridinfo/etts/solar/presentations/01‐_ERCOT‐_John_Adams_SolarWorkshop_04252011.pdf
Brand, B., A.B. Stambouli, and D. Zejli, “The value of dispatchability of CSP plants in the electricity systems of Morocco and Algeria,” Energy Policy, 47, 2012, 321‐331.
Burkhardt, J.H., G.A Heath, C.S. Turchi, “Life cycle Assessment of a Parabolic Trough Concentrating Solar Power Plant and the Impacts of Key Design Alternatives,” Environmental Science and Technology, Vol 45, pp 2457‐64. Feb 23, 2011. http://pubs.acs.org/doi/abs/10.1021/es1033266 California ISO (CAISO), Integration of Renewable Resources: Operational Requirements and eneration Fleet Capability at 20% RPS, August 31, 2010. GSee http://www.caiso.com/2804/2804d036401f0.pdf. California ISO (CAISO), “Track I Direct Testimony of Mark Rothleder on Behalf of the California Independent System Operator Corporation,” Before the Public Utilities Commission of the State of California, Order Instituting Rulemaking to Integrate and Refine
‐006, Procurement Policies and Consider Long‐Term Procurement Plans, Rulemaking 10‐05Submitted July 11, 2011. California ISO (CAISO), “Renewables Integration Studies Update, February 10, 2012b, See http://www.caiso.com/Documents/RenewablesIntegration_StudiesUpdate_Feb10_2012.pdf.
California ISO, Annual Report on Market Issues & Performance, 2011, Department of Market Monitoring, April 2012a.
California ISO (CAISO) and KEMA, Final Report for Assessment of Visibility and Control Options for Distributed Energy Resources, June 21, 2012. See http://www.caiso.com/Documents/FinalReport‐Assessment‐Visibility‐ControlOptions‐DistributedEnergyResources.pdf.
Denholm, P. and M. Hummon, “Simulating the Value of Concentrating Solar Power with Thermal Energy Storage in a Commercial Production Cost Model,” National Renewable Energy Laboratory, Technical Report, NREL/TP‐6A20‐56731, November 2012.

99
Denholm, P. and M. Mehos, Enabling Greater Penetration of Solar Power via the Use of CSP with Thermal Energy Storage, National Renewable Energy Laboratory, Technical Report, NREL/TP‐6A20‐52978, November 2011. See http://www.nrel.gov/csp/pdfs/52978.pdf.
Denholm, P., S. H. Madaeni and R. Sioshansi, Capacity Value of Concentrating Solar Power Plants, National Renewable Energy Laboratory, Technical Report, NREL/TP‐6A20‐51253,
June 2011. See http://www.nrel.gov/docs/fy11osti/51253.pdf.
Denholm, P., R. Margolis, and J. Milford. Production Cost Modeling for High Levels of Photovoltaics Penetration. National Renewable Energy Laboratory, 2008, http://www1.eere.energy.gov/solar/pdfs/42305.pdf.
Denholm, P., and R. M. Margolis, “Evaluating the Limits of Solar Photovoltaics (PV) in Electric Power Systems Utilizing Energy Storage and Other Enabling Technologies.” Energy Policy 35 (9) (September), 2007, pp. 4424–4433.
Department of Energy (DOE), 2011 Wind Technologies Market Report, Energy Efficiency and Renewable Energy, DOE/GO‐102012‐3472 August 2012.
dfSee http://www1.eere.energy.gov/wind/pdfs/2011_wind_technologies_market_report.p .
Ela, E., M. Milligan, and B. Kirby, “Operating Reserves and Variable Generation,” National 1. Renewable Energy Laboratory, Technical Report, NREL/TP‐5500‐51978, August 201
Federal Energy Regulatory Commission (FERC), Principles for Efficient and Reliable Reactive Power Supply and Consumption, Feb 4, 2005. Docket AD05‐1‐000. See http://www.ferc.gov/eventcalendar/files/20050310144430‐02‐04‐05‐reactive‐power.pdf.
Fthenakis, V.M., H.C. Kim, E. Alsema, “Emissions from Photovoltaic Life Cycles,” nvironmental Science and Technology, Vol 42, pp. 2168‐74, Feb 6, 2008. E<http://pubs.acs.org/doi/abs/10.1021/es071763q> GE Energy and Exeter Associates (2012), Task Report: Review Of Industry Practice And Experience In The Integration Of Wind And Solar Generation, PJM Renewable Integration tudy. Prepared for: PJM Interconnection, LLC. Prepared by: Exeter Associates, Inc. and GE SEnergy, November, 2012. GE Energy Consulting, California ISO (CAISO) Frequency Response Study, Final Draft, repared by Nicholas W. Miller, Miaolei Shao, and Sundar Venkataraman, November 09, P2011. See http://www.caiso.com/Documents/Report‐FrequencyResponseStudy.pdf. E Energy/ National Renewable Energy Laboratory (NREL), May 2010, Western Wind and olar Study, NREL, Golden, Colorado. GS

100
International Energy Agency (IEA), Technology Roadmap: Concentrating Solar Power, ECD/IEA, 2010. O
See http://www.iea.org/publications/freepublications/publication/csp_roadmap.pdf. International Renewable Energy Agency (IRENA), Concentrating Solar Power, Renewable nergy technologies: cost analysis series, Volume 1: Power Sector, Issue 2/5, IRENA eWorking Paper, June 2012. Joskow, P., “Comparing the Costs of Intermittent and Dispatchable Electricity Generating
tember 2010 Technologies,” Center for Energy and Environmental Policy Research, Sep
Katzenstein, W and Apt, J., “Air Emissions Due to Wind and Solar Power,” Environmental cience and Technology, Vol 43, No 2, pp 253‐8, S2009. http://pubs.acs.org/doi/abs/10.1021/es801437t Lawrence Berkeley National Laboratory (LBNL), Use of Frequency Response Metrics to Assess the Planning and Operating Requirements for Reliable Integration of Variable Renewable Generation, December 2010. ee S http://www.ferc.gov/industries/electric/indus‐act/reliability/frequencyresponsemetrics‐report.pdf. Lannoye, E., M. Milligan, J. Adams, A. Tuohy, H. Chandler, D. Flynn, and M. O’Malley, Integration of Variable Generation: Capacity Value and Evaluation of Flexibility”, IEEE PES “Summer Meeting, 2012. adaeni, S.H., R. Sioshansi, and P. Denholm, “How Thermal Energy Storage Enhances the M
Economic Viability of Concentrating Solar Power,” Proceedings of the IEEE, 2011. adaeni, S.H., R. Sioshansi, and P. Denholm, “The Capacity Value of Concentrating Solar M
Power Plants,” NREL Technical Report, NREL/TP‐6A20‐51253, June 2011. Milligan, M., E. Ela, B‐M. Hodge, B. Kirby, D. Lew, C. Clark, J. DeCesaro, and K. Lynn, Cost‐ausation and Integration Cost Analysis for Variable Generation,” Technical Report, CNREL/TP‐5500‐51860, June 2011. illigan, M., et al., Large‐Scale Wind Integration Studies in the United States: Preliminary M
Results, Conference Paper, NREL/CP‐550‐46527, September 2009. Mills, A., and R. Wiser, “An Evaluation of Solar Valuation Methods Used in Utility Planning nd Procurement Processes,” Environmental Energy Technologies Division, Lawrence aBerkeley National Laboratory, LBNL‐5933E, December 2012a. Mills, A., and R. Wiser, “Changes in the Economic Value of Variable Generation at High Penetration Levels: Pilot Case Study of California”, June 2012b, Lawrence Berkeley

101
National Laboratory, LBNL‐5445E. See http://eetd.lbl.gov/ea/emp/reports/lbnl‐5445e.pdf.
Navigant, Sandia National Laboratories, and Pacific Northwest National Laboratory, “Large‐Scale PV Integration Study prepared for NV Energy,” July 30, 2011. See http://www.navigant.com/~/media/Site/Insights/NVE_PV_Integration_Report_Energy.ashx.
North American Electricity Reliability Corporation (NERC), Special Report: Accommodating High Levels of Variable Generation, 2009.
National Renewable Energy Laboratory (NREL), Renewable Electricity Futures Study, 2012. See http://www.nrel.gov/analysis/re_futures/.
Perez, R., M. Taylor, T. Hoff, and J.P. Ross. “Reaching Consensus in the Definition of Photovoltaics Capacity Credit in the USA: A Practical Application of Satellite‐Derived Solar Resource Data.” IEEE Journal of Selected Topics in Applied Earth Observations and Remote Sensing, 1 (1): 28–33, 2008.
Sioshansi, R. and P. Denholm. “The Value of Concentrating Solar Power and Thermal Energy Storage.” IEEE Transactions on Sustainable Energy. 1 (3) 173‐183, 2010.
Sioshansi, R. "Emissions Impacts of Wind and Energy Storage in a Market nvironmentE ," Environmental Science and Technology, Vol 45, No 24, pp 10728‐10735, December, 2011.
arabolic Turchi, C., M. Mehos, C. K. Ho, and G. J. Kolb, Current and future costs for prough and power tower systems in the US market, National Renewable tEnergy Laboratory, Technical Report, NREL/ CP‐5500‐49303, Oct. 2010. Usaola, J., Participation of CSP plants in the reserve markets: A new challenge for egulators, Energy Policy, 2012, r http://dx.doi.org/10.1016/j.enpol.2012.06.060

102
Acknowledgments
This project was initiated for the CSP Alliance by Joe Desmond, BrightSource Energy, Fred Morse, Abengoa Solar, and Tex Wilkins, CSP Alliance. The report was prepared by Udi Helman, Managing Director, Economic and Pricing Analysis, BrightSource Energy, and David Jacobowitz, Product Marketing Manager, BrightSource Energy. Many other people contributed data and provided comments. In particular, we would like to thank the following for their comments and support: Brendan Acord, BrightSource Energy; Paul Denholm, National Renewable Energy Laboratory; Jon Forrester, BrightSource Energy; Adam Green, Solar Reserve; Warren Katzenstein, DNV‐KEMA; Or Kroyzer, BrightSource Energy; Tandy McMannes, Abengoa Solar; Mark Mehos, National Renewable Energy Laboratory; Andrew Mills, Lawrence Berkeley National Labs; Hank Price, Abengoa Solar; Ramteen Sioshansi, Ohio State University; and Mitch Zafer, Brightsource Energy.
However, reviewers of the report are not responsible for any subsequent errors or nterpretations of results. i

103
Appendix A: Calculation of Annual Solar Energy Production as a Percentage of Total Load in California 33% RPS cenarios S
This table shows the total annual energy from PV forecast in different California scenarios as a percentage of annual energy for the three investor‐owned utilities (IOUs), to provide perspective on how these scenarios can be compared to the results of the capacity valuation studies discussed in Section 7. To derive the annual energy estimate, a capacity factor was assumed for the different solar technologies. For the DG policy goals, a DG capacity factor range of 16 – 22.5% was assumed. For the CPUC goals, the capacity factors in the LTPP 2010 proceeding were adopted.
Table 14: Forecast PV energy production as a percentage of annual California or CAISO load in 2020
Scenario GW (capacity) Annual Energy (TWh)
% of Total Annual Load
Governor Brown PolicGoals
y 17.2larg
(DG plus e projects)
28.8‐35.6 9.5 – 11.8 oad California wide l
2010 CPUC 33% RPS Trajectory Scenario
4.9 11 5.2 CAISO IOU load
2010 CPUC 33% RPS Environmental Scenario
11.7 24 11.2 CAISO IOU load
2012 CPUC 33% RPS Scenarios (Range)
7.5 ‐ 13.1 16.5 ‐ 27.7
7.8 – 13.1 CAISO IOU load

104
Appendix B – Methodology for Calculating California ISO Integration Costs
To date, most wind and solar integration studies have reported average integration costs, in the ranges discussed in Section 8, but have not reported costs on an hourly basis across the year. Because CSP with thermal energy storage has the unique characteristic of charging across the daylight hours, and then being available for dispatch during hours with high system ramps in the late afternoon and early evening. In that case, there could be above‐average value, in terms of avoided integration costs when compared to non‐dispatchable solar technologies, to thermal storage in those hours. To evaluate this hypothesis, BrightSource Energy examined the data from the simulations conducted by the California ISO of integration under 33% RPS, and derived some estimates of hourly integration costs, as shown below. These results are intended to demonstrate the finding, but need further testing and validation.
The California ISO simulations conducted in 2010‐11, did not explicitly calculate integration costs, but rather focused on simulating whether additional resource “needs” could be defined given a set of operational requirements and assumptions about future load and resources needed to meet the planning reserve margin in 2020. Four “core” 33% RPS scenarios were examined as well as several sensitivity cases on both input assumptions (e.g., forecast errors) and scenario definitions. The integration requirements were defined as the capacity (MW) of Regulation Up (RU), Regulation Down (RD), Load‐following Up (LFU) and Load‐following Down (LFD) that would need to be reserved on an hourly basis. In practice, only a portion of the future load‐following requirement is likely to be procured as a load‐following ramping reserve, with the remainder procured through 5‐minute economic dispatch, but the calculated load‐following requirement in the data sets is still indicative of the likely hours of greatest market impact.
As discussed above, neither BrightSource nor any other party to date has conducted a full sequence of simulations needed to fully evaluate the effect of CSP with thermal storage on integration requirements and costs, but some results may be forthcoming as a result of simulations being consulted by other entities, such as NREL.
Methodology
BrightSource’s methodology for assessing integration costs was to calculate on a per‐period basis, the cost of integration (defined as the incremental cost of load following and

105
regulation over and above historical levels) and divide that by the RPS energy production for that period, resulting in a $/MWh integration cost.
Hourly ancillary service (AS) prices and requirements for the LTPP 33% RPS Trajectory scenario (and other scenarios) were available directly from the publicly released CAISO and joint IOU integration study files. Because BSE wanted to isolate the incremental cost of integrating RPS energy, we deducted typical current‐day historical quantities for the required load following and regulation requirements, 350 MW for each of regulation up and regulation down, and 1000 MW for each of load following up and down.
For the denominator in our calculation, the hourly RPS energy, BSE used the following methodology:
Capacities (MW) and annual generation (GWh) for each category of renewable resource are provided in the LTPP documentation. Because some of these resource are out of state and the CAISO only modeled managing the integration for 15% of the OOS resources, we calculated the net capacity to be integrated for each resource type as: total – 0.85 × out‐of‐state.
Hourly output profiles for an array of wind, large solar, and solar DG resource were available in the California ISO study input files (in the “Fixed Dispatch” folders). From the available resource profiles, we selected those that were easily identifiable as being in California, and normalized their output to an hourly capacity factor. The normalization was done using the stated capacity of the resource, if it was present in the file. If there was no stated capacity in the input file, for each resource, the highest hourly output of the year was assumed to represent the capacity.
For CSP solar, BrightSource used our own non‐storage hourly capacity factors.
For each resource type of wind, large solar, solar DG, and CSP, we then scaled the hourly capacity factors by the LTPP planning capacity for the given scenario, to generate output curves
All the curves were summed to yield an overall RPS energy quantity on an hourly basis.
Using these 8784 hour strips (2020 is a leap‐year) for AS requirements, AS‐prices, and RPS MWh, were directly able to calculate integration costs as:
FU_baseline[i]) + Integ_cost[i] = Prc_LFU[i] * ( Req_LFU_scenario[i] – Req_L
Prc_LFD * (Req_LFD_scenario[i] – Req_LFD_baseline[i]) +
Prc_RU[i] * (Req_RU_scenario[i] – Req_RU_baseline[i]) +

106
Prc_RD * (Req_RD_scenario[i] – Req_RD_baseline[i]).
Where ‘i’ is the hour, LFU is load‐following up, LFD is load‐following down, RU is Regulation Up, RD is Regulation Down, Req means “requirement”, Prc means “price”, and baseline refers to the historical quantity deducted to isolate the incremental requirement for variable energy resources. From these quantities, we calculated the costs assignable to wind and solar.
Hourly integration cost assigned to renewable ($/MWh) [i] = Integ_cost[i] / RPS_energy[i]
We performed this calculation on an hourly basis, but the results can be somewhat misleading because the cost to integrate a resource is not necessarily tied to its behavior in that hour alone, but also to the duration and magnitude of the system ramps caused in the hours preceding and following the hour in question. Because of that, each day was divided into four intervals that capture the different behavior of solar resources: night, morning ramp, day, and evening ramp. The calculation remains the same as above, but ‘i’ in this case represents the hourly values aggregated to the period in question.
The next two figures plot some of the relationships between absolute hourly integration costs, integration costs in $/MWh assigned to wind and solar, and renewable production found by this analysis.
Figure 37: Absolute Hourly Integration Costs against Hourly Renewable Production, Trajectory Case
0
10000
20000
30000
40000
50000
60000
0
1000
2000
3000
4000
5000
6000
7000
8000
9000
0 1 2 3 4 5 6 7 8 9 10 11 12 13 14 15 16 17 18 19 20 21 22 23
$
MWh
Hour
Renewable Production (MWh) Total Incremental Integration Cost ($)

107
Figure 38: Normalized Average Hourly Renewable Production (MWh), Hourly Average Integration Costs ($) and Hourly Average Integration Costs Divided by Renewable Production ($/MWh)
0
0.2
0.4
0.6
0.8
1
0 1 2 3 4 5 6 7 8 9 10 11 12 13 14 15 16 17 18 19 20 21 22 23
Renewable Production Total Incremental Integration Cost Integ Cost / MWh

108
108


