The Economic Contribution of Agriculture to the Utah Economy in 2014 The Economic Contribution of Agriculture to the Utah Economy in 2014 Dept. of Applied Economics Utah State University UMC 4835 Logan, UT 84322-4835 Prepared for Utah Department of Agriculture and Food Utah State University Economic Research Instute Report #2016-01 October 2016 Ruby A. Ward Professor Karli Salisbury Research Assistant
Transcript
The Economic Contribution of Agriculture
to the Utah Economy in 2014
The Economic Contribution of Agriculture
to the Utah Economy in 2014
Dept. of Applied EconomicsUtah State University
UMC 4835Logan, UT 84322-4835
Prepared for Utah Department of Agriculture and Food
Utah State University Economic Research Institute Report #2016-01October 2016
Ruby A. WardProfessor
Karli SalisburyResearch Assistant
-2-
Situation
• The study of the economic contribution of agriculture to the Utah economy defines agriculture as the combination of the agriculture production sectors (NAICS codes 111, 112 and 115) and the agriculture processing sectors (NAICS codes 311 and 312).
• Our economic analysis captures the direct sales (output) of agriculturally oriented businesses within the state, as well as the indirect and induced (multiplier) effects of these expenditures. Analysis was conducted using Version 3 of the Impact Analysis for Planning (IMPLAN) model and its 2014 database.
• In 2014, production agriculture, including farming, ranching, dairy, and other related support industries, accounted for over $2.4 billion in direct output (sales), with a total of $3.5 billion in total economic output after adjustment for multiplier effects.
- Based on Utah’s 2014 Gross State Product of $140 billion, production agriculture directly accounts for 1.7% of total state output and accounts for 2.5% with multiplying effects.
- The production agriculture sector directly employs 18,000 people in either full or part-time positions. When including the multiplying effect, production agriculture accounts for roughly 26,000 jobs with an income compensation of $583 million.
• Total direct output by the agricultural processing sector was approximately $10.7 billion in 2014.
• The agriculture processing sector and the production agriculture sector combined account for $21.2 billion in total economic output in Utah after adjusting for multiplier effects.
- Based on Utah’s 2014 Gross State output, production agriculture and its associated processing sector accounts for 15.1% of total state output.
- Production agriculture and the agriculture processing sector directly employ approximately 37,320 people in full or part-time positions. They account for another 42,254 jobs due to multiplying effects, for a total of 79,573 people with income compensation of $3.5 billion.
• The agriculture production and processing sectors generate $497 million in state and local taxes. This included $380 million in indirect business taxes, $98 million in personal taxes, and $18 million in corporate taxes.
• The agriculture production and processing sectors generate $515 million in federal taxes, excluding social security tax. This included $77 million in indirect business taxes, $226 million in personal taxes, and $211 million in corporate taxes.
-3-
Agriculture Production and Processing in Utah
In 2014 Utah’s gross state output increased by 4.5% relative to 2013, to just over $140 billion. The agriculture production sector has grown 18.28% in cash receipts in 2014 relative to 2013 (Figure 1). Relative to the depth of the Great Recession in 2009 – when the gross state product and the value of agriculture receipts reached their lowest – the state’s GSP has grown 21.1% while production agriculture receipts have grown over 85%. Most of this growth can be associated to the increase in the markets for beef cattle production, dairy cattle/milk production, and hay.
Total cash receipts (output) for production agriculture in 2014 were just under $2.4 billion. About 78% of cash receipts were derived from the sales of livestock and products, with the remainder 22% coming from the sales of crops.
Introduction
Production agriculture and the agriculture processing sectors are important elements of Utah’s economy. These economic sectors contribute jobs, income, fiscal revenues, and quality of life to not only rural regions of the state, but also to its more urbanized regions. Indeed, Utah County – part of the highly urbanized Wasatch Front – has the second greatest value of agricultural receipts, closely preceded by Beaver County as the number one county for total cash receipts in Utah for 2014.
This report calculates the economic contribution of agriculture production and processing to the economy of the state of Utah in 2014. Economic impact analysis captures the direct sales (output) of agriculturally-oriented businesses within the state, as well as the indirect and induced (multiplier) effects of these expenditures. The definition of production agriculture and agricultural processing as used in this report includes NAICS1 Sectors 111 (Crop Production), 112 (Animal Production), 1151 and 1152 (Support Activities for Crop and Animal Production, respectively), and Sectors 311 and 3121 (Food Manufacturing) . These sectors include all primary agricultural production in the state, with the exception of forest products, and the industries that either support the primary production or further process agriculture products.
First, we discuss the agriculture production and processing sectors in Utah, followed by an explanation on economic impact analysis. The economic contribution of the agriculture production sector is then presented, after which the combined results for the agriculture production and processing sectors are shown.
1 NAICS is an acronym for North American Industry Classification System.
-
$500
$1,000
$1,500
$2,000
$2,500
Farm Cash Receipts ($ Millions)
Beef Cattle Production Dairy Cattle/Milk ProductionPoultry/Egg Production All Other Animal ProductionGrains/OilseedAll Other Crops*
Hay
2009
$1,080
2010
$1,349
2010
$1,688
2011
$1,815
2012
$2,008
2013
$2,375
2008
$1,473
*All Other Crops include: Onions, Mushrooms, Greenhouse/Nursery, and Fruits/Nuts
The agricultural processing and manufacturing sector contributes about $10.4 billion in total direct output to the Utah economy. The agricultural processing sector saw 24% growth in the output value relative to 2011 ($8.3 billion). The largest processing activities by value of output are associated with dairy: cheese manufacturing ($1.7 billion, or over 16% of the total output) and fluid milk manufacturing ($0.7 billion, or 6.5% of the total). Other major agriculture processing activities include: animal processing (17%), dog and cat food manufacturing (8.8%), and frozen food (6%).
Using Regional Economic Models to Determine Economic Contribution
Regional economic analysis the value of the total direct sales (output) of the production agriculture and agricultural processing sectors with spending multipliers derived from an input-output model of the Utah economy. We use the model for Utah developed by the Minnesota IMPLAN Group2. An input-output (I-O) model traces the flow of goods and services through the regional economy, where the model is sturctured to capture the inter-industry relationships within the region.
I-O models are constructed to yield etimates of the indirect (backward linkage), and induced (forward linkage) effects in an economy. Indirect effects, or backward linkages, account for business-to-business purchases where businesses purchase inputs for other businesses, which in turn purchase additional inputs. For production agricultlure, backward linkages include effects of agricultural production on the businesses that support these activities: the output of firms that supply agricultural inputs such as seed, machinery, and financial services. Induced effects, or forward linkages, account for the effects of the increased demands for goods and services because of increased household income from employee compensation and proprietors’ income. The induced effects would include the effects of spending by households, as household income fluxuates due to the economic activity in the agricultural production sector and its backward linked supply firms. A similar interpretation would hold for output produced by the agricultural processing sector. The total contirbution is the sum of the direct, indirect, and induced effects.
Our analysis uses conservative estimates of agricultural activity. For example, the IMPLAN model values Utah’s 2014 production agriculture output at $2.6 billion, while the 2015 Utah Agriculture Statistics Report (UASR) values 2014 production agriculture at $2.4 billion.
2 The IMPLAN software and data sets are used by many federal and state agencies in conducting impact analysis. More information about IMPLAN can be found at http://implan.com/v3/.
-5-
In the intrest of generating the most conservative estimate of the economic impact of agriculture on the state’s economy we have opted to focus the main portion of our report using only cash receipts from the 2015 UASR. However, the UASR numbers lacked enough detail to allocate them to the various IMPLAN production agriculture sectors. So we used the proportional distribution from IMPLAN, but the total value from USAR.
We supplement this analysis by also providing an alternative estimate of economic impacts by using the 2015 Utah Agriculture Statistics Report as well as the estimated values of commodities that are not sold on the market (Appendix A). Both numbers from IMPLAN and USAR are based off of cash receipts, and neither account for the products that are produced but not sold. Many agricultural products, such as hay and corn, are produced and used in a vertically integratred agribusiness; historically, cash receipts only account for 27% of actual production. According to the USAR and the IMPLAN model, hay fed to dairy or beef cattle may never be sold on the market, so the cash value is zero. While the USAR and the IMPLAN model are both accurate in reporting cash receipts, they do not attempt to capture the full value of production. In the past IMPLAN used the value of products produced and not cash receipts. We used the cash receipts from USAR, but provided the value if we had used the value of production numbers from IMPLAN. Since IMPLAN no longer does this, we used the past relationship between cash receipts and value of products produced, to impute a value of products produced. We provided this in Appendix A for comparrison with reports from previous years.
Results for Production Agriculture
Table 1 shows the output, income, and employment effects of production agriculture (NAICS Codes 111, 112, and 115) on the Utah economy. As stated above, we use only cash receipts received from the primary production of livestock, dairy, and crop products. The $2.4 billion in cash receipts (output) resulted in an additional $1.1 billion in indirect and induced effects (a multiplier effect of 1.68). The $3.5 billion in total effects for output accounts for 2.4% of Utah’s $140 billion economy. The total value added of $1.95 billion accounts for 1.4% of Utah’s economy. Approximately 18,000 persons were employed directly by production agriculture in either full-time or part-time position. An additional 5,100 jobs were generated in other businesses because of the indirect effects of business-to-business purchases. The induced effects of household spending account for over 2,800 additional jobs. The total employment effect of agriculture production on the Utah economy is estimated at 26,000 jobs, with a total labor income of $583 million.
Table 1: Economic Contribution of Utah’s Production Agriculture to Utah’s Economy, 2014 Direct Indirect Induced TotalOutput ($ Millions) $2,375 $732 $369 $3,477Employment 17,968 5,141 2,762 25,871Labor Income ($ Millions) $345 $130 $109 $583Total Value Added ($ Millions) $1,392 $361 $200 $1,953Source: IMPLAN analysis using the revised 2014 agriculture receipts (2015 Agricultural Statistics)
-6-
Results for Agriculture Production and Processing Sectors Combined
One must exercize care when conducting the analysis for both production agriculture and the processing sector. The problem is one of double counting, and is rooted in a simple issue. For example, does dairy proecssing “cause” dairy production, or dairy production “cause” dairy processing? We do not wish to double-count the indirect effects – business-to-business purchases – across the two sectors. Our method for eliminating the problem is to prevent the processing sector from purchasing locally produced raw agricultural commodities. In our IMPLAN model we set the Regional Purchase Coefficient (RPC) equal to zero for all agriculture processing sectors that purchase from the local production agriculture sectors. This removes double-counting by eliminating the processing sector’s backward linkage to Utah producers – which is already accounted for in agricultural receipts. This approach allows us to produce the most conservative setimate of the economic impact of both production agriculture and agricultural processing sector.
From Table 2, the direct effects of production agriculture and agriculture processing on the Utah economy total some $13 billion, with a total impact of $21 billion (a multiplier effect of 1.62). In 2014 production and processing of agricultural products in Utah accounted for 15% of Utah’s Gross State Product. The estimate of value-added by agriculture – roughly $6.7 billion – represents a little over 4.8% of the Utah economy. With the addition of the multiplying effects the agriculture processing and production sectors provide over 79,000 jobs, yeilding over $3.5 billion in labor income.
Table 2: Economic Contribution of Utah’s Production Agriculture and Agriculture Processing to Utah’s Economy, 2014
Direct Indirect Induced TotalOutput ($ Millions) $13,044 $5,931 $2,203 $21,178Employment 37,320 26,439 15,815 79,573Labor Income ($ Millions) $1,467 $1,385 $647 $3,459Total Value Added ($ Millions) $3,183 $2,350 $1,189 $6,722Source: IMPLAN analysis using the revised 2014 agriculture receipts (2015 Agricultural Statistics)
Fiscal Impacts of Agriculture in Utah
The IMPLAN model also tracks the local, state, and federal income tax effects of changes in economic output. These effects are presented in Table 3. Excluding taxes associated with Social Security, the production agriculture and agricultural processing sectors generate some $497 million in state and local tax revenues, and about $515 million in federal tax receipts.
Table 3: Economic Contribution of Agriculture to Fiscal Revenues for Local, State, and Federal Entities ($ Millions) State and Local Taxes Federal TaxesHousehold (Personal) Taxes $98 $226Indirect Business Taxes $380 $77Corporate Profit Taxes $18 $211Total $497 $515Source: IMPLAN analysis using the revised 2014 agriculture receipts (2015 Agricultural Statistics)
-7-
A Closer Look at Food Manufacturing in Utah
Agriculture has long been associated with rural regions and, for production agriculture, this perception is correct. As the previous tables have shown though, the economic contribution of agriculture to the state’s economy is not limited to primary agricultural production but also includes processing of primary products. As it turns out, the vast majority of processing activity occurs in the more metropolitan areas of the state.
Analysis of the County Business Patterns database (maintained by the U.S. Census Bureau) reveals the degree to which agricultural processing contributes to the economic vitality of the urban centers of Utah. Our analysis focuses on the two-digit NAICS codes for All Manufacturing (31) and the three digit sub-code for Food Manufacturing (311) for the most recent year for which data are available, 2014. Table 4 shows employment and payroll information for all manufacturing and for food manufacturing in Utah and its five metropolitan statistical areas (MSAs).
Table 4: All Manufacturing and Food Manufacturing in Utah and Utah Metropolitan Statistical Areas (U.S. Census Bureau, 2014)
Region All Manufacturing Food Manufacturing Food, as % of All Manufacturing
Logan UT-ID Metro Area# of Employees 11,438 3,685 32.2%Annual Payroll ($1,000) $463,562 $145,714 31.4%
Ogden-Clearfield UT Metro Area# of Employees 28,970 4,202 14.5%Annual Payroll ($1,000) $1,643,606 $172,564 10.5%
Provo-Orem, UT Metro Area# of Employees 17,919 2,618 14.6%Annual Payroll ($1,000) $936,221 $108,717 11.6%
Salt Lake City, UT Metro Area# of Employees 48,977 4,521 9.2%Annual Payroll ($1,000) $2,905,172 $189,901 6.5%
St. George, UT Metro Area# of Employees 2,444 250-499** --Annual Payroll ($1,000) $91,236 --** --
** Data withheld to avoid disclosing data for individual companies
Table 4 reports that of 114,500 manufacturing jobs in the state of Utah, just over 14% are located in the food manufacturing sector. Food manufacturing jobs account for approximately 10.5% of all income paid to manufacturing employees. These last two figures suggest that employees in the food manufacturing sector are not as well-paid as those in other manufacturing sectors. This should not be a surprise as many manufacturing jobs in other sectors are likely to require more highly-skilled labor than the food processing sector. However, employees in the food manufacturing sector remain well-compensated: assuming a standard 40 hour work week and two weeks of vacation per year, food manufacturing workers earn an average hourly wage of approximately $20.22.
-8-
those in other manufacturing sectors. This should not be a surprise as many manufacturing jobs in other sectors are likely to require more highly-skilled labor than the food processing sector. However, employees in the food manufacturing sector remain well-compensated: assuming a standard 40 hour work week and two weeks of vacation per year, food manufacturing workers earn an average hourly wage of approximately $20.22 .
The food manufacturing sector makes its largest proportional contribution to the economy of the Logan UT-ID Metro Area, where it provides approximately 32% of all manufacturing employment and 31% of all manufacturing income. The economy of the Ogden-Clearfield UT Metro Area also has a relatively large food manufacturing sector, with 14.5% of all manufacturing jobs and 10.5% of manufacturing income derived from food manufacturing. The Provo-Orem UT Metro Area has also become a sizeable food manufacturing hub making up 14.6% of all manufacturing jobs and 11.6% of manufacturing income. Even in the highly urbanized Salt Lake City Metro Area—the MSA with the largest manufacturing base—food manufacturing contributes some 9% of all manufacturing jobs and 6.5% of manufacturing income. Confidentiality restrictions prevent the calculation of similar figures for the St. George Metro Area, though we can
References
County Business Patterns. 2016. Annual Series. Released May 5, 2016. Retrieved June 20, 2016. http://www.census.gov/data/tables/2014/econ/cbp/us-states-counties-pr-island-areas.html
US Bureau of Economic Analysis. 2015. “Broad Growth Across States in 2014”, Released June 10, 2015. Retrieved May 3, 2016. http://www.bea.gov/newsreleases/regional/gdp_state/gsp_newsrelease.htm
Utah Department of Agriculture and Food. 2015. “Utah Agricultural Statistics and Utah Department of Agriculture and Food 2014 Annual Report. Salt Lake City.
Ward, Ruby A., Paul M. Jakus, and Lassina Coulibaly. 2013. “The Economic Contribution of Agriculture to the Economy of Utah in 2011.” Center for Society, Economy and the Environment CSEE Research Report #3. February.
-9-
Appendix A:
Including Agricultural Products Produced and Used by an Integrated Agribusiness
If one includes the value of all primary agricultural production, the total output is about $4.5 billion, or about 3.2% of gross state product (Table A1). When the production and processing sectors are both included, total direct, indirect and induced effects are about $22 billion, or about 15.7% of gross state product (Table A2).
Table A-1: Economic Contribution of Utah’s Production Agriculture to Utah’s Economy (Including Non-Marketed Production), 2014 Direct Indirect Induced TotalOutput ($ Millions) $3,073 $857 $570 $4,500 Employment 30,216 6,179 4,263 40,657Labor Income ($ Millions) $567 $163 $167 $899 Total Value Added ($ Millions) $1,874 $423 $308 $2,606 Source: IMPLAN analysis using the revised 2014 agriculture receipts (2015 Agricultural Statistics)
Table A-2: Economic Contribution of Utah’s Production Agriculture and Agriculture Processing to Utah’s Economy (Including Non-Marketed Production), 2014 Direct Indirect Induced TotalOutput ($ Millions) $13,752 $6,060 $2,412 $22,224 Employment 49,567 27,477 17,315 94,359Labor Income ($ Millions) $1,658 $1,421 $709 $3,788 Total Value Added ($ Millions) $3,686 $2,415 $1,302 $7,400 Source: IMPLAN analysis using the revised 2014 agriculture receipts (2015 Agricultural Statistics)
-10-
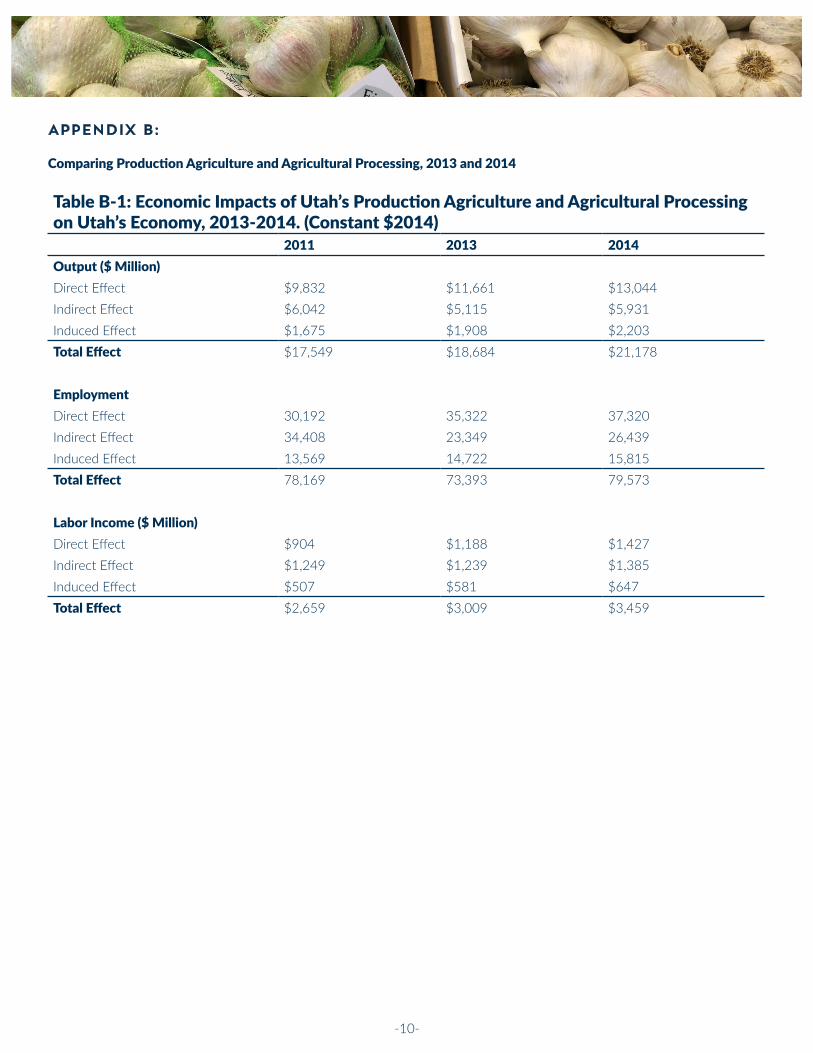
Appendix B:
Comparing Production Agriculture and Agricultural Processing, 2013 and 2014
Table B-1: Economic Impacts of Utah’s Production Agriculture and Agricultural Processing on Utah’s Economy, 2013-2014. (Constant $2014)