International Journal of Academic Research in Economics and Management Sciences March 2013, Vol. 2, No. 2 ISSN: 2226-3624 36 www.hrmars.com/journals The Contribution of Economic Sectors to Economic Growth: The Cases of Malaysia and China Fauzi Hussin Department of Economics, Finance & Banking, Northern University of Malaysia, Malaysia Email: [email protected]Chee Wuan Ching Department of Economics, Finance & Banking, Northern University of Malaysia, Malaysia Abstract Malaysia and China have recently achieved spectacular economic growth where GDP per capita growth rapidly in both countries. Thus, this study examines the contribution of economic sectors to economic growth in Malaysia and China by using time series data from year 1978 until 2007. There are three economic sectors that will be analyzed, which are agricultural sector, manufacturing sector and service sector. Augmented Dickey Fuller (ADF) unit root test is used in this study and it showed that the time series data are stationary at the first differences. Then, correlation analysis indicated that agriculture sector, manufacturing sector and service sector had positive relationship with GDP per capita in Malaysia and China. In addition, results of model multiple regressions showed that services sector generated the highest contribution to Malaysia’s economic growth while manufacturing sector provided the biggest contribution to China’s economic growth. Keywords: China; Malaysia; economic growth; economic sectors 1.0 Introduction The prominent economic growth of China since the early 1980s and Malaysia since the late 1970s had been often a topic of discussion economic development and economic reform for the past few years. Both countries embarked on economic reform that characterized by deregulation and liberalization, which opened up their economies to international trade and attracted foreign investment. China reformed earlier and much more aggressively than Malaysia, beginning in the year of 1981. On the other hand, Malaysia is one of the most successful non-western countries to have achieved a relatively smooth transition to modern economic growth over the last century. 2.0 Overview of Malaysia’s Economy Since the late 1970s, Malaysia’s economic development strategy is based on three long‐term policies: the New Economic Policy (NEP), 1970-1990, the National Development Policy (NDP), 1990-2000, and the National Vision Policy (NVP), 2001. By 1990 Malaysia had met the criteria as a Newly-Industrialized Country (NIC) which means 30 percent of exports consisting manufactured goods. Malaysia today is one of the biggest exporters of semiconductors and electronic goods and devices. The semiconductor industry contributes
Transcript
International Journal of Academic Research in Economics and Management Sciences March 2013, Vol. 2, No. 2
ISSN: 2226-3624
36 www.hrmars.com/journals
The Contribution of Economic Sectors to Economic Growth: The Cases of Malaysia and China
Fauzi Hussin Department of Economics, Finance & Banking, Northern University of Malaysia, Malaysia
Chee Wuan Ching Department of Economics, Finance & Banking, Northern University of Malaysia, Malaysia
Abstract Malaysia and China have recently achieved spectacular economic growth where GDP per capita growth rapidly in both countries. Thus, this study examines the contribution of economic sectors to economic growth in Malaysia and China by using time series data from year 1978 until 2007. There are three economic sectors that will be analyzed, which are agricultural sector, manufacturing sector and service sector. Augmented Dickey Fuller (ADF) unit root test is used in this study and it showed that the time series data are stationary at the first differences. Then, correlation analysis indicated that agriculture sector, manufacturing sector and service sector had positive relationship with GDP per capita in Malaysia and China. In addition, results of model multiple regressions showed that services sector generated the highest contribution to Malaysia’s economic growth while manufacturing sector provided the biggest contribution to China’s economic growth. Keywords: China; Malaysia; economic growth; economic sectors 1.0 Introduction The prominent economic growth of China since the early 1980s and Malaysia since the late 1970s had been often a topic of discussion economic development and economic reform for the past few years. Both countries embarked on economic reform that characterized by deregulation and liberalization, which opened up their economies to international trade and attracted foreign investment. China reformed earlier and much more aggressively than Malaysia, beginning in the year of 1981. On the other hand, Malaysia is one of the most successful non-western countries to have achieved a relatively smooth transition to modern economic growth over the last century. 2.0 Overview of Malaysia’s Economy
Since the late 1970s, Malaysia’s economic development strategy is based on three long‐term policies: the New Economic Policy (NEP), 1970-1990, the National Development Policy (NDP), 1990-2000, and the National Vision Policy (NVP), 2001. By 1990 Malaysia had met the criteria as a Newly-Industrialized Country (NIC) which means 30 percent of exports consisting manufactured goods. Malaysia today is one of the biggest exporters of semiconductors and electronic goods and devices. The semiconductor industry contributes
International Journal of Academic Research in Economics and Management Sciences March 2013, Vol. 2, No. 2
ISSN: 2226-3624
37 www.hrmars.com/journals
approximately 30% of Malaysia's total manufacturing sector output and there are over 40 semiconductor companies which currently operating in Malaysia. Multinational companies have set up assembly plant and testing units in Malaysia.
After the transformation from agricultural economy into industrial economy, Malaysia is now poised to embrace the knowledge economy. In order to upgrade itself as the regional center of excellence in areas like information technology, health, tourism, insurance and education, the government work hard to develop the basis and fundamental for a knowledge economy. The basic needs to further this ambition include skilled labor, excellent infrastructure, strong science and technology, as well as a Research and Development (R&D) base. GDP per capita in Malaysia has grown 193% during year 1978 - 2007. Meanwhile, after attaining a steady growth rate of 31.21% during 1978-1984 and 90.45% during 1986-1997, Malaysia economy has slowed down to -3.82% in 1985 and a record low of -9.64% in 1998. The slowdown in 1998 is because of economic crises in Asia. Strong domestic demand continued to propel GDP growth in Malaysia which recorded a growth rate of 26.52% during 2001-2007. Malaysia is a rapidly developing economy among Asian countries. Although Malaysia was a middle-income country nowadays, Malaysia has transformed itself since the 1970s from a producer of raw materials into an emerging multi-sector economy. The sectors outputs of Malaysia show that the services sector is the largest contributor to economic growth of Malaysia. The manufacturing and services sectors played the dominant roles in the Malaysia's economy, and the contribution of the agricultural sector to economic growth seems to be trivial. It can be explained by the effects of transformation from agricultural economy into industrial economy of Malaysia since 1970s. 3.0 Overview of China’s Economy The rapidly growth in economy of China since the reform of their economic system beginning in 1978 when the Chinese concentrated more on the manufacturing sector compared to the agricultural sector. The reason might be because outputs of the agricultural sector are easily affected by the weather. For instance, a long draught season causes serious damage to crops at harvesting season. That might be one of the reasons why China shifted its focus from agriculture to manufacturing. The development of the manufacturing sector in China presents a sharp contrast to that of the agriculture sector, in terms of both the statistics and the pattern of performance. Manufacturing sector recorded the highest contribution to China’s economy during the period of 1978 to 2007. This fact proves that the economic transformation of China has been successful. Moreover, services sector recorded the second largest contribution to the economy from 1978 onwards. Meanwhile, agriculture contributes the least to China’s economy compared to the other two sectors after its economic transformation. The role of the manufacturing sector in the Chinese economy is clearly more significant than that of the agriculture and services sectors, whereby the sector contributes the highest to growth in China. Furthermore, the manufacturing sector generates more employment
International Journal of Academic Research in Economics and Management Sciences March 2013, Vol. 2, No. 2
ISSN: 2226-3624
38 www.hrmars.com/journals
opportunities to the highly-populated China and it also attracts foreign investor to invest in China. Moreover, as the number of factories increases in China, they also boost the export sector of the nation, bringing in more cash inflow to this huge market. As a result, the manufacturing sector acts as a major contributor to economic growth in China since the 1980s. The contribution of economic sectors to economic growth (real per capita GDP) in China can be evaluated from a different perspective. The manufacturing and services sectors grew consistently with the increase in real per capita GDP in China from 1978 to 2007. However, the ratio of agriculture sector to real per capita GDP fluctuated during the period. Then, agriculture showed a continuous decline when real per capita GDP increased in China from 1990 to 2007. The manufacturing and services sectors showed increasing trends while the agriculture sector showed a decreasing trend. Moreover, the manufacturing sector is the most developed sector compared to the other sectors. Again, these figures prove that the economic transformation of China has been successful. Hence, manufacturing is the most profitable sector in China as it contributes the most to real GDP per capita during the thirty year period. GDP per capita in China has continuously grown during year 1978-2007. It was attaining a steady growth rate of 137.44% during 1978-1990 and dramatics growth rate during 1991-2007. A major component supporting China's rapid economic growth is growth in exports. Besides, strong domestic demand continued to propel GDP growth in China. China's economy is the second largest in the world after United States. During the past 30 years, China's economy has changed from a state controlled which was largely closed to international trade to a more market-oriented that has a rapidly growing in private sectors. 4.0 Literature Review
Subramanian et al. (2009) by using a Vector Error-Correction Model (VECM) to indicate that incorporates the linkages among economic sectors such as agriculture sector, manufacturing sector, services sector, and trade sector. This procedure is used to identify the existence of long-run and short-run relationships among sectors in the economies of Poland and Romania. The findings show that the sectors in the Romanian and Poland economies moved together over the sample period, and for this reason their growth was interdependent.
Lewis (1954) and Chenery (1975) found that economic development is a structural transformation from agriculture activities to industrial activities. Kuznets (1966) has also claimed that, in the earlier stage agriculture sector plays an important role in industrial sector development through the outflow of capital from the agriculture sector, the outflow of surplus labor, agriculture tax revenue and through a movement in the structural terms of trade.
The study by Fu (2004) has found that exports and foreign direct investment play important roles in creating imbalances between regions in China. Export provides positive and significant impact on the growth of coastal provinces. Furthermore, foreign direct investment which is more concentrated in coastal regions compared to inland regions
International Journal of Academic Research in Economics and Management Sciences March 2013, Vol. 2, No. 2
ISSN: 2226-3624
39 www.hrmars.com/journals
further increased the income gap and urbanization between regions in China. Rapid growth of exports and foreign direct investment in the coastal regions attracted many laborers from the rural regions. However, government policies that encourage foreign and domestic investment to the rural regions could reduce imbalances between regions in China. Moreover, higher agricultural productivity encourages industrialization and improves long-run economic growth (Chan, Chen, and Hsu, 2006). Development economists have stressed a positive linkage between agricultural productivity and industrialization (Rostow, 1960; Ranis and Fei,1961). Agriculture is seen as providing both demand and supply-side links to industry. This is the theory explored by Hwa (1988) who hypotheses that ceteris paribus, faster agricultural GDP growth causes faster growth in industrial sector. Meanwhile, Linand Song (2002) study the relationship between per capita GDP growth and investment, foreign direct investment, employment growth, government budget and infrastructure for large and medium sized cities in China from 1991 to 1998. Cross-section analyzes is shows that foreign investment, infrastructure, and government spending for science and technology have positive relationship with per capita GDP growth, while other government budget as a whole have a negative impact on growth of GDP per capita. However, the relationship between total investment and GDP per capita growth rate is not significant. Mellor (1995) found a positive and significant relationship between agriculture sector and non-agricultural sector. Therefore, agriculture contributes to economic growth through a variety of linkages (Johnston and Mellor, 1961). Gemmell, Lloyd and Mathew (1998) concluded that any increases in manufacturing sector and services sector both will impact positively on productivity in agriculture in the long-run. Furthermore, Levine and Renelt (1992) and Leamer (1983) study to assess the ‘robustness’ of regression coefficients of agricultural growth and also of the stability of rice price on the growth of manufactures in Indonesia, Malaysia, and Thailand. In order to anticipate findings, regression results and sensitivity tests have suggested that regression coefficients on agricultural growth and rice price stabilization on the growth of manufactures are ‘robust’. Chow (1993) analyzes show physical capital formation in China’s economy and five productive sectors namely agriculture, industry, construction, transportation and trade could contribute to economic growth. He discovers that capital formation plays an important role in economic growth. Based on data from 30 provinces in China, Lin (2000) analyzes economic growth in China after economic reforms that began in 1978. He found that regions which invest more in state enterprises grew more slowly compared to regions that invest more in private enterprises. He also notes that openness policy, which is measured by the share of trade in GDP is positively correlated to per capita GDP growth. Another study, by Jones, Li, and Owen (2003) employ data from 200 cities in China to identify the differences in per capita income growth of the cities. Among their findings, there exist a significant positive relationship between foreign direct investment and
International Journal of Academic Research in Economics and Management Sciences March 2013, Vol. 2, No. 2
ISSN: 2226-3624
40 www.hrmars.com/journals
growth in per capita income but a negative correlation between population growth and per capita income growth. On the other hand, there is no significant relations hip between domestic investment and human capital with per capita income growth. Mean while, Zhangand Zou (1998) show how the allocation off is cal resources between the central government and local governments affects the economic growth of all provinces in China between 1978 and 1992. Development expenditure soft he federal government and regional economic growth show a positive and significant relationship. In contrast, the provincial government’s development expenditures are negatively related to real GDP growth of the regions. Katircioglu (2006) has studied the impact of agricultural sector on the economy of North Cyprus by using annual data from 1975 until 2002. The results of cointegration analysis and Granger causality have shown that the agricultural output growth and economic growth as measured by real gross domestic product growth are stationary at naturally cointegrated. They are in long run equilibrium relationship. He has concluded that agriculture sector still is an impact on economy growth despite the political problems and drought over the years. Fanand Dickie (2000) point out that the contribution of FDI to economic growth occurs through several channels. FDI has a direct impact as a source of capital formation. As part of private investment, an increase in FDI contributes to an increase in investment, there by directly contributing to growth. Their study shows that FDI contributes significantly to the economic development of ASEAN-5 in the period 1987-1997. FDI became a major source of capital formation and played a significant role in increasing economic growth. However, according to Blanchard (1997) capital accumulation itself cannot sustain an increase in output due to decreasing returns to capital. To maintain a higher output per worker requires a larger increase in the level of capital per worker, while an increase in technology could sustain growth. Previous findings on the role of FDI in China mostly show that FDI positively contribute to economic growth in the country. Pomfret (1997) and many other researchers reported that FDI positively and significantly contribute to economic growth in China, either through direct effects (such as increased productivity and promotion of exports) or positive externalities (such as technology transfer) (Zhang, 2001). Huand Khan (1997) examine the role of labor and capital in puts in the growth of China's economic aggregate output in the period 1952 to 1994. They found that capital input is the most important source of economic growth in China, which contributed about 65 percent of output growth compared to labor which only contributed about 15 percent of output growth. Wang, Wuand Gao (2010) perform an econometric model analysis for China for the period 1952-2007. Their study shows that there has always been a positive relation between agricultural growth and economic growth and discuss how agriculture contributes to economy growth. Their study concludes that although the share of agriculture in GDP has declined significantly over time, the contribution of agricultural growth has maintained an up world trend and it has made an important market, foreign exchange, factor (finance
International Journal of Academic Research in Economics and Management Sciences March 2013, Vol. 2, No. 2
ISSN: 2226-3624
41 www.hrmars.com/journals
and labor), and output contributions to non-agricultural growth and thus it remains as an irreplaceable driving force for economic growth. Therefore, agriculture still has a contributory role in economic growth. 5.0 Methodology 5.1 Data sources The data used in this study were secondary data obtained from the World Development Indicator (WDI) website. This study uses annual time series data from 1978 to 2007. The methodology used for data collection needs to be consistent with the objectives of the study. As this study examines the contribution of economic sectors (agriculture, manufacturing and services) to economic growth in China and Malaysia, secondary data is appropriate for the study. 5.2 Model Specification The research methodology focuses on the contribution of selected economic sectors such as agriculture sector, manufacturing sector and services sector on economic growth of Malaysia and China from year 1978 until 2007. In other words, the study attempts to examine the relationship between economic sectors and economic growth of Malaysia and China. Hence, correlation analysis and multiple regression analysis were used to examine the relationship between the dependent variable and the independent variables. The equation for the multiple regression analysis is: lngdpp = β0 + β1 lnagr+ β2lnmanu + β3lnserv + µ (1)
Where, lngdpp =Real Gross Domestic Product (GDP) per capita lnagr =Share of agricultural sector to real GDP per capita lnmanu=Share of manufacturing sector to real GDP per capita lnserv=Share of services sector to real GDP per capita
intercept0
tscoefficien 31
µ = error term 5.3 Variable Definitions
Real Gross Domestic Product per Capita, Y
Real GDP per capita is real gross domestic product (2000=100) divided by average yearly population. Real GDP per capita for China and India are converted into constant U.S. dollars. Dollar figures for real GDP per capita are converted from domestic currencies
International Journal of Academic Research in Economics and Management Sciences March 2013, Vol. 2, No. 2
ISSN: 2226-3624
42 www.hrmars.com/journals
(Yuan and Rupee) using single year official exchange rates. Real GDP per capita is the dependent variable in this study. The study aims to investigate the relationship between the contribution of economic sectors and economic growth in Malaysia and China. Agriculture Sector, X1
Agriculture sector is one of the sectors which are categorized in primary sector. Agriculture sector includes forestry, hunting, and fishing, as well as cultivation of crops and livestock production. This sector is important because it provides daily meals to people living. However, various transformations that have been conducted from time to time have lead to changes in economic structure. Therefore, this study is to examine the contribution and importance of agriculture sector on economic growth in Malaysia and China. Manufacturing Sector, X2
The industry sector, which includes manufacturing, construction, public utilities and mining, grew rapidly in China and India with high increase in employment. According to Kaldor (1967), manufacturing is an engine of economic growth as industrial goods have a higher-income elasticity of demand. Indeed, GDP growth in countries that were industrialized earlier was largely driven by manufacturing. Thus, this sector is chosen as one of the variables to be analyzed in terms of its contribution to GDP in Malaysia and China. Services Sector, X3
Services sector is an industry which does not produce raw materials or manufactured products but offers services. It is also known as tertiary sector in economy. The services sector primarily consists of wholesale and retail trade including hotels and restaurants; transportation; and government, financial, professional, and personal services such as education, health care, and real estate services. Besides, it also includes imputed bank service charges, import duties, and any statistical discrepancies noted by national compilers as well as discrepancies arising from rescaling. Apart from agriculture and manufacturing sector, services sector also contributed significantly to the national GDP. Therefore, this sector should be included as one of the variables in this study. 6.0 Stationarity Test This study used time-series analysis to study the relationships among the economic sectors for Malaysia and China. The Augmented Dickey Fuller (ADF) test is used to perform unit root test (Dickey and Fuller, 1979, 1981). Besides, the Dickey Fuller Unit Root Test is based on the equation of level and trend and intercept. The analysis shows that all the four variables failed to reject the unit root hypothesis at levels and rejected at the first-differences. In the first step of the estimation process, this study examines the stationary properties of the data series. In stationary time series, shocks will be temporary and over time their effects will be eliminated as the series revert to their long run mean values. On the other hand, non-stationary series will contain permanent components (Asteriou, 2006).
International Journal of Academic Research in Economics and Management Sciences March 2013, Vol. 2, No. 2
ISSN: 2226-3624
43 www.hrmars.com/journals
According to Nelsonand Plooser (1982), most of the time series that appear in the economy will have to be differenced in order to become stationary. In fact, most economic variables show a trend and therefore in most cases are non-stationary. Thus, the key to test for non-stationary is to test for the existence of a unit root. This study uses Augmented Dickey Fuller (ADF) test to perform the unit root tests. The ADF test includes extra lagged terms of the dependent and independent variables, which are real GDP per capita, agriculture sector, manufacturing sector and services sector in order to eliminate auto correlation. This study uses a regression model that includes an intercept and a time trend:
)2(11210 titiik
tt YYY
The ADF regression tests for the existence of unit roots of tY namely all model variables at
time t. The variable 1 tY represents the first differences with k lags while t is a variable
that adjusts the errors of autocorrelation. The coefficients 210 ,, and i are the
values be investigated. Table 1 reports the results of the ADF nit-root test for four variables in Malaysia and China in the levels and first differences. The results show that the series are stationary at first differences and non-stationary at level. Since all the series are at the same order, the dataset is appropriate for further analysis. In addition, the results show that the series are integrated at the first differences, I(1). Since all the time series variables are integrated at the same order, the data set is appropriate for further analysis. All the dependent and independent variables are stationary at the first differences.
Table1:Augmented Dickey-Fuller (ADF)unit root test results for Malaysia and
China.
Malaysia China
Level 1st Differences
Level 1st Differences
lngdpp -2.098715 -3.931665* 2.007874 0.549059*
lnagr -1.367868 -3.543543* -1.075617 -3.226802*
lnmanu -2.040029 -6.845283** 2.595024 -0.182182*
lnserv -0.192877 -4.911783** 2.20583 1.208674*
*,**indicate that the tau-values are significant at 5% and 1%,respectively.
International Journal of Academic Research in Business and Social Sciences May 2012, Vol. 2, No. 5
ISSN: 2222-6990
44
7.0 Empirical Results 7.1 Results of Regression Analysis One of the measures of goodness off it of regression models is the coefficient of
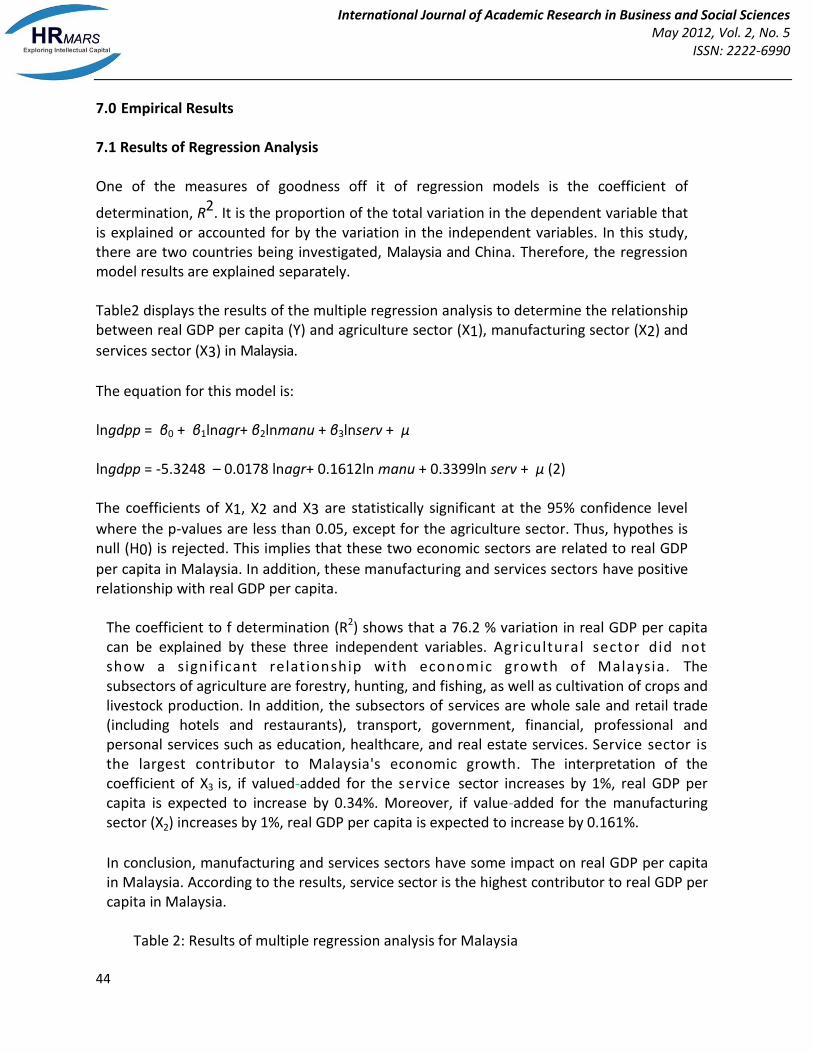
determination, R2. It is the proportion of the total variation in the dependent variable that is explained or accounted for by the variation in the independent variables. In this study, there are two countries being investigated, Malaysia and China. Therefore, the regression model results are explained separately. Table2 displays the results of the multiple regression analysis to determine the relationship between real GDP per capita (Y) and agriculture sector (X1), manufacturing sector (X2) and
services sector (X3) in Malaysia.
The equation for this model is: lngdpp = β0 + β1lnagr+ β2lnmanu + β3lnserv + µ lngdpp = -5.3248 – 0.0178 lnagr+ 0.1612ln manu + 0.3399ln serv + µ (2) The coefficients of X1, X2 and X3 are statistically significant at the 95% confidence level
where the p-values are less than 0.05, except for the agriculture sector. Thus, hypothes is null (H0) is rejected. This implies that these two economic sectors are related to real GDP
per capita in Malaysia. In addition, these manufacturing and services sectors have positive relationship with real GDP per capita.
The coefficient to f determination (R2) shows that a 76.2 % variation in real GDP per capita can be explained by these three independent variables. Agricultural sector did not show a signif icant relationship with economic growth of Malaysia. The subsectors of agriculture are forestry, hunting, and fishing, as well as cultivation of crops and livestock production. In addition, the subsectors of services are whole sale and retail trade (including hotels and restaurants), transport, government, financial, professional and personal services such as education, healthcare, and real estate services. Service sector is the largest contributor to Malaysia's economic growth. The interpretation of the coefficient of X3 is, if valued-added for the service sector increases by 1%, real GDP per capita is expected to increase by 0.34%. Moreover, if value-added for the manufacturing sector (X2) increases by 1%, real GDP per capita is expected to increase by 0.161%.
In conclusion, manufacturing and services sectors have some impact on real GDP per capita in Malaysia. According to the results, service sector is the highest contributor to real GDP per capita in Malaysia.
Table 2: Results of multiple regression analysis for Malaysia
International Journal of Academic Research in Business and Social Sciences May 2012, Vol. 2, No. 5
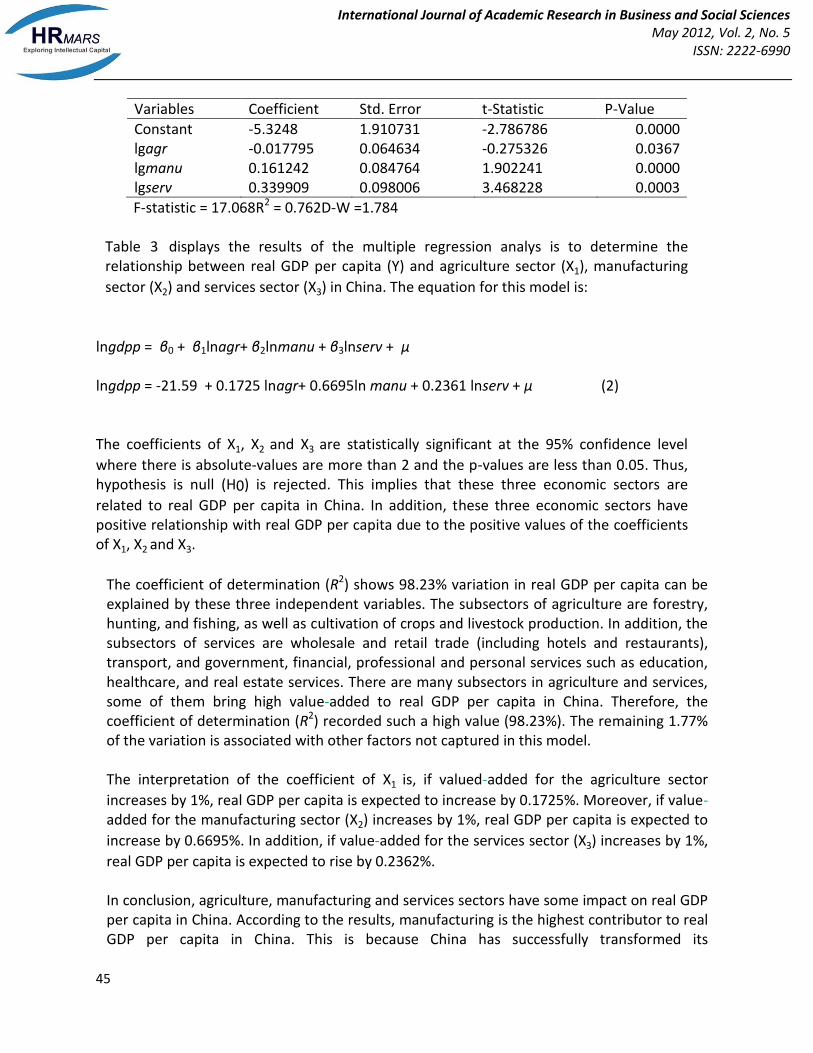
Table 3 displays the results of the multiple regression analys is to determine the relationship between real GDP per capita (Y) and agriculture sector (X1), manufacturing
sector (X2) and services sector (X3) in China. The equation for this model is:
lngdpp = β0 + β1lnagr+ β2lnmanu + β3lnserv + µ lngdpp = -21.59 + 0.1725 lnagr+ 0.6695ln manu + 0.2361 lnserv + µ (2) The coefficients of X1, X2 and X3 are statistically significant at the 95% confidence level
where there is absolute-values are more than 2 and the p-values are less than 0.05. Thus, hypothesis is null (H0) is rejected. This implies that these three economic sectors are
related to real GDP per capita in China. In addition, these three economic sectors have positive relationship with real GDP per capita due to the positive values of the coefficients of X1, X2 and X3.
The coefficient of determination (R2) shows 98.23% variation in real GDP per capita can be explained by these three independent variables. The subsectors of agriculture are forestry, hunting, and fishing, as well as cultivation of crops and livestock production. In addition, the subsectors of services are wholesale and retail trade (including hotels and restaurants), transport, and government, financial, professional and personal services such as education, healthcare, and real estate services. There are many subsectors in agriculture and services, some of them bring high value-added to real GDP per capita in China. Therefore, the coefficient of determination (R2) recorded such a high value (98.23%). The remaining 1.77% of the variation is associated with other factors not captured in this model.
The interpretation of the coefficient of X1 is, if valued-added for the agriculture sector
increases by 1%, real GDP per capita is expected to increase by 0.1725%. Moreover, if value-added for the manufacturing sector (X2) increases by 1%, real GDP per capita is expected to
increase by 0.6695%. In addition, if value-added for the services sector (X3) increases by 1%,
real GDP per capita is expected to rise by 0.2362%.
In conclusion, agriculture, manufacturing and services sectors have some impact on real GDP per capita in China. According to the results, manufacturing is the highest contributor to real GDP per capita in China. This is because China has successfully transformed its
International Journal of Academic Research in Business and Social Sciences May 2012, Vol. 2, No. 5
ISSN: 2222-6990
46
manufacturing sector from being state-controlled to being market-oriented since the early 1980s. This success is attributed to a number of factors, including price deregulation, ownership perform of state owned enterprises (SOEs), private sector development, FDI inflow, and trade liberalization (Liand Zhang, 2008).In other words, these factors enhance the contribution of the manufacturing sector to economic growth in China after the economic transformation.
Table 3: Results of multiple regression analysis for China
F-statistic = 444.318 R2 = 0.982 D-W =1.830 8.0 Concluding Remarks This study has focused on examining the contribution of economic sectors to economic growth in Malaysia and China from 1978 to 2007. There are three economic sectors which have been selected for this study, namely agriculture, manufacturing and services sectors. There as on for selecting the three economic sectors as the independent variables in the study is due to their development trend (agriculture, manufacturing and services) from 1978 to 2007. The results of the study indicate that service sector’s the highest contributor to real GDP per capita in Malaysia. If value-added for the service sector (X3) increases by 1%, real GDP per
capita in Malaysia is expected to increase by 0.34%. On the other hand, manufacturing sector is the biggest contributor to real GDP per capita in China. If value-added for the services sector (X2) increases by 1%, real GDP per capita in China is expected to rise by 0.670%. Therefore, the
importance of the contribution of each economic sector to economic growth differs in Malaysia and China. This is due to the differences in background, level of productivity, technology, professional labor, resources, labor forces and policies in the two countries. Bibliography Blanchard, O. (1997). Macroeconomics. New Jersey: Prentice Hall, Inc. Chang, J.J., Chen, B.L., & Hsu. M. (2006). Agricultural Productivity and EconomicRole of Tax
Revenues and Infrastructures. Southern Economic Journal , 72(4 Growth:), 891-914. Chenery, H. B., &Syrquin, M. (1975). Patterns of Development 1950-70. Oxford UP. Chow, G. C. (1993). Capital formation and economic growth in China. Quarterly Journal of
Economics, 108, 809-842. Dickey, D. A., & Fuller, W. A. (1979). Distribution of the estimators for autoregressive time
series with a unit root. Journal of the American Statistical Association, 74, 427-431.
International Journal of Academic Research in Business and Social Sciences May 2012, Vol. 2, No. 5
ISSN: 2222-6990
47
Dickey, D. A., & Fuller, W. A. (1981). Likelihood ratio statistics for autoregressive time series with a unit root. Econometric, 49 (4), 1057-1072.
Fu, X. (2004).Limited linkages from growth engines and regional disparities in China.Journal of Comparative Economics, 32, 148-164.
Gemmell, N., Lloyd, T., & Mathew.M. (1998). Dynamic sectoral linkages andstructural change in a developing economy. University of Nottingham,CREDIT , Discussion Papers 98/3.
Hu, Z. F., & Khan, M. S. (1997). Why is China growing so fast ?International Monetary Fund, 44(1), 103-131.
Hwa, E. C. (1988). The contribution of agriculture to economic growth: Someempirical evidence. World Development, 16(11), 1329-1339.
Johnston, B. F., & Mellor, J. (1961).The role of agriculture in economic development.The American Economic Review. September, 566–591.
Jones, D. C., Li, C., & Owen, L. (2003). Growth and regional inequality in China during thereform era.China Economic Review, 14, 186-200.
Kaldor, N. (1967). Strategic Factors in Economic Development. New York: NewYork State School of Industrial and Labor Relations.
Katircioglu, S. T. (2006). Causality between agriculture and economic growth in a small nation under political isolation: A case from North Cyprus. International Journal of Social Economics.vol. 33(4), pages 331-343, April.
Leamer, E. E. (1983). Let’s take the con out of econometrics. The AmericanEconomic Review, Vol. 73, No. 1. March: 31–43.
Levine, R., &Renelt, D. (1992). A sensitivity analysis of cross country growth regressions. American Economic Review.Vol. 82, No. 4. September: 942–963.
Lewis, W. A. (1954). Economic development with unlimited supplies of labor.Manchester School of Economic and Social Studies, 22 (2), 139-91.
Lin, S. (2000). Resource allocation and economic growth in China.Economic Inquiry, 38, 515-526. Lin, S., & Song, S. (2002). Urban economic growth in China: Theory and evidence. Urban Studies,
39(12), 2251-2266. Mellor.,& John, W. (1995). Introduelion.In Af-riculturc on the road to
indusrnalizulion, edited by J. W. Mellor. Baltimore: Johns Hopkins University Press. Nelson, C., & Plosser, C. I. (1982). Trend and random walks in macroeconomic time series: Some
evidence and implication. Journal of Monetary Economics, 10, 139-162. Pomfret, R. (1997). Growth and transition: Why has China's performance been so
different.Jounal of Comparative Economics, 25, 422-440. Ranis., Gustav., & John Fei. (1961). A theory of economy development.AmericanEconomic
Review, 51, 533-65. Rostow, W. W. (1960). The stages of economic growth: A non-communistManifesto. Cambridge:
Cambridge University Press. Subramanian, V., Saghaian, S., Maynard, L., & Reed, M. (2009). Sectoral
GrowthInterdependencies and the Role of Agriculture in Poland and Romania.Journal of Food Distribution Research , 40(1).
Wang, X. Z., Wu, S. L., & Gao, F. (2010). The relationship between economic growth and agricultural growth: The case of China. International Conference on E-Business and E-Government.


![Economic Contribution [P91-95]](https://static.documents.pub/doc/80x56/585400ab1a28abfa398fb675/economic-contribution-p91-95.jpg)


