THE ECONOMIC CONTRIBUTION OF THE ANCHORAGE INTERNATIONAL AIRPORT PREPARED FOR Anchorage International Airport PREPARED By Scott Goldsmith Eric Larson October 1995 INSTITlJfE OF SOCIAL AND ECONOMIC RESEARCH UNIVERSITY OF ALASKA ANCHORAGE 3211 PROVIDENCE DRIVE ANCHORAGE, ALASKA 99508 This publication is printed on recycled paper.
Transcript
THE ECONOMIC CONTRIBUTION
OF THE ANCHORAGE
INTERNATIONAL AIRPORT
PREPARED FOR
Anchorage International Airport
PREPARED By
Scott Goldsmith Eric Larson
October 1995
INSTITlJfE OF SOCIAL AND ECONOMIC RESEARCH
UNIVERSITY OF ALASKA ANCHORAGE
3211 PROVIDENCE DRIVE ANCHORAGE, ALASKA 99508
This publication is printed on recycled paper.
THE ECONOMIC CONTRIBUTION OF THE
ANCHORAGE INTERNATIONAL AIRPoRT
Table of Contents Executive Summary
1. Introduction: Overview of Analysis and Airport Activity
I. MEASURES OF TIlE TOTAL ECONOMIC
CONTRIBUTION OF TIlE AIRPORT
2. Jobs at the Airport 3. Contnbution of New Money the Airport Bnngs to Anchorage 4. Contribution of All Air Transport ActiVlties at Airport 5. Contribution of All Activities on Airport Property
II. MEASURES OF TIlE ECONOMIC CONTRIBUTION OF
AIRPORT SERVICES PROVISION BY USER GROUP
6. International Cargo 7. Non-Alaska Visitors 8. Alaskans Outside Anchorage 9. Public and Private Tenants 10. Anchorage Residents
III. ECONOMIC IMPORTANCE OF THE AIRPORT
11. Measures of Importance
ApPENDICES
A. Rules of Thumb: The Employment Impact of Adding flights B. Rules of Thumb: The Employment and Payroll Impact of New Sales C. Calculating the Residence of Scheduled Carrier Passengers D. General Aviation Calculations E. Air Taxi Calculations F Airport Employment Job Allocation Matrix G. Input-Output Total Impact Results: Total Economic Contribution H. Input-Output Results: User Group Contribution
1
23
25 39 42 47
Sl
53 57 63 69 73
77
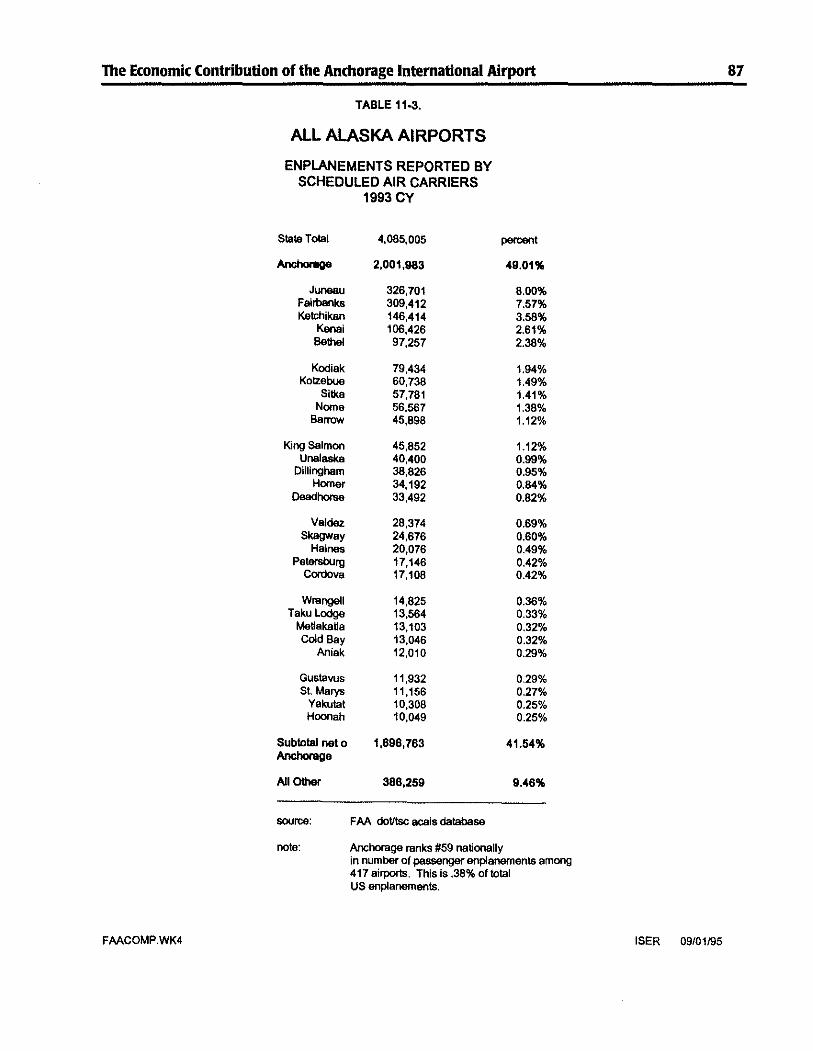
79
89 93
III 115 117 119 129 135
Executive Summary
Anchorage International Airport-mcluding operations at both the main airport and uke Hoodcontributes nearly 11,000 jobs and $316 million in payroll to Anchorages economy. Those jobs and paychecks make up about 9 percent of all the wage and salary Jobs in Anchorage and 8 percent of the
city's total annual payroll.
Looked at another way, nearly one in ten Anchorage jobs and close to one in ten payroll dollars wouldn't exist If it weren't for the airport. of the total airport-related Jobs, 6,650 are at the airport and 4,300 are elsewhere in the CIty, created by the economic multiplier-that is, when airport workers, airpon businesses, and transient flight crews spend money in the community, they in turn create more jobs.
Anchorages aIrport contributes so much to the economy because its not Just a local airport-it draws millions of dollars into the economy by proVlding atr transport services to touriSts from outside Alaska, visitors from other regions of the state, and international cargo carriers. In fact, two thirds of all the airport-related jobs exist because of such non-local airport users.
Description of Airport Anchorage International Airport covers about 4,700 acres. It includes domestiC and international terminals as well as the general aviation and air tax! base around Lake Hood. About 30 scheduled airlines, 35 air taxi operators, and 1,000 general aviation planes operate out of the airport. A number of businesses that supply various air transport services are on airport land, as are a post office, Kulis Air National Guard Base, the Alaska Department of TransportatIOns regIOnal headquarters, a fish processing plant, and a museum.
Anchorage's airport is much busier than you'd expect in a city of 250,000. The citys geographic location puts it on the path of international flights over the pole, and Anchorage is a major transshippmg site for international cargo traveling between the U.s., Europe, and the Far East. In fact, largely because of internatIOnal transit fretght, Anchorage IS the nations largest cargo atrport Cas measured by weIght of aircraft landings).
Figure 1 shows that in fiscal year 1994, an estimated 2.5 billion pounds of freight was handled Cput on planes, taken off planes, and trans-shipped) at the airport. Of that total, an estimated 1.9 billion pounds-75 percent-was international transit cargo. Some international passenger flights also stop in Anchorage for refueling and crew changes; there were more such stopovers in earlier years, before the opemng of atr space over the former Soviet Union allowed many passenger flights to bypass Anchorage.
Figure 1. Estimated Volume of Freight: Anchorage International Airport. FY 1994
2.5 Billion Pounds
Anchorage milllol~W/o)
• Estimaus based on Anchorage International Airport activity rt'porr and 15ER estimates for several largt' carners that do not rt'port transit freight.
ii The Economic Contribution of the Anchorage International Airport
Domestic passenger traffic at the airport has increased sharply in recent years. Tourism is Alaskas fastestgrowing industry: Hundreds of thousands of tourists and business travelers from outside the state use the airport as the gateway into Alaska. Many Alaskans from other regions also leave and return to the state through the Anchorage airport; others fly into the city for various reasons-to get medical care or shop, for instance.
Figure 2 shows an approximate breakdown of passengers boarding planes at the main airport in 1994. Passengers on scheduled flights were almost equally divided among Anchorage residents, other Alaskans, and tOUlists from outside the state. Of Anchorage residents getting on planes, about two thirds were flying out of the state and one third were traveling within Alaska. of other Alaskans, about half visited Anchorage, about one-quarter were on their way to destinations outside the state, and the remaining one quarter stopped over or changed planes in Anchorage on their way to other Alaska locations. Most (80 percent) of toUlists getting on planes in Anchorage visited Anchorage; the rest passed through on their way to other Alaska places.
Figure 2. Residence' of Passengers Boarding Planes, Anchorage International Airport 1994 (In Thousands of Passengers)
250
D Passing Through 10 Other Alaska Locations
III Traveling !!t\J' Outalde Alaska
•
VIsiting Anchorage
Non-Residents 620
Total Passengers Boarding: 1,935
~ISER estimates based on Anchorage International Airport Passenger Marhet Research Study, eIe Research, Inc. August 1992; Anchorage Instate Visitor Study, Anchorage Convention and Visitor Bureau, Fall 1993; Alaska Visitor Arrivals,from Alaska Visitor Statistics Program, McDowell and Associates, Summer 1993 and FalVWinter 1994.
lbe Economic Contribution of the Anchorage International Airport
Activity at the international airport is also boosted by the large number of plivate planes and air taxis operating around Lake Hood. The Lake Hood small plane base-with both slips for floatplanes and tie-downs for wheeled planes-is one of the busiest in the country Figure 3 shows that in 1994 an estimated 1,040 general aviation planes and 35 air taxi operators with 120 planes were based around Lake Hood. Air taxis logged an estimated 48,000 hours in the air and privates planes 104,000 hours.
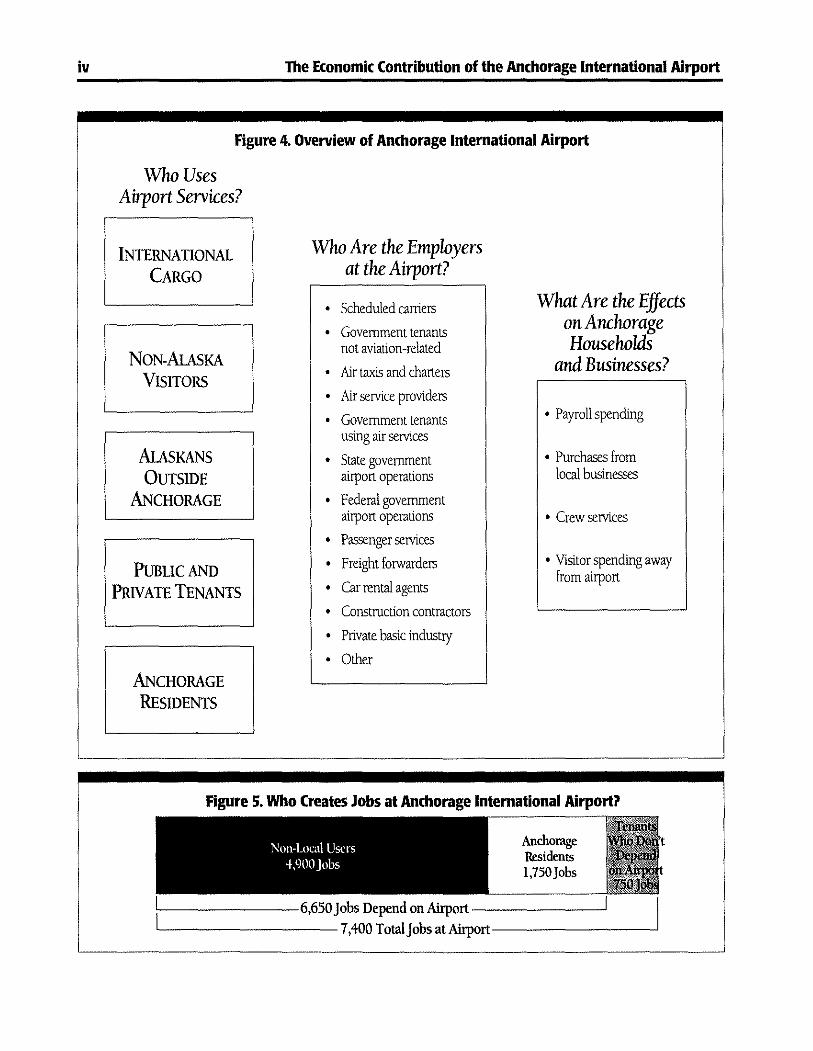
Jobs and Payroll Figure 4 (on the following page) gives an overview of Anchorage International Airport: who uses the airport, who employs people, and how Anchorage households and businesses are affected. Five groups use airport services and thereby
Figure 3. Air Taxis and General Aviation Planes' at Anchorage International Airport. 1994
44 FloallpJ\lnes
AIR 77Whe,~ed
1,160 planes *ISER estimates
iii
create jobs with employers ranging from scheduled airlines to construction contractors. Those five users create a total of 7,400 jobs at the airport:
INTERNATIONAL CARGO AIRLINES, which primarily trans-ship freight between the u.s. and international destinations, account for 1,550 jobs at the airport.
NON-ALASKA VISITORS, including not only of tourists but also business and other travelers, create 1,100 airport jobs by using air transport services.
ALASKANS OUTSIDE ANCHORAGE, including both individuals and businesses using passenger and freight services, create 1,700 jobs at the airport.
PUBLIC AND PRIVATE TENANTS at the airport can be divided into two types--tenants that would not be in Anchorage without the airport account for 550 jobs, and tenants that are physically located on airport land but don't depend on the airport account for another 750 jobs.
ANCHORAGE REsIDENTS create 1,750 jobs at the airport by using air transport services.
Although there are (as Figure 4 shows) many employers at the airport, we can think of airport jobs as falling into three categories, depending on which user group creates them. Figure 5 shows that Anchorage residents create about one quarter of airport jobs (1,750) by using air transport services. Non-local airport usersinternational cargo carriers, Alaskans from outside Anchorage, tourists from outside Alaska, and tenants who rely on the airport--<:reate about two-thirds of airport jobs (4,900). The remaining jobs at the airport, about 10 percent or 750 jobs, are with airport tenants that don't directly depend on air transport services.
iv The Economic Contribution of the Anchorage International Airport
Figure 4. Overview of Anchorage International Airport
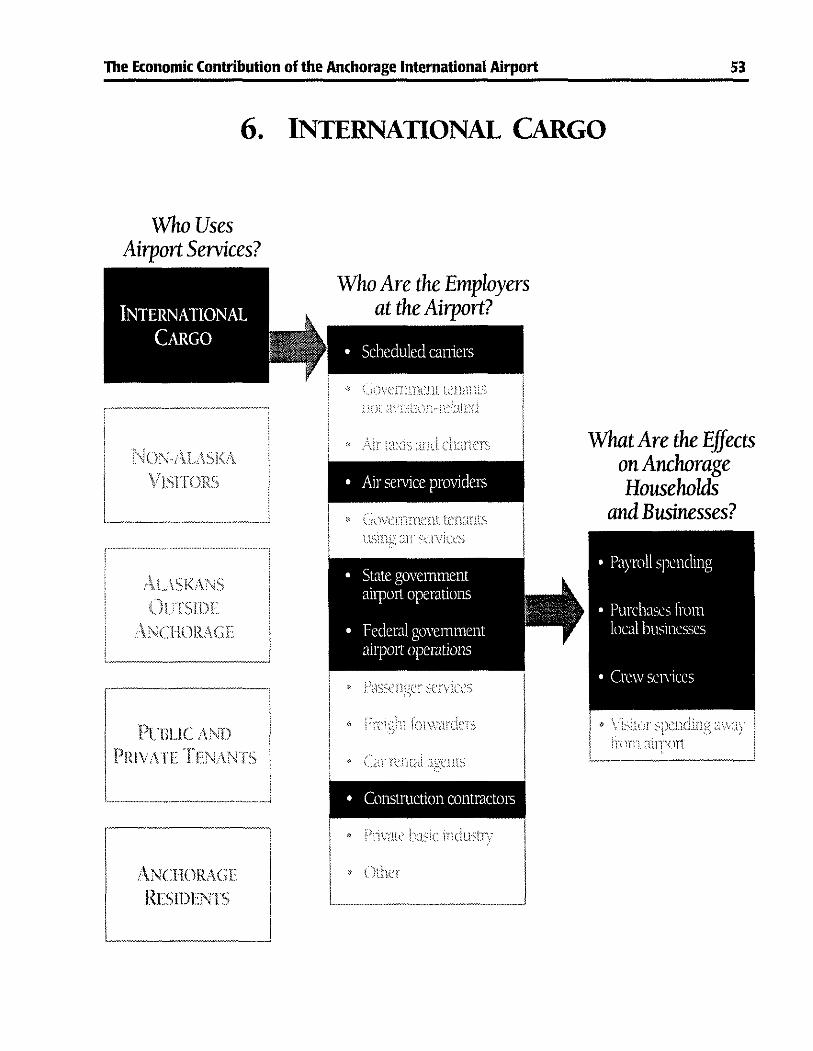
Who Uses Airport Services?
INTERNATIONAL CARGO
NON-ALAsKA VISITORS
ALAsKANS OUTSIDE
ANCHORAGE
PuBUCAND PRIVATE TENANTS
ANCHORAGE RESIDENTS
Who Are the Employers at the Airport?
• Scheduled carriers
• Government tenants not aviation-related
• Air taxis and charters
• Air service providers
• Government tenants using air services
• State government airport operations
• Federal government airport operations
• Passenger services
• Freight forwarders
• Carrental agents
• Construction contractors
• Private basic industry
• Other
What Are the Effects on Anchorage Households
and Businesses?
• Payroll spending
• Purchases from local businesses
• Crew services
• Visitor spending away from airport
Figure 5. Who Creates Jobs at Anchorage International Airport?
Non-Local Usc's 4,900 Jobs
Anchorage Residents 1,750Job5
~------6,650Jobs Depend on Airport ______ ....J
'----------7,400 Total Jobs at Airport----------.!
The Economic Contribution of the Anchorage International Airport v
Airport jobs created by Anchorage residents and by non-local airport users wouldn't exist without the airport. The 750 jobs created by tenants that don't directly rely on air services would still exist without the airport; they could easily be somewhere else in the city. Those jobs are mainly with the U.S. Postal Service and the Alaska Department of Transponation's regional headquarters.
ProViding air transport services to Anchorage residents doesn't bring new money into the economy-it recycles money already in the economy. But the other airpon users do bring money into the Anchorage economy. The jobs created by those other user groups are what economists call basic jobs: jobs that generate economic growih by producing goods or services that are sold outside the region.
Basic jobs are the foundation of economic growih because they bring new money into the region. In Alaska we usually think of basic economic activities as being, for instance, the export of oil or coal. But the air transport services the airport provides to international cargo carriers and other non-local users are also basic activities in Anchorage-because they also bring new money into the economy.
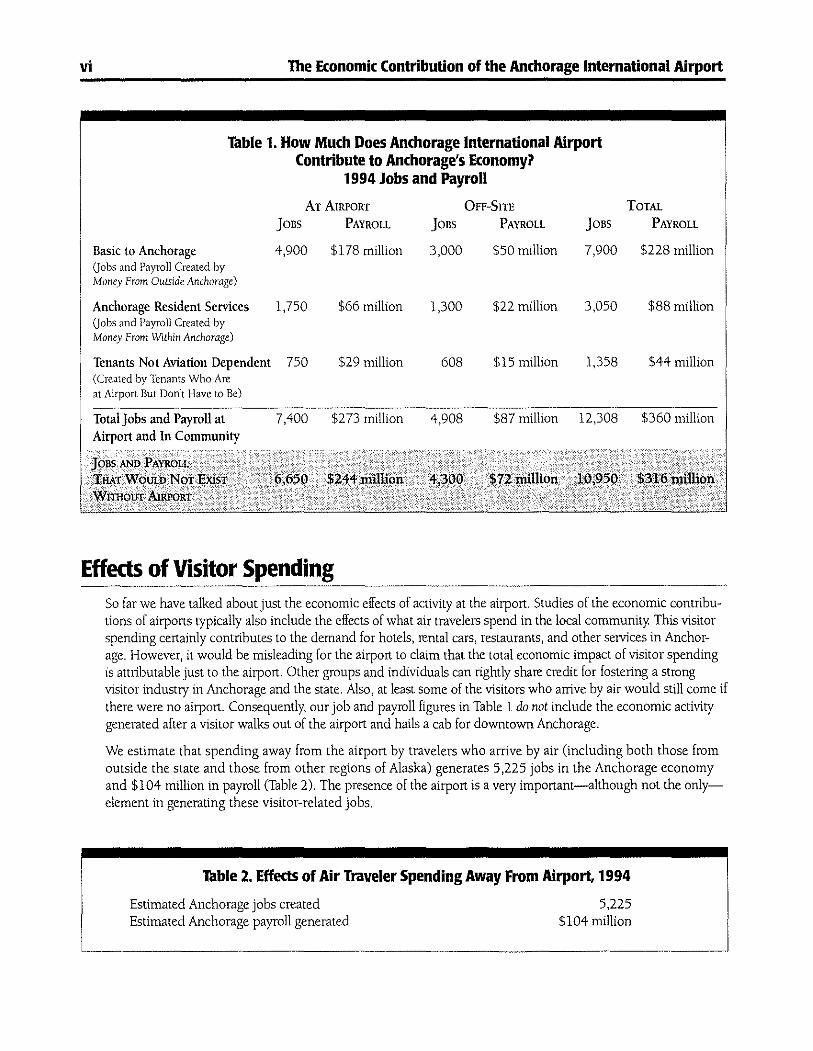
Table 1 shows how groups using the airport create jobs and payroll in Anchorage. Airport jobs generated by non-local users are classified as Basic to Anchorage in Table 1. Those groups generate 4,900 jobs at the airport and 3,000 additional jobs elsewhere in the community-for a total of 7,900 jobs with a payroll of $228 million.
Anchorage residents generate 1,750 jobs at the airport. Through the economic multiplier, those airport jobs generate an additional 1,300 jobs elsewhere in the city-as shown in Anchorage Resident Services in Table 1. The total number of jobs associated with providing resident services is 3,050, with an annual payroll of $88 million.
The jobs shown under Basic to Anchorage and Anchorage Resident Services in Table 1 are both important to the community. The point we're making in separating the two sources of jobs is that a big share of airport jobsand related jobs in the community-are created by a substantial infusion of money into the economy.
The combined total of Basic to Anchorage jobs and Anchorage Resident Services jobs is 6,650 jobs at the airpon and an additional 4,300 jobs in the community created by the economic multiplier effect. So a total of 10,900 jobs in the community and $316 million in annual payroll results from the air transport services provided at Anchorage International Airport. This is the economic activity Anchorage would lose if all the air transport services at the airport relocated elsewhere.
The other source of jobs at the airport is Tenants Not Aviation Dependent. These jobs don't depend on the airport, but since they are physically located on airport land, a complete description of the airport as an economic entity must include them. They account for 750 jobs at the airport and another 600 jobs in the community-blinging the total of jobs at the airpon and in the community to 12,300. The payroll for the 750 airport jobs is $29 million, and the 600 jobs in the community have a payroll of $15 million-bringing the total payroll for airport and related community jobs to $360 million. This is the economic effect of all of the activities phYSically located at the airport.
vi The Economic Contribution of the Anchorage International Airport
Table 1. How Much Does Anchorage International Airport Contribute to Anchorage's Economy?
1994 Jobs and Payroll
AT AIRPORT OFF-SITE TOTAL
JOBS PAYROLL JOBS PAYROLL JOBS PAYROLL
Basic to Anchorage 4,900 $178 million 3,000 $50 million 7,900 $228 million (Jobs and Payroll Created by Money From Outside Anchorage)
Anchorage Resident Services 1,750 $66 million 1,300 $22 million 3,050 $88 million (Jobs and Payroll Created by Money From Within Anchorage)
Tenants Not Aviation Dependent 750 $29 million 608 $15 million 1,358 $44 million (Created by Tenants Who Are at Airport But Don't Have to Be)
Total Jobs and Payroll at 7,400 $273 million 4,908 $87 million 12,308 $360 million Airport and In Community
Effects of Visitor Spending So far we have talked about just the economic effects of activity at the airport. Studies of the economic contributions of airports typically also include the effects of what air travelers spend in the local community. This visitor spending certainly contributes to the demand for hotels, rental cars, restaurants, and other services in Anchorage. However, it would be misleading for the airport to claim that the total economic impact of visitor spending is attlibutable just to the airport. Other groups and individuals can rightly share credit for fostering a strong visitor industry in Anchorage and the state. Also, at least Some of the visitors who anive by air would still come if there were no airport. Consequently, our job and payroll figures in Table 1 do not include the economic activity generated after a visitor walks out of the airport and hails a cab for downtown Anchorage.
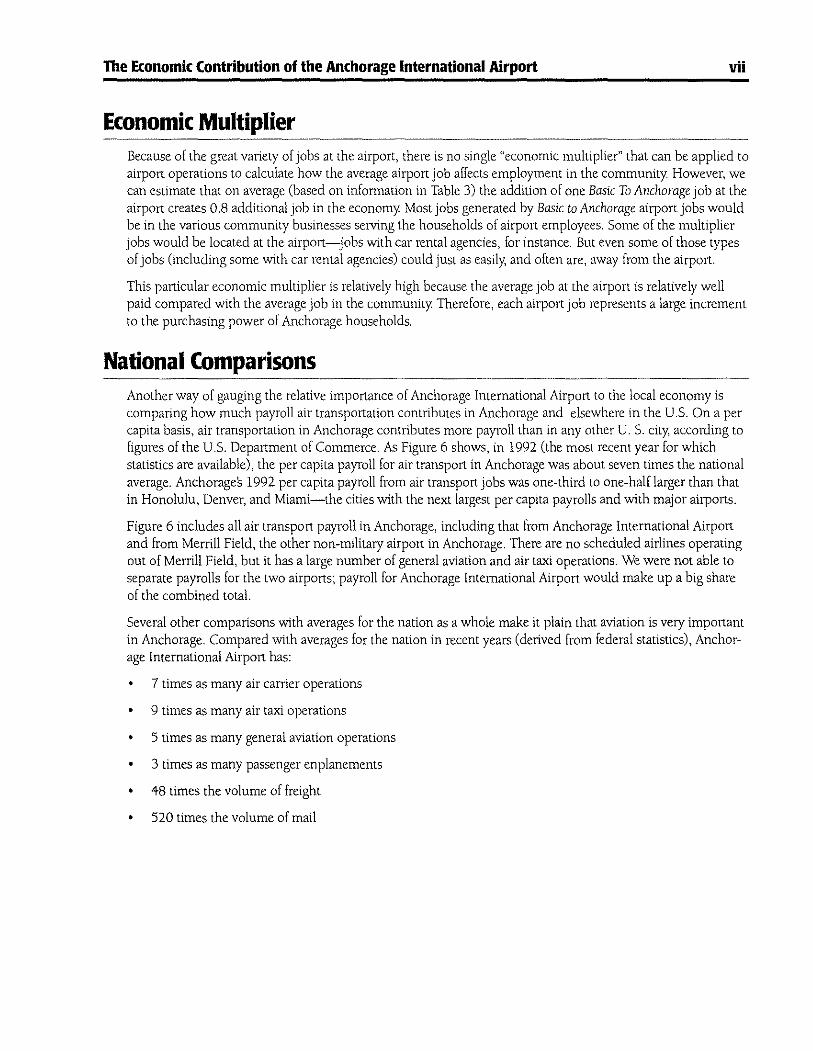
We estimate that spending away from the airport by travelers who arrive by air (including both those from outside the state and those from other regions of Alaska) generates 5,225 jobs in the Anchorage economy and $104 million in payroll (Table 2). The presence of the airport is a very important-although not the onlyelement in generating these visitor-related jobs.
Table 2. Effects of Air Traveler Spending Away From Airport, 1994
Estimated Anchorage jobs created Estimated Anchorage payroll generated
5,225 $104 million
The Economic Contribution of the Anchorage International Airport vii
Economic Multiplier Because of the great vmiety of jobs at the airport, there is no single "economIC multiplier" that can be applied to airport operations to calculate how the average airport job affects employment in the community However, we can estimate that on average (based on information in Table 3) the addition of one Basic To Anchorage job at the airport creates 0.8 additional job in the economy Most jobs generated by Basic to Anchorage airport jobs would be in the various community businesses serving the households of airport employees. Some of the multiplier jobs would be located at the airport-jobs with car rental agencies, for instance. But even some of those types of jobs (including some with car rental agencies) could just as easily, and often are, away from the airport.
This particular economic multiplier is relatively high because the average job at the airport is relatively well paid compared with the average job in the community Therefore, each airport job represents a large increment to the purchasing power of Anchorage households.
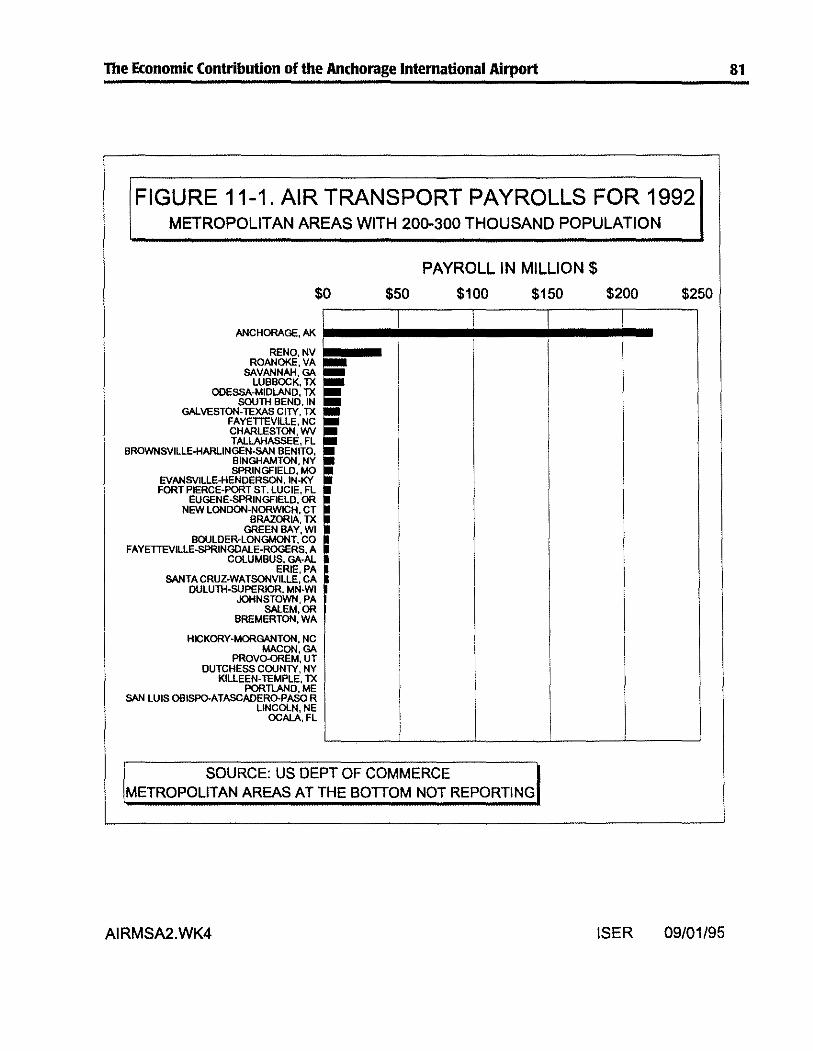
National Comparisons Another way of gauging the relative importance of Anchorage International Airpolt to the local economy is comparing how much payroll air transportation contributes in Anchorage and elsewhere in the U.s. On a per capita basis, air transportation in Anchorage contributes more payroll than in any other U. S. city, according to figures of the u.s. Department of Commerce. As Figure 6 shows, in 1992 (the most recent year for which statistics are available), the per capita payroll for air transport in Anchorage was about seven times the national average. Anchorages 1992 per capita payroll from air transport jobs was one-third to one-half larger than that in Honolulu, Denver, and Miami-the cities with the next largest per capita payrolls and with major airports.
Figure 6 includes all air transport payroll in Anchorage, including that from Anchorage International Airport and from Merrill Field, the other non-military airport in Anchorage. There are no scheduled airlines operating out of Merrill Field, but it has a large number of general aviation and air taxi operations. We were not able to separate payrolls for the two airports; payroll for Anchorage International Airport would make up a big share of the combined total.
Several other comparisons with averages for the nation as a whole make it plain that aviation is very important in Anchorage. Compared with averages for the nation in recent years (derived from federal statistics), Anchorage International Airport has:
• 7 times as many air carrier operations
• 9 times as many air taxi operations
• 5 times as many general aviation operations
• 3 times as many passenger enplanements
• 48 times the volume of freight
• 520 times the volume of mail
viii The Economic Contribution of the Anchorage International Airport
Figure 6. Cities with Largest Per capita Payrolls From Air Transport Jobs, 1992 (In Dollars)
Cost Versus value of Services An issue that frequently comes up when people discuss the economic contribution of the airport is how the value of the services the airport provides to residents compares with the costs of operating the airport.
We have made no attempt in this study to measure the monetary value of services the airport provides to residents, or to calculate whether the value of those services exceeds the costs assOCiated with airport operations. Such a study would require surveying residents (including both households and businesses), to determine the value they place on airport services-primarily the accessibility and the time savings air travel provides as compared with other means of transportation.
Attached to this Executive Summary is Table 3 (in two parts) summarizing the analysis and providing additional detail to that shown in Table 1.
TOTAL USER OF SERVICES JOBS AT
AIRPORT
INTERNATIONAL CARGO 1,551
NON+RESIDENT VISITORS 1,099
ALASK.At-.IS OUTSIDE ANCHORAGE 1,690
TENANTS: AVIATION DEPENDENT 538
SUBTOT AL-8ASIC TO ANCHORAGE 4,878
ANCHORAGE RESIDENT SERVICES 1,739
SUBTOTAL-AIRPORT MOVES OUT 6,617
TENANTS: NOT AVIATION DEPENDENT 751
GRAND TOTAL 7,368
ITEM: OFf SITE VISITOR SPENDING
TABLE 3
ANCHORAGE INTERNATIONAL AIRPORT ECONOMIC CONTRIBUTION
SUMMARY OF ANALYSIS PART 1.
1994 ANNUAL AVERAGE EMPLOYMENT
BASIC SUPPORT OTHER TOTAL JOBS AT JOBS AT DIRECT OFFSITE
TOTAL JOBS IN
AIRPORT AIRPORT JOSS JOBS ANCHORAGE
1,511 40 1,177 2,728
853 246 477 1,576
1,572 118 1,147 2,837
538 0 207 745
4,474 404 3,008 7,886
69 1,670 1,281 3,020
4,474 473 1,670 4,289 10,906
42 709 608 1,359
4,474 515 2,379 4,897 12,265
5,225 5,225
RATIO:
TOTAL TO
DIRECT JOBS
1.81
1.85
1.80
1.38
1.76
1.81
1.78
1.92
1.79
ISER AIMAIN,WK4 09101/95
TOTAL USER OF SERVICES $AT
AIRPORT
INTERNATIONAL CARGO $67.8
NON-RESIDENT VISITORS $37.4
AlASKANS OUTSIDE ANCHORAGE $62.7
TENANTS: AViATION DEPENDENT $19.8
SUBTOTAL-SASIC TO ANCHORAGE $1n.7
ANCHORAGE RESIDENT SERVICES $66.6
SUBTOTAL-AIRPORT MOVES OUT $243.2
TENANTS: NOT AVIATION DEPENDENT $28.8
GRAND TOTAL $272.0
ITEM: OFFSITE VISITOR SPENDING
TABLE 3
ANCHORAGE INTERNATIONAL AIRPORT ECONOMIC CONTRIBUTION
SUMMARY OF ANALYSIS PART 2.
1994 ANNUAL PAYROLL IN MILLION $
BASIC SUppORT OTHER TOTAL SAT SAT DIRECT OFFSITE
TOTAL $IN
AIRPORT AIRPORT S $ ANCHORAGE
$56.7 $1.1 $19.9 $77.7
$32.8 $4.6 $8.8 $46.2
$60.2 $25 $18.6 $81.3
$19.8 $0.0 $3.1 $22.9
$169.5 $8.2 $50.4 $228.1
$1.5 $84.0 $22.3 $87.8
$169.5 $9.7 $84.0 $72.7 $315.9
$0.9 $27.9 $15.6 544.3
$197.4 $10.6 $84.9 $88.2 $360.2
$104.3 $104.3
RATIO: AVERAGE
TOTAL TO QfI.IS!TE
DIRECTS PAYROLL
1.37 $37.27
1.41 $34.03
1.35 $37.10
1.16 $36.80
1.35 $36.43
1.37 $37.67
1.35 $36.75
1.59 $36.35
1.37 $36.92
ISER AlMAINWK4 09/01/95
The Economic Contribution of the Anchorage International Airport
1. INTRODUCTION: OVERVIEW OF ANALYSIS AND AIRPORT ACTIVITY
Who Uses Airport Services?
INTERNATIONAL CARGO
Who Are the Employers at the Airport?
• Scheduled carriers
• Government tenants not aviation-related
1
NON-ALASKA • Air taxis and charters What Are the Effects
on Anchorage VISITORS • Air service providers Households
• Government tenants and Businesses? using air services
ALAsKANS • State government • Payroll spending
OUTSIDE airport operations
• Purchases from ANCHORAGE • Federal government local businesses
The Economic Contribution of the Anchorage International Airport
1. Introduction: Overview of Analysis and Airport Activity
Overview
3
This study presents a snapshot of the economic contribution of the Anchorage International Airport, taken in 1994. It is based on information from public agencies and on interviews conducted during the last half of the year. Since different agencies have different reporting years and different sources may use different definitions, our snapshot cannot represent a single point in time and may be imprecise in spots.
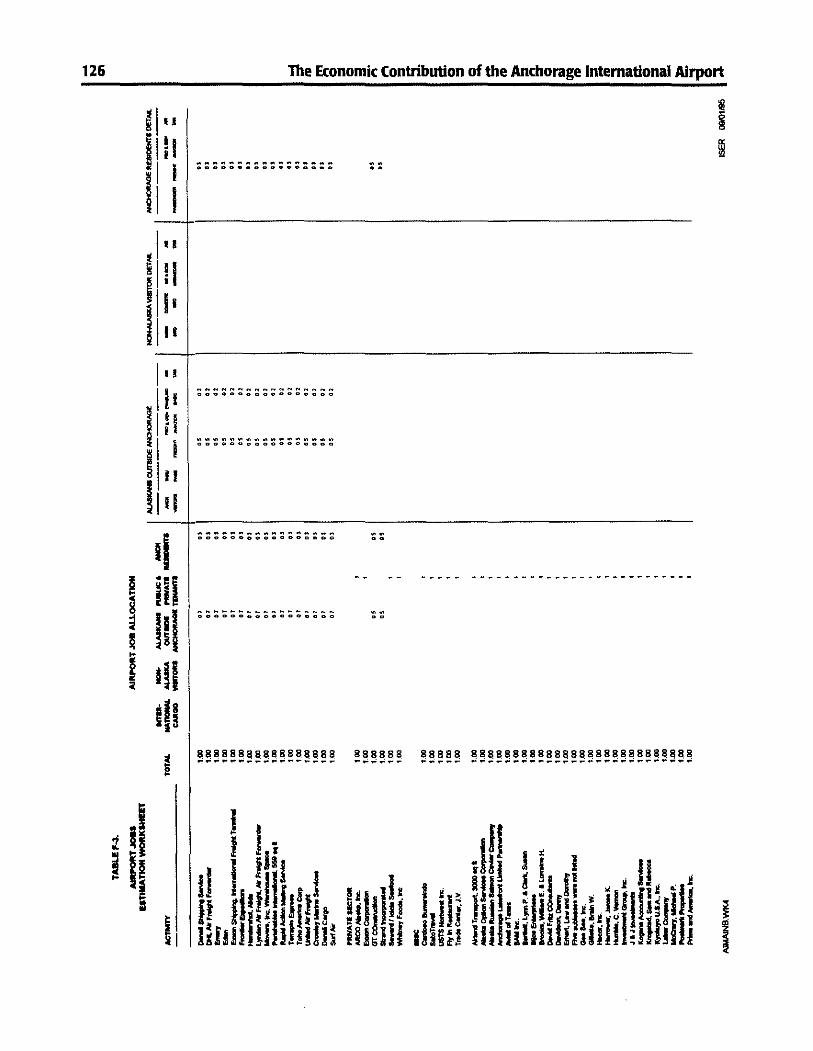
This information was compiled into a large matrix relating airport jobs by employer to the types of clients served at the airport. This was used to estimate not only t he aggregate contribution of the airport to the economy but additionally the contribution arising from service provision to each distinct user group. The chapter headings show the categOIies of employers at the airport as well as the users of airport services. An input-output model of the Alaska economy was used to estimate the employment and payroll generated off-site by airport operations.
Because of the many services it provides, the economic contribution of the airport will continue to grow. The Anchorage International Airport Master Plan (May I (93) forecasts a 1. 7% annual growth rate for airport operations through 2012. This forecast is driven by growth in both passenger traffic 0.8% annual growth forecasted in enplanements) and cargo traffic (2.8% annual forecasted growth for enplaned and deplaned, and growth in transit cargo of 5% between 1997 and 2002, falling to 4% thereafter).
Airport Adivity This study is concerned with the economic importance of the Anchorage International Airport. For the purposes of this study we consider any activity which takes place within the boundary of the airport to be part of the study, so we include the operations at Lake Hood as well as other activities that one would not normally consider part of an airport. Among the unusual facilities on airport property are a fish processing plant, a state office building, a museum, and several private residences.
Landings One important measure of airport activity is landings-the number of scheduled aircraft that land at the airport (Table 1-1, Part I). There were about 82,000 landings in 1994, of which about three fourths were passenger and one fourth were cargo landings. Domestic caniers dominate the passenger landings while international carriers make up the majority of the cargo landings. Altogether there were about 226 scheduled landings at the airport on an average day
Operations The main activity of the airport is providing air transportation services, of which the most ubiquitous is operations--planes taking off or landing (Table 1-1, rart 2.). There were about 280,000 operations at Anchorage International Airport in 1994-on average one every 2 minutes. Only about one third of these operations involve the scheduled air carriers as defined by the Federal Aviation Administration. The other two thirds are divided between air taxi operations, and general aviation although a significant number of these operations are
4 The Economic Contribution of the Anchorage International Airport
actually carried out by the smaller scheduled air carriers. A small number of operations are military. The number of operations among the air taxis and general aviation is further divided between the main facility at the airport and Lake Hood. A smaller fraction of these operations occur at Lake Hood, particularly among the air taxi operations, which the FAA defines broad;y
By way of comparison, the other significant non-military airport in Anchorage, Merrill Field, had 93,000 operations in 1994, mostly general aviation. Thus although it is smaller than Anchorage International Airport in total operations, there were almost as many general aviation operations at Merrill Field as at Anchorage International Airport (including Lake Hood). By dividing operations m half we get a picture of the number of round trips which occur each year.
Passengers The airport served 4.4 million passengers in 1994 flying on scheduled calTiers (Table 1-1, Part 3). There were about 1. 9 million each of arrivals (deplanements) and departures (enplanements) with the balance of .5 million consisting of passengers in transit. Roughly 95% of arrivals and departures were on domestic carriers with the remainder coming and going on international carriers. The majority of transit passengers were traveling on inlernational carriers.
Most of the traffic volume was on the major carriers who carry all the passengers between Anchorage and the rest of the u.s. as well as most of the passengers between the larger communities within the state. According to
Federal Aviation Administration (FAA) figures, over 1 million trips, nearly two thirds of the scheduled major carrier passengers, and about half the total passengers were arrivals from or departures for a location beyond Alaska (Table 1-2, Part 1). Seattle and Salt Lake City were the most important gateway cities for travel outside the state, although the ultimate destination or origin of most travelers is probably elsewhere. Similarly Anchorage may not be the destination of the travelers arriving at the airport; they may just be passing through.
Within Alaska most of the major scheduled carrier passengers were departing for or arriving from Fairbanks, Juneau, Nome, Bethel, and Dutch Harbor. About half of the traffic was to or through Fairbanks.
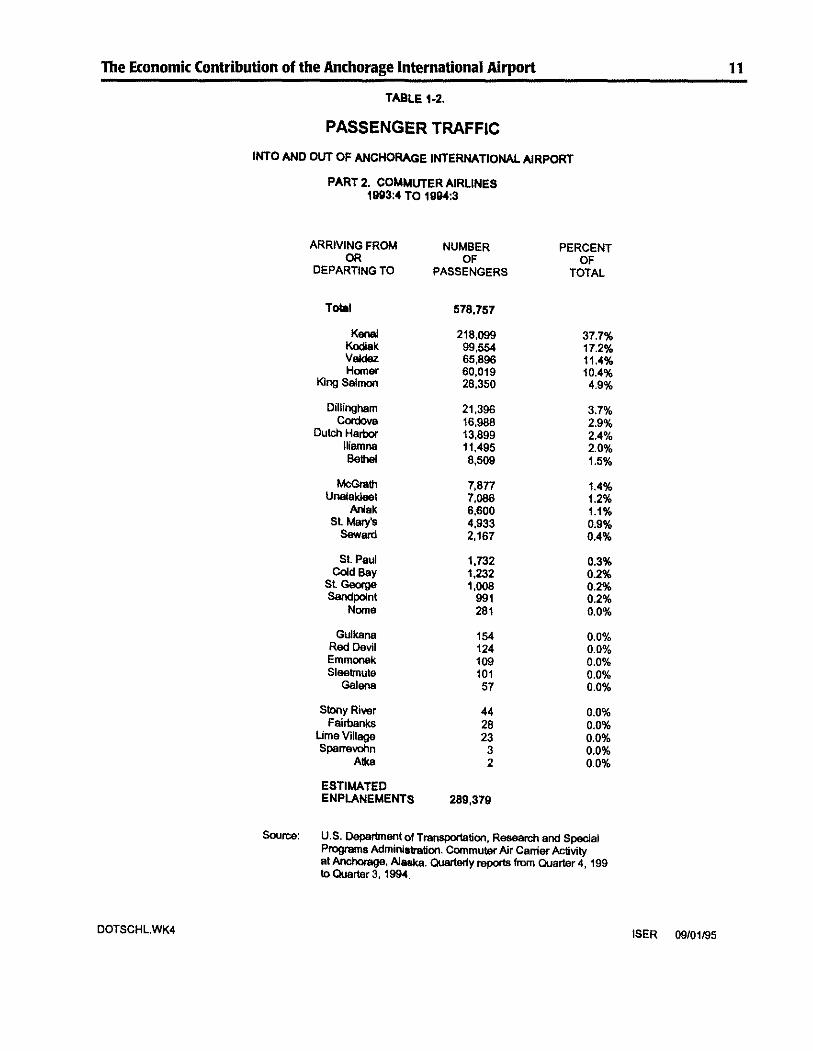
The commuter airlines carried about 600,000 passengers through Anchorage International Airport (Table 1-2, Part 2)-about 300,000 each of departures and arrivals. Kenai was the mOSt popular link, followed by Kodiak, Valdez, Homer, and King Salmon.
Combining figures for the scheduled major calTiers and the commuter airlines, more than half of all passenger traffic through Anchorage International Airport involved a link outside the state (Table 1-3). Fairbanks, Kenai, Juneau, Kodiak, and Bethel were the most common instate links.
Passenger traffic has been steadily increasing with growth in the economy and population as well as with the growing popularity of Alaska as a tourist destination (Figure 1-1). In contmst transit passenger volumes have declined. The importance of tourism to the volume of passenger traffic is clearly illustrated by the seasonality in passenger departures (enplanements) which shows a sharp spike during the summer months (Figure 1-2). This summer peak has been increasing in recent years. For example, in 1985 the summer peak for passenger enplanements was 40% above the annual average and in 1994 it had increased to 60% above the annual average. This means that there was nearly twice as much passenger traffic during the three-month summer peak than in the mid-winter valley
The Economic Contribution of the Anchorage International Airport
Cargo One hundred sixty million pounds of cargo arrived at the airport in 1994, not including international cargo in transit (domestic cargo in transit is very small as a percentage of cargo in transit), and 225 million pounds depaned for destinations both within and outside the state. This cargo consists of both freight and mail.
5
For the major scheduled carriers there was a rough balance between freight moving into and out of the state (Table lA, Part 1). For instate freight activity, however, the direction of the majority of the freight was from Anchorage to other Alaska communities, with much less moving into Anchorage from other locations. The major communities where this was not the case were centers for the fishing induslly including Dutch Harbor, Kodiak, King Salmon, and Dillingham. A few other communities with a positive balance with Anchorage, like Juneau, are more difficult to explain.
The imbalance was more pronounced for the mail traffic of the major scheduled carriers (Table 1-5, Part 1). Mail arriving in Anchorage from origins outside the state was 2.5 times the weight of mail moving from Anchorage to the rest of the U.5. By far the largest component of mail moved by the scheduled major carriers, and the largest component of their cargo activity, was mail moving to other Alaska destinations from Anchorage. That a large portion of this represents the bypass mail system is reflected in the distribution of destinations. More than one third was bound for Bethel, with Kotzebue and Nome the next most imponant links. Mail moving in the opposite direction from these communities was very small in weight by comparison.
Compared to the major scheduled carriers, the volumes of freight and mail carried by the commuter airlines was quite modest (Table 1-5, Part 2). Only about 5 million pounds of freight moved through the airpon on the commuter airlines, with Kodiak as the most imponant link. Mail was slightly more important by weight, with Kodiak again the most important link.
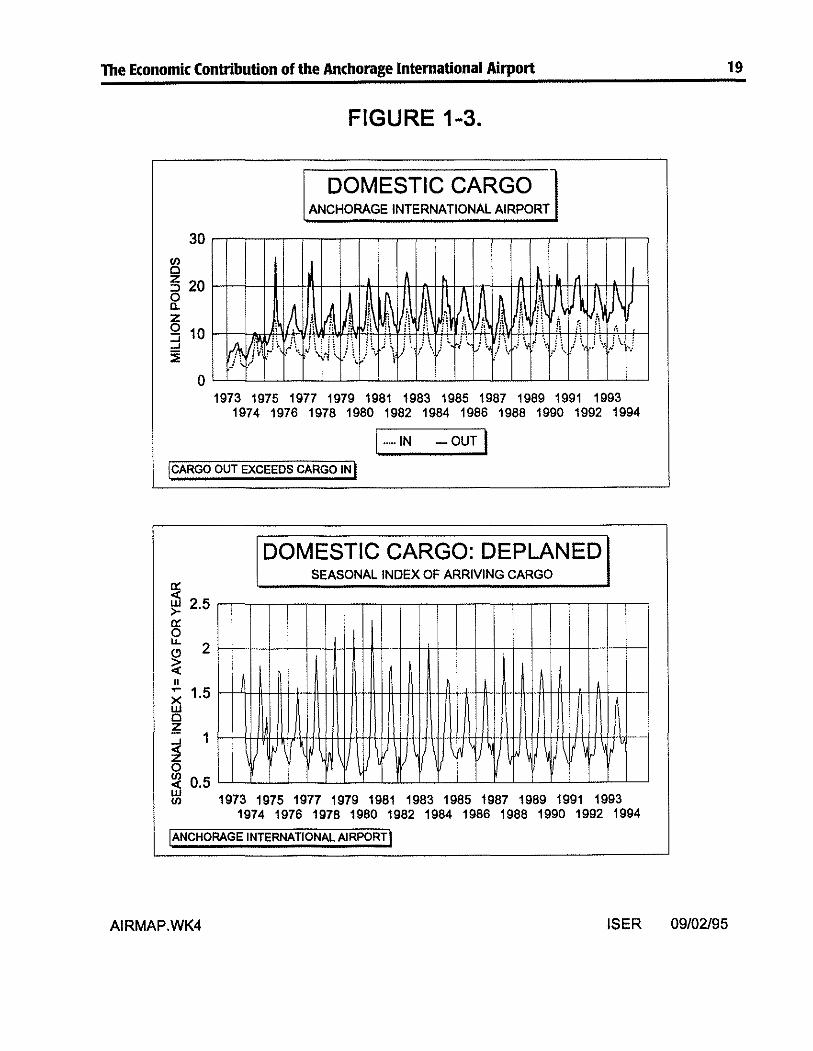
The growth of freight traffic is not as pronounced as the growth in passenger traffic, but it exhibits the same seasonality (Figure 1-3). The seasonality of arriving freight has declined in recent years.
A substantial portion of the cargo volume which is moving on international carriers and charters is not captured in the statistics available from the FAA shown in Tables 1-4 and 1-5, so origin and destination information is not available. Total cargo moved by international scheduled carriers is shown in Figure 1-4. The movement of this freight on balance is into Anchorage from outside the state on carriers such as Federal Express and UPS.
International Cargo In Transit More than 50 widebody all cargo freighters transit Anchorage International Airport on the ASia-Europe and Asia-North America routes. They use Anchorage stopovers for refueling, changing crews, customs clearance, sorting of cargo, maintenance, and other purposes. The volume of transit cargo has been increasing rapidly in recent years and we now estimate it to be to 2.2 billion pounds of cargo annually (the official figures from the airport do not include data for three of the largest operators at the airport, which has been estimated by the authors). This data is presented in Table 1-6.
Air Taxis and Charters About 35 air taxi operators are based at Anchorage International Airport, making an estimated 32,000 round trips annually from Anchorage. A number of charter air carriers whose services are targeted toward business clients are also located or headquartered at Anchorage International Airport. The exact scope of their operations is difficult to estimate accurately because of the absence of detailed reporting of their activities either to the airport or the FAA.
6 The Economic Contribution of the Anchorage International Airport
General Aviation AboUL 1,000 general aviation aircraft are located at Anchorage International Airport, engaging in nearly 96,000 operations annually Approximately 700 of these general aviation aircraft are tied down at airport operated tiedown spaces or slips; the rest are at privately owned tie downs or slips.
Tenants In addition to all the activities at the airport targeted to the provision of air transport services, there are numerous tenants that are either consumers of airport services or are not air transport dependent. We put the Kulis Air National Guard Base in the fortner category and both the u.s. Postal Service and the South central Region Headquarters of the Alaska Department of Transportation into the latter category.
The Economic Contribution of the Anchorage International Airport
TABLE 1·1.
ANCHORAGE INTERNATIONAL AIRPORT GENERAL INDICATORS
PART 1. LANDINGS 1994 FY
REVENUE LANDINGS
SOURCE:
TOTAL SCHEDULED LANDINGS
TOTAL PASSENGER LANDINGS
PASSENGER: DOMESTIC LANDINGS
PASSENGER: INTERNATIONAL LANDINGS
TOTAL CARGO LANDINGS
CARGO: DOMESTIC LANDINGS
CARGO: INTERNATIONAL LANDINGS
ANCHORAGE INTERNATIONAL AIRPORT ACTIVITY REPORT
82,349
60,617 58,415 2,202
21,732 8,113
13,619
AIMAIN.wK4 ISER 09/01/95
7
8
AlMAINWK4
The Economic Contribution of the Anchorage International Airport
Source: U.S. Department 01 Transportation, Research and Spacial Programs Administration. Commuter Air Camer Activity at Anchorage, Alaska. OUarterty reports from Quarter 4, 199 to Quarter 3, 1994.
11
tSER 09/01195
12 The Economic Contribution of the Anchorage International Airport TABLE 1-3,
WHERE ARE ANCHORAGE PASSENGERS GOING?
NUMBER PERCENT OF OF
DEPARTURES DEPARTURES
1,933,879 100% TOTAL (AI< and Oubllde)
1,078,080 58% TOTAL OUTSIDE
825,101 43% Seattle, WA 113,277 6% SaItLaka City, UT 39,922 2% MInneapolis; SI.Paul, MN 27,778 1% Chicago,IL 23,242 1% PorUand, OR
16,315 1% Detroit, MI 12,171 1% Denver, CO 10,500 1% San Francisco, CA 7,085 0% Honolulu, HA
Honolulu. HA 90.' 0.2% 0.0% 10.2 Honolulu, HA Detroit, MI 68.6 0.1% 0.3% 160.5 Detroit, MI
Denver, CO 22.3 0.0% 0.9% 466.6 Denver, CO 0.3% 180.2 Phlll.delphla, PA 0.0% 11.6 DallaeiFt. Worth, TX 0.0% 0.' Spokane, WA 0.0% 0.3 Yakima, WA 0.0% 0.2 Moses Lake WA
Source: U. S. Department ofTranaportatlon, T100 Segment Data. From AlaSka Aviation Fteid Office, Anchorage. Non-Stop Segments
DOTSCHL.WK4 ISER 09/01195
16
DOTSCHL.WK4
The Economic Contribution of the Anchorage International Airport
TABLE 1-4.
FREIGHT TRAFFIC
INTO AND OUT OF ANCHORAGE INTERNATIONAL AIRPORT
PART 2. COMMUTER AIRLINES 1993:4 TO 1994:3
ARRIVING FROM OR
DEPARTING TO (1000 LBS.)
TOTAL 5.201.5
Kodiak 1.567.4 30.1% Kenai 1.186.4 22.8% Valdez 793.1 15.2% Homer 505.5 9.7% King Salmon 181.5 3.5%
Barter Istand 0.1 0.0% Galena 0.0 0.0% Nome 0.0 0.0%
Source: U.S. Department of Transportation. Research and Special Programs Administration. Commuter Air Carrier Activity at Anchorage. Alaska. Quarterly reports from Quarter 4.1993 to Quarter 3, 1994.
ISER 09101195
The Economic Contribution of the Anchorage International Airport TABlE 1-6,
MAlL TRAFFIC
INTO ANO OUT OF ANCHORAGE INTERNATIONAL AIRPORT
PART 1. 8C~lEOULED MAJOR CARRIERS 11104 (eY)
ARRMNG ANCHORAGE OR DEPARTING ANCHORAGE OR PA88ING THROUGH PA88ING THROUGH
FROM (1000 LSS) 11 11 (1000 LSS) TO
TOTAL (AI< ond 0_) :lUD,8 80,_,3 TOTAL (AI< ond 0_)
Seattle, WA 10,195.9 42.7% 6,7'11> 04,000.6 Seattle, WA Salt Lake City, UT 4,567.1 19.1% 2,7'11> 1,6046.9 Salt Leke City, UT
Minneapolis: St.Paul, MN 477.9 2,0'11> 0,5'11> 277.2 Minneapolis; St.Paul, MN Portland, OR 182,9 0.8'11> 0.3% 201.2 Portland, OR
Chlcago,IL 169.4 0,7'11> 0.1% 65.8 Chlcago,IL
Denver, CO 112.4 0,5'11> 0,2'11> 118.7 Denver, CO Detroit, MI 70.4 0,3'11> 0,1'11> 50,3 Detroit. MI
San Francisco, CA 33.5 0,1'11> 0,0'11> 2,8 San Francisco, CA NewYor1t, NY 25,4 0.1% 0.0'11> 0,0
Los Angeles, CA 9,2 0.0'11> 0,0'11> 3,0 Los Angeles, CA 0,0'11> 10.0 Honolulu, HA 0.0'11> 5.2 OallasiFt. Worth, TX 0.0% 0.9 Yakima, WA 0.0% 0,8 Milwaukee, WI 0,0'11> 0.1 Spokane, WA
SOUroe: U. S. Departmant of Transportation. noo Segment Data. From A.l8aka Aviation Field Office. AnchOrage. NonStop Segments
OOTSCHLWK'
17
ISER 09101/95
18 The Economic Contribution of the Anchorage International Airport TABLE 1·5.
Iliamna 504.8 8.5% King Salmon 344.7 5.8% Homer 254.8 4.3% Kenai 229.8 3.9% Soldotna 196.1 3.3%
Valdez 152.6 2.6% St. Mary's 95.7 1.6% Aniak 74.5 1.2% Cold Bay 41.0 0.7% Dutch Harbor 33.7 0.6%
Red Devil 30.2 0.5% St. Paul 27.4 0.5% Sleetmute 22.3 0.4% Sandpoint 20.4 0.3% St. George 11.0 0.2%
Stony River 8.1 0.1% Bethel 7.6 0.1% Emmonak 4.1 0.1% Nome 0.7 0.0% Galena 0.1 0.0%
Source: U.S. Department ofTransportation, Research and Special Programs Administration. Commuter Air Carrier Activity at Anchorage, Alaska. Quarterly reports from Quarter 4, 1993 to Quarter 3, 1994.
DOTSCHL.WK4 ISER 09/01/95
The Economic Contribution of the Anchorage International Airport 19
FIGURE 1-3.
DOMESTIC CARGO ANCHORAGE INTERNATIONAL AIRPORT
30 f/) C
rl Z 20 :;)
~ ,~t\ !1\ r\ ~ U,\ 1\ 0
A ~ IA /; a.
Ii , !i ~
II z 'i
it n n 0 i! ji fl fi " n Ii t: 10 ,
" :: !; :J
I~ 1'1 1 ~. i\.J \ ~\ .J\~ , f~~j\) \,)\}~ j:"" it )\ ')~f , 1\ Ii, .,i\. J \..~) ...J P'( 51j c ,
SOURCE: ANCHORAGE INTERNA110NAL AIRPORT ACTIVITY REPORT FOR FY 1994. THE SIGNATORIES ACCOUNT FOR 92% OF LANDINGS. OATA Of\IlRANSIT FREIGHT IN 1H1S TABlE DOES NOT CORRESPONOTO SOURCE DOCUMENT WE TO AUTHOR ESTIMATE FOR NON REPORTING AIR CARRIERS.
CA) FEOEX AND JAL ESTIMATED BY AVTHOR USING UPS AND KAL RESPECTIVELY
ISER 09m1195
;I ID
8' = ~ ;:;"
i =c C'. g !a-i ~ ~ i m g. = !!!. !: i ::I.
N -
The Economic Contribution of the Anchorage International Airport
Section I.
Measures of the Total Economic Contribution of the Airport
23
The Economic Contribution of the Anchorage International Airport
2. JOBS AT THE AIRPORT
\Th),\
CARGO
V[SlIORS
Al '\<;'" ,'C 1"1 .",- ",!\.t\. >,)
C)l :\"Cj"'r:: \,. ' .) I.JL
(\'\(HOR\GI
PUBlIC D PRIVATE TENANTS
-----,
ANCIIOHAGE
Who Are the Employers at the Airport?
• Scheduled caniers
• Govemment te113nts not aviation-related
• Air taxis and chatters
• Air serl~ce pro\~ders
• Govemment tenants using air sClviccs
• State govemment airpOit operations
• Federal govemment airpOit operations
• Passenger selvices
• Freight forwarders
• Car rental agents
• ConstlUction contractors
• Plivate basic indusny
• Other
25
Arc the on AnchoH1J!,e HOHsehokh
muJ Busi.l1esses?
The Economic Contribution of the Anchorage International Airport 27
2. Jobs at the Airport
Jobs By Employer On an average day in 1994 there were about 7,400 people working on airport property The annual payroll associated with those jobs was $272 million. Most of these workers were providing air transport services in a variety of capacities, but about 750 were working for tenants who were not primarily dependent on air transport services.
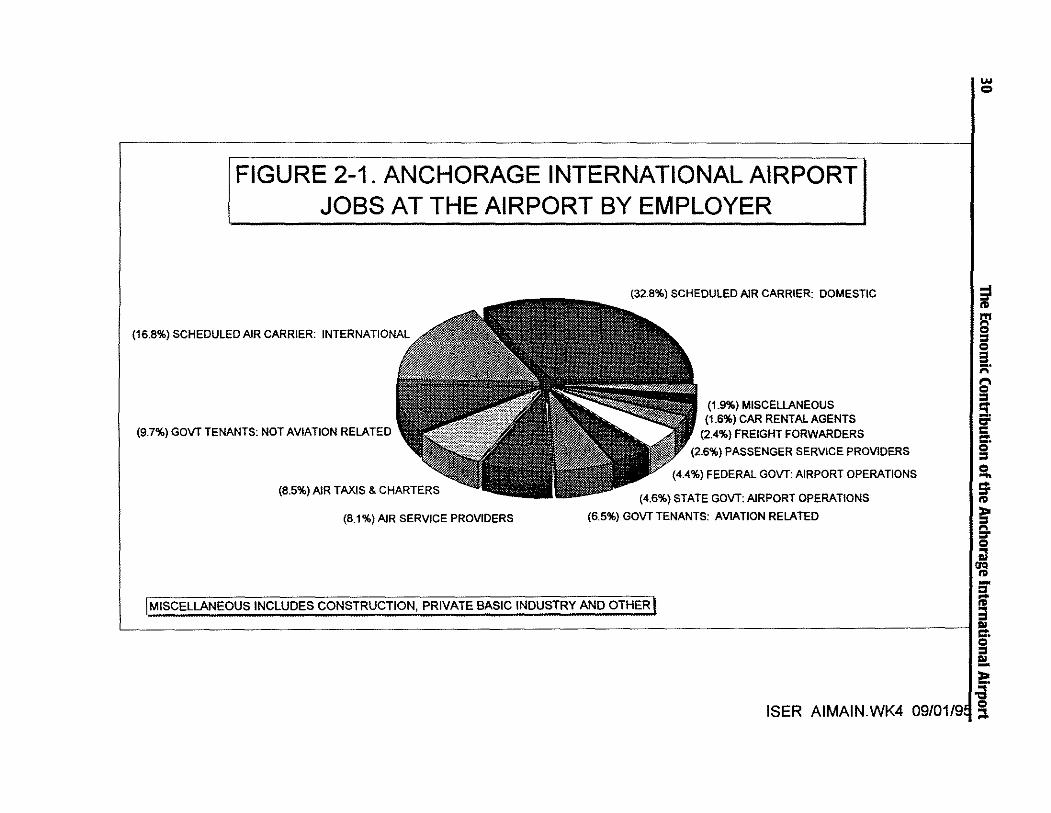
We have identified 14 major categories of employers but because of the complex variety of activities taking place at the airport, any categOlization will be somewhat arbitrary The employment breakdown as well as payroll by employer is shown in Table 2-1 and Figures 2-1 and 2-2.
Nearly half of all jobs at the airport are with the Scheduled Air Carriers, both passenger and freight, both domestic and international. Next in order of importance is the federal government with about 1,200 jobs distributed among three of our categories. The Federal Aviation Administration is directly involved in operation of the airport and it is the largest agency in the category of Federal Government: Airport Operations. Kulis Air National Guard Base is included as part of Government Tenants: Aviation Related. The u.s. Postal Service is part of Government Tenants: Not Aviation Related. Air Taxi and Charters, providing non-scheduled passenger and freight service to business and individuals, is next in order of importance with about 600 employees. The state government employs nearly 600, split primarily between the operation of the airportState Government: Airport Operations and the Southcentral headquarters of the Department of Transportation Government Tenants: Not Aviation Related.
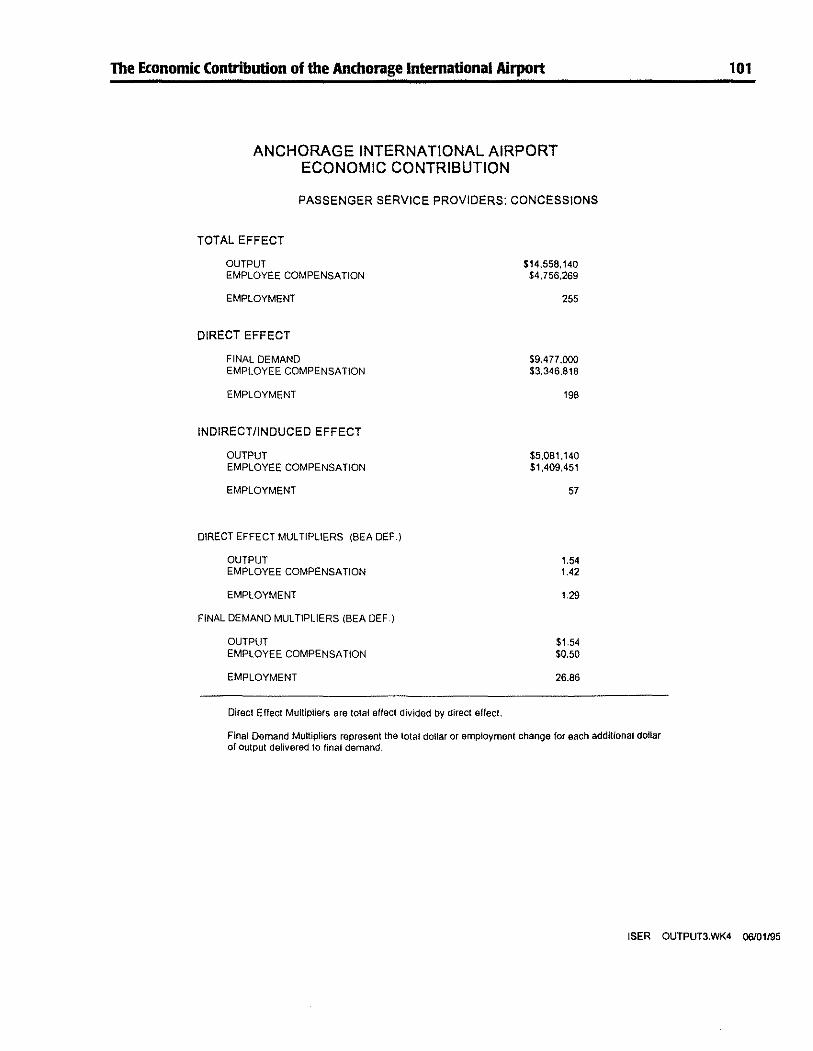
About 600 employees of Air Service Providers-fixed based operators, fuel distributors, and catering companies-provide support services to the different users of the airport. About 200 Passenger Service Provider company employees work in the shops and restaurants at the airport. Freight Forwarders at the airport employ about 200 workers.
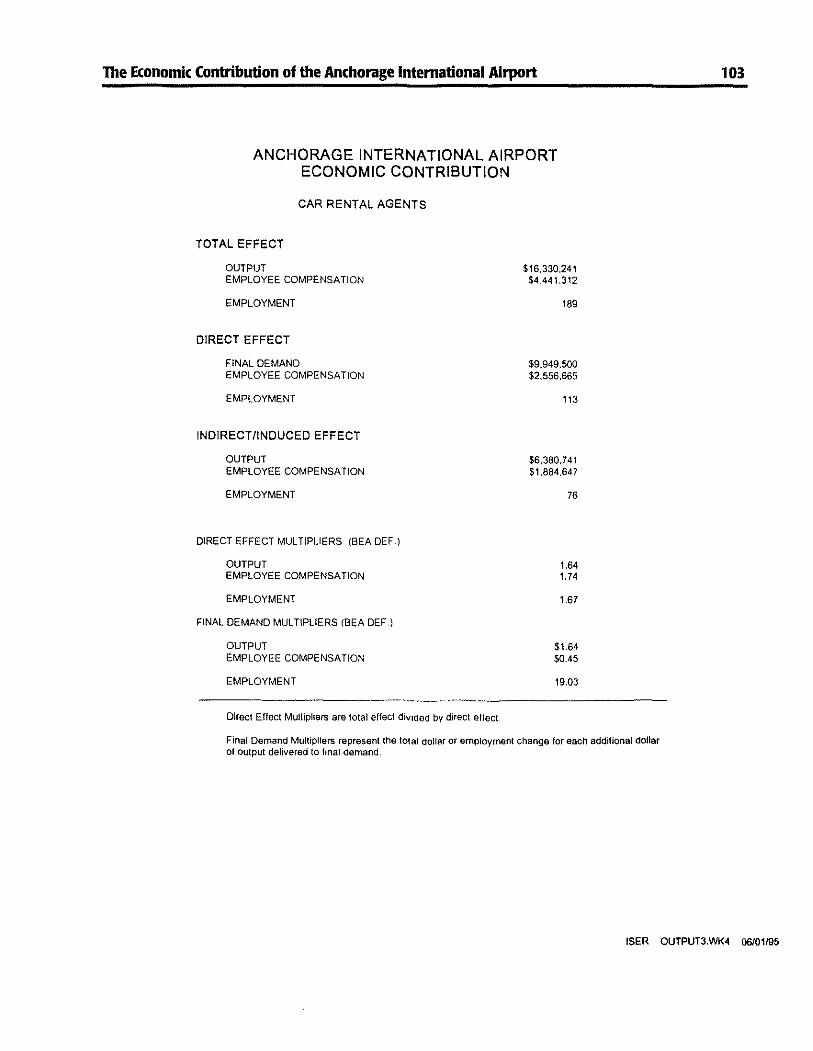
Workers at Car Rental Agencies operating out of the airport number more than 100. At any given time there is likely to be Construction activity associated with the maintenance and expansion of the airport infrastructure of about 80 workers. About 60 Private Basic Industry jobs are concentrated in oil company warehOUSing and fish processing. Finally about 50 jobs are in a variety of Other miscellaneous support businesses not directly related to the operation of the airport such as restaurants (not in the terminal) and travel agencies.
Not included in these figures are an unknown number of jobs off-site directly related to the function of the airport. This would include among other things some federal Department of Transportation employees, rental car companies off-site that provide shuttle service from the airport, aircraft repair and sales. These jobs are scattered in various locations around the city
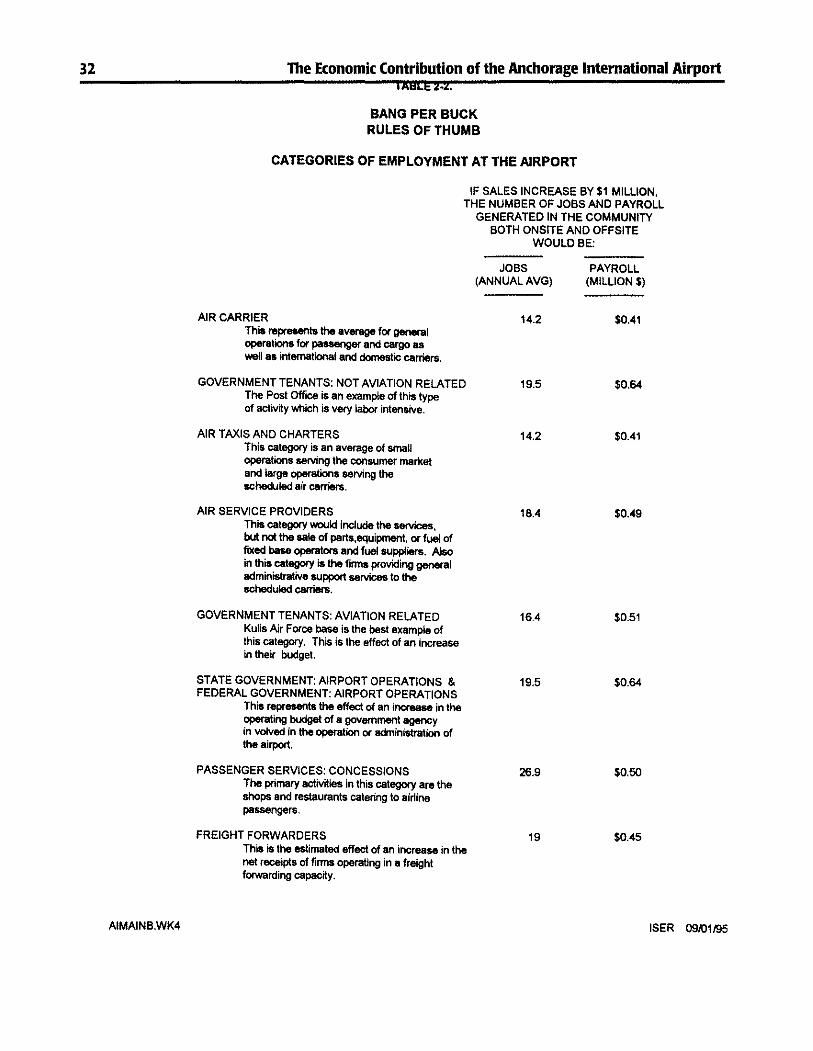
Employment Multiplier "Rules Of Thumb" Table 2-2 provides "rules of thumb" employment and payroll multipliers for these different categories of employment at the airport. Each set of multipliers represents the total jobs and total payroll generated in the economy from an increase in industry sales into the local economy of $1 million. For example an increase in passenger concession sales of $1 million would generate employment of 27 Gobs in this sector are relatively low paying) and payroll of $500,000 including both on-site and off-site effects. An increase in construction activity of $1 million would create 11 jobs and a payroll of $380,000.
28 The Economic Contribution of the Anchorage International Airport
In addition the table shows the multipliers associated with $1 million of local purchases by flight crews in transit and by visitors-both Alaskans and non-Alaskans.
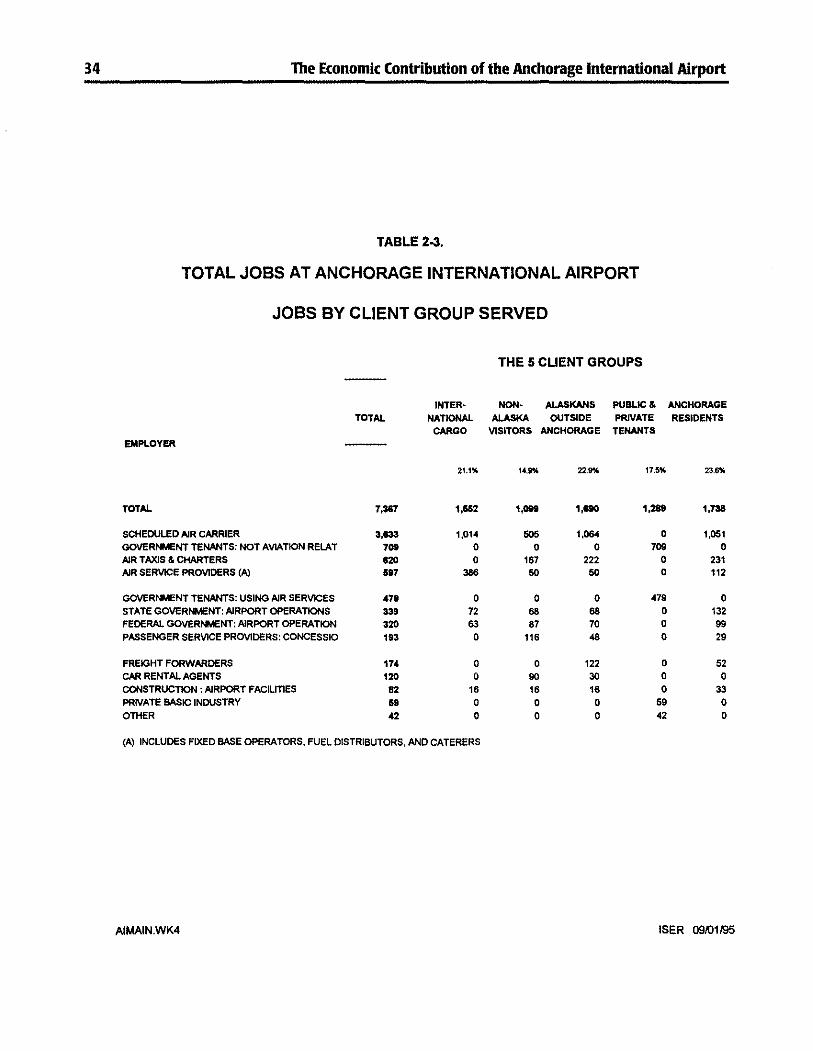
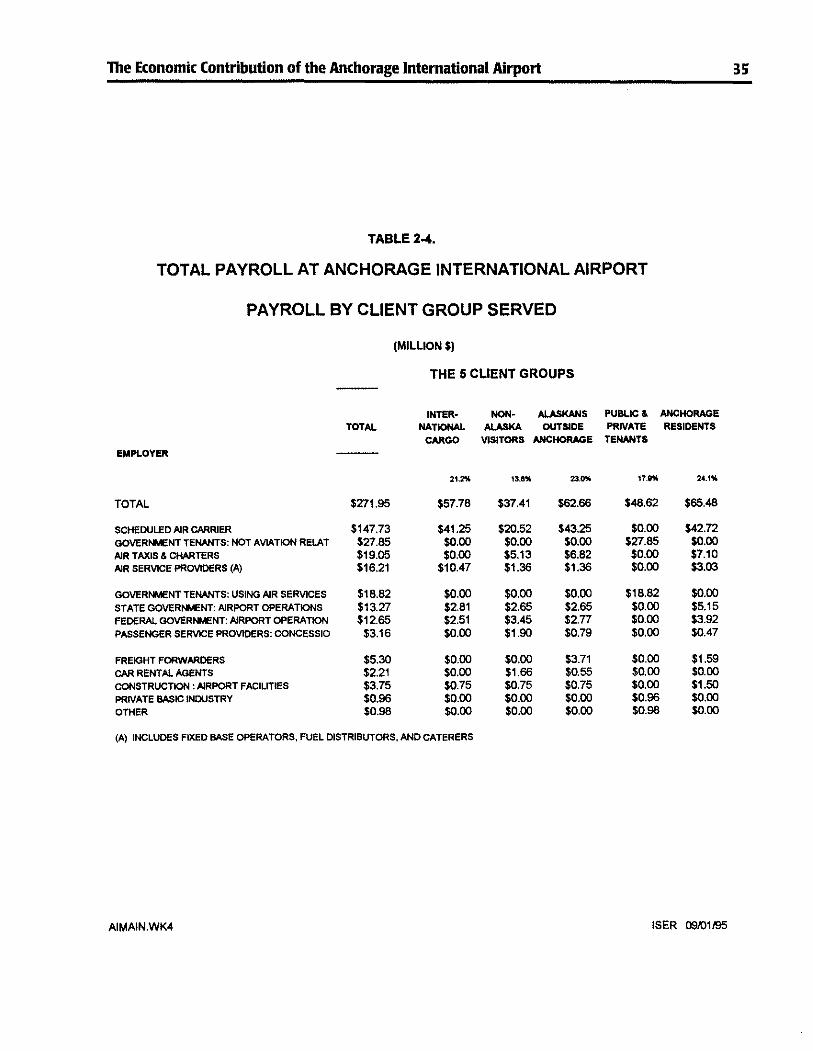
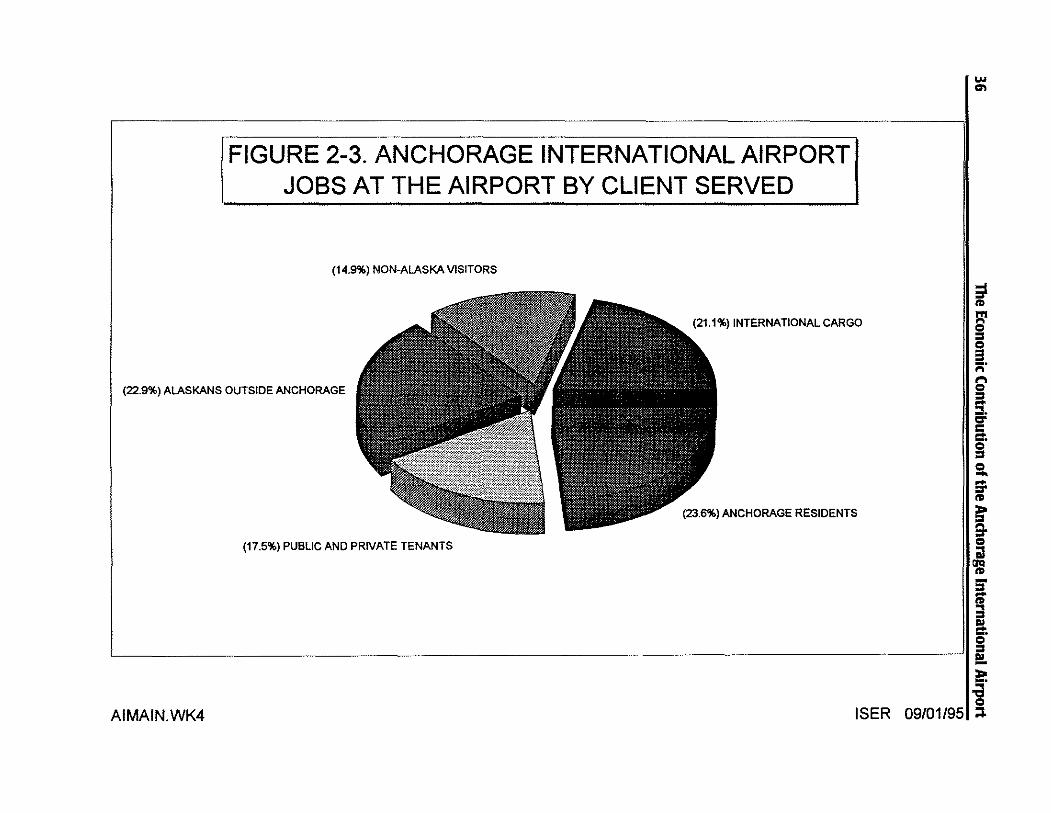
Jobs By User Served Total employment can be broken down by the type of user served. The breakdown by the five types of users we analyze in Chapters 6 through 10 is shown in Tables 2-3 and 2-4, and Figure 2-3. For example there were 1,552 jobs at the airport attributable to the provision of international cargo services. In addition to 1,014 scheduled air carrier jobs and 386 air service provider jobs, a portion of airport operations job, both state and federal, are allocated to this user. In addition a portion of the construction jobs are due to this activity.
Jobs By Service Provided Finally, we can categorize employment at the airport by the general type of service provided (Figure 2-4). We identify four primary services. Freight Handling functions employed the largest number, nearly 3,000. Second in order of importance was Passenger handling, employing about 2,600. General Aviation and Air Taxis employed 500, and Other, mostly non-aviation related tenants, employed 1,300.
The Economic Contribution of the Anchorage International Airport
TABLE 2·1.
ANCHORAGE INTERNATIONAL AIRPORT
TOTAL EMPLOYMENT AND PAYROLL BY TYPE OF EMPLOYER
EMPLOYER
TOTAL
SCHEDULED AIR CARRIER: DOMESTIC
SCHEDULED AIR CARRIER: INTERNATIONAL (A)
GOVERNMENT TENANTS: NOT AVIATION RELATIED
AIR TAXIS & CHARTIERS
AIR SERVICE PROVIDERS (B)
GOVERNMENT TlENANTS: AVIATION RELATIED
STATIE GOVERNMENT: AIRPORT OPERATIONS
FEDERAL GOVERNMENT: AIRPORT OPERATIONS
PASSENGER SERVICE PROVIDERS: CONCESSIONS
FREIGHT FORWARDERS
CAR RENTAL AGENTS
CONSTRUCTION: AIRPORT FACILITIES
PRIVATE BASIC INDUSTRY
OTHER
DATA FOR 1994
JOBS
7,367
2,403 1,230
709 620
597 479 339 320
193 174 120 82
59 42
(A) INCLUDES CARGO CARRIERS SUCH AS UPS AND FEDEX (B) INCLUDES FIXED BASE OPERATORS. FUEL DISTRIBUTORS. AND CATERERS
PAYROLL (MILLION $)
$271.95
$97.72 $50.02 $27.85 $19.05
$16.21 $18.82 $13.27 $12.65
$3.16 $5.30 $2.21 $3.75
$0.96 $0.98
29
AIMAINWK4 ISER 09/01/95
FIGURE 2-1. ANCHORAGE INTERNATIONAL AIRPORT JOBS AT THE AIRPORT BY EMPLOYER
(16.8%) SCHEDULED AIR CARRIER: INTERNATIONAL
(9.7%) GOVT TENANTS: NOT AVIATION RELATED
(8.5%) AIR TAXIS & CHARTERS
(8.1 %) AIR SERVICE PROVIDERS
(32.8%) SCHEDULED AIR CARRIER: DOMESTIC
(1.9%) MISCELLANEOUS (1.6%) CAR RENTAl AGENTS
(2.4%) FREIGHT FORWARDERS
(2.6%) PASSENGER SERVICE PROVIDERS
(4.4%) FEDERAL GOVT: AIRPORT OPERATIONS
(4.6%) STATE GOVT: AIRPORT OPERATIONS
(6.5%) GOVT TENANTS: AVIATION RELATED
!MISCELLANEOUS INCLUDES CONSTRUCTION, PRIVATE BASIC INDUSTRY ANDOTHER I
... 0=
~ 8 g a ;:;.
6' = ~ C'. g sa. S-III
~ ~ i
L--------------------------------------------------------------------------------------------il~. g !!!. ~ .a
ISER AIMAINWK4 09/01/911!i
FIGURE 2-2. WHO WORKS AT ANCHORAGE INTERNATIONAL AIRPORT JOBS BY EMPLOYER
SCHEDULED AIR CARRIER: DOMESTIC
SCHEDULED AIR CARRIER: INTERNATIONAL (A)
GOVERNMENT TENANTS: NOT AVIATION RELATED
AIR TAXIS & CHARTERS
AIR SERVICE PROVIDERS (B)
GOVERNMENT TENANTS: AVIATION RELATED
STATE GOVERNMENT: AIRPORT OPERATIONS
FEDERAL GOVERNMENT: AIRPORT OPERATIONS
PASSENGER SERVICE PROVIDERS: CONCESSIONS
FREIGHT FORWARDERS
CAR RENTAL AGENTS
CONSTRUCTION: AIRPORT FACILITIES
PRIVATE BASIC INDUSTRY
OTHER
o 500 1000 1500 2000 2500
ISER AIMAINWK4 09/01/9~
;I til
8' = 0 3 ;:;. t"I 0 = -::!. C" c cr. 0 = 0
1-~ til
SO S-o ii1
(JQ til -= -til 3 GO C'. 0 = !!. !: -a 0 ::I.
... ....
32
AIMAINS.wK4
The Ec:onomic Contribution of the Anchorage International Airport IASLE2 .. 2.
BANG PER BUCK RULES OF THUMB
CATEGORIES OF EMPLOYMENT AT THE AIRPORT
AIR CARRIER This represent. the average for general operations for passenger and cargo as well as international and domestic carriers.
IF SALES INCREASE BY $1 MILLION, THE NUMBER OF JOBS AND PAYROLL
GENERATED IN THE COMMUNITY BOTH ONSITE AND OFFSITE
WOULD BE:
JOBS PAYROLL (ANNUAL AVG) (MILLION $)
14.2 $0.41
GOVERNMENT TENANTS: NOT AVIATION RELATED 19.5 $0.64 The Post OffICe is an example of this type of activ.y which is very labor intensive.
AIR TAXIS AND CHARTERS 14.2 $0.41 This category is an average of small operattons serving the consumer market and large operations SOlVing the scheduled air carriers.
AIR SERVICE PROVIDERS 18.4 $0.49 This category would include the SOfViices, but not the sale of parts,equipment, or fuel of fixed base operators and fuel suppliers. Also in this category is the finns pt'oviding general edministrative support SOfViices to the scheduled caniers.
GOVERNMENT TENANTS: AVIATION RELATED 16.4 $0.51 Kulis Air Force base is the best example of this category. This is the effect of an increase in their budget.
STATE GOVERNMENT: AIRPORT OPERATIONS & 19.5 $0.64 FEDERAL GOVERNMENT: AIRPORT OPERATIONS
This rept'esent. the effect of an i"""""", in the operating budget of a government agency in votved in the operation or administration of the airport.
PASSENGER SERVICES: CONCESSIONS 26.9 $0.50 The primary activities in this category are the shops and restaurants catering to airline passengers.
FREIGHT FORWARDERS 19 $0.45 This is the estimated effect of an increase in the net receipts of finns operating in a freight forwarding capacity.
ISER O9.IJ1195
The Economic Contribution of the Anchorage International Airport 33
AIMAINB.wK4
TABLE 2-2.
BANG PER BUCK RULES OF THUMB
CATEGORIES OF EMPLOYMENT AT THE AIRPORT
IF SALES INCREASE BY $1 MILLION. THE NUMBER OF JOBS ANO PAYROLL
GENERATED IN THE COMMUNITY BOTH ONSITE AND OFFSITE
WOULOBE:
CAR RENTAL AGENTS This category is the rental car companies at the airport.
CONSTRUCTION This represents the effect of 8n increase in the capital construction budget for the airport.
PRIVATE BASIC INDUSTRY This repesents an average of the wide range of private basic industry presence at the airport which includes fish processing which is relatively labor intensive, as well as oil production which is not.
MISC SUPPORT Support activities at tho airport that are not providing HrVice& e~her directly to air carriers or air passengers and are not included elsewhere are in this category. These are laOOr' intenstve service providing companies like travel agents and restaurants serving workers at the airport.
FLIGHT CREW An increase in flight crew spending in the local economy would generate jobs in hotels, restaurants, and retail establishments. These businesses tend to be labor intensive.
ALASKA RESIOENT VISITOR An increase in spending by Alaska resident visitors while in Anchorage would generate ;obs in hotels, restaurants, and retail establishments. These businesses tend to be labor intensive.
NON-ALASKAN VISITOR An increase in spending by Non.. Alaska resident resident vis~ors while in Anchorage would generate jobs in hotels, restaurants, and retail establishments. These businesses tend to be labor intensive.
JOBS (ANNUAL AVG)
19
11
9.4
28.6
21.n
24.5
24.5
PAYROLL (MILLION $)
$0.45
$0.38
$0.22
$0.71
$0.45
$0.49
$0.49
ISER 09/01195
34 The Economic Contribution of the Anchorage International Airport
TABLE 2-3.
TOTAL JOBS AT ANCHORAGE INTERNATIONAL AIRPORT
JOBS BY CLIENT GROUP SERVED
THE 5 CUENT GROUPS
INTER- NON· ALASKANS PUBUC& ANCHORAGE TOTAL NATIONAL ALASKA OUTSIDE PRIVATE RESIDENTS
CARGO VISITORS ANCHORAGE TENANTS EMPLOYER
2'.1% 14.8% 22.'" 17.5% 23.6%
TOTAL 7.387 1.552 1,0lI0 1,_ 1,289 1,738
SCHEDULED AIR CARRIER 3,_ 1.014 505 1,_ 0 1,051 GOVERNMENT TENANTS: NOT AVIATION RELAT 709 0 0 0 709 0 AIR TAXIS & CHARTERS 120 0 167 222 0 231 AIR SERVICE PROVIDERS (A) 187 366 50 50 0 112
GOVERNMENT TENANTS: USING AIR SERVICES 478 0 0 0 479 0 STATE GOVERNMENT: AIRPORT OPERATIONS 339 72 66 66 0 132 FEDERAL GOVERNMENT: AIRPORT OPERATION 320 63 87 70 0 99 PASSENGER SERVICE PROVIDERS: CONCESSIO 193 0 116 48 0 29
(A) INCLUDES FIXED BASE OPERATORS, FUEL DISTRIBUTORS, AND CATERERS
AIMAINWK4 ISER 09101195
FIGURE 2-3. ANCHORAGE INTERNATIONAL AIRPORT JOBS AT THE AIRPORT BY CLIENT SERVED
(14.9%) NON-ALASKA VISITORS
(21.1 %) INTERNATIONAL CARGO
(22.9%) ALASKANS OUTSIDE ANCHORAGE
(23.6%) ANCHORAGE RESIDENTS
(17.5%) PUBLIC AND PRIVATE TENANTS
IN en
;1 ~
f ;::'
§
~ c: !S So i
I ill
a;g 5' ;-
~-------------------------------------------------------------------------------- ~ g. 'I S -!:
AIMAINWK4 ISER i
091011951 ;l
FIGURE 2-4. ANCHORAGE INTERNATIONAL AIRPORT JOBS AT THE AIRPORT BY SERVICE PROVIDED
(41.2%) FREIGHT
(34.7%) PASSENGER (17.5%) OTHER
;t ~
I ;::;. :;;'
s. co c =:. o = a if
I iii a,g
I § !!!.
i (6.6%) GENERAL AVIATION & AIR TAXI 11::1.
AIMAIN.wK4 ISER 09101195 w .....
The Economic Contribution of the Anchorage International Airport 39
3. CONTRIBUTION OF NEW MONEY THE AIRPORT BRINGS TO ANCHORAGE
Who Uses Airport Services?
Who Are the Employers at the Airport?
• Scheduled caniers
What Are the Effects on Anchorage Households
and Businesses?
The Economic Contribution of the Anchorage International Airport
3. Contribution of New Money the Airport Brings to Anchorage
Excluding Off-Site Visitor Spending There are four groups besides Anchorage residents using Anchorage International Airport for air transport services. These users bring money into the Anchorage economy and contribute to the economic base of the community in the same way that the expon of coal contributes to the economic base of the state. They are:
INTERNATIONAL CARGO
NON-ALASKA VISITORS
ALASKANS OUTSIDE ANCHORAGE
PUBLIC AND PRIVATE TENANTS: AVIATION DEPENDENT
41
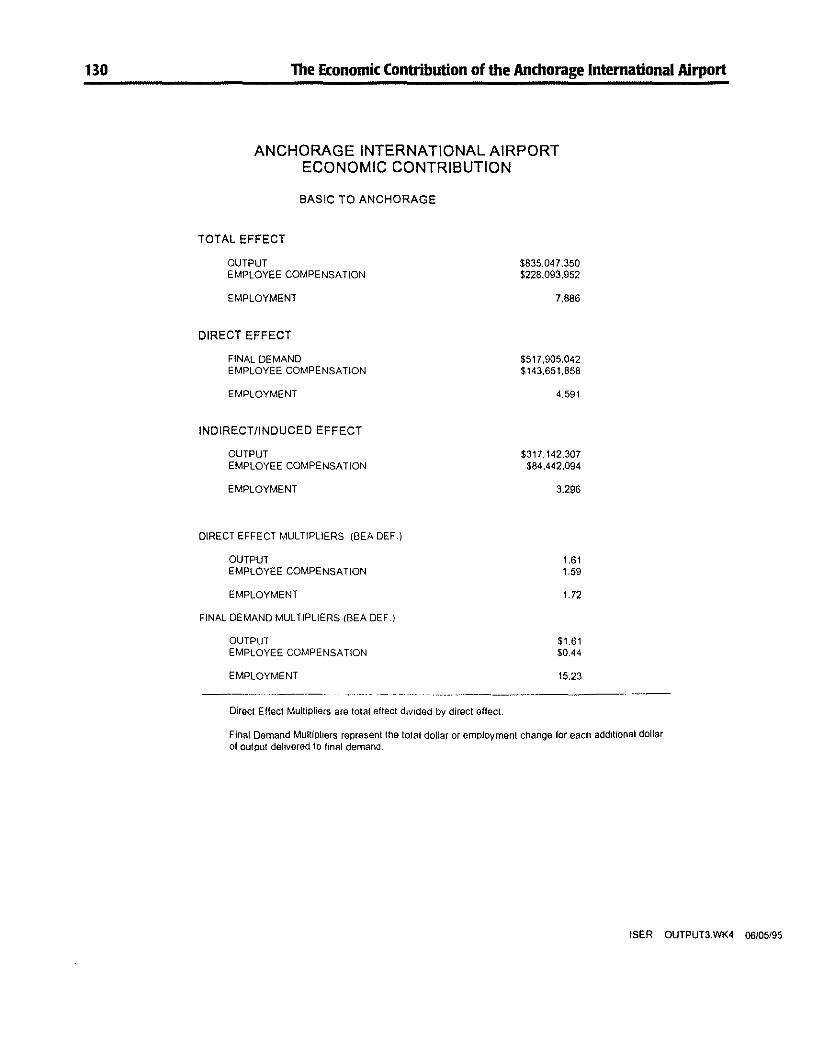
The infuSion of money to pay for these services supports 4,900 jobs at the airport and an additional 3,000 01Tsite jobs as a result of the economic multiplier. The total employment impact of the economic base activities at the airport is 7,900 and the payroll impact is $228 million.
These user groups draw on the services of all types of employment at the airport except those government tenants who are not aviation related-the U.s. Postal Service and the Alaska Depanment of Transportation Regional Office.
The off-site jobs are in three categories. Most important is the impact of the payrolls spent in the community by households with a worker with a job at the airpon. This payroll spending supports jobs in retail trade, services, and other sectors providing for the needs of Anchorage households. Airpon businesses also purchase goods and services from businesses in the Anchorage economy such as fuel and various business services. This procurement spending provides additional jobs in the community. Providing crew services to transient crew members of passenger and freight airlines has become less important in recent years but still accounts for about 250 jobs in the community.
Including Off-Site Visitor Spending Non-Alaska visitors and Alaskans from outside Anchorage use the airport to travel to Anchorage. We estimate that spending in Anchorage by visitors arriving by air generated 5,200 jobs and $104 million in payrolL
Although it is inappropriate to attribute all visitor spending to the presence of the airport, it is clear the airport is an important factor in the creation of these jobs. Combining the impact arising from providing air transport services to non-Anchorage residents with this off-site visitor spending results in an employment total of 13,100 with an annual payroll of $332 million.
The Economic Contribution of the Anchorage International Airport 43
4. CONTRIBUTION OF ALL AIR TRANSPORT ACTMTIES AT AIRPORT
Who Uses Airport Services?
Who Are the Employers at the Airport?
• Scheduled catTiers
What Are the Effects on Anchorage Households
and Businesses?
i> ~~pt~i,1.diTlY!) aV,<lY 1
I. ~ , ' .•. \ •. t ,,- ,
II
' j',. :111 "'1'1')')11
1..... .
The Economic Contribution of the Anchorage International Airport
4. Contribution of All Air Transport Activities of Airport
Excluding Off-site Visitor Spending
45
The Anchorage International Airport serves the aviation related needs of Anchorage residents as well as nonresidents. If we add the jobs at the airport which serve residents' aviation needs to the jobs serving nonresidents' aviation needs (Chapter 3) the sum represents the employment associated with all the air transport activities at the airport. All but a small portion of the employment at the airport-the U.5. Postal Service and the Alaska Department of Transportation Regional Headquarters being the most important exceptions--are air transport related.
Air transport services support 6,600 jobs at the airport. In addition this activity generates 4,300 jobs and $73 million of payroll off-site as a result of the multiplier effect. The total effect on the community is 10,900 jobs and $316 million of payroll. This represents the potential economic loss to the community if the entire airport were to move to a location outside of Anchorage.
The off-site jobs are in three categories. Most important is the impact of the $243 million in payrolls spent in the community by households with an air transport related worker with a job at the airport. This payroll spending supports jobs in retail trade, services, and other sectors providing for the needs of Anchorage households. Airport businesses also purchase goods and services from businesses in the Anchorage economy such as fuel and various business services. This procurement spending provides additional jobs in the community. Providing crew services to transient crew members of passenger and freight airlines has become less important in recent years but still accounts for about 250 jobs in the community.
Including Off-Site Visitor Spending Non-Alaskan visitors and Alaskans from outside Anchorage use the airport to travel to Anchorage. We estimate that spending in Anchorage by visitors arriving by air generated 5,200 jobs and $104 million in payroll.
Although it is inappropriate to attribute all visitor spending to the presence of the airport, it is clear the airport is an important factor in the creation of these jobs. Combining the impact arising from providing all air transport services with this off-site visitor spending results in an employment total of 16,100 with an annual payroll of $420 million.
The Economic Contribution of the Anchorage International Airport 41
5. CONTRIBUTION OF ALL ACTMTIES ON AIRPORT PROPERlY
Who Uses Airport Services?
Who Are the Employers at the Airport?
What Are the Effects on Anchorage Households
and Businesses?
The Economic Contribution of the Anchorage International Airport 49
5. Contribution of All Activities on Airport Property A number of government tenants whose missions are not directly aviation related are located at the airport. If we add these jobs, most of which are with the U.S. Postal Service and the Alaska Department of Transportation Regional Headquarters, to the other jobs at the airport which are serving the aviation related needs of residents and non-residents (Chapter 4) we arrive at the grand total for the airport.
All activities at the airport require employment on-site of 7,400 with an annual payroll of $272 million. In addition this activity generates 4,900 off-site jobs as a result of the multiplier effect for a grand total of 12,300 with an annual payroll of $360 million ..
Adding the 5,200 off-site jobs associated with visitor spending yields a grand total of 17,500 jobs associated with airport activities and payroll of $464 million.
The Economic Contribution of the Anchorage International Airport
Section II.
Measures of the Economic Contribution of Airport Services Provision by User Group
51
TIle Economic Contribution of the Anchorage International Airport 53
The Economic Contribution of the Anchorage International Airport 55
6. International cargo Service Anchorage is the nations most important air cargo airport as measured by the gross weight of cargo aircraft landings. Most of the major global air cargo carriers operate out of Anchorage providing cargo service both between the u.s. and the Far East and Europe and the Far East. Annual international cargo landings (including domestic carriers that operate internationally) total 16,000 annually-44 per day.
This activity has increased dramatically in the last decade and scheduled air carrier activity associated with international cargo services now stands at more than 1,000 jobs. This figure includes the portion of international and domestic carrier activity attributable to international cargo service. These jobs are associated primarily with the sorting of freight, piloting and crewing of aircraft, aircraft servicing, and aircraft maintenance.
An additional 550 jobs at the airport depend on the provision of international cargo services. These other jobs are primarily in the air services sector such as in fuel distribution. In addition a part of airport operations, both state government and the federal government, the Federal Aviation Administration, are attributable to international cargo services. A few of the airport construction jobs can be attributed to international cargo services. Total airport jobs related to the activity are 1,550.
The total economic impact of international cargo services on Anchorage is about 2,700 jobs and $78 million in payroll. These totals include, in addition to the jobs and payroll generated at the airport, the jobs and income produced off-site in the community from several activities. Payroll spending supports jobs in retail trade, services, and other Sectors providing for the needs of Anchorage households with an employee in the air cargo sector. Procurement spending provides jobs in businesses that sell to the air cargo businesses at the airport. Crew services also makes a modest contribution to the employment and payroll generated off-site.
This calculation does not take into account either the cost savings which Alaskans receive from the presence of the large international cargo carriers in the state, or the potential benefits which their presence provides in the decisions of firms to locate in Anchorage because of the access to this important international trade route.
56 The Economic Contribution of the Anchorage International Airport
TABLE 6-1.
ANCHORAGE JOBS AND PAYROLL ATTRIBUTABLE TO
INTERNATIONAL CARGO SERVICES
TOTAL AT AIRPORT
SCHEDULED AIR CARRIER GOVERNMENT TENANTS: NOT AVIATION RELATED AIR TAXIS & CHARTERS AIR SERVICE PROVIDERS (A)
GOVERNMENT TENANTS: USING AIR SERVICES STATE GOVERNMENT: AIRPORT OPERATIONS FEDERAL GOVERNMENT: AIRPORT OPERATIONS PASSENGER SERVICE PROVIDERS: CONCESSIONS
FREIGHT FORWARDERS CAR RENTAL AGENTS CONSTRUCTION: AIRPORT FACILITIES PRIVATE BASIC INDUSTRY OTHER
NON BASIC AT AIRPORT
AIR SERVICE PROVIDERS (A) PASSENGER SERVICE PROVIDERS: CONCESSIONS CAR RENTAL AGENTS OTHER
BASIC AT AIRPORT
TOTAL OFFSITE
TOTAL IMPACTS-AT THE AIRPORT AND OFFSITE
EMPLOYMENT PAYROLL (MILLION $)
(A) INCLUDES FIXED BASE OPERATORS, FUEL DISTRIBUTORS, AND CATERERS
AIMAIN,WK4
1,552
1,014 o o
386
o 72 83 o
o o
18 o o
40 o o o
1,512
1,176
2,728 $77.7
ISER 09/01/95
The Economic Contribution of the Anchorage International Airport 57
7. NON-AlASKA VISITORS
Who Uses Airport Services?
ANU10RAGF
RESIDENTS
Who Are the Employers at the Airport?
• Scheduled caniers
What Are the Effects on Anchorage Households
and Businesses?
The Economic Contribution of the Anchorage International Airport 59
7. Non-Alaska Visitors
A. Transportation Related Services Tourism is the fasting growing industry in Alaska. The number of tourists who visit the state exceeds 500,000 and is increasing at 5% to 7% annually Other visitors to the state include business travelers and people visiting relatives and friends. A majority of these visitors from outside the state travel at least one way by air, and most come through Anchorage at least once during their visit. The number of visitors from outside the state who visit Anchorage by air is about 500,000 in a year, and including those who use the airport to make trips to other destinations while in the state, we estimate the number of scheduled carrier passenger enplanements involving non-resident visitors to be more than 600,000 in a year-about one third of total enplanements.
The provision of air transportation services to these visitors is an important function of the airport. About 500 scheduled air carrier jobs among both international and domestic carriers support the movement of nonresident visitors into the state and around the state once they have arrived (including transit passengers). An additional 200 jobs in the air taxi/charter sector result from the provision of services to tourists and other visitors. Fifty jobs are among the air services providers.
Two hundred jobs at the airport depend directly on the provision of visitor related services. These other jobs are with the passengers service providers (concessions) and the car rental agencies. In addition a part of airport operatiOns, both state government and the federal government, the Federal Aviation Administration, are attributable to non-resident visitors. Finally some airport construction jobs are attributable to this user group.
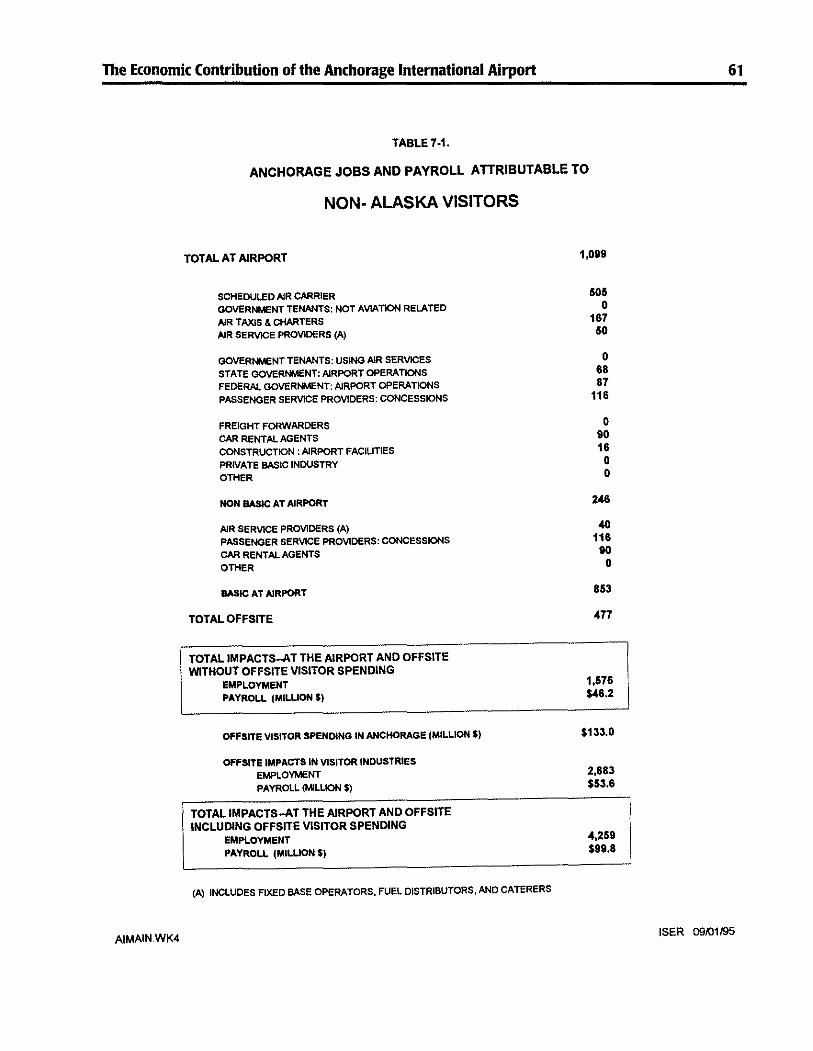
The total economic impact of non-Alaska visitor air transportation services on Anchorage is about 1,600 jobs and $46 million in payroll. These totals include, in addition to the jobs and payroll generated at the airport, the jobs and income produced off-site in the community from several activities. Payroll spending supports jobs in retail trade, services, and other sectors providing for the needs of Anchorage households with an employee in the air transport sector. Procurement spending provides jobs in businesses that sell to the air carriers and other businesses at the airport. Crew services for passenger flights makes a modest contribution to the employment and payroll generated off-site.
The total economic impact calculations excludes the visitor related services at the airport-passenger services and car rental agencies. These jobs are attributable to visitor spending rather than air transport related services. (These jobs, as well as some of the air service provider jobs are defined as non-basic in Table 7-1.)
B. Non-Resident Visitors-Including Visitor Spending Non-Alaska visitor spending, both at the airport and off-site, generates a large number of jobs within the economy Although it is inappropriate to attribute all the economic activity generated by spending by visitors that come by air to the presence of the airport, it is interesting to describe the total economic impact of visitor spending. This includes both the impact of the air transport related services provided to visitors (presented in section A) as well as the impact of visitor spending on all other goods and services both at the airport and offsite while in Anchorage.
Visitor spending for passenger services and rental cars accounts for 200 jobs at the airport. Passenger services are primarily the various retail shops and restaurants at the airport.
60 The Economic Contribution of the Anchorage International Airport
Visitors spend most of their dollars off-site-both in Anchorage and in the other communities in Alaska they may visit. Visitor dollars spent in Anchorage result in 2,700 jobs throughout the community including the jobs on-site at the airport.
The total impact of non-resident visitors on the community counting both the impact of providing transp0l1 related services and the impact of visitor spending is 4,300 jobs and $100 million of payroll annually.
The Economic Contribution of the Anchorage International Airport
TABLE 7-1.
ANCHORAGE JOBS AND PAYROLL ATTRIBUTABLE TO
AIMAINWK4
NON· ALASKA VISITORS
TOTAL AT AIRPORT
SCHEDULED AIR CARRIER GOVERf'..t..ENT TENANTS: NOT AVIATION RELATED NR TAXIS & CHARTERS AIR SERVICE PROVIDERS (A)
GOVERNMENT TENANTS: USING AIR SERVICES STATE GOVERNMENT: AIRPORT OPERATIONS FEDERAL GOVERNMENT: AIRpORT OPERATIONS PASSENGER SERVICE PROVIDERS: CONCESSIONS
FREIGHT FORWARDERS CAR RENTAl. AGENTS CONSTRUCTION: AIRPORT FACILITIES PRIVATE BASIC INOUSTRY OTHER
NON BASIC AT AIRPORT
AIR SERVICE PROVIDERS (A) PASSENGER SERVICE PROVIDERS: CONCESSIONS CAR RENTAL AGENTS OTHER
BASK: AT AIRpORT
TOTAL OFFSITE
TOTAL IMPACTS-AT THE AIRPORT AND OFFSITE WITHOUT OFFSITE VISITOR SPENDING
EMPLOYMENT PAYROLL (MILUON $)
OI'FSITE VISITOR SPENDING IN ANCHORAGE (MILLION $)
OFFSITE IMPACTS IN VlSITOR INDUSTRIES EMPLOYMENT PAYROLL (MILLION $)
TOTAL IMPACTS-AT THE AIRPORT AND OFFSITE INCLUDING OFFSITE VISITOR SPENDING
EMPLOYMENT PAYROLL (MILUON $)
(A) INCLUDES FIXED BASE OPERATORS. FUEL DISTRIBUTORS. AND CATERERS
1,Og9
506 o
167 50
o 68 87
116
o 90 16 o o
246
40 116 to o
653
477
1,576 $46.2
$133.0
2,883 $53.6
4,259 $99.6
61
ISER 09/01195
The Economic Contribution of the Anchorage International Airport 63
8. ALASKANS OUTSIDE ANCHORAGE
Who Uses Airport Services?
VISITORS
['1:Brie i\.ND I PRIV '1\:1" ,\nj'('
. L.: \, " . ,)
ANCHORAGE RFSJDENTS
,
Who Are the Employers at the Airport?
• Scheduled carriers
• \Jthcr
What Are the Effects on Anchorage Households
and Businesses?
The Economic Contribution of the Anchorage International Airport
8. Alaskans Outside Anchorage
A. Transportation Related Services There are several types of services provided to Alaskans living outside of Anchorage by Anchorage International Airport.
65
(I) Anchorage International Airport serves the air transportation needs of much of the state. The airport proVides access for rural Alaskans not only to the markets and services available in Anchorage (shopping and medical services to name the most obvious) and the rest of the U.S. but also to other parts of the state since much of the instate air transport system is deSigned as a hub with Anchorage at the center and spokes radiating out to the smaller communities. An estimated 350,000 non-Anchorage Alaskan visits are made each year into Alaskas largest city by air for business and pleasure visits. Many thousands more use the airport as an intermediate stop while traveling between rural communities.
(2) Anchorage is the center for freight distribution to rural Alaska. The importance of air freight to rural Alaska is reflected by the fact that domestic cargo enplanements (out of Anchorage) are typically twice the weight of freight deplanements (into Anchorage) with most of the inbound freight coming from "South of Anchorage" and most of the outbound freight going to "North of Anchorage." A large portion of this cargo is bypass mail, consisting largely of groceries and other staples bound for small rural communities, but material and equipment for all types of public and private sector activities moves by air out of Anchorage. For example, some of the larger oil companies maintain warehousing facilities at the airport and some construction firms lease space for staging the movement of materials and equipment to remote sites.
(3) Air transport services are provided specifically to Alaskan industry and government by the air taxi and charter operators with operations and headquarters at Anchorage airport. These services include such activities as the use of charter aircraft for supplying remote site activities, aerial surveying, and fire fighting and the use of helicopters supplying offshore sites and aerial surveying.
(4) A portion of air taxi operations result from non-Anchorage resident demands and a portion of fixed base operator and general aviation services result from demands generated by non-Anchorage resident aircraft owners in other parts of the state.
These activities support 1,400 airport jobs among the scheduled air carriers, air taxislcharters, and freight forwarders.
An additional 200 jobs at the airport depend directly on the provision of these visitor transportation services. These other jobs are in the air services sector such as in fuel distribution. In addition a part of airport operations, both state government and the federal government, the Federal Aviation Administration, are attributable to non-Anchorage resident air transport services. A portion of the construction jobs at the airport are also attributable to Alaskans outside Anchorage.
Finally about 100 jobs among the passenger service providers and car rental agents result from the provision of visitor services to these users. The total employment at the airport attributable to Alaskans outside Anchorage is 1,700.
The total economic impact on Anchorage of the provision of these air transportation related services statewide is about 2,800 jobs and $81 million in payroll. These totals include, in addition to the jobs and payroll generated at the airport, the jobs and income produced off-site in the community from several activities. Payroll spending supports jobs in retail trade, services, and other sectors providing for the needs of Anchorage
66 The Economic Contribution of the Anchorage International Airport
households with an employee in the air transport sector. Procurement spending provides jobs in businesses that sell to the air transport businesses at the airport. Crew services for passenger flights makes a modest connibution to the employment and payroll generated off-site.
The total economic impact calculation excludes the visitor related services at the airport-passenger services and car rental agents. These jobs are attributable to visitor spending rather than air transport related services. (These jobs, as well as some of the air service provider jobs are defined as non-basic in Table 8-1.)
B. Alaskans Outside Anchorage-Including Visitor Spending Visitor spending by Alaskans from outside Anchorage, both at the airport and off-site, generates a large number of jobs within the economy. Although it is inappropriate to attribute all the economic activity generated by spending by Alaskan visitors that come by air to the presence of the airport, it is interesting to describe the total economic impact of visitor spending. This includes both the impact of the air transport related services provided to visitors (presented in section A) as well as the impact of visitor spending on all other goods and services both at the airport and off-Site while in Anchorage.
Visitor spending for passenger services and rental cars accounts for 100 jobs at the airport. Passenger services are primarily the valious retail shops and restaurants at the airport.
Visitors spend most of their dollars off-site-both in Anchorage and in the other communities they visit while traveling away from home. Visitor dollars spent in Anchorage result in 2,500 jobs throughout the community including the jobs on-site at the airport.
The total impact of non-resident visitors on the community counting both the impact of providing transport related services and the impact of visitor spending is 5,400 jobs and $132 million of payroll annually.
The Economic Contribution of the Anchorage International Airport
TABLE '-1.
ANCHORAGE JOBS AND PAYROLL ATTRIBUTABLE TO
AIMAIN.wK4
ALASKANS OUTSIDE ANCHORAGE
TOTAL AT AIRPORT
SCHEDULED AIR CARRIER GOVERNMENT TENANTS: NOT AVIATION RELATED AIR TAXIS & CHARTERS AIR SERVICE PROVIDERS (A)
GOVERtHENT TENANTS: USING AIR SERvtCES STATE GOVERNMENT: AIRPORT OPERATIONS FEDERAL GOVERNMENT: AIRPORT OPERATIONS PASSENGER SERViCE PROVlDERS: CONCESSIONS
FREIGHT FORWARDERS CAR RENTAL AGENTS CONSTRUCTION: AIRPORT FAClunES PRIVATE BASIC INDUSTRY OTHER
NON BASIC AT AIRPORT
AIR SERVICE PROVIDERS (A) PASSENGER SERVICE PROVIDERS: CONCESSIONS CAR RENTAL AGENTS OTHER
BASIC AT AIRPORT
TOTAL OFFSITE
TOTAL IMPACTS-AT THE AIRPORT AND OFFSITE
EMPLOYMENT PAYROLL (MILUON $)
OFFSITE VISITOR SPENDING IN ANCHORAGE
OFFSITE IMPACTS IN VISITOR INDUSTRIES EMPLOYMENT PAYROLL (MILLION $)
TOTAL IMPACTS-AT THE AIRPORT AND OFFSITE INCLUDING OFFSITE VISITOR SPENDING
EMPLOYMENT PAYROLL (MILLION $)
(A) INCLUDES FIXED BASE OPERATORS. FUEL DISTRIBUTORS. AND CATERERS
1.110
1.064 o
222 50
o sa 70 48
122 30 16 o o
118
4(1
48 30 o
1.572
1,147
2,837 $61.2
$126.0
2,543 $50.8
5,380 $132.0
67
ISER 09/01195
The Economic Contribution of the Anchorage International Airport 69
9. PUBLIC AND PRIVATE TENANTS
Who Uses Airport Services?
VISlIORS
ANCHORAGE RES[DENIS
Who Are the Employers at the Airport?
• Govemment tenants not aviation-related
What Are the Effects on Anchorage Households
and Businesses?
j
j
j
j
j
j
j
j
j
j
I I
j
I I
I I
j I
j
I j
The Economic Contribution of the Anchorage International Airport 71
9. Public And Private Tenants Three government agencies-the U.s. Postal SelVice, the Department of Defense (Kulis Air National Guard Base), and the Alaska Department of Transportation-have a large presence at the Anchorage International Airport. The federal employees associated with Kulis Air National Guard Base require direct access to the airport and so are classified as Government Tenants: Using Air Services. Those associated with the u.s. Postal SelVice and those state employees at the regional headquarters of the Alaska Department of Transportation could be in another location and so are classified as Government Tenants: Not Aviation Related. Smaller numbers of government employees work at facilities maintained by the u.s. Department ofInterior and the Alaska Department of Public Safety.
Not all public employment at the airport is categorized as tenant employment. The state government employees who operate the airport and the federal government employees working for the Federal Aviation Administration form the largest group of government employees not considered tenants. These government employees are directly providing air transportation related selVices.
In addition to the 1,200 federal and state employees working for public tenants at the airport, there are approximately 100 private jobs at the airport associated with tenants not directly receiving air transport selVice. These jobs are in the private basic industry and other categories. These include among other things a fish processing plant and two travel agencies.
The total economic Significance of these airport tenants includes the jobs and income produced off-site in the community from payroll and procurement spending. Payroll spending supports jobs in retail trade, selVices, and other sectors proViding for the needs of Anchorage households with an employee who is working for a tenant. Procurement spending provides jobs in businesses that sell to tenants at the airport.
The total employment on and off-site associated with these tenants is 2,100 with an annual payroll of $67 million.
72 The Economic Contribution of the Anchorage International Airport
TABLE 9-1.
ANCHORAGE JOBS AND PAYROLL ATTRIBUTABLE TO
PUBLIC AND PRIVATE TENANTS
TOTAL AT AIRPORT
SCHEDULED AIR CARRIER GOVERNMENT TENANTS: NOT AVIATION RELATED AIR TAXIS & CHARTERS AIR SERVICE PROVIDERS (A)
GOVERNMENT TENANTS: USING AIR SERVICES STATE GOVERNMENT: AIRPORT OPERATIONS FEDERAL GOVERNMENT: AIRPORT OPERATIONS PASSENGER SERVICE PROVIDERS: CONCESSIONS
FREIGHT FORWARDERS CAR RENTAL AGENTS CONSTRUCTION: AIRPORT FACILITIES PRIVATE BASIC INDUSTRY OTHER
NON BASIC AT AIRPORT
AIR SERVICE PROVIDERS (A) PASSENGER SERVICE PROVIDERS: CONCESSIONS CAR RENTAL AGENTS OTHER
BASIC AT AIRPORT
TOTAL OFFSITE
TOTAL IMPACTS-AT THE AIRPORT AND OFFSITE
EMPLOYMENT PAYROLL (MILLION $)
(A) INCLUDES FIXED BASE OPERATORS, FUEL DISTRIBUTORS, AND CATERERS
AIMAIN.wK4
1,289
o 709
o o
479 o o o
o o o
59 42
42
o o o
42
1,247
815
2,104 $67.2
ISER 09/01/95
lbe Economic Contribution of the Anchorage International Airport 73
10. ANCHORAGE RESIDENTS
Who Uses Airport Services?
(',! 1'(' ',,,,tiL .. )
PIJBUC PRIV TENANTS
Who Are the Employers at the Airport?
• Scheduled caniers
• Other
What Are the Effects on Anchorage Households
and Businesses?
The Economic Contribution of the Anchorage International Airport 75
10. Anchorage Resident Services Anchorage International Airport provides several types of services to Anchorage residents.
(1) Anchorage residents make about 700,000 trips each year on scheduled airlines using the Anchorage International Airpon-about 3 trips per capita-split between business and other purposes. These trips are both to destinations within the state and outside and include travel on the large scheduled carriers and the smaller commuter carriers (scheduled passenger carriers).
(2) Resident use of airport services is also generated by local users of air taxi/charter services. (We include commercial use of air taxi and charter services in Chapter 9: Alaskans Outside Anchorage.)
(3) Resident use of the airport also is generated by general aviation activity supported by the 1000 general aviation aircraft at the airport.
These activities together generate 1,300 jobs at the airport. An additional 400 jobs at the airport depend directly on the proviSion of these Anchorage resident services. These other jobs are primarily in the air services sector such as in fuel distribution. In addition a part of airpon operations, both state government and the federal government, the Federal Aviation Administration, are attributable to Anchorage resident services. Additional jobs are in passenger services and freight forwarding. A few of the facilities construction jobs can be attributed to Anchorage resident services as well.
The total economic impact of these airpon jobs includes the jobs and income produced off-site in the community from payroll and procurement spending as well as some crew services. Payroll spending supports jobs in retail trade, services, and other sectors providing for the needs of Anchorage households with an employee in an air transpon job. Procurement spending provides jobs in businesses that sell to the air transpon sector at the airpon. Crew services are provided to a small number of passenger flight crews.
In total about 3,000 jobs in the community are attributable to the proviSion of air transport services to Anchorage residents. This employment generates an annual payroll of $88 million.
76 The Economic Contribution of the Anchorage International Airport
TABLE 10-1.
ANCHORAGE JOBS AND PAYROLL ATTRIBUTABLE TO
ANCHORAGE RESIDENTS
TOTAL AT AIRPORT
SCHEDULED AIR CARRIER GOVERNMENT TENANTS: NOT AVIATION RELATED AIR TAXIS & CHARTERS AIR SERVICE PROVIDERS (A)
GOVERNMENT TENANTS: USING AIR SERVICES STATE GOVERNMENT: AIRPORT OPERATIONS FEDERAL GOVERNMENT: AIRPORT OPERATIONS PASSENGER SERVICE PROVIDERS: CONCESSIONS
FREIGHT FORWARDERS CAR RENTAL AGENTS CONSTRUCTION: AIRPORT FACILITIES PRIVATE BASIC INDUSTRY OTHER
NON BASIC AT AIRPORT
AIR SERVICE PROVIDERS (A) PASSENGER SERVICE PROVIDERS: CONCESSIONS CAR RENTAL AGENTS OTHER
BASIC AT AIRPORT
TOTAL OFFSITE
TOTAL IMPACTS-AT THE AIRPORT AND OFFSITE
EMPLOYMENT PAYROLL (MILLION $)
(A) INCLUDES FIXED BASE OPERATORS, FUEL DISTRIBUTORS, AND CATERERS
AIMAIN.wK4
1,731
1,051 o
231 112
o 132
99 29
52 o
33 o o
69
40 29 o o
1,669
1,282
3,020 $87.8
ISER 09/01/95
The Economic Contribution of the Anchorage International Airport 77
Section III
Economic Importance of the Airport
The Economic Contribution of the Anchorage International Airport 79
11. Measures of Importance
Air Transport Payroll One way to compare the importance of the Anchorage International Airport in relation to airports serving other communities is to compare the proportion of payroll in the community that goes to air transportation activities. Figure ll-l compares the air transportation payroll in Anchorage in 1992 as calculated by the u.s. Department of Commerce-$220 million-to other communities with populations of approximately the same size as Anchorage-200,000 to 300,000. Communities are defined as metropolitan areas which are essentially aggregations of counties that form single economic markets. Of those communities for which information is available, none has a payroll greater than $50 million, and only Reno has a payroll even 10% as large as Anchorage.
A more general comparison is to look at the air transportation payroll divided by the population of the community. Figure 11-2 shows that at $890 the Anchorage air transport payroll per capita is the highest of all reporting communities and about 6 times as great as the national average. The next highest city-Honoluluhas an air transportation payroll of $575 per capita.
The percent of total payroll in the community represented by the air transportation industry is another measure of the importance of air transportation in a community (Figure 11-3). Anchorage again is number one in the nation and the only community where more than 4% of the total payroll goes to air transportation. This compares with Honolulu, second in terms of importance at 3%, and the national average at .88%.
Finally the size of the Anchorage air transportation payroll can be ranked against other communities across the nation. The size of the Anchorage air transportation payroll clearly indicates its importance. Other communities with similar sized payrolls include Kansas City, Orlando, Oakland, San Diego, and Indianapolis-all communities with populations in excess of 1 million compared to Anchorage with a population of about 250,000 (Figure 11-4)
Operations Comparison Anchorage, with a population of 250,000, accounts for about .1 % of the entire U.s. population. If air transportation were as important in Anchorage as the national average, we would expect airport operations to account for about .1 % of the national total. In fact in 1993 Anchorage International Airport (including Lake Hood) accounted for .64% of total operations, .75% of air carrier operations, .89% of air taxi operations, and .47% of general aviation operations based on information from the Federal Aviation Administration(Table ll-I). This means that there were seven times as many air carrier operations, nine times as many air taxi operations, and five times as many general aviation operations in Anchorage compared to the average for the nation as a whole. Even discounting for the fact that a portion of the U.s. population lives in underserved rural areas, the comparison is striking.
Certified Air Carrier Comparison Comparison of air carrier activity in Anchorage with the national average using data from the Federal Aviation Administration indicates the same relative importance of passenger, freight, and mail activity in Anchorage as the operations statistics. Assuming Anchorage to have about .1 % of the U.s. population, passenger enplanements were three times and freight (excluding freight in transit) 48 times the national average in 1993 Table 11-2). Mail was 520 times the national average in 1989, the most recent year that data was available.
80 The Economic Contribution of the Anchorage International Airport
Anchorage Share of Enplanements In 1993 about half of all the air carrier enplanements in Alaska occurred at Anchorage International Airpon (Table 11-3).
Anchorage Share of State Air Transport Jobs Of the 7,500 air transpon jobs statewide (primarily scheduled and non-scheduled carriers) nearly two thirds are located in Anchorage. This pattern has persisted for at least the last decade (Figure 11-5).
Fourth Largest Economy In the State The total number of jobs in the Anchorage economy associated with air transpon, both on-site at the airpon and off-site is 10,900. In 1993 only the cities of Anchorage, Fairbanks, and Juneau had wage and salary employment greater than 10,000. By this measure the air transpon industry based at Anchorage International Airpon would be the fourth largest economy of the state.
If we were to consider the total number of jobs within the boundary of the airport-7,400-the airpon would still rank as the founh largest economy in a tie with Ketchikan.
Importance of Airport Jobs to Anchorage Economy The total number of jobs in the Anchorage economy associated with air transpon, both on-site at the airport and off-site to 10,900. This represents more than 9 percent of all the wage and salary employment in Anchorage in 1993. The total payroll from this activity was $316 million, 8 percent of total payrolls paid. This is the economic activity that the community would lose if all of the air transpon related services at the airpon were relocated outside the city.
Airport Compared to Large Private Employers Federal, state, and local government are the largest employers in Anchorage. The largest private employers in Alaska in 1993 with employment greater than 1,000 according to the Alaska Depanment of Revenue were as follows:
SOURCE: FEDERAL AVIATION ADMINISTRATION. FEDERAL AIR TRAFFIC ACTIVITY, ANNUAL
OATA SOURCE REPORTS LAKE HOOD SEPARATELY FROM THE REST OF ANCHORAGE INTERNATIONAL AIRPORT.
OATA INClUDES lOCAl OPERATIONS FOR AIR TAXIS AND GENERAL AVIATION. A lOCAl OPERATION IS AN ACTIVITY LIKE A FLIGHT SEEING TRIP IN THE ANCHORAGE BOWL OR A PRACTICE lANDING.
AIR CARRIER IS CERTlFIED BY DOT TO CONDUCT SCHEDULED SERVIC AIR TAXI PERFORMS SCHEDULED SERVICE OR CARRIES MAIL GENERAL AVIATION IS AlL OTHER NON·MILITARY OPERATIONS
ANCHORAGE INTERNATIONAL AIRPORT AS A % OF US
TOTAl OPERATIONS 0.84'" AlR CARRIERS 0.75'" AlR TAXI 0.89% GEN AVIATION 0.47% POPULATION 0.10%
FMCOMPWK4 ISER 09.01195
86 The Economic Contribution of the Anchorage International Airport
TAlLEU-2.
AIRPORT ACTIVITY STATISTICS
E ................
DEPARTURES -. ..... PERfORMED ..... """"" ........ --en. ~
note: Anchorage ranks #59 nationally in number of passenger enplanements among 417 eirports. This is .38% of total US enplanements.
FAACOMPWK4 ISER 09/01195
10
FIGURE 11-5. AIR TRANSPORTATION EMPLOYMENT STATE TOTAL AND ANCHORAGE
..... 8 I I +--------l---~
Z W ~ ~ c 6 I I .' >- co o ~ 0: ~ 4 ~ I-
W 2
o I! II! I !! II I! I J II II! I Jill! I
89 90 91 92 93 94
I-.STATEWIDE ~ANCHORAGE I
gg
'i ~ = ~ ;:;.
"" a
~ § a :; ID
~ i I o i. ~ o
AIRJOBS.WK4 l::l 09/01/95 ISER
lbe Economic Contribution of the Anchorage International Airport
Appendix A. Rules Of Thumb: The Employment Impad of Adding Rights
89
Table A-I contains estimates of the average annual employment generated in Anchorage (and for Alaska as a whole for the off-site visitor spending) from the addition of one night per week of various types through the Anchorage International Airport. These "rules of thumb" include both the on-site (at the airport) and off-site employment generated (including the multiplier effect).
They represent averages in two important senses. First, every operation has different characteristics. For example Alaska Airlines and Markair had very different operating philosophies and styles which could manifest themselves in differences in the number of Anchorage employees associated with adding a flight. These "rules of thumb" attempt to represent a typical or average operation.
Second, we assume no excess capacity currently exists among the scheduled carriers, air service providers, and airport operations. Without excess capacity the addition of one more flight per week would require more jobs in all of these areas. In some instances this assumption may not seem reasonable, particularly if we only look at operations over the short run. In fact when asked during interviews how personnel levels would change with the addition of one flight per week, most respondents thought that one additional weekly flight could be handled with no additional staff.
These "rules of thumb" should be interpreted as the way operations would change in the long run, assuming that the additional weekly flight were a permanent addition to operations. In that case it is more likely that additional staff will be required to service the additional activity. Furthermore the "rules of thumb," although defined for a single flight per week, can, as defined, be used to estimate the effect of adding multiple flights per week as well. In this way they are a compromise between precision and ease of application-like any other "rule of thumb."
We consider the following types of flight (in addition to some averages included as a check on the reasonableness of our assumptions):
INTERNATlONAL CARGO WITHOUT SORTING
INTERNATlONAL CARGO WITH SORTlNG
INTERNATlONAL PASSENGER TRANSIT ONLY
INTERNATlONAL PASSENGER DESTlNATlON
DOMESTle PASSENGER DESTlNATlON
In addition for the passenger flights we consider summer only flights and the effects of Anchorage based crews and visitor spending.
The employment impact is broken into three major categories. On-site employment occurs at the airport. Off-site employment occurs within the community and results from crew spending and the multiplier effect of on-site spending. Visitor spending employment arises from the non-transport service related spending of passengers.
Considering a weekly Domestic Passenger Destination flight we can see that there are two categories of scheduled carrier employment-the ground crew, and pOSSibly an Anchorage based flight crew. We assume a crew of three for a cargo flight, nine for a domestic passenger flight (3 in cockpit and 6 in cabin), and 20 for an international passenger flight (three in cockpit and 17 in cabin). (Flight crews do not necessarily reside in the communities where their flights originate so it is possible that a crew could be associated with one flight per week. However since one flight per week might not be sufficient to establish an Anchorage based flight crew
90 The Economic Contribution of the Anchorage International Airport
the detailed breakdown by type of employment allows us to construct other "rules of thumb" for other cases of interest.) Other on-site employment consists of air service provider and, airport operations. Total on-site employment is the sum of scheduled carrier and other.
Off-site spending employment is divided into three categories. The crew of each type of flight that does not have an Anchorage based crew will ovemight in the city-generating spending for food and lodging. For flights with an Anchorage based crew, off-site spending of wages generates jobs in construction, utilities, transportation, trade, and services. Finally the wages and other local vendor payments of the scheduled carriers (excluding crew), air service proViders, and airport operations will generate jobs from the multiplier effect.
The impact of passenger flights will be greatly enhanced if they bring new visitors to Anchorage who would not otherwise visit. We assume the average domestic flight has 100 passengers and the average intemational flight 300 (if the flight only operates during the four summer months the average annual employment impact would be one third the annual "rule of thumb"). Anchorage off-site visitor spending employment represents the jobs in Anchorage in the visitor industry (trade, services, and transportation) generated by visitor spending, as well as jobs in other industries generated by the economic multiplier. Other Alaska off-site visitor spending is similarly interpreted.
Since we were unable to separate Anchorage based flight crew from other employment for the intemational cargo carriers, they are included in the ground crew estimate of 6.3 in the table. Since only some flights have Anchorage based crews, the employment estimate represents an average.
TABLEA·1. I~ RULES OF THUMB =
ANNUAL EMPLOYMENT IMPACT OF ADDING 1 FLIGHT PER WEEK I~ l:r 1"1
WEOGHTED AVEAAGE INT£RHA.TlOtW. HTERHA.1'1OtW. HTERHA.1'1OtW. 1N'TERNA1lOtW. NTetNl<.TlONAl IK1'atN,I,TlOtW. DOMESTIC DOM'ST>C DOMESTIC Ii Ave"", ""'''A11OOW. CAAOO CAAOO PASSEHO<. PASSEHO<R PASSEHO<' PASSEHO<. PASSEHO<R PASSEHO<R PASSEHO<. Of All. CAAGO WITHOUT W!1H TI<ANSrr DES""''''''' DE ...... """ DE ..... "'" ",""",noN ~"'" DE ...... "'"
_"",ED ro.""" "'"""" ONlY SUMMER """"""" SUMMEft """"""'" .......... .... Y ""'" COEW OII.Y iSASfOCIIEW
The Economic Contribution of the Anchorage International Airport
Appendix B. Rules Of Thumb: The Employment and Payroll Impacts of New Sales
93
In this appendix we present a series of tables of output from the Alaska Input Output model which show both aggregate economic impacts and "rules of thumb" for the different activities at the Anchorage International Airport broken down by type of employer. This is a more detailed version of the information summarized in Table 2-2 in the main body of the report.
There is one output table for each of the following employer categories:
SCHEDULED AIR CARRIER
GOVERNMENT TENANT: NOT AVIATION RELATED
AIR TAXIS AND CHARTERS
AIR SERVICE PROVIDERS
GOVERNMENT TENANTS: AVIATION RELATED
STATE GOVERNMENT: AIRPORT OPERATIONS
FEDERAL GOVERNMENT: AIRPORT OPERATIONS
PASSENGER SERVICE PROVIDERS: CONCESSIONS
FREIGHT FORWARDERS
CAR RENTAL AGENTS
CONSTRUCTION OF AIRPORT FACILITIES
PRIVATE BASIC INDUSTRY
OTHER
In addition to these categories of employers located at the airport we have included tables for three off-site activities as follows:
CREW IN TRANSIT
ANCHORAGE VISITORs---NON-ALASKA REsIDENT
ANCHORAGE VISITORs---ALASKAN REsIDENT
Each table summarizes the total economic effect in Anchorage associated with one particular type of employment associated with the airport. For example the first table shows at the top in the section entitled Total Effect that 6,407 annual average jobs, $184 million of payroll, and $709 million in sales (output) in the community are attributable to scheduled air carrier activities. This is based upon the application of the economic multiplier to the employment of 3,656 shown under the Direct Effect section. This is apprOXimately the number of jobs at the airport in the scheduled air carrier category.
The Indirectllnduced effect represents the jobs resulting both from procurement and payroll spending by workers in this industry. As such it is the multiplier effect.
Two types of multiplier are included in each table. The first shows the ratio of total to direct activity. The multiplier of 1. 75 for employment means 1. 75 total jobs are created in the community for each scheduled air carrier job created. The second type shows the total employment per million dollars of sales. In this case the "bang per buck" is 14.22.
94 The Economic Contribution of the Anchorage International Airport
ANCHORAGE INTERNATIONAL AIRPORT ECONOMIC CONTRIBUTION
SCHEDULED AIR CARRIER
TOTAL EFFECT
OUTPUT EMPLOYEE COMPENSATION
EMPLOYMENT
DIRECT EFFECT
FINAL DEMAND EMPLOYEE COMPENSATION
EMPLOYMENT
INDIRECT/INDUCED EFFECT
OUTPUT EMPLOYEE COMPENSATION
EMPLOYMENT
DIRECT EFFECT MULTIPLIERS (SEA DEF.)
OUTPUT EMPLOYEE COMPENSATION
EMPLOYMENT
FINAL DEMAND MULTIPLIERS (SEA DEF.)
OUTPUT EMPLOYEE COMPENSATION
EMPLOYMENT
Direct Effect Multipliors are total effect divided by direct effect.
$708,727,385 $184,302,262
6.407
$450,582,600 $115,783,605
3,656
$258,144,785 $68,518,657
2.751
1.57 1.59
1.75
$1.57 $0.41
14.22
Final Demand MlJUiphors represent the total dollm or employment change for each additional dollar of output delivered to fmal demand.
ISER OUTPUT3.WK4 06101195
The Economic Contribution of the Anchorage International Airport
ANCHORAGE INTERNATIONAL AIRPORT ECONOMIC CONTRIBUTION
GOVT TENANTS: NOT AVIATION RELATED
TOTAL EFFECT
OUTPUT EMPLOYEE COMPENSATION
EMPLOYMENT
DIRECT EFFECT
FINAL DEMAND EMPLOYEE COMPENSATION
EMPLOYMENT
INDIRECTIINDUCED EFFECT
OUTPUT EMPLOYEE COMPENSATION
EMPLOYMENT
DIRECT EFFECT MULTIPLIERS (BEA DEF.)
OUTPUT EMPLOYEE COMPENSATION
EMPLOYMENT
FINAL DEMAND MULTIPLIERS (BEA DEF.)
OUTPUT EMPLOYEE COMPENSATION
EMPLOYMENT
---_._-._--Direct Effect Multipliers are tolal effect divided by direct effect.
$148.497.493 $44.326.484
1.359
$69.625.000 $24.874.335
719
$78.872.493 $19.452.148
640
2.13 1.78
1.89
$2.13 $0.64
19.52
Final Demand Multipliers represenllhe total dollar or employment change for each additional dollar of output delivered to final demand
95
ISER OUTPUT3.wK4 06101195
96 The Economic Contribution of the Anchorage International Airport
ANCHORAGE INTERNATIONAL AIRPORT ECONOMIC CONTRIBUTION
AIR TAXIS & CHARTERS
TOTAL EFFECT
OUTPUT EMPLOYEE COMPENSATION
EMPLOYMENT
DIRECT EFFECT
FINAL DEMAND EMPLOYEE COMPENSATION
EMPLOYMENT
INDIRECT/INDUCED EFFECT
OUTPUT EMPLOYEE COMPENSATION
EMPLOYMENT
DIRECT EFFECT MULTIPLIERS (SEA DEF.)
OUTPUT EMPLOYEE COMPENSATION
EMPLOYMENT
FINAL DEMAND MULTIPLIERS (SEA DEF)
OUTPUT EMPLOYEE COMPENSATION
EMPLOYMENT
Direct Effect Multipliers are total etlee! divided by direct effect.
$119.881.164 $31.174.708
1.084
$76.216.000 $19.584.785
618
$43.665.164 $11.589.924
465
1.57 1.59
1.75
$1.57 $0.41
14.22
Final Demand Multipliers represent the total doliM or employment change for each additional dollar of output delivered to final demand
ISER OUTPUT3.wK4 06101195
The Economic Contribution of the Anchorage International Airport
ANCHORAGE INTERNATIONAL AIRPORT ECONOMIC CONTRIBUTION
AIR SERVICE PROVIDERS
TOTAL EFFECT
OUTPUT EMPLOYEE COMPENSATION
EMPLOYMENT
DIRECT EFFECT
FINAL DEMAND EMPLOYEE COMPENSATION
EMPLOYMENT
INDIRECT/INDUCED EFFECT
OUTPUT EMPLOYEE COMPENSATION
EMPLOYMENT
DIRECT EFFECT MULTIPLIERS (SEA DEF.)
OUTPUT EMPLOYEE COMPENSA nON
EMPLOYMENT
FINAL DEMAND MULTIPLIERS (SEA DEF.)
OUTPUT EMPLOYEE COMPENSATION
EMPLOYMENT
Direct Effect Multipliers are total effect divided by direct effect.
$81.805.344 $25,444.089
954
$51.881.600 $16.728.568
600
$29.923.744 $8.715.521
354
1.58 1.52
1.59
$1.58 $0.49
18.40
Final Demand Multipliers represent the lotal dollar or employment change for each additional dollar of output delivered to final demand.
97
ISER OUTPUT3.WK4 06/01/95
98 The Economic Contribution of the Anchorage International Airport
ANCHORAGE INTERNATIONAL AIRPORT ECONO~IC CONTRIBUTION
GOVT TENANTS: DIRECT AVIATION USER
TOTAL EFFECT
OUTPUT EMPLOYEE COMPENSATION
EMPLOYMENT
DIRECT EFFECT
FINAL DEMAND EMPLOYEE COMPENSATION
EMPLOYMENT
INDIRECTIINDUCED EFFECT
OUTPUT EMPLOYEE COMPENSATION
EMPLOYMENT
DIRECT EFFECT MULTIPLIERS (SEA DEFI
OUTPUT EMPLOYEE COMPENSATION
EMPLOYMENT
FINAL DEMAND MULTIPLIERS (SEA DEFI
OUTPUT EMPLOYEE COMPENSATION
EMPLOYMENT
Direct Effect Multipliers eHe 101<'11 effect divided by direct effect.
$67.025.526 $22.021.473
709
$43.286.000 $15.464.423
456
$23.739.526 $6.557.049
253
1.55 1.42
1.55
$1.55 $0.51
16.37
Final Demand Multipliers represent the total dollar or employment change lor each additional dollar of output delivered to final demand.
ISER OUTPUT3WK4 06103195
The Economic Contribution of the Anchorage International Airport
ANCHORAGE INTERNATIONAL AIRPORT ECONOMIC COI'HRIBUTION
STATE GOVT··AIRPORT OPERATION
TOTAL EFFECT
OUTPUT EMPLOYEE COMPENSATION
EMPLOYMENT
DIRECT EFFECT
FINAL DEMAND EMPLOYEE COMPENSATION
EMPLOYMENT
INDIRECTIINDUCED EFFECT
OUTPUT EMPLOYEE COMPENSATION
EMPLOYMENT
DIRECT EFFECT MULTIPLIERS (SEA DEFI
OUTPUT EMPLOYEE COMPENSATION
EMPLOYMENT
FINAL DEMAND MULTIPLIERS IBEA DEF.I
OUTPUT EMPLOYEE COMPENSATION
EMPLOYMENT
Direct Effect Multipliers are total effect divided by direct effect.
$70.756.256 $21.120.734
647
$33.175.000 $11.852.152
343
$37.581.256 $9.268.582
305
2.13 1.78
1.89
$2.13 $0.64
19.52
Final Demand Multipliers represent the lotal dollar or employment change for eaCh ndditional dollar of output delivered to final demand
99
ISER OUTPUT3,WK4 0£101l95
100 The Economic Contribution of the Anchorage International Airport
ANCHORAGE INTERNATIONAL AIRPORT ECONOMIC CONTRIBUTION
FEDERAL GOVT--AIRPORT OPERATION
TOTAL EFFECT
OUTPUT EMPLOYEE COMPENSATION
EMPLOYMENT
DIRECT EFFECT
FINAL DEMAND EMPLOYEE COMPENSATION
EMPLOYMENT
INDIRECTIINDUCED EFFECT
OUTPUT EMPLOYEE COMPENSATION
EMPLOYMENT
DIRECT EFFECT MULTIPLIERS ISEA DEF,)
OUTPUT EMPLOYEE COMPENSATION
EMPLOYMENT
FINAL DEMAND MULTIPLIERS (SEA DEF.)
OUTPUT EMPLOYEE COMPENSATION
EMPLOYMENT
----------_ ..• __ .. Direct Effect Multipliers are tolal effect divided by direct effect.
$67.450,387 $20,133,932
617
$31,625,000 $11,298,397
327
$35,825,387 $8,835,536
291
2.13 1.78
1,89
$2.13 $0.64
19.52
Final Demand Multipliers represent the tots I dollc:tr or employment change for each additional dollar of output delivered to final dem<md
ISER OUTPUT3.wK4 00/01/95
The Economic Contribution of the Anchorage International Airport
ANCHORAGE INTERNATIONAL AIRPORT ECONOMIC CONTRIBUTION
PASSENGER SERVICE PROVIDERS: CONCESSIONS
TOTAL EFFECT
OUTPUT EMPLOYEE COMPENSATION
EMPLOYMENT
DIRECT EFFECT
FINAL DEMAND EMPLOYEE COMPENSATION
EMPLOYMENT
INDIRECT/INDUCED EFFECT
OUTPUT EMPLOYEE COMPENSATION
EMPLOYMENT
DIRECT EFFECT MULTIPLIERS (SEA DEF.)
OUTPUT EMPLOYEE COMPENSATION
EMPLOYMENT
FINAL DEMAND MULTIPLIERS (SEA DEF)
OUTPUT EMPLOYEE COMPENSATION
EMPLOYMENT
Direct Effect Multipliers are tolal effect divided by direct effect.
$14.558,140 $4,756,269
255
$9.477,000 S3,346,818
198
S5,081,140 S1.409.451
57
1.54 1.42
1.29
S1.54 SO.50
26.86
Final Demand Multipliers represent the total dollar or employment change for each additional dollar of output delivered to final dem<md.
101
ISER OUTPUT3,WK4 06101/95
102 The Economic Contribution of the Anchorage International Airport
ANCHORAGE INTERNATIONAL AIRPORT ECONOMIC CONTRIBUTION
FREIGHT FORWARDERS
TOTAL EFFECT
OUTPUT EMPLOYEE COMPENSATION
EMPLOYMENT
DIRECT EFFECT
FINAL DEMAND EMPLOYEE COMPENSA nON
EMPLOYMENT
INDIRECT/INDUCED EFFECT
OUTPUT EMPLOYEE COMPENSATION
EMPLOYMENT
DIRECT EFFECT MULTIPLIERS (BEA DEF.)
OUTPUT EMPLOYEE COMPENSATION
EMPLOYMENT
FINAL DEMAND MULTIPLIERS (BE A DEF)
OUTPUT EMPLOYEE COMPENSATION
EMPLOYMENT
Direct Effect Multipliers are lolal effect divided by direct effect.
$26.111.645 $7.101.546
303
$15.909.000 $4.088.044
181
$10.202.645 $3.013.502
121
1.64 1. 74
1.67
$1.64 $0.45
19.03
Fioal Demand Multipliers represenllhe lolal dollar or employment change for each additional dollar of output delivered to final demand.
ISER OUTPUT3.wK4 06101195
The Economic Contribution of the Anchorage International Airport
ANCHORAGE INTERNATIONAL AIRPORT ECONOMIC CONTRIBUTION
CAR RENTAL AGENTS
TOTAL EFFECT
OUTPUT EMPLOYEE COMPENSATION
EMPLOYMENT
DIRECT EFFECT
FINAL DEMAND EMPLOYEE COMPENSATION
EMPLOYMENT
INDIRECTIINDUCED EFFECT
OUTPUT EMPLOYEE COMPENSATION
EMPLOYMENT
DIRECT EFFECT MULTIPLIERS (BEA DEF)
OUTPUT EMPLOYEE COMPENSATION
EMPLOYMENT
FINAL DEMAND MULTIPLIERS (BEA DEF)
OUTPUT EMPLOYEE COMPENSATION
EMPLOYMENT
Direct Effect Multipliers are lotal effect dIvIded by dIrect effect
$16.330.241 $4.441.312
189
$9.949.500 $2.556.665
113
$6.380.741 $1.884.647
76
1.64 1.74
1.67
$1.64 $0.45
19.03
Final Demand Multipliers represent the tOtal doliM or employment change for each additional dollar of output delivered to final demand.
103
ISER OUTPUT3.wK4 06101195
104 Tbe Economic Contribution of the Anchorage International Airport
ANCHORAGE INTERNATIONAL AIRPORT ECONOMIC CONTRIBUTION
CONSTRUCTION
TOTAL EFFECT
OUTPUT EMPLOYEE COMPENSATION
EMPLOYMENT
DIRECT EFFECT
FINAL DEMAND EMPLOYEE COMPENSATION
EMPLOYMENT
INDIRECT/INDUCED EFFECT
OUTPUT EMPLOYEE COMPENSATION
EMPLOYMENT
DIRECT EFFECT MULTIPLIERS (SEA DEF)
OUTPUT EMPLOYEE COMPENSATION
EMPLOYMENT
FINAL DEMAND MULTIPLIERS (SEA DEF)
OUTPUT EMPLOYEE COMPENSATION
EMPLOYMENT
$21.064.170 $5.671.189
166
$15.000.000 $3.812.936
91
$6.064,170 $1,858,252
75
1.40 1.49
1.83
$1.40 $0.38
11.04
._ .. _----------_._------Direct Effect MuUipliers eHe total effect divided by direct effect.
Final Demcmd Multipliers represent the lotal dollar or employment cht'mge for each additional dollar of output delivered to final demand.
ISER OUTPUT3.wK4 06101/95
The Economic Contribution of the Anchorage International Airport
ANCHORAGE INTERNATIONAL AIRPORT ECONOMIC CONTRIBUTION
PRIVATE BASIC INDUSTRY
TOTAL EFFECT
OUTPUT EMPLOYEE COMPENSATION
EMPLOYMENT
DIRECT EFFECT
FINAL DEMAND EMPLOYEE COMPENSATION
EMPLOYMENT
INDIRECT/INDUCED EFFECT
OUTPUT EMPLOYEE COMPENSATION
EMPLOYMENT
DIRECT EFFECT MUL TlPLIERS (SEA DEF.)
OUTPUT EMPLOYEE COMPENSATION
EMPLOYMENT
FINAL DEMAND MULTIPLIERS (SEA DEF)
OUTPUT EMPLOYEE COMPENSATION
EMPLOYMENT
$4.887.421 $859.812
36
$3.844.000 $562.278
24
$1.043.421 $297.534
12
1.27 1.53
1.48
$1.27 $0.22
9.42
._-----------------Direct Effect Multipliers are total effect divided by direcl effect.
Final Demand Multipliers represent the total dollar or employment change lor each additional dollar of output delivered to final demand.
105
ISER OUTPUT3.wK4 06101195
106 The Economic Contribution of the Anchorage International Airport
ANCHORAGE INTERNATIONAL AIRPORT ECONOMIC CONTRIBUTION
OTHER
TOTAL EFFECT
OUTPUT EMPLOYEE COMPENSATION
EMPLOYMENT
DIRECT EFFECT
FINAL DEMAND EMPLOYEE COMPENSATiON
EMPLOYMENT
INDIRECTIINDUCED EFFECT
OUTPUT EMPLOYEE COMPENSATION
EMPLOYMENT
DIRECT EFFECT MULTIPLIERS (BEA DEF)
OUTPUT EMPLOYEE COMPENSATION
EMPLOYMENT
FINAL DEMAND MULTIPLIERS (BEA DEF)
OUTPUT EMPLOYEE COMPENSATION
EMPLOYMENT
Direct Effect Multipliers <He total elteel diVIded by direct effect.
$3.208,784 $1.399.382
56
$1.960.000 $1.014.141
40
$1.248.784 $385.240
16
1.64 1.38
1.40
$1.64 $0.71
28.60
Final Demand Multipliers represent the total dol18r or employment chClnge for each additional dollar of output delivered to final demand
ISER OUTPUT3.wK4 06101/95
lbe Economic Contribution of the Anchorage International Airport
ANCHORAGE INTERNATIONAL AIRPORT ECONOMIC CONTRIBUTION
CREW
TOTAL EFFECT
OUTPUT EMPLOYEE COMPENSATION
EMPLOYMENT
DIRECT EFFECT
FINAL DEMAND EMPLOYEE COMPENSATION
EMPLOYMENT
INDIRECTIINDUCED EFFECT
OUTPUT EMPLOYEE COMPENSATION
EMPLOYMENT
DIRECT EFFECT MULTIPLIERS (BEA DEF.)
OUTPUT EMPLOYEE COMPENSATION
EMPLOYMENT
FINAL DEMAND MULTIPLIERS (BEA DEF)
$16.811.650 $4.897.967
238
$10.950.000 $3.279.233
175
$5.861.650 $1.618.734
64
1.54 1.49
1.36
OUTPUT $1.54 EMPLOYEE COMPENSATION $0.45
EMPLOYMENT 21. 77
-_ .. _ .. -_ .. _-_._---_.- ---._-_.
Direct Eflect Multipliers are total effect divided by direct effect.
Final Demand Multipliers represent the total dollar Of employment change for each additional dollar of output delivered to final demand.
107
ISER OUTPUT3,WK4 06/01/95
108 Tbe Economic Contribution of the Anchorage International Airport
ANCHORAGE INTERNATIONAL AIRPORT ECONOMIC CONTRIBUTION
ANCH VISITORS--NON-ALASKAN RESIDENT
TOTAL EFFECT
OUTPUT EMPLOYEE COMPENSATION
EMPLOYMENT
DIRECT EFFECT
FINAL DEMAND EMPLOYEE COMPENSA nON
EMPLOYMENT
INDIRECT/INDUCED EFFECT
OUTPUT EMPLOYEE COMPENSATION
EMPLOYMENT
DIRECT EFFECT MULTIPLIERS (SEA DEF)
OUTPUT EMPLOYEE COMPENSATION
EMPLOYMENT
FINAL DEMAND MUL TIPLIERS (SEA DEF)
OUTPUT EMPLOYEE COMPENSATION
EMPLOYMENT
---_.---_ •. ' Direct Effoct Multipliers are total effect divided by direct effect
$171.232.862 $53.540.073
2.682
$109.733.250 $36.596.083
2.010
$61.499.612 $16.943.991
673
1.56 1.46
1.33
$1.56 $0.49
24.45
Final Demand Multipliers represent the tOlal doliM or employ mont change for each additional dollar of output delivered to final demand
ISER OUTPUT3,WK4 06101/95
TIle Economic Contribution of the Anchorage International Airport
ANCHORAGE INTERNATIONAL AIRPORT ECONOMIC CONTRIBUTION
ANCH VISITORS--ALASKAN RESIDENT
TOTAL EFFECT
OUTPUT EMPLOYEE COMPENSATION
EMPLOYMENT
DIRECT EFFECT
FINAL DEMAND EMPLOYEE COMPENSATION
EMPLOYMENT
INDIRECTIINDUCED EFFECT
OUTPUT EMPLOYEE COMPENSATION
EMPLOYMENT
DIRECT EFFECT MULTIPLIERS (BEA DEF)
OUTPUT EMPLOYEE COMPENSATION
EMPLOYMENT
FINAL DEMAND MULTIPLIERS (BEA DEF )
OUTPUT EMPLOYEE COMPENSATION
EMPLOYMENT
$162.311.399 $50.750.564
2.543
$104.016.000 $34.689.378
1.905
$58.295.399 $16.061.186
638
1.56 1.46
1.33
$1.56 $0.49
24.45
---------------- -----.- ---.---------- . __ ._-------Direct Effect Multipliers are lolal effect divided by direct effect.
Final Demand Multipliers represent the 101<'11 doUar Of employment change for each additional dollar of output delivered to final demand.
109
ISER OUTPUT3.WK4 06101195
The Economic Contribution of the Anchorage International Airport
Appendix C. calculating the Residence of Scheduled carrier Passengers
111
This appendix contains the calculations for determining the proportion of passengers using Anchorage International Airport who are Anchorage residents, Alaska residents outside Anchorage, and non-Alaskans. This information is used to allocate scheduled air carrier and other employment at the airport among these three types of clients served.
Table C-l allocates total enplanements on scheduled air carriers reported at the airport in 1994 (1,935,000) among Anchorage residents, Other Alaskans, and Non-Residents. Anchorage residents could be traveling intrastate or outside Alaska. Other Alaskan residents could be returning home from a trip to Anchorage, Anchorage could be an intermediate stop on an intrastate trip, or Anchorage could be an intermediate stop on a trip outside the state. (The intrastate part of their trip could be by some mode other than air.) Non-residents could be enplaning to return home outside the state, or they could be enplaning to visit some other part of Alaska by air.
In developing the estimates of 660,000, 655,000, and 620,000 respectively we also estimate the number of enplanements within each group identified above. This also provides an estimate of the total enplanements for destinations within and Outside the state. These estimates are important since information on the distribution of passengers by residence and destination is sparse.
The following two tables contain data from the Alaska Visitor Statistics Program and calculations using that data to estimate the number of Non-Alaska resident enplanements at Anchorage International Airport. This forms the basis for the estimate of non-Alaska resident visitors in Table C-1. The shares of all visitor arrivals that are by air and all air arrivals in the state that are through Anchorage are calculated in Table C-3 from the data in Table C-2. Of 611 ,000 domestic visitor air arrivals into Alaska we estimate 78% are through Anchorage. Of 17,000 international air arrivals we estimate all are through Anchorage. This results in an estimate of annual non-resident air arrivals (and depanures) through Anchorage of 491,000 which we round to 500,000.
The total number of different visitors who pass through the airpon (not including passengers in transit) is a higher figure-an estimated 552,000--since some visitors use the airpon only in one direction of their itinerary.
Data on expenditures per non-Alaska resident visitor is taken from the Alaska Visitor Statistics Program of the Alaska Depanment of Commerce and data on expenditures per non-Anchorage Alaska resident visitors is taken from the Anchorage Convention and Visitors Bureau In-state Visitor Study (1993).
112
AVSP94.WK4
The Economic Contribution of the Anchorage International Airport
TABLE C-l.
ANCHORAGE INTERNATIONAL AIRPORT RESIDENCE OF ENPLANING PASSENGERS
Total Enplanements
Visitors to Anchorage
Alaska Residents Traveling Outside Alaska
Intrastate Travelers Throug Anchorage
Traveling Outside Alaska Traveling Within Alaska
SUM
1,935
650
575
510
1,075 660
(thousand)
Anchorage Residents
660
xxxx
410
250
410 250
Total Enplanements from airport statistical reports.
Alaskan Residents
Outside Anchorage
655
350
165
140
165 490
Share of enplanements to Outside locations from US DOT.
Non-Alaska
Residents
620
500
XXXXX
120
500 120
Non-Alaska Residents travel Is based on analysis of Alaska Visitor Statistics Program (See Tables 0-2 and 0-3)
Alaska Residents Outside Anchorage
Traveling From Home based on Anchorage Visitor Center survey of Visitors
Traveling to Other Alaska Destinations (arriving and departing through Anchorage based on CIC study
Travel Outside
sources:
based on Anchorage Visitor Center survey
Anchorage International Airport Passenger Market Research Study CIC Research, Inc. August 1992.
Anchorage Instate Visitor Study Anchorage Convention and Visitor Bureau, Fall 1993.
Alaska Visitor Anivals, from Alaska Visitor Statistics Program McDowell and AsSOciates, Summer 1993 and FalllWinter 1994.
ISER 10/03/95
The Economic Contribution of the Anchorage International Airport
The Economic Contribution of the Anchorage International Airport
TABLEC-3.
ANCHORAGE AIR ARRIVALS BY VISITORS & TOTAL VISITORS USING AIRPORT
610.700 77.6%
473.624 16.662
490.706
167.126 77.6%
129.666 3.618
133.266
443.642 77.6%
344.209 13.264
357.473
418.648
133.286
551.934
ROUND ONE TRIP WAY AIR AIR
TOTAL DOMESTIC AIR VISITOR ARRIVALS ANCHORAGE SHARE OF TOTAL DOMESTIC AIR ARRIVALS ANCHORAGE DOMESTIC AIR ARRIVALS BY VISITORS INTERNATIONAL AIR ARRIVALS BY VISITORS TOTAL ANCHORAGE AIR ARRIVALS BY VISITORS
TOTAL DOMESTIC AIR VISITOR ARRIVALS ANCHORAGE SHARE OF TOTAL DOMESTIC AIR ARRIVALS ANCHORAGE DOMESTIC AIR ARRIVALS BY VISITORS INTERNATIONAL AIR ARRIVALS BY VISITORS TOTAL ANCHORAGE AIR ARRIVALS BY VISITORS
TOTAL DOMESTIC AIR VISITOR ARRIVALS ANCHORAGE SHARE OF TOTAL DOMESTIC AIR ARRIVALS
285.598 117.222 ANCHORAGE DOMESTIC AIR VISITOR ARRIVALS 10.700 5.128 INTERNATIONAL AIR VISITOR ARRIVALS
TOTAL ANCHORAGE AIR VISITOR ARRIVALS
296.298 122.350 TOTAL SUMMER VISITORS USING AIRPORT EITHER ROUND TRIP OR ONE WAY
TOTAL WINTER ANCHORAGE AIR VISITORS
TOTAL VISITORS USING AIRPORT EITHE ROUND TRIP OR ONE WAY
SOURCE: BASED ON DATA FROM TABLE C-2.
AVSP94.wK4 ISER 09/01/95
The Economic Contribution of the Anchorage International Airport 115
Appendix D. General Aviation calculations There are approximately 1,040 general aviation aircraft based at Anchorage International Airpon. Total spending associated with tie down, fuel, maintenance, taxes, and insurance of these aircraft is conserva-tively estimated to be about $8 million annually-more than $7,000 per plane. The largest components of cost are fuel, maintenance, and insurance. The figure varies conSiderably by type of aircraft.
This spending suppons Jobs both at the airport and off-site. On-site jobs include portions of airport operations (state and federal employees) as well as private maintenance and repair jobs. Off-site multiplier effects of this spending support additional jobs primarily in trade and service sectors of the economy
These jobs are included in the analyses of the aggregate airport impact. The impact is divided between the two instate user groups-Anchorage residents (Chapter to) and Alaskans outside Anchorage (Chapter 8). Tlme and budget considerations precluded a more detailed analysis general aviation operations. For example, this spending figure does not include spending either at the airport or off-site in the community by transients-non-residents arriving by general aviation aircraft [rom outside the state either for business or pleasure.
The estimate of annual spending proVides a lower bound estimate of the economic value users place on general aviation (independent of where the aircraft are based). This value accrues to private citizens and businesses. For private citizens it is an estimate of the monetary value of the enjoyment they get from using their planes. For businesses it is an estimate of the savings they experience from the convenience of having access to air transportation rather than having to rely on other forms of transponation.
The calculations to derive these estimates are presented in the attached table. The data comes from a variety of public sources and interviews with knowledgeable individuals.
Number of Planes. Hours, and Operations
Number of PlanM A_ hcx.n IIc7M1 per plano per year T etal number 01 hcx.n annually
Expenditures r .. down coots
number of wheel tie __ number of IIoaI tie __
number of private tie downs monthly wheel tie down lee montly float tie down lee monthly private tie down lee total expenditures for tie downs
Fuel coots A_ luel used per hour of operation T etalfuel used Average price per gallon 01 fuel T etal coat 01 luel
Maintenance, including parts and labor Average annual maintenance cost of small piane Average annual maintenance cost of medium plane Number of smaU airptanes (similar to Cessna 1 n) Number 01 medium airplanes (aimilar 10 Cessna 180) Total Maintenance Expenditures
PropertyTaxea Average annual property tax lor single engine plane Average annual property tax for multi engine plane Number 01 single engine planes Number of mutti-engine planes T etal property tax expend~ur ..
Insurance costs average Insurance payment per plane per year percent of planes insured total number of planes _
totallnaurance payments annually
Total expenditur .. A-* .,..,;,...mur ...... oIane
TAXI.WK4
TABLE 0-1. GENERAL AVIATION CALCULATIONS
low estimate -_. high estimate Notes and Sources
1,020 1,040 1,060 Dertved from AlA leasing, and estimatea from IndMduala 50 100 150 estimate
51,000 104,000 159,000 = planes • ayg hounIlIown
421 421 421 From AlA leasing Department 320 320 320 From AlA leasing Department 279 299 319 Derived from estimates from AlA leasing, PJr Tax! operators, and AK Airmen $60 $60 $60 From AlA leasing OepIIrtment $70 $70 $70 From AlA leasing Department
$100 $100 $100 Estimated lrom private GA pilots who purchaoe tie down. $906,720 $930,720 $954,720 = number of tie dO'MlS times annual tie down C08t
12 12 12 Estiamted fuel usage for an average general aviation aircraft 612,000 1,248,000 1,908,000 = luel per hour • hours of operation
$2.10 $2.18 $2.25 'rom fuel distributors $1,285,200 $2,714,400 $4,293,000 = cost per gallon· fuel used
$700 $1,750 $2,800 Est. Maintenance Coats per year Including parts and tabor from AvAiaaka $1,000 $2,500 $4,000 Est. Maintenance Costs per year including parts and labor from AvAiaaka
612 624 636 Estimate 60% are sman planes 408 416 424 Estimate 40% are medium pIanee
$836,400 $2,132,000 $3,476,800 Number of planes· average annual maintenance coat.
$75 $75 $75 Municipality 01 Anchorage, Revenue Department $125 $125 $125 Municipality 01 Anc~, R ........ Department
918 936 954 Estimate thai 90% of GA planes are single engine 102 104 106 Estimate thatlQ% 01 GA planes ..... multi-englne
$81,600 $83,200 $84,600 Number of planes· property tax per plane per year
$1,000 $2,000 $5,000 estimates from insurance companies and private pilots 75% 80% 95% estimate of fraction of pIanee that have Inaurance 765 832 1,007 number of planes stationed .t: airport • percent Insured
$765,000 $1,664,000 $5,035,000 = number of planes insured· insurance costa
$3,874,920 $7,524,320 $13,844,320 Sum of all com""'j ~ of coots f oIar $3,799 $7235 $13,061 T alai costs divided number of net;
ISER 09101/95
... ... en
:if tD
i ~.
SO ::I s. g-cr. g a Sf tD
~ ;.
~ ! ~ g !lie i ;:s.
The Economic Contribution of the Anchorage International Airport 117
Appendix E. Air Taxi Calculations There are approximately 35 air taxi operators based at Anchorage International Airport. Total spending associated with tie down, fuel, maintenance, rent, taxes, insurance, other fees, and wages of these operations is conservatively estimated to be abour $13 million annually. The largest components of cost are wages, fuel, maintenance, and insurance. The figure varies considerably by type of aircraft. These figures do not include the large firms such as ERA Helicopter which are primarily serving business clients.
This spending supports jobs both at the airport and off-site. On-site jobs include employment by the air taxis, portions of airport operations (state and federal employees), and private maintenance and repair jobs. Off-site multiplier effects of this spending support additional jobs primarily in the trade and service sectors of the economy.
Air taxi operations are supported by both resident and non-resident business and non-business clients. We estimate that 80% to 90% of expenditures for air taxi services are from non-residents. The air taxi spending estimate does not include other off-site spending of these non-residents while in Anchorage.
This estimate of annual spending provides a lower bound estimate of the economic value users place on air taxi operations (independent of where the aircraft are based). This value accrues to private citizens and businesses. For private citizens it is an estimate of the monetary value of the enjoyment they get from using these services. For businesses it is an estimate of the savings they experience from the convenience of having access to air transportation rather than having to rely on other forms of transportation.
The calculations to derive these estimates are presented in the attached table. The data comes from a variety of public sources and interviews with knowledgeable individuals.
OpIfations Number d Ai Taxi 0perat0f5
-~-A_ hours _ed po< plane po< year
Total numbet' d hout1 amually
Revenues Average rate per hot.- c:I openttion Rewnues from hot.w1y rate chafge5 Reyenues from other sources T otaf revenues
Percent d R~ues from ..siting non-resident tourists Rewnues from ~ng norHesident touri!tS
Expenditures T .. .-,.
Number d Commercial wheel tie downs Number d ComrnereiaI noat tie downs Total tie doNn ~itures.
Fuel cools Average fuel used per hour ct operation Total fuel used A_ price po< gallon ~ fuel T otai cost d fuel
Maintenance, Including parts and labor Number d medium planes
--~Ia<ge-Maintenance C05t per plane per year b medium planes Maintenance cost per plane per year for large planes Total Maintenance ea.ts per year
Rent Total square feet dland leases for air taxi$ Average rate per square foot of land leaseS Total rent on land leases
Property Tax Annual property tax for II single engine plane AnnuaJ Property tax for a JnUIj engine plane Number ~ oingIe engne _ Number cI mutt! engine planes Total property tax expenditures
Insurance Average insurance payment per plane per year Total number cI plane$ insured Total insufance payments amually
Other fees and costs net included efsewhere Pefcent d Gross Revenues Total fees and other costs
Wages, Salaries. and Profit. Total earnings of CJYrI'Oef'S and empIo'fees {~ing maintenaflOli
T atat Expenc:fitures
TAXtWK4
TABLE E-1. AIR TAXI CALCULATIONS
looN estimate best estimate h" h estimate Notes and Sourcea
30 35 40 Derived from Lease lists and addres&eS at AJrport 110 120 130 Derived from AlA iea6tng and estimates from IndMdual1OUl'CeS 300 <100 450 Estimate from air Wei opetatcn: <400 hOurI per yell( Is breakeYen point
33,000 ",000 58,500 = number of planes • ~ number d hour61\Own
$200 $300 $350 Estimate from air taxi operm.ora $6,600,000 $14,400,000 $20,475,000 = hour1y rate times hours for oootracted operations
3" 5" 10" percent markup over revenues generated by hourty rates $6,798,000 $15,120,000 $22,522.500 = revenues from hourty rates plus other revenues
80" 85" 90" Rough estimate from air taxi operators $5,438,~ $12.852,000 $20,270,250 percent of revenues from non-residenta • total revenues
n n 77 Dertved from AlA /easing ,nd estimates from indMdual& 44 44 44 Derived from AlA Jeasing and estimates from indrAduals
$121,080 $121,080 $121,080 Total of ftoat and wheel tie down expenditures
15 17 20 estimate from air taxi operators 495,000 816,000 1,170,000 = fuel per hour • hours d operation
$2.00 $2.00 $2.00 range d fuel cost from fuel di&tri~or& and fuel purchasers $900,000 $1,632,000 $2.340,000 = cost per gallon .. fuel used
88 96 104 54 % r:i all piston tYoO engine planes in Alaska are 1-6 seats 22 24 26 46% d all piston two engine planes in Alaska are 7 or more seats
$4,000 $4,500 $5,000 Estimate from A ... AIaska b. CeRna 206 $12,000 $16,000 $20,000 Estimate from A ... AIaska for. Beaver
$616,000 $816,000 $1,040,000 = hours of maintenance· co&t per hour • number d planet
1,776,788 1,776,788 1,776,788 From AlA leasing SO.06 $0.06 $0.06 From AlA leasing
$106,607 $106,607 $106,607 =avg rate per foot -square footage
$75 $75 $75 Municipality d Anchorage Revenue Department $125 $125 $125 Municipality r::J Anchorage Revenue Oepartmerd:
10 20 30 Estimate d number d large planes based on distribution statewide 100 100 100 Estimate r::J number d medium airtmG alrcrd baaed on statswide distrib.
$13,250 $14,000 $14,750 Property tax per plane per year .. number of planes
$13,500 $22,000 $31,500 Estimated as $45 to $70 per hour of operation 110 120 130 number of air taxi aircraft Insured at airport
$1,485,000 $2,640,000 $4,095,000 = number of planes .. average insurance cost per year
10" 7" 5" rough estimate to include other non-wage costs net included elsewhere $679,800 $1,058,400 $1,126,125 = percentage .. gross revenues
$2.786,263 $8,731,913 $13,678,938 = GI068 revenues - all expenses other than wages. aalariea. and profits $5,438,400 $12,852,000 $20,270,250 = Gross rewnues
._- .. _- ----
ISER 09f26195
--CO
~
i 2. ... ~ = ~ a. § a. i
I ill rm
I C'.
t f
lbe Economic Contribution of the Anchorage International Airport 119
Appendix F. Activity Attribution Matrix This appendix contains the matrix used both to calculate the number of jobs at the airport (not reported for individual firms to maintain confidentiality) and to allocate those Jobs across types of business, client groups served, and types of services provided. Table F-l shows the summary allocation of jobs across client groups served and Table F-2 shows the allocation across types of service provided.
Table F-3 is the details matrix showing the allocation across client groups of the activities of each business. For example, Alaska Airlines jobs have been allocated 30% to Non-Alaskan Visitors, 30% to Alaskans Outside Anchorage, and 40% to Anchorage residents.
Each of these allocations is in turn subdivided into finer categories. For Alaskans Outside Anchorage the more detailed categories include Anchorage visits, through passengers, freight, fixed base operations and general aviation, enabling basic (including all business uses of services), and air taxi. Of the 30% of Alaska Airlines activity allocated to Alaskans outside Anchorage, one third is allocated to Anchorage visits, one third to
through traffic, and the rest divided between freight and enabling basic (business uses of services).
The Non-Alaska Visitor detail includes four categories-international passengers coming into Alaska, domestic passengers coming into Alaska, international and domestic passengers traveling by air within Alaska, and air taxi. For Alaska Airlines 25% of their operation is allocated to domestic interstate travel and 5% to intrastate travel. This sums to the 30% allocation to Non-Alaska Visitors.
For Anchorage Residents we define four detailed categories--passenger, freight, fixed base operators and general aviation, and air taxi. For Alaska Airlines we allocate 30% of total activity to passenger services and 10% to freight services.
Using the employment estimates for each business and the pen:entage allocations of the client groups served and services provided we can calculate employment at the airport in three ways as follows:
TYPE OF BUSINESS
CLIENT GROUPS SERVED
SERVICE PROVIDED
Alaska Airlines can be viewed as being in the business category scheduled air carrier. At the same time it can be viewed as providing services to Anchorage Residents, Alaskans Outside Anchorage, and Non-Alaska Visitors. Finally it can be received as providing passenger and freight service. The activities of all businesses at the airport have been categorized in this fashion.
Information was collected from a large number of sources to calculate the number of jobs for each employer as well as the allocation of jobs across client groups. In addition to published information from the Alaska Department of Labor, the Anchorage International Airport, the u.s. Department of Commen:e, and other soun:es, ISER conducted a large number of interviews with representatives of the different types of businesses at the airport as well as knowledgeable key informants.
All of this information was used in the development of the matrix but because of gaps in the available information we were fon:ed to estimate some of the employment numbers as well as some of the allocations among client groups. The employment information by business is more robust than the allocation among client groups, as should be expected. Businesses often are not completely aware themselves of the residence of their clientele, or are reluctant to divulge information on the characteristics of their market.
120 TIle Economic Contribution of the Anchorage International Airport
There also may be some inconsistencies in the client user group allocations since the airport provides services both to private individuals and businesses. In particular an air taxi Or charter providing freight services to a statewide business could be allocated to Anchorage residents or non-Anchorage residents. Likewise there could be inconsistencies in the allocation among types of service as the same activity could have appeared in the Freight or Air Taxi designation.
With that in mind our estimates of employment by client user group and type of service should be viewed as only approximations based on the limited data available at the time of the study. The potential margin of error (percent error) in estimate will be inversely related to the size of the client user group or service. Thus the largest margin of error should be in the estimates of General Aviation and Air Taxi services employment. Additional information supplied to the matrix would increase the accuracy of these estimates.
The Economic Contribution of the Anchorage International Airport 127
~I" ! § ~
II U ! ~
II I " I I ~
~ I .. !
~I H !
IIII ;
IIII I"
II II Iii !
II I !
III !
! III !
II :
I iii .. ______ 0
III ~
~
I 'II ~
iU ~
~ m~~~~ ~
! ~ II •
.. 1,11 i II ~ .Uhd I II i eJiH.
The Economic Contribution of the Anchorage International Airport 129
Appendix G. Inpul-Output Totallmpad Results: Total Economic Contribution
In this appendix we present four tables of output from the Alaska Input-Output model which show the economic effects of the twO different analyses of the aggregate contribution of the airpon. This interpretation of the total detail is explained in Appendix B.
Basic To Anchorage-New Money the Airport Brings to Anchorage The first two tables show the TOTAL EFFECT, in tenns of sales, payroll, and employment, of all the activity at the Anchorage International Airpon which can be identified as BASIC TO ANCHORAGE (Chapter 3) This includes all air transpon services provided to non-residents as well as other tenants that are air transpon service dependent. The total employment impact of 7,900 represents all jobs in the community that depend on the air transpon services the Anchorage International Alrpon provides to non-residents. Another way of defining this BASIC TO ANCHORAGE total is that if the airpon were only providing air transpon services to the reSidents of Anchorage, there would be 7,900 fewer jobs in the community. The total increases to 13,100 jobs if the off-site visitor spending impact of non-residents were also attributed to the airport. (Direct effect employment figures do not exactly correspond to tables in the chapters in the text due to rounding and the mechanics of the modeling technique.
All Air Transport Activities: Move Entire Airport Out of Town The next two tables show the TOTAL EFFECT, in tenns of sales, payroll, and employment, of all the activity at the Anchorage International Alrpon which would relocate if it were possible to MOVE THE ENTIRE AIRPORT OUT OF TOWN (Chapter 4). If this were to happen all the air transpon activity BASIC TO ANCHORAGE would relocate and in addition the air transpon services provided to Anchorage residents would also move. The total employment impact of this would be 10,900. This represents all jobs in the community that depend on all the air transpon services the Anchorage International AIrpon provides to non-residents and residents alike. The total increases to 16,100 jobs if the off-site visitor spending impact of non-residents were also assumed to move outside Anchorage.
Grand Total The final table in Appendix H is a calculation of the grand total of the economic effect of all the activities at the airpon. The total employment effect of 12,300 (excluding visitor spending) is greater than either of the aggregations shown in this Appendix since there are some activities at the airpon which are not air transpon related.
130 The Economic Contribution of the Anchorage International Airport
ANCHORAGE INTERNATIONAL AIRPORT ECONOMIC CONTRIBUTION
BASIC TO ANCHORAGE
TOTAL EFFECT
OUTPUT EMPLOYEE COMPENSATION
EMPLOYMENT
DIRECT EFFECT
FINAL DEMAND EMPLOYEE COMPENSATION
EMPLOYMENT
INDIRECTIINDUCED EFFECT
OUTPUT EMPLOYEE COMPENSATION
EMPLOYMENT
DIRECT EFFECT MULTIPLIERS (BEA DEF.)
OUTPUT EMPLOYEE COMPENSATION
EMPLOYMENT
FINAL DEMAND MULTIPLIERS (BE A DEF)
OUTPUT EMPLOYEE COMPENSATION
EMPLOYMENT
Direct Effect Multiphers are total effect divIded by direct effect.
$835.047.350 $228.093.952
7.886
$517,905,042 $143,651,858
4,591
$317,142,307 $84.442,094
3,296
1.61 1.59
1.72
$1.61 $0.44
15.23
Final Demand Multipliers represent the tolal dollar or employment change for each additional dollar of output delivered to fmal demclnd.
ISER OUTPUT3.wK4 06105/95
TIle Economic Contribution of the Anchorage International Airport
ANCHORAGE INTERNATIONAL AIRPORT ECONOMIC CONTRIBUTION
BASIC TO ANCHORAGE WITH OFFSITE VISITOR $
TOTAL EFFECT
OUTPUT EMPLOYEE COMPENSATION
EMPLOYMENT
DIRECT EFFECT
FINAL DEMAND EMPLOYEE COMPENSATION
EMPLOYMENT
INDIRECT/INDUCED EFFECT
OUTPUT EMPLOYEE COMPENSATION
EMPLOYMENT
DIRECT EFFECT MUL TIPLIERS (SEA DEF )
OUTPUT EMPLOYEE COMPENSATION
EMPLOYMENT
FINAL DEMAND MULTIPLIERS (SEA DEF)
OUTPUT EMPLOYEE COMPENSATION
EMPLOYMENT
Direct Effect Multipliers are total effect divided by direct effect.
$1,168,591,611 $332,384,589
13,112
$731,654,292 $214,937,318
8,505
$436,937,319 $117.447,271
4,606
1.60 1,55
1,54
$1.60 $0.45
17,92
Final Demand Multipliers represent the total dollar or employment change for each additional dollar of output delivered to final demand
131
ISER OUTPUT3.WK4 06105/95
132 The Economic Contribution of the Anchorage International Airport
ANCHORAGE INTERNATIONAL AIRPORT ECONOMIC CONTRIBUTION
MOVE ENTIRE AIRPORT OUT OF TOWN
TOTAL EFFECT
OUTPUT EMPLOYEE COMPENSATION
EMPLOYMENT
DIRECT EFFECT
FINAL DEMAND EMPLOYEE COMPENSATION
EMPLOYMENT
INDIRECTIINDUCED EFFECT
OUTPUT EMPLOYEE COMPENSATION
EMPLOYMENT
DIRECT EFFECT MULTIPLIERS (SEA DEF.)
OUTPUT EMPLOYEE COMPENSA TlON
EMPLOYMENT
FINAL DEMAND MULTIPLIERS (SEA DEF)
OUTPUT EMPLOYEE COMPENSATION
EMPLOYMENT
-_._---_ .. _-.
Direct Effect Mulliphers are total effect divided by direct effect.
$1.162.596.568 $315.908.525
10.905
$718.564.584 $197.971.052
6.310
$444.031.984 $117.937.473
4.595
1.62 1.60
1.73
$1.62 $0.44
15.18
Final Demand Multipliers represenllhe lotal dollar or employment change for each additional dollar of OlJlpul delivered to final demand.
ISER OUTPUT3'wK4 06/03195
The Economic Contribution of the Anchorage International Airport
ANCHORAGE INTERNATIONAL AIRPORT ECONOMIC CONTRIBUTION
MOVE ENTIRE AIRPORT OUT OF TOWN: INCLUDING VISITOR $$
TOTAL EFFECT
OUTPUT EMPLOYEE COMPENSATION
EMPLOYMENT
DIRECT EFFECT
FINAL DEMAND EMPLOYEE COMPENSA TlON
EMPLOYMENT
INDIRECT/INDUCED EFFECT
OUTPUT EMPLOYEE COMPENSATION
EMPLOYMENT
DIRECT EFFECT MULTIPLIERS {BEA DEFI
OUTPUT EMPLOYEE COMPENSATION
EMPLOYMENT
FINAL DEMAND MUL TIPLIERS {BE A DEF I
OUTPUT EMPLOYEE COMPENSATION
EMPLOYMENT
Direct Effect Muttipliers are total effect divided by direct effect.
$1,496,140,829 $420,199,162
16,130
$932,313,834 $269,256,513
10,225
$563,826,995 $150,942,650
5,905
1.60 1,56
1.58
$1,60 $0.45
17.30
Final Demand Multipliers represent the total dollar or employment ch<lnge lor each additional dollar 01 output delivered to final demand.
133
ISER OUTPUT3,WK4 06/03195
The Economic Contribution of the Anchorage International Airport 135
Appendix H. Input-Output Results: User Group Contribution
In this appendix we present four tables of output from the Alaska Input-Output model which show both the aggregate economic effects and "rules of thumb" for the different client groups served by the airport. This is backup for the infortnation contained in chapters 6 through 10 of the report.
We present results for the 5 client groups served, some detail for difTerent client groups, and the total for all user groups as follows:
INTERNATIONAL CARGO
NON-REsiDENT VISITORS
Excluding Off-site Spending Including Off-site Spending
ALASKANS OUTSIDE ANCHORAGE
Excluding Off-site Spending Including Off-site Spending
ANCHORAGE REsIDENTS
PUBLIC AND PRIVATE TENANTS
Aviation Related Not Aviation Related
TOTAL
For each client group the table shows the TOTAL EFFECT which is the total sales, payroll, and employment in the community attributable to serving the air transport needs of that group. The DIRECT EFFECT is the portion of the TOTAL EFFECT which represents air transport related activity. The INDIRECTIINDUCED EFFECT is the portion of the TOTAL EFFECT which represents other business activity generated in the community as a result of the multiplier effect. The interpretation of table detail is further explained in Appendix B.
For example the first table shows that international air cargo related operations account for $284 million of sales, $78 million of payroll, and 2,700 jobs in Anchorage. Of the total jobs 1,600 are located on-site at the airport. The majority of the direct jobs are for scheduled air carriers, but several other types of job at the airport provide services for international air cargo operations and are included. These include state and federal government jobs involved in the operation the airport and air service providers such as fuel concessionaires. Indirect and Induced jobs are off-site in the trade, service and other support sectors of the economy.
Each table also contains a "rule of thumb" which represents the total number of jobs in the community associated with $1 million of gross receipts from the provision of air transport related services to each type of client. The "rule of thumb" is located at the bottom of the table in the section entitled FINAL DEMAND MULTIPLIERS. For example the table for International Cargo shows that $1 million of sales attributable to air transport services provided at Anchorage International Airport results on average in 15 jobs in the community.
136 The Economic Contribution of the Anchorage International Airport
ANCHORAGE INTERNATIONAL AIRPORT ECONOMIC CONTRIBUTION
INTERNATIONAL CARGO
TOTAL EFFECT
OUTPUT EMPLOYEE COMPENSATION
EMPLOYMENT
DIRECT EFFECT
FINAL DEMAND EMPLOYEE COMPENSATION
EMPLOYMENT
INDIRECTIINDUCED EFFECT
OUTPUT EMPLOYEE COMPENSATION
EMPLOYMENT
DIRECT EFFECT MULTIPLIERS (SEA DEF.)
OUTPUT EMPLOYEE COMPENSATION
EMPLOYMENT
FINAL DEMAND MUL TIPLIERS (SEA DEF.)
OUTPUT EMPLOYEE COMPENSATION
EMPLOYMENT
--_._--Direct Effect Multipliers are total effect divided by dlrecl effect.
$284.364.994 $77.702.206
2.728
$176.409.039 $48.808.758
1.593
$107.955.955 $28.893.447
1.135
1.61 1.59
1.71
$1.61 $0.44
15.46
Final DemAnd Multipliers represent the totAl dollar or employment change for each additional dollar 01 output delivered to final demand
ISER OUTPUT3.WK4 06103195
The Economic Contribution of the Anchorage International Airport
ANCHORAGE INTERNATIONAL AIRPORT ECONOMIC CONTRIBUTION
NON·RESIDENT VISITORS
TOTAL EFFECT
OUTPUT EMPLOYEE COMPENSATION
EMPLOYMENT
DIRECT EFFECT
FINAL DEMAND EMPLOYEE COMPENSATION
EMPLOYMENT
INDIRECT/INDUCED EFFECT
OUTPUT EMPLOYEE COMPENSATION
EMPLOYMENT
DIRECT EFFECT MULTIPLIERS (SEA DEF)
OUTPUT EMPLOYEE COMPENSATION
EMPLOYMENT
FINAL DEMAND MULTIPLIERS (SEA DEF.)
$172.179.969 $46.238.619
1.576
$104.400.229 $28.498.811
895
$67.779.740 $17.739.808
681
1.65 1.62
1.76
OUTPUT $1.65 EMPLOYEE COMPENSATION $0.44
EMPLOYMENT 15.10
._--.. _ .•....... - "_ ... _" .. _-_. __ ._--------Direct Effect Munipllers are tolal elleel divided by direct effect.
Final Demand MUltipliers represanllhe total dollar or employment change for each additional doHar of output delivered to final demand.
137
ISER OUTPUT3.wK4 06103195
138 The Economic Contribution of the Anchorage International Airport
ANCHORAGE INTERNATIONAL AIRPORT ECONOMIC CONTRIBUTION
NON-RESIDENT VISITORS WITH OFFSITE VISITOR $$
TOTAL EFFECT
OUTPUT EMPLOYEE COMPENSATION
EMPLOYMENT
DIRECT EFFECT
FINAL DEMAND EMPLOYEE COMPENSATION
EMPLOYMENT
INDIRECTIINDUCED EFFECT
OUTPUT EMPLOYEE COMPENSA TION
EMPLOYMENT
DIRECT EFFECT MULTIPLIERS (BEA DEF)
OUTPUT EMPLOYEE COMPENSA nON
EMPLOYMENT
FINAL DEMAND MULTIPLIERS (BEA DEF)
OUTPUT EMPLOYEE COMPENSATION
EMPLOYMENT
Direct Effect Multipliers Are lolal effect divicled by direct effec\.
$343.412,831 $99.778,692
4,259
$214,133.479 $65,094,894
2,905
$129,279,352 $34,683,79B
1,354
1.60 1.53
1.47
$1,60 $0.47
19,89
Final Demand Multipliers represent the tolal doll<'lr or employment change for each additional dollar of output delivered to final demand.
ISER OUTPUT3,WK4 06103195
The Economic Contribution of the Anchorage International Airport
ANCHORAGE INTERNATIONAL AIRPORT ECONOMIC CONTRIBUTION
ALASKANS OUTSIDE ANCHORAGE
TOTAL EFFECT
OUTPUT EMPLOYEE COMPENSATION
EMPLOYMENT
DIRECT EFFECT
FINAL DEMAND EMPLOYEE COMPENSATION
EMPLOYMENT
INDIRECTIINDUCED EFFECT
OUTPUT EMPLOYEE COMPENSATION
EMPLOYMENT
DIRECT EFFECT MULTIPLIERS (BEA DEF)
OUTPUT EMPLOYEE COMPENSATION
EMPLOYMENT
FINAL DEMAND MULTIPLIERS (BEA DEF)
$306.589.440 $81.271.843
2.837
$189.965.774 $50.317.587
1.622
$116.623.666 $30.954.256
1.215
1.61 1.62
175
OUTPUT $1.61 EMPLOYEE COMPENSATION $0.43
EMPLOYMENT 14.94
Direct Effect Multipliers are total effect divided by direct effect.
Final Demand Multipliers represent the total doUar or employment change for each additional dollar of output delivered to final demand.
139
ISER OUTPUT3,WK4 06103195
140 The Economic Contribution of the Anchorage International Airport
ANCHORAGE INTERNATIONAL AIRPORT ECONOMIC CONTRIBUTION
ALASKANS OUTSIDE ANCHORAGE WITH OFFSITE VISITOR $$
TOTAL EFFECT
OUTPUT EMPLOYEE COMPENSATION
EMPLOYMENT
DIRECT EFFECT
FINAL DEMAND EMPLOYEE COMPENSATION
EMPLOYMENT
INDIRECT/INDUCED EFFECT
OUTPUT EMPLOYEE COMPENSATION
EMPLOYMENT
DIRECT EFFECT MUL TlPLIERS (BE A DEF.)
OUTPUT EMPLOYEE COMPENSATION
EMPLOYMENT
FINAL DEMAND MULTIPLIERS (BE A DEF)
OUTPUT EMPLOYEE COMPENSATION
EMPLOYMENT
-----------_ .. _._-----._----
Direct Effect Multipliers are total effect divided by direct effect.
$468,900,839 $132,022.407
5,380
$293,981,774 $85,006,964
3,527
$174,919,065 $47,015.442
1,853
1.59 1.55
1.53
$1.59 $0.45
18.30
Final Demand Multipliers represent the lotal dollar or employment change for each additional dollar 01 output delivered to final demand.
ISER OUTPUT3,WK4 06103195
The Economic Contribution of the Anchorage International Airport
ANCHORAGE INTERNATIONAL AIRPORT ECONOMIC CONTRIBUTION
ANCHORAGE RESIDENTS
TOTAL EFFECT
OUTPUT EMPLOYEE COMPENSATION
EMPLOYMENT
DIRECT EFFECT
FINAL DEMAND EMPLOYEE COMPENSATION
EMPLOYMENT
INDIRECTIINDUCED EFFECT
OUTPUT EMPLOYEE COMPENSATION
EMPLOYMENT
DIRECT EFFECT MUL TlPLIERS (BE A DEF)
OUTPUT EMPLOYEE COMPENSATION
EMPLOYMENT
FINAL DEMAND MUL TIPLIERS (BE A DEF)
OUTPUT EMPLOYEE COMPENSATION
EMPLOYMENT
Direct Elloct Multipliers are total effect divided by direct effect.
$327.622.384 $87.838.147
3,020
$200,686.576 $54.332,241
1.720
$126,935,807 $33,505,906
1,300
1.63 1.62
1.76
$1.63 $0.44
15.05
Final OomMd Multipliers represent tl19 total dollClf or employment change for each additional dollar of output delivered to final demand.
141
ISER OUTPUT3.WK4 06103195
142 The Economic Contribution of the Anchorage International Airport
ANCHORAGE INTERNATIONAL AIRPORT ECONOMIC CONTRIBUTION
PUBLIC AND PRIVATE TENANTS
TOTAL EFFECT
OUTPUT EMPLOYEE COMPENSATION
EMPLOYMENT
DIRECT EFFECT
FINAL DEMAND EMPLOYEE COMPENSATION
EMPLOYMENT
INDIRECT/INDUCED EFFECT
OUTPUT EMPLOYEE COMPENSATION
EMPLOYMENT
DIRECT EFFECT MUL TIPUERS (SEA DEF)
OUTPUT EMPLOYEE COMPENSATiON
EMPLOYMENT
FINAL DEMAND MUL TIPUERS (SEA DEF )
OUTPUT EMPLOYEE COMPENSATION
EMPLOYMENT
Direct Effect Multipliers Clfe total effect divided by direct effect.
$220.410.439 $67.207.768
2.104
$116.755.000 $40.901.037
1.200
$103.655.439 $26.306.731
904
1.89 1.64
1.75
$1.89 $0.58
18.02
Final Demand Multipliers represent tile lolnt dollar Of employment change for each additional dollar of output delivered to final demand
ISER OUTPUT3,WK4 06103/95
The Economic Contribution of the Anchorage International Airport
ANCHORAGE INTERNATIONAL AIRPORT ECONOMIC CONTRIBUTION
PUBLIC AND PRIVATE TENANTS: AVIATION RELATED
TOTAL EFFECT
OUTPUT EMPLOYEE COMPENSATION
EMPLOYMENT
DIRECT EFFECT
FINAL DEMAND EMPLOYEE COMPENSATION
EMPLOYMENT
INDIRECTIINDUCED EFFECT
OUTPUT EMPLOYEE COMPENSATION
EMPLOYMENT
DIRECT EFFECT MULTIPLIERS (SEA DEF)
OUTPUT EMPLOYEE COMPENSATION
EMPLOYMENT
FINAL DEMAND MULTIPLIERS (SEA DEF)
OUTPUT EMPLOYEE COMPENSATION
EMPLOYMENT
Direct Effect Multipliers are lotal effect divided by direct effect
$71.912.947 $22.881.285
745
$47.130.000 $16.026.702
481
$24.782.947 $6.854.583
264
1.53 1.43
1.55
$1.53 $0.49
15.81
Final Demand Multipliers represent the total dollar or employment Change for each additional dollar of output delivered to final demand
143
ISER OUTPUT3,WK4 06103195
144 The Economic Contribution of the Anchorage International Airport
ANCHORAGE INTERNATIONAL AIRPORT ECONCMIC CONTRIBUTION
PUBLIC AND PRIVATE TENANTS: NOT AVIATION RELATED
TOTAL EFFECT
OUTPUT EMPLOYEE COMPENSATION
EMPLOYMENT
DIRECT EFFECT
FINAL DEMAND EMPLOYEE COMPENSATiON
EMPLOYMENT
INDIRECT/INDUCED EFFECT
OUTPUT EMPLOYEE COMPENSATION
EMPLOYMENT
DIRECT EFFECT MULTiPLIERS (8EA DEF.)
OUTPUT EMPLOYEE COMPENSA TION
EMPLOYMENT
FINAL DEMAND MULTIPLIERS (8EA DEF)
OUTPUT EMPLOYEE COMPENSATiON
EMPLOYMENT
Direct Effect Multipliers are total elleel divided by diract eHect.
$148.497.493 $44.326.484
1.359
$69.625.000 $24.874.335
719
$78.872.493 $19.452.148
640
2.13 1.78
1.89
$2.13 $0.64
19.52
Final Demand Multipliers represent the total dollar or employment change for each additional dollar 01 output delivered to final dem,md.
ISER OUTPUT3.WK4 06103/95
lbe Economic Contribution of the Anchorage International Airport
ANCHORAGE INTERNATIONAL AIRPORT ECONOMIC CONTRIBUTION
TOTAL--COMPARE TO GRAND TOTAL
TOTAL EFFECT
OUTPUT EMPLOYEE COMPENSATION
EMPLOYMENT
DIRECT EFFECT
FINAL DEMAND EMPLOYEE COMPENSATION
EMPLOYMENT
INDIRECT/INDUCED EFFECT
OUTPUT EMPLOYEE COMPENSATION
EMPLOYMENT
DIRECT EFFECT MULTIPLIERS (SEA DEF)
OUTPUT EMPLOYEE COMPENSATION
EMPLOYMENT
FINAL DEMAND MULTIPLIERS (SEA DEF)
OUTPUT EMPLOYEE COMPENSATION
EMPLOYMENT
$1.311.167.226 $360.258.582
12.265
$788.216.619 $222.858.434
7.030
$522.950.607 $137.400.148
5.235
1.66 1.62
1.74
$1.66 $0.46
15.56
.. ,._-_." -- .. _-------Direct Effect Multipliers Bre tolal effect divided by direct effect.
Final Demand Multipliers represent the 101<'11 dollar or employment change lor each additional dollar of output delivered 10 fmal demand