The Economic Contribution of Marine Angler Expenditures on Durable Goods in the United States, 2014 Sabrina J. Lovell, James Hilger, Scott Steinback, and Clifford Hutt U.S. Department of Commerce National Oceanic and Atmospheric Administration National Marine Fisheries Service NOAA Technical Memorandum NMFS-F/SPO-165 September 2016
Transcript
The Economic Contribution of Marine Angler Expenditures on Durable Goods in the United States, 2014
Sabrina J. Lovell, James Hilger, Scott Steinback, and Clifford Hutt
U.S. Department of Commerce National Oceanic and Atmospheric Administration National Marine Fisheries Service NOAA Technical Memorandum NMFS-F/SPO-165 September 2016
The Economic Contribution of Marine Angler Expenditures on Durable Goods in the United States, 2014
Sabrina J. Lovell, James Hilger, Scott Steinback, and Clifford Hutt
NOAA Technical Memorandum NMFS-F/SPO-165 September 2016
U.S. Department of Commerce Penny Pritzker, Secretary National Oceanic and Atmospheric Administration Kathryn D. Sullivan, Administrator National Marine Fisheries Service Eileen Sobeck, Assistant Administrator for Fisheries
ii
Recommended citation: Sabrina J. Lovell, James Hilger, Scott Steinback, and Clifford Hutt. 2016. The Economic Contribution of Marine Angler Expenditures on Durable Goods in the United States, 2014. U.S. Dep. Commerce, NOAA Tech. Memo. NMFS-F/SPO-165, 72 p. Copies of this report may be obtained from: Sabrina J. Lovell, Ph.D. Office of Science and Technology National Marine Fisheries Service, NOAA 1315 East West Highway Silver Spring, MD 20910 Phone: 301-427-8153 Or online at: http://spo.nmfs.noaa.gov/tm/ or http://www.st.nmfs.noaa.gov/economics/index
Contents ACKNOWLEDGEMENTS ........................................................................................................... iv ABSTRACT .................................................................................................................................... 1 I. INTRODUCTION ....................................................................................................................... 1 II. SAMPLE FRAMES AND SURVEY METHODS .................................................................... 2 III. RESPONSE RATES AND ANGLER DEMOGRAPHICS ..................................................... 3 IV. ESTIMATION OF ANGLER EXPENDITURES .................................................................. 6 V. ECONOMIC CONTRIBUTION ANAYLSIS ........................................................................ 11 VI. RESULTS AND DISCUSSION ............................................................................................. 14 NATIONWIDE AND STATE LEVEL RESULTS ...................................................................... 17 HMS PERMIT HOLDERS RESULTS ........................................................................................ 65 REFERENCES ............................................................................................................................. 70 GLOSSARY ................................................................................................................................. 71
iv
ACKNOWLEDGEMENTS Successful implementation of the 2014 National Marine Recreational Fishing Expenditure Survey is the result of the participation and support of many individuals and organizations. We wish to acknowledge invaluable assistance, advice, and support from colleagues at the National Marine Fisheries Service’s Office of Science and Technology, including Rita Curtis, Gordon Colvin, Lauren Dolinger-Few, John Foster, Laura Johansen, Joseph Pursel, Scott Sauri, and David Van Voorhees, for their support with obtaining the sample frames, survey design, advice on statistical methods, SAS assistance, and their overall support of the project. We also wish to extend our gratitude to Alex Miller and Donna Bellais, Gulf States Marine Fisheries Commission; Ed Hibsch, Pacific States Marine Fisheries Commission; and Gretchen Jennings, William Romberg, and Kaitlyn Sundet at Alaska Department of Fish and Game. We thank Brad McHale of the Northeast Regional Office for providing the HMS sample frame. We thank CIC Research, Inc. for assisting with collection of the data. Finally, we thank all of the recreational anglers who contributed their time and information in order to complete this important research effort.
1
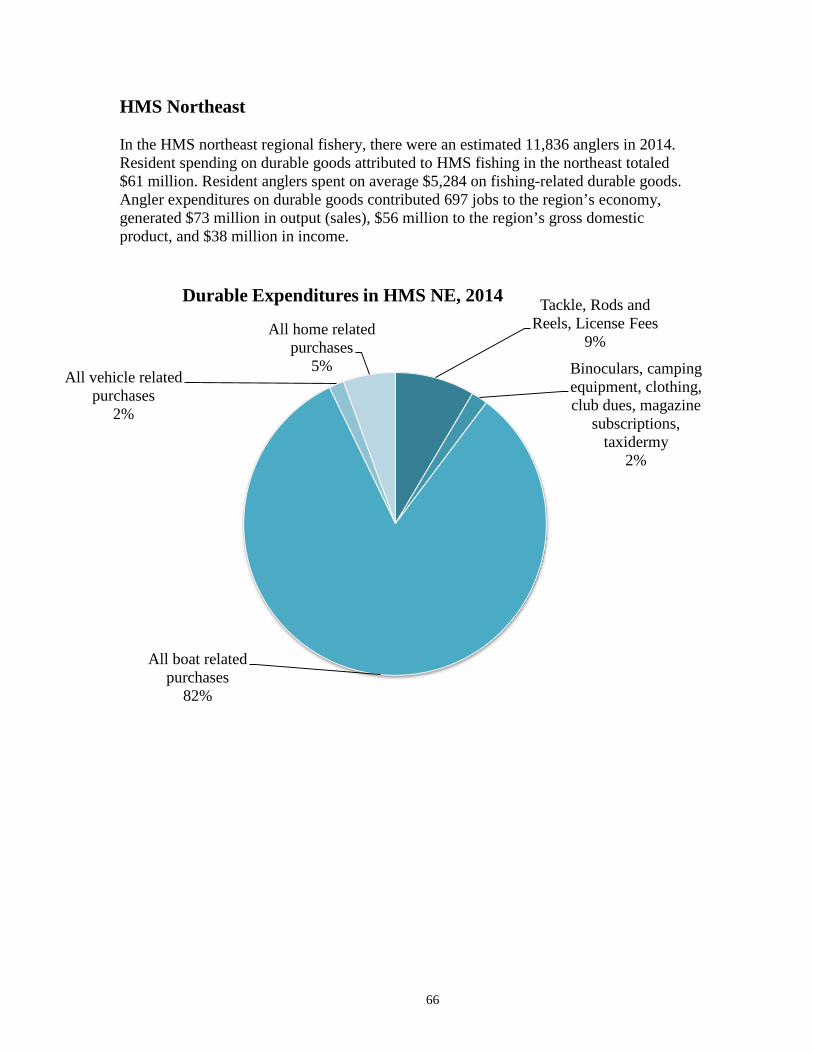
ABSTRACT In 2014, NOAA Fisheries conducted a nationwide survey of anglers about their annual purchases of durable goods used for saltwater recreational fishing. Data on angler expenditures allows NOAA Fisheries to better understand the economic contributions of marine recreational fishing to the nations’ economy. The sample frame consisted of licensed anglers in coastal states across the U.S. Anglers were asked about their purchases of durable goods such as rods and reels, boats, vehicles, and second homes used for saltwater fishing in the prior 12 months in the state of licensure. Across all coastal states, a total of 10,809 completed surveys were returned with an overall response rate of 11 percent. Mean expenditures for different durable good categories were estimated for both resident and non-resident fishermen in each state. Total expenditures were calculated and used to estimate total economic contributions by state and for the nation. At the national level marine anglers spent $28 billion on fishing equipment and durable goods (e.g., fishing rods, fishing tackle, and boats). These expenditures generated an estimated $49.6 billion in total output, added $29 billion in contribution to gross domestic product, contributed $18 billion to personal income, and supported more than 358 thousand jobs across the United States.
I. INTRODUCTION Purchases made by marine recreational anglers are an important source of economic activity in coastal areas around the United States. In recognition of the economic contributions anglers make to coastal economies, NOAA Fisheries conducts the National Marine Recreational Fishing Expenditure Survey (hereafter referred to as the “NES”) every three to five years in order to gather data on expenditures made by anglers related to their marine recreational fishing trips and/or their annual purchases of durable fishing equipment (e.g., rods and reels, other fishing related equipment, boats, vehicles, and second homes). In 2014, NOAA Fisheries surveyed anglers about their annual purchases of durable goods used for marine recreational fishing. For the purposes of the NES, marine recreational fishing is defined as fishing for finfish in the open ocean or any body of water that is marine or brackish for sport or pleasure. The 2014 survey is the third nationwide survey conducted by NMFS to gather marine recreational fishing expenditures across the United States. The past surveys were conducted in 2006 and 2011. The primary objective of the 2014 national expenditure survey was to collect annual expenditures on durable goods used for marine recreational fishing. An additional objective was to estimate the economic contributions to coastal economies from these expenditures. As specified in the Magnuson-Stevenson Fishery Conservation and Management Act of 1996 (and reauthorized in 2007), NMFS is required to enumerate the economic impacts of the policies it implements on fishing participants and coastal communities. The estimates of economic contributions from this survey can inform such regulatory analysis in the future. At the national level, it is estimated that marine anglers spent $28 billion on fishing equipment and durable goods (e.g., fishing rods, fishing tackle, and boats) in 2014. These expenditures generated an estimated $49.6 billion in total output contributions, $29 billion in value-added
2
contributions (i.e., contribution to gross domestic product), $18 billion in income contributions, and supported more than 358 thousand jobs across the United States. Section 2 of this report gives a brief description of the sampling design and survey methods. In section 3, survey response rates and the responses to the angler demographic questions are discussed. Section 4 presents the analytical methods used to estimate mean angler expenditures and total angler expenditures. Section 5 includes a discussion of the regional input-output model and the methods for estimating state level and U.S. level economic contributions from marine recreational fishing. Section 6 concludes with some remarks regarding model assumptions, limitations, and possible survey improvements for future years. Following Section 6, tables with the expenditure and impact results are listed for the entire U.S., for individual coastal states, and for anglers with Atlantic Highly Migratory Species permits.
II. SAMPLE FRAMES AND SURVEY METHODS The target population for the survey consisted of adult (age 16 or older) marine recreational anglers who had purchased a recreational fishing license that was valid during 2014 in a coastal state or who held an Atlantic Highly Migratory Species (HMS) Permit for 2014. The sample frame was constructed from NMFS’s National Saltwater Angler Registry license database, state license files provided by Alaska, California, Oregon, Texas and Washington, and NMFS’s 2014 HMS permit database. All licenses that covered saltwater fishing were eligible to be included in the sample frame, including saltwater only licenses and combination licenses such as freshwater/saltwater combinations or hunting/fishing combination licenses. For California, Oregon and Washington (all of which have only a combination saltwater/freshwater license), the sample was restricted to those anglers who purchased a license in a coastal county. In Florida and in Texas (which has a large number of combination license types), proportional sampling techniques were used to draw samples from anglers in non-coastal counties. For each state’s license frame, the sample was stratified by resident status (resident of the state of license or non-resident). Proportional random sampling was done for 4 aggregated categories of license types: annual saltwater only; annual combination; daily saltwater only; and daily combination. All coastal states except Hawaii, which does not have a non-commercial state saltwater license, were included in the 2014 sampling frame. In 2011, Puerto Rico was also included in the NES but in 2014, the lack of a license frame prevented including it in the sample. For the HMS anglers, only private anglers were included in the HMS sample. Charter and for-hire permits were not included. The HMS frame was kept separate from the other state frames. The survey was conducted by mail and followed a truncated Modified Dillman method. In order to maximize the effectiveness of this survey mode, the mailing effort was initially divided into two mailing segments but ended up requiring a third mailing segment. The purpose of the first mailing segment was to establish accurate state response rates to better utilize the project’s financial resources. The effort associated with the second segment was to be determined by the response rates from segment 1. The third segment was added after the response rates from the first two mailings were lower than expected and was implemented in order to increase the number of completed surveys returned for purposes of ensuring adequate sample sizes. Before the first mailing, one large sample was drawn that would be able to accommodate both the first
3
and second mailings without having to sample again from the original frame. The third mailing was drawn from the original sample draw. Therefore, the sample was done without replacement. Mailings occurred in May, July, and September 2014. Anglers selected to participate in the study received an introductory letter explaining to them that they had been randomly chosen to participate in the survey and to expect a survey packet in the mail in the coming days. A questionnaire booklet, cover letter, and a business reply envelope were sent via postal mail. Approximately one week later, all anglers were sent a reminder postcard in the mail. These postcards served two purposes: 1) to thank the respondent for participating and 2) to remind those who had not yet completed the survey to do so. This process was repeated for each of the three mailing segments. A second survey mailing to those who had still not responded after the postcard mailing was not conducted in order to keep project costs within budget and because previous survey efforts showed that the second mailing had very low response rates. Four different questionnaires were used for the survey. California and Florida had questionnaires with a few unique questions; the remaining states received the same questionnaire. (Copies of all versions of the questionnaire are available upon request). The survey asked anglers about their purchases of durable goods used at least in part for saltwater fishing in the prior 12 months in the state of licensure. The questionnaire asked for the angler’s expenditures on fishing tackle and gear (fishing line, hooks, lures, etc.), rods and reels, fishing licenses, special clothing, publications (books, magazines, newspapers, etc.), camping equipment, binoculars, dues and contributions to fishing clubs, and processing or taxidermy costs. For each item, the angler was asked what percent of use was for saltwater fishing versus freshwater fishing or other recreational activities, and what percent of the total cost was spent in the survey state. Anglers were asked if they owned a boat that they used for recreational marine fishing in the prior 12 months. If yes, anglers were asked about their purchases of both motorized and non-motorized boats and any associated costs such as boating electronics, mooring and storage, boat insurance, boat license and registration, and boat maintenance and repairs. Additional questions were asked on the length and horsepower of the boat, and the percentage of time in the prior 12 months that they had used it for marine recreational fishing. Similar questions were asked about the use of vehicles (e.g. cars, trucks, trailers, motor homes) and second homes for marine recreational fishing. As with boats, respondents were asked to estimate the percentage of time that the vehicle and second home were used for marine recreational fishing. The final section of the mail survey collected a set of socioeconomic and demographic variables, including gender, age, ethnicity, race, annual household income, education level, number of hours worked per week, and the years of marine fishing experience.
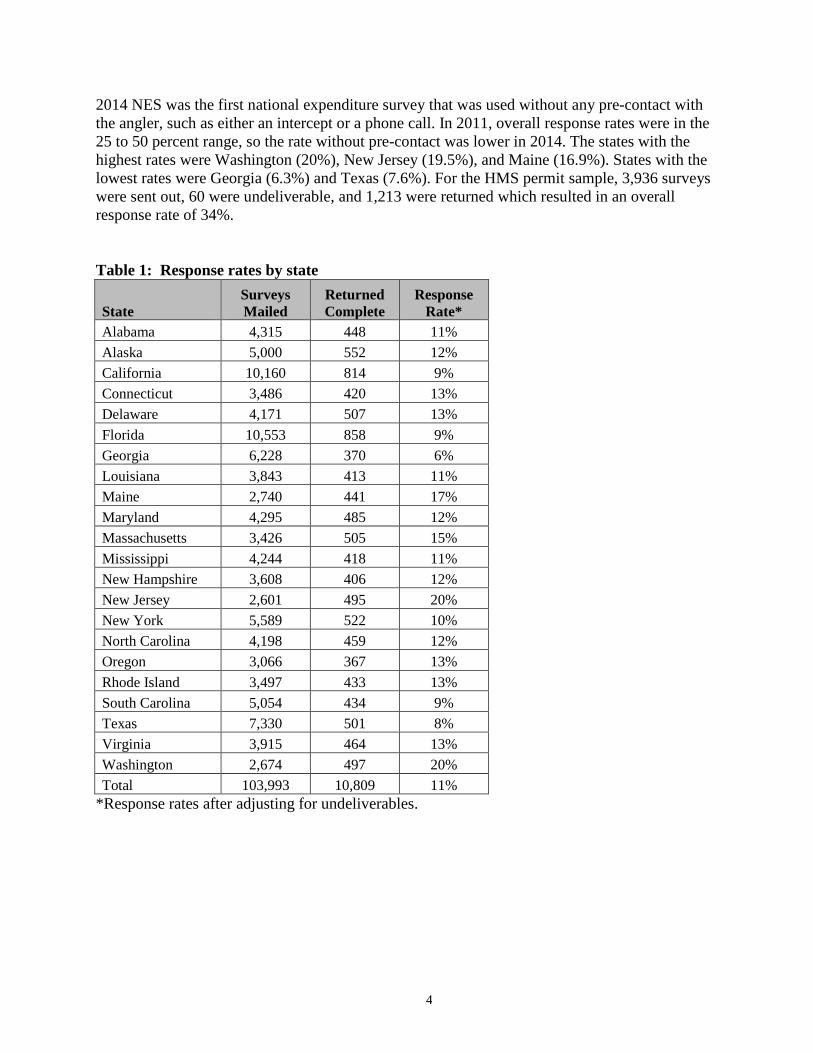
III. RESPONSE RATES AND ANGLER DEMOGRAPHICS Across all states, a total of 10,809 completed surveys were returned. The survey effort was successful in terms of meeting the goal of 10,548 surveys returned. Table 1 shows the number of surveys sent and completed by state and nationwide. A total of 103,993 anglers where sent an invitation to participate in the survey. All but 7,832 were delivered to the angler’s address, which represents 7.5 percent of the total mailing. This rate is in line with mailings of this type. A total of 96,161 anglers received the survey and just over 11 percent returned a completed survey. The
4
2014 NES was the first national expenditure survey that was used without any pre-contact with the angler, such as either an intercept or a phone call. In 2011, overall response rates were in the 25 to 50 percent range, so the rate without pre-contact was lower in 2014. The states with the highest rates were Washington (20%), New Jersey (19.5%), and Maine (16.9%). States with the lowest rates were Georgia (6.3%) and Texas (7.6%). For the HMS permit sample, 3,936 surveys were sent out, 60 were undeliverable, and 1,213 were returned which resulted in an overall response rate of 34%. Table 1: Response rates by state
State Surveys Mailed
Returned Complete
Response Rate*
Alabama 4,315 448 11% Alaska 5,000 552 12% California 10,160 814 9% Connecticut 3,486 420 13% Delaware 4,171 507 13% Florida 10,553 858 9% Georgia 6,228 370 6% Louisiana 3,843 413 11% Maine 2,740 441 17% Maryland 4,295 485 12% Massachusetts 3,426 505 15% Mississippi 4,244 418 11% New Hampshire 3,608 406 12% New Jersey 2,601 495 20% New York 5,589 522 10% North Carolina 4,198 459 12% Oregon 3,066 367 13% Rhode Island 3,497 433 13% South Carolina 5,054 434 9% Texas 7,330 501 8% Virginia 3,915 464 13% Washington 2,674 497 20% Total 103,993 10,809 11%
*Response rates after adjusting for undeliverables.
5
For the state samples, survey results indicate that marine saltwater anglers fished 28 days in the past year on average, and had 32 years of fishing experience (Table 3). Just over 85 percent of anglers were male, 93% were Caucasian, and their average age was 54 years old. On average, they worked 30 hours per week for pay. Less than 7% of anglers made under $20,000 per year, and 57% made between $20,000 and $100,000 per year. Thirty-six percent made over $100,000 annually. Just over 27% had graduated high school and taken some college courses or had an associates or technical degree, 26% had a bachelor’s degree, and 18% had advanced degrees or coursework such as a doctorate, law degree, or medical degree. On the California questionnaire, anglers were asked what percentage of their expenditures were made in Northern California (counties north of Santa Barbara), Southern California1, or out of state. On average, California anglers made 55% of their expenditures in Southern California, 37% in Northern California and 9% outside the state. They reported fishing 9 days on average in Northern California and 17 days in Southern California. In Florida, anglers spent an average 21 days fishing in the Gulf of Mexico and 14 days fishing in the Atlantic Ocean. Table 2: Characteristics of U.S. anglers2 Variable Mean Std Error Days fished in past 12 months 27.8 0.66 Percent Male 85.5% NA Age 53.5 1.31 Years of saltwater fishing 31.5 0.26 Hours worked per week 29.9 0.30
For the HMS sample, survey results indicate that HMS anglers spent 37 days salwater fishing in the previous year of which 12 (32%) were spent pursuing HMS. Significant differences were found between HMS anglers in the Southeast and Northeast for both total days of marine angling (SE = 41 days ± 3 days; NE = 34 days ± 2 days; p < 0.001) and days of HMS angling (SE = 18 days ± 2 days; NE = 9 days ± 1 day; p < 0.001) in 2014. HMS anglers in the Southeast also spent a greater (41%) percentage of their fishing trips pursuing HMS compared to HMS anglers in the Northeast (26%). This is likely due to the fact that there are more species of HMS present in the Southeast, and many of them (e.g., sharks, swordfish) can be found closer to shore making them more accessable. HMS anglers averaged 37 years of saltwater fishing experience, and this was fairly constant between the Northeast (38 years) and Southeast (36 years). Nearly 98 percent of permited HMS anglers were Caucasian males, and the average age was 57 years old. Less than 1% of permited HMS anglers made under $20,000 per year, and only 29% made between $20,000 and $100,000 per year. Seventy percent made over $100,000 annually, more than twice the percentage for overall marine anglers. This is not entirely unexpected as the HMS Angling permit is a boat permit, and most HMS (excluding coastal sharks) are offshore
1 San Diego, Imperial, Orange, Riverside, Los Angeles, San Bernadino, Ventura, and Santa Barbara counties. 2 Note that the HMS permit holders are not included in this table.
6
pelagics that require the use of larger vessels to pursue them. Twenty-five percent of HMS anglers had advanced degrees or coursework such as a doctorate, law degree, or medical degree, 31% had a bachelor’s degree, and a little over 20% had less than a bachelor’s degree.
IV. ESTIMATION OF ANGLER EXPENDITURES Mean durable expenditures were estimated by state and resident status for each durable expenditure category on the survey. Anglers were asked to estimate the percent of time that they used the items for marine fishing and the percentage spent in the survey state. The percentages were then multiplied by the expenditure amount in order to get the amount attributed to marine fishing spent in the survey state. Only durable goods used primarily for marine fishing (50% or over) were included. For any items that anglers reported using less than 50% of the time for marine fishing, expenditures were recoded to zero. Given the length and detail of the survey, it was anticipated that respondents were likely to save time by leaving some questions blank if they did not have an expense. In order to correctly capture zero expenditures, the questionnaire instructed respondents to write zero if they spent nothing for an item. Additionally, screening questions were added to the survey for every grouping of expenditure categories. A set of coding rules was implemented to cover various combinations of answers to the screening questions and for filling in missing values to the subsequent expenditure questions. In general, if an angler indicated in the screening question that he/she had expenditures in a given category (i.e., fishing tackle or gear), then all subsequent missing responses for each of the individual expense items within that group were coded as zeros. For respondents that provided negative responses to the screening questions, all subsequent missing responses were coded as zeros. If at least one of the individual expense categories within a group was non-zero but others were left blank, these missing values were replaced by zeros. Missing values for either the percentage of usage for marine fishing or for the percentage spent in the state were replaced with the appropriate average values (stratified by resident status). For calculating economic impacts, only those expenditures that generate new economic activity matter. Angler purchases of used goods from private parties do not generate any new economic activity and are considered transfer payments from one household to another. Respondents were asked if purchases of boats, boat accessories, vehicles, and second homes were made new or used, from dealers or private parties, or were financed. If one of these items was purchased new within the survey state, then the purchase price was included in the estimation procedures. If, however, any of these items were purchased used from a private party and not financed, the expenditure was not included. If the purchase was financed, regardless of whether used or new, financed charges were assumed to be 2% of the loan principal. To calculate the loan principal and the 2014 interest payment to the banking sector for boats, vehicles, and homes, micro-data from the 2013 Consumer Expenditure Survey (CES) for each of these expenditure categories were used to calculate the average loan term, the average principal balance, and the average interest rate (CES 2013). Amortization equations were used to develop the additional categories for each respondent purchasing a financed boat, boat accessory, vehicle, or second home. Additionally, for second homes, the average U.S. property tax was obtained from the Tax
7
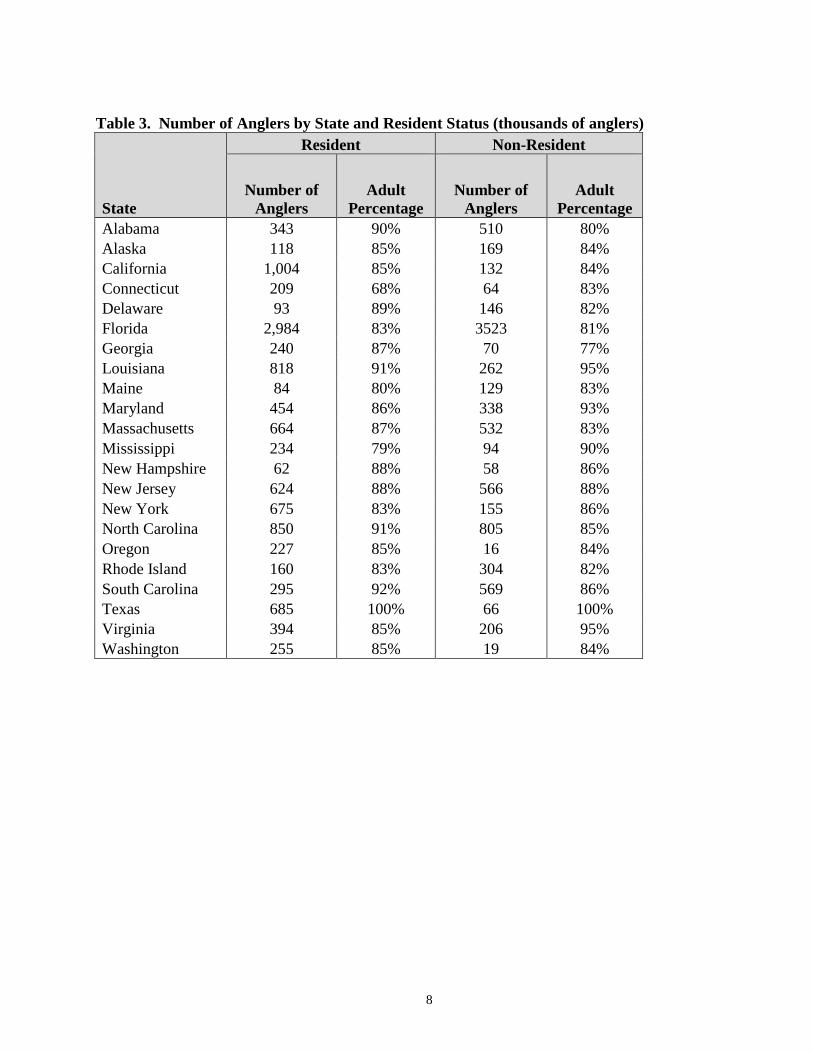
Foundation (Tax Foundation, 2012). Real estate commissions from home purchases were assumed to be 6%. Outliers within each expenditure category were removed from the data set for state level mean expenditures. The decision rule for outliers allowed strata with low variances to remain intact while strata with high variances had outliers removed. Initial weighted mean estimates for all expenditures categories were generated using the Proc Surveymeans procedure in SAS (SAS Version 9.4, 2011) and any strata/category combination with a proportion of standard error (PSE) greater than 20% had the upper 1% of its distribution truncated. Mean expenditures by state, resident status, and expenditure category are provided in tables at the end of this report. Note that the total annual mean expenditure shown in each table is calculated as the sum of the individual expenditure categories. The total shown in the table may not exactly match the sum of the individual category means shown in the table due to rounding after the total was cacluated in SAS. Total annual durable expenditures were estimated by multiplying mean durable expenditures in each category by the estimated annual number of adult participants in a given state and resident stratum. For the Atlantic and Gulf Coast states, the annual number of adult participants was calculated by multiplying the MRIP estimates of participation in a given stratum by the percentage of adults in that same stratum. The percentage of adults was calculated from the percentage of adult effort in the same stratum. Estimates of total participation for California, Oregon and Washington were provided by RecFin (Hibsch, 2014). Alaska participation was provided by the Alaska Department of Fish and Game. Estimates of participation for Texas were based on estimates provided from the US Fish and Wildlife Service because Texas does not produce state level estimates of angler participation and does not participate in the MRIP program. Table 3 provides the 2011 adult participation totals by state and resident status.
8
Table 3. Number of Anglers by State and Resident Status (thousands of anglers)
State
Resident Non-Resident
Number of Anglers
Adult Percentage
Number of Anglers
Adult Percentage
Alabama 343 90% 510 80% Alaska 118 85% 169 84% California 1,004 85% 132 84% Connecticut 209 68% 64 83% Delaware 93 89% 146 82% Florida 2,984 83% 3523 81% Georgia 240 87% 70 77% Louisiana 818 91% 262 95% Maine 84 80% 129 83% Maryland 454 86% 338 93% Massachusetts 664 87% 532 83% Mississippi 234 79% 94 90% New Hampshire 62 88% 58 86% New Jersey 624 88% 566 88% New York 675 83% 155 86% North Carolina 850 91% 805 85% Oregon 227 85% 16 84% Rhode Island 160 83% 304 82% South Carolina 295 92% 569 86% Texas 685 100% 66 100% Virginia 394 85% 206 95% Washington 255 85% 19 84%
9
In order to estimate durable expenditures at the U.S. level, mean durable resident expenditures for the U.S. were first calculated and then multiplied by total adult resident participants rather than simply summing over state level expenditures. This allowed for the expenditures, regardless of whether or not they were purchased in the survey state, to be included in the estimation. Outlier removal followed the same procedures as the state level, with the exception of new and used boats and related expenditures, vehicles and related expenditures, and second homes and related expenditures. Visual inspection of the data was used for expenditures in the top 1% and best professional judgement was used to remove any exceptionally high outliers within the top 99 percentile. Adult participation for the U.S. was calculated as the sum of state level adult resident participants. Issues arise, however, when trying to estimate total participation at the U.S. level because the non-resident estimates are not additive across states. Based on the MRIP methods for calculating participation in a given state, it is impossible to know if a non-resident participant in one coastal state is resident or non-resident participant in another coastal state. Because of the inability to assess double counting in non-resident participation in each state, only resident adult participation was used to expand the means to the U.S. total expenditure estimate. This restriction likely results in an underestimate of U.S. adult participation and durable expenditures. For the remainder of this report, U.S. total participation (9.9 million) includes only resident adult participants to avoid potential double counting of non-resident participants. In 2014, mean expenditure estimates were not calculated separately for East Florida and West Florida, but for all Florida anglers combined. This change was necessary given that the sample was drawn from the entire license frame for Florida which did not provide information on where the angler fished. In prior years, an angler’s survey was assigned to either East Florida or West Florida based on the location of the intercept screening interview. As a result of this aggregation to the entire state, caution is advised in making comparisons to the 2011 and 2006 survey results for East Florida and West Florida. Another very important change in the 2014 mean expenditure tables is how expenditures on used boats, used canoes, used vehicles, and used boat accessories are reported in the state tables. Previous NES expenditure tables included only the amount attributed to the “mark-up” or retail margin related to those expenditures when purchased from a dealer. In 2014, the decision was made to report the entire expenditure regardless if sold in a private transaction or through a dealer/retail store to more accurately represent what anglers are spending. This change resulted in what appears to be large increases in these expenditure categories compared to 2011. Used goods do not generate new economic activity when sold privately, as they are just a transfer of goods. It is only the dealer’s profit related to these sales that generates new economic activity. These profits are still accounted for in the regional input-output models as in previous years. Mean and total expenditures for the sample drawn from the Atlantic Highly Migratory Species Permit database were estimated separately from the state totals and not included in the total U.S. estimates. This likely underestimates the totals in those states with HMS anglers (Atlantic and Gulf) and at the overall U.S. level, but they were kept them separate to avoid any potential doublecounting. Mean durable expenditures and resulting economic impacts were estimated for the Northeast and Southeast Atlantic HMS regions (Table 4). HMS angler expenditures were assigned to each region based on the state in which they reported doing most of their HMS fishing. If they did not answer that question, their expenditures were assigned to the region in
10
which they lived. All HMS anglers were treated as residents within their assigned region. Anglers were asked to estimate the percent of time that they used the items for marine fishing and the percentage spent in the survey state. The percentages were then multiplied by the expenditure amount in order to get the amount attributed to marine fishing spent in the survey state. Only durable goods used primarily for marine fishing (50% or over) were included. For any items that anglers reported using less than 50% of the time for marine fishing, expenditures were recoded to zero. Furthermore, separate estimates were calculated for total marine fishing expenditures, and expenditures attributed to HMS fishing. Respondents were also asked how many days they had spent saltwater fishing in the previous 12 months and how many of those days were spent fishing for HMS. These numbers were used to estimate what percentage of each angler’s fishing effort was spent targeting HMS. This ratio was then used to calculate separate estimates of durable good expenditures that could be minimally credited to HMS fishing. This allowed us to generate separate estimates of the economic impact of durable good expenditures by HMS Angling Permit holders for marine recreational fishing overall and HMS fishing specifically. Total annual marine angling durable good expenditures per category were estimated by extrapolating the estimated mean expenditures by the number of Atlantic HMS Angling permit holders from the Northeast (N = 11,836) and Southeast (N = 7,540). Table 4. States included in each Atlantic HMS region, and number of permit holders by state and region. Northeast Southeast State Number of
Permit Holders State Number of
Permit Holders Maine 325 North Carolina 1,184 New Hampshire 297 South Carolina 524 Vermont 28 Georgia 207 Massachusetts 2,339 Florida 3,607 Rhode Island 381 Alabama 364 Connecticut 652 Mississippi 232 New York 1,762 Louisiana 711 New Jersey 2,476 Texas 711 Pennsylvania 1,017 Delaware 451 Maryland 968 Virginia 1,140 District of Columbia 5 Total 11,836 Total 7,540
11
V. ECONOMIC CONTRIBUTION ANAYLSIS
The input-output model used in this report generates four different metrics, commonly referred to as impacts or economic contributions, for assessing the contributions to a region’s economy from expenditures on marine recreational fishing. The different measures are:
• Output is the gross value of sales by regional businesses affected by an activity. In the rest of the document, the terms “sales impacts” and “output impacts” are used interchangeably.
• Labor income includes personal income (wages and salaries) and proprietors’ income (income from self-employment).
• Value-added is the contribution made to the gross domestic product in a region. • Employment is specified on the basis of full-time and part-time jobs. There is significant
part-time and seasonal employment in commercial and recreational fishing and many other industries.
The first three types are measured in terms of dollars, whereas employment impacts are measured in terms of number of jobs. Additionally, the four categories of impacts are not independent and it is important to note that adding them together would result in some double counting of impacts. Throughout this report, the results of the input-output analyses are referred to as either “economic contributions” or “economic impacts” with no implied distinction in the terms. The economic contributions of angler expenditures extend beyond the direct purchases anglers make on fishing trips or for fishing related goods. The effects of these expenditures can be classified as: (1) direct, (2) indirect, or (3) induced. Direct effects occur when anglers spend money at retail and service oriented fishing businesses. Indirect effects occur when recreational fishing retail and service sectors purchase business supplies from wholesale trade businesses and manufacturers, and pay operating expenditures. These secondary industries, in turn, purchase additional supplies and this cycle of industry to industry purchasing continues until all indirect effects are derived from outside the region of interest (Steinback, Gentner, and Castle 2004). Payments for goods and services produced outside of the study area (i.e., outside state lines) are excluded because these effects impact businesses located in other regions. Induced effects occur when employees in the direct and indirect sectors make purchases from retailers and service establishments in the normal course of household consumption. The summation of the direct, indirect, and induced multiplier effects represent the total economic contributions or impacts generated from marine sportfishing expenditures to the overall regional economy. The commercially available regional input-output model called IMPLAN (Minnesota IMPLAN Group, Inc., 2012) was used to estimate the economic contributions of marine recreational fishing. The IMPLAN software is a widely used, nationally recognized tool. For this report, IMPLAN Version 3 software was used in combination with IMPLAN 2012 base year data, which provides detailed purchasing information for 440 industrial and retail sectors. The modeling process followed the same procedures as in the 2011 NES. For more information see Lovell, Steinback, and Hilger (2013).
12
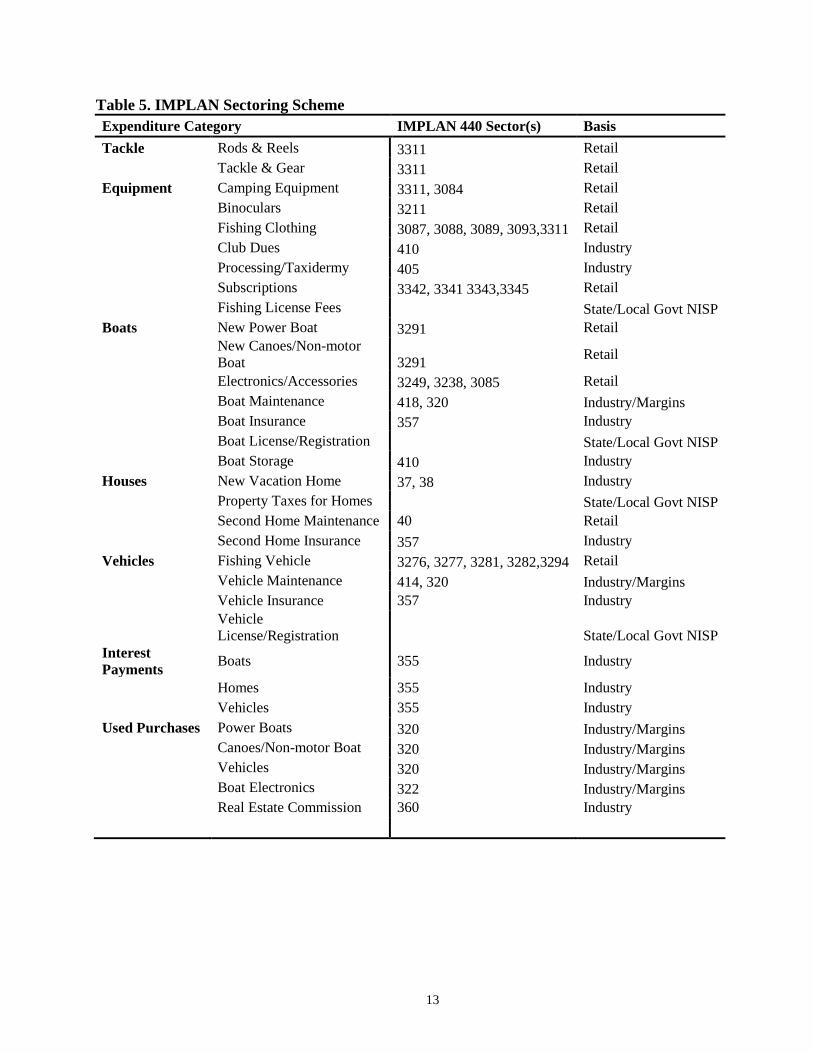
In order to accurately analyze the economic impacts from angler expenditures, it was necessary to match the type of expenditure with a corresponding industry or retail sector in IMPLAN. Angler expenditure categories from the 2014 NES were allocated to IMPLAN sectors based on the sectoring scheme shown in Table 5. Expenditure categories that included more than one IMPLAN sector were not aggregated to avoid the biases associated with aggregating. Instead, the expenditure in the category was distributed to individual IMPLAN sectors based on the proportion of final household demand in each sector in each state. Expenditures on boat and vehicle registrations and licenses, fishing licenses, and property taxes were allocated across sectors using IMPLAN’s State/Local Government NonEducation Institution Spending Pattern database. Note that impact estimates for a specific state measure only the impacts that occurred within that state due to marine recreational fishing expenditures in that state. Impacts that occur across states are captured in the aggregate U.S. model.
Fishing License Fees State/Local Govt NISP Boats New Power Boat 3291 Retail
New Canoes/Non-motor Boat 3291 Retail
Electronics/Accessories 3249, 3238, 3085 Retail Boat Maintenance 418, 320 Industry/Margins Boat Insurance 357 Industry Boat License/Registration State/Local Govt NISP Boat Storage 410 Industry Houses New Vacation Home 37, 38 Industry Property Taxes for Homes State/Local Govt NISP Second Home Maintenance 40 Retail Second Home Insurance 357 Industry Vehicles Fishing Vehicle 3276, 3277, 3281, 3282,3294 Retail Vehicle Maintenance 414, 320 Industry/Margins Vehicle Insurance 357 Industry
Homes 355 Industry Vehicles 355 Industry Used Purchases Power Boats 320 Industry/Margins Canoes/Non-motor Boat 320 Industry/Margins Vehicles 320 Industry/Margins Boat Electronics 322 Industry/Margins Real Estate Commission 360 Industry
14
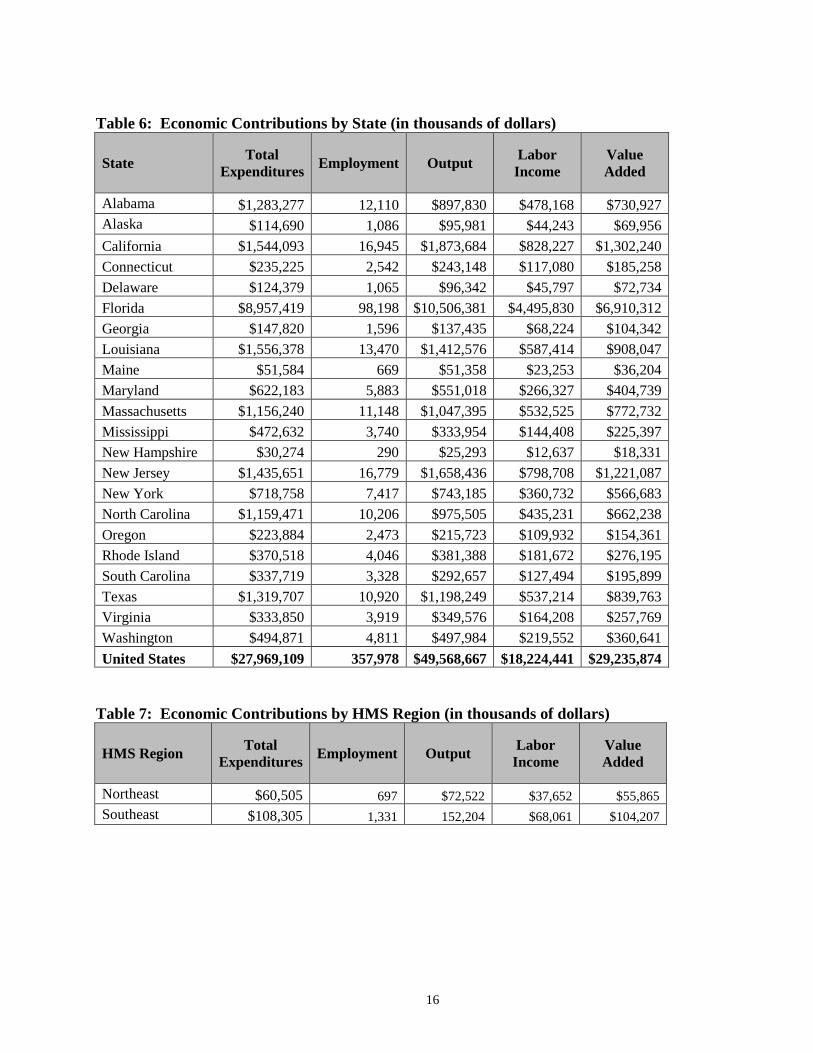
VI. RESULTS AND DISCUSSION Table 6 provides the results for total angler durable expenditures and economic contributions by state and for the U.S. and Table 7 provides results for the HMS permit holders by region. At the U.S. level, anglers spent $28 billion on durable goods used for marine recreational fishing, which supported over 358 thousand jobs and $49.6 billion in output. At the national level, the contribution to output supported from angler spending on durable goods in 2014 increased 4% compared to the inflation-adjusted estimates shown in Lovell et al. (2013) for the U.S. in 2011 ($47.8 billion).3 The total income impacts produced from angler expenditures, after adjusting for inflation, increased from $15.7 billion in 2011 to $18.2 billion in 2014. Value-added impacts increased to $29 billion from $24.8 billion, and the total employment impacts supported by angler expenditures increased 20% from 297,523 to 357,978 across the nation. Changing the reporting methods for used boats, used canoes and other non-motorized boats, used accessories, and used vehicle purchases in the mean expenditure tables below makes it appear as though the mean annual (12 month) spending on all durable goods for US resident anglers increased 41% from 2011 levels after adjusting for inflation. If these expenditure categories were to be reported using the old methods for reporting only the dealer’s profit as done in 2006 and 2011, then the change in overall annual mean spending is 23% from 2011 to 2014. The percentage change in angler spending showed wide variations across the individual expenditure categories. For example, spending on rods and reels, tackle, and fishing license fees showed increases of less than 10%. Boat insurance, new accessory purchases, and boat storage increased 36%, 41%, and 59% respectively. There were also larger changes for real estate commissions, property taxes, and second home purchase fees. The most recent data from the Bureau of Labor Statistic’s Consumer Expenditure Survey (CES) shows a slight increase in overall consumer spending in 2014 compared to 2011. Average annual expenditures by consumers on all goods and services increased by a mere 2%, after adjusting for inflation (CES 2014). However, average annual consumer spending on vehicles, which includes new and used cars, trucks, and boats, increased 18% from 2011-2014, after adjusting for inflation. This followed a 46% decrease between 2006-2011 that was likely due to the economic downturn following the 2007 recession. According to data from the National Association of Realtors, the national average sales price of existing homes increased by 13% from 2012 to 2014. In states with small sample sizes in 2011, including Alabama, Connecticut, New York, Georgia and Rhode Island, the effect of larger sample sizes in 2014 as a result of using a license frame seems to have resulted in more observations where anglers reported purchases of boats, vehicles and second homes. That is not surprising given that these expenditures are infrequent and hard to gather in smaller samples. Average annual expenditures in these states in 2014 are more similar to the value as measured at the U.S. level than it was in 2011. 3 The 2011 expenditure estimates shown were adjusted to year 2014 dollars using the Bureau of Labor Statistics’ Consumer Price Index.
15
In comparing the demographic variables in 2011 versus 2014 there were not large differences in the average age, education, or household income at the US level. Average avidity as measured by number of days fished in the past 12 months was lower in 2014 than in 2011. This may mean that the use of an all-license frame sample versus a partial license frame/intercept sample is more likely to find those less avid anglers, including those who fish more often in the private boat mode versus shore mode. Shore anglers may go more often but spend less on durable goods than those on private boats. This may lead to increased mean expenditures spent on boats and related accessories. The reader should be aware of caveats associated with the state-level impact estimates shown in this report. Separate models were constructed for each state. Therefore, the estimated impacts are limited to economic activity within a state and may underestimate the state-level effects associated with marine recreational fishing. Impacts generated through the imports of goods and services from other neighboring coastal states are not part of each individual state assessment. For example, if a retail store in Florida sold fishing tackle that was manufactured in California, the impacts associated with the production of the fishing tackle are not included in either state’s impact assessment. The associated wholesale, distribution, and retail mark-ups that occurred in Florida are included in Florida’s impact assessment, but the portion attributable to tackle manufacturing is not included in the California assessment. These cross-state effects, however, are captured in the aggregate U.S. model. The purpose of the input-output analysis was to estimate the total economic activity associated with marine angling expenditures in each coastal state and across the U.S. Therefore, expenditures by both residents and non-residents were included in the input-output analysis. In contrast to a true “economic impact” analysis that examines how changes in policies or other external factors affect the economic activity associated with changes in angler expenditures, the assessment shown here is generally described as a “contribution” analysis and simply shows the total economic contribution of marine angling expenditures to a regional economy under the conditions that existed during 2014. Often, in economic impact analysis as opposed to economic contribution analysis, spending by residents must be adjusted in the model because it is assumed that they would reallocate most of their expenditures to other sectors of the regional economy, thereby causing no net change in impacts.
16
Table 6: Economic Contributions by State (in thousands of dollars)
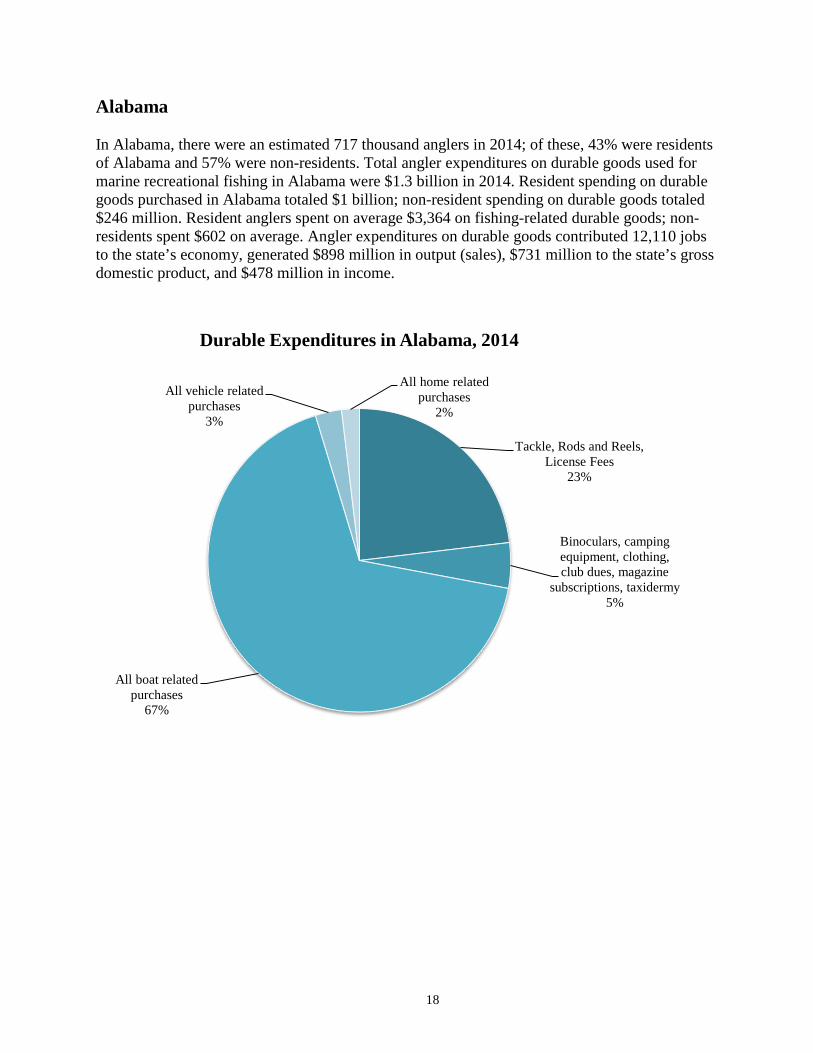
Alabama In Alabama, there were an estimated 717 thousand anglers in 2014; of these, 43% were residents of Alabama and 57% were non-residents. Total angler expenditures on durable goods used for marine recreational fishing in Alabama were $1.3 billion in 2014. Resident spending on durable goods purchased in Alabama totaled $1 billion; non-resident spending on durable goods totaled $246 million. Resident anglers spent on average $3,364 on fishing-related durable goods; non-residents spent $602 on average. Angler expenditures on durable goods contributed 12,110 jobs to the state’s economy, generated $898 million in output (sales), $731 million to the state’s gross domestic product, and $478 million in income.
Tackle, Rods and Reels, License Fees
23%
Binoculars, camping equipment, clothing, club dues, magazine
subscriptions, taxidermy 5%
All boat related purchases
67%
All vehicle related purchases
3%
All home related purchases
2%
Durable Expenditures in Alabama, 2014
19
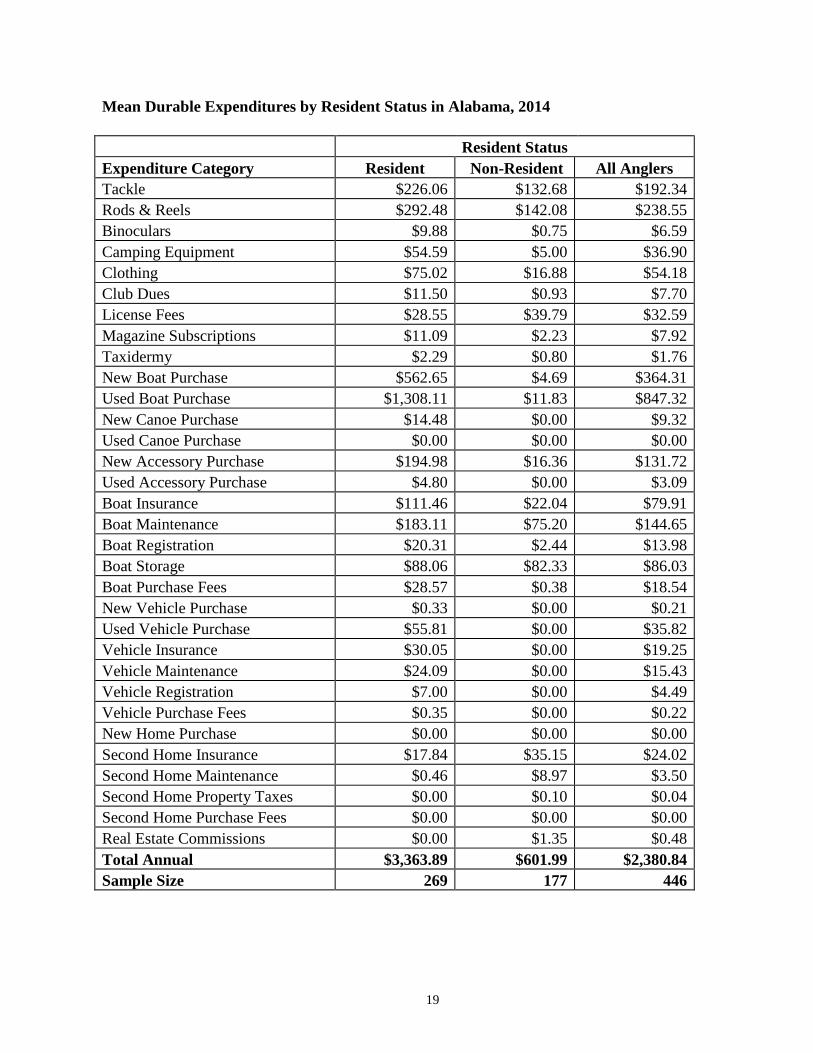
Mean Durable Expenditures by Resident Status in Alabama, 2014
Resident Status Expenditure Category Resident Non-Resident All Anglers Tackle $226.06 $132.68 $192.34 Rods & Reels $292.48 $142.08 $238.55 Binoculars $9.88 $0.75 $6.59 Camping Equipment $54.59 $5.00 $36.90 Clothing $75.02 $16.88 $54.18 Club Dues $11.50 $0.93 $7.70 License Fees $28.55 $39.79 $32.59 Magazine Subscriptions $11.09 $2.23 $7.92 Taxidermy $2.29 $0.80 $1.76 New Boat Purchase $562.65 $4.69 $364.31 Used Boat Purchase $1,308.11 $11.83 $847.32 New Canoe Purchase $14.48 $0.00 $9.32 Used Canoe Purchase $0.00 $0.00 $0.00 New Accessory Purchase $194.98 $16.36 $131.72 Used Accessory Purchase $4.80 $0.00 $3.09 Boat Insurance $111.46 $22.04 $79.91 Boat Maintenance $183.11 $75.20 $144.65 Boat Registration $20.31 $2.44 $13.98 Boat Storage $88.06 $82.33 $86.03 Boat Purchase Fees $28.57 $0.38 $18.54 New Vehicle Purchase $0.33 $0.00 $0.21 Used Vehicle Purchase $55.81 $0.00 $35.82 Vehicle Insurance $30.05 $0.00 $19.25 Vehicle Maintenance $24.09 $0.00 $15.43 Vehicle Registration $7.00 $0.00 $4.49 Vehicle Purchase Fees $0.35 $0.00 $0.22 New Home Purchase $0.00 $0.00 $0.00 Second Home Insurance $17.84 $35.15 $24.02 Second Home Maintenance $0.46 $8.97 $3.50 Second Home Property Taxes $0.00 $0.10 $0.04 Second Home Purchase Fees $0.00 $0.00 $0.00 Real Estate Commissions $0.00 $1.35 $0.48 Total Annual $3,363.89 $601.99 $2,380.84 Sample Size 269 177 446
20
Alaska In Alaska, there were an estimated 242 thousand anglers in 2014; of these, 41% were residents of Alaska and 59% were non-residents. Total angler expenditures on durable goods used for marine recreational fishing in Alaska were $115 million in 2014. Resident spending on durable goods purchased in Alaska totaled $92 million; non-resident spending on durable goods totaled $22 million. Resident anglers spent on average $923 on fishing-related durable goods; non-residents spent $157 on average. Angler expenditures on durable goods contributed 1,086 jobs to the state’s economy, generated $96 million in output (sales), $70 million to the state’s gross domestic product, and $44 million in income.
Tackle, Rods and Reels, License Fees
28%
Binoculars, camping equipment, clothing, club dues, magazine
subscriptions, taxidermy
21%
All boat related purchases
47%
All vehicle related purchases
4%
All home related purchases
0%
Durable Expenditures in Alaska, 2014
21
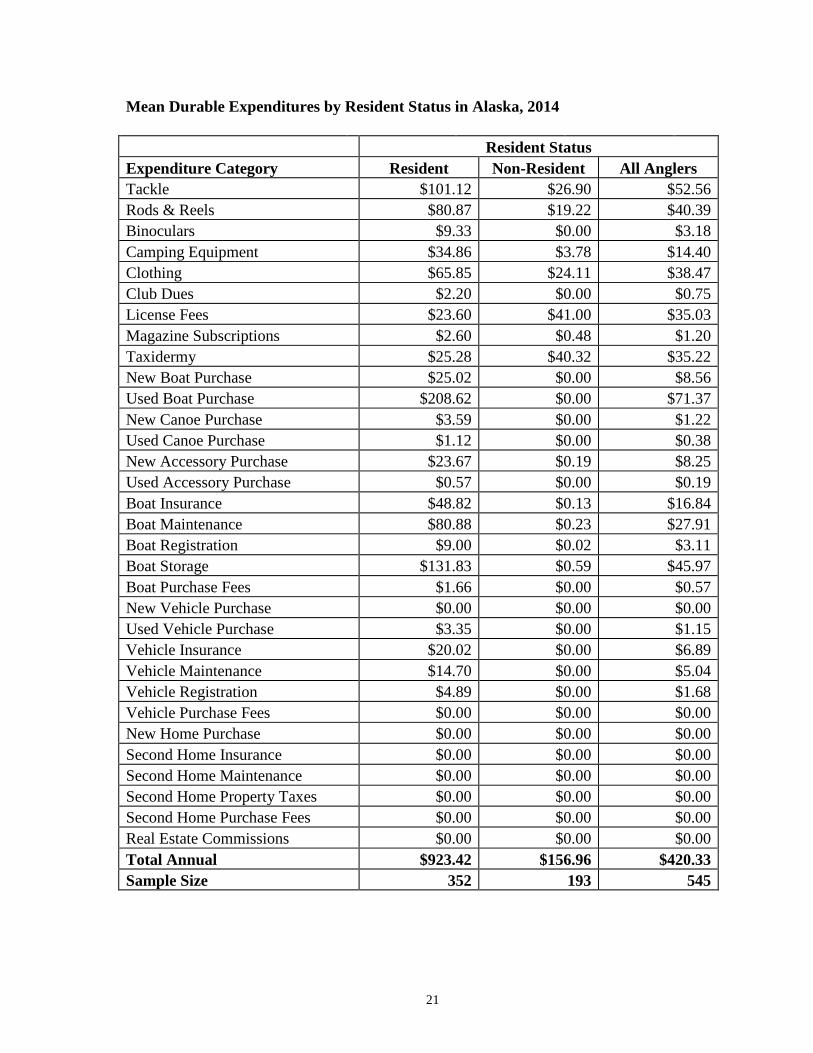
Mean Durable Expenditures by Resident Status in Alaska, 2014
Resident Status Expenditure Category Resident Non-Resident All Anglers Tackle $101.12 $26.90 $52.56 Rods & Reels $80.87 $19.22 $40.39 Binoculars $9.33 $0.00 $3.18 Camping Equipment $34.86 $3.78 $14.40 Clothing $65.85 $24.11 $38.47 Club Dues $2.20 $0.00 $0.75 License Fees $23.60 $41.00 $35.03 Magazine Subscriptions $2.60 $0.48 $1.20 Taxidermy $25.28 $40.32 $35.22 New Boat Purchase $25.02 $0.00 $8.56 Used Boat Purchase $208.62 $0.00 $71.37 New Canoe Purchase $3.59 $0.00 $1.22 Used Canoe Purchase $1.12 $0.00 $0.38 New Accessory Purchase $23.67 $0.19 $8.25 Used Accessory Purchase $0.57 $0.00 $0.19 Boat Insurance $48.82 $0.13 $16.84 Boat Maintenance $80.88 $0.23 $27.91 Boat Registration $9.00 $0.02 $3.11 Boat Storage $131.83 $0.59 $45.97 Boat Purchase Fees $1.66 $0.00 $0.57 New Vehicle Purchase $0.00 $0.00 $0.00 Used Vehicle Purchase $3.35 $0.00 $1.15 Vehicle Insurance $20.02 $0.00 $6.89 Vehicle Maintenance $14.70 $0.00 $5.04 Vehicle Registration $4.89 $0.00 $1.68 Vehicle Purchase Fees $0.00 $0.00 $0.00 New Home Purchase $0.00 $0.00 $0.00 Second Home Insurance $0.00 $0.00 $0.00 Second Home Maintenance $0.00 $0.00 $0.00 Second Home Property Taxes $0.00 $0.00 $0.00 Second Home Purchase Fees $0.00 $0.00 $0.00 Real Estate Commissions $0.00 $0.00 $0.00 Total Annual $923.42 $156.96 $420.33 Sample Size 352 193 545
22
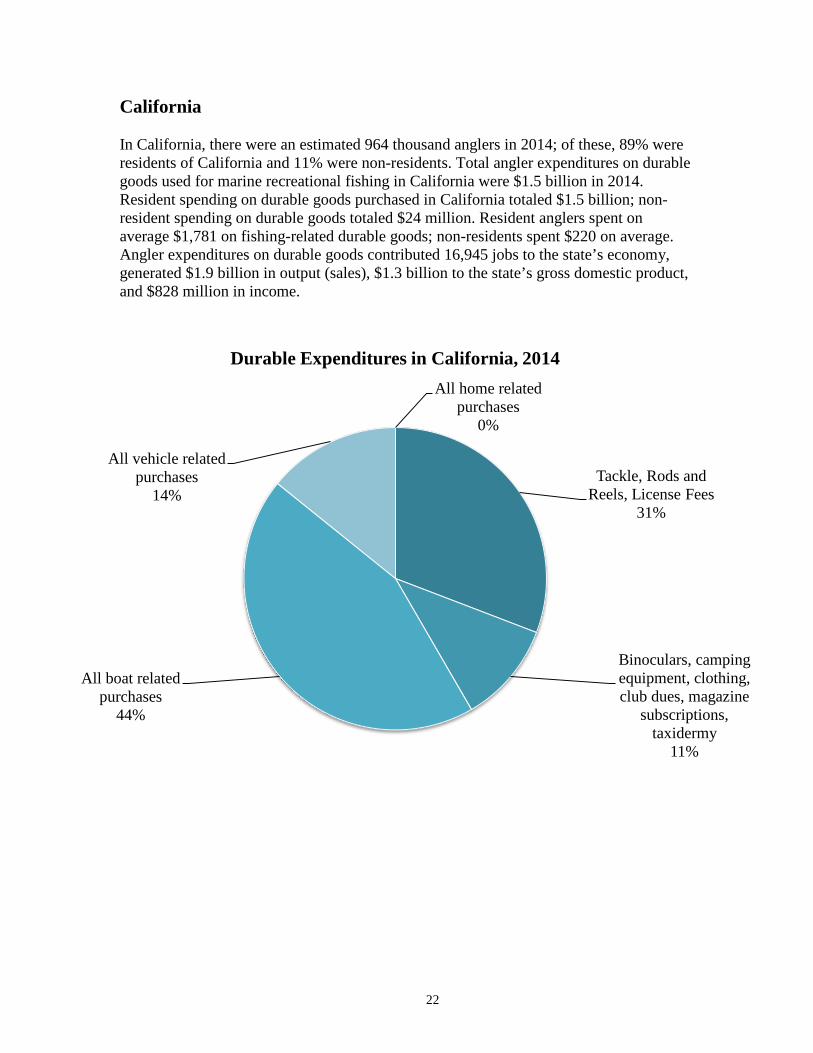
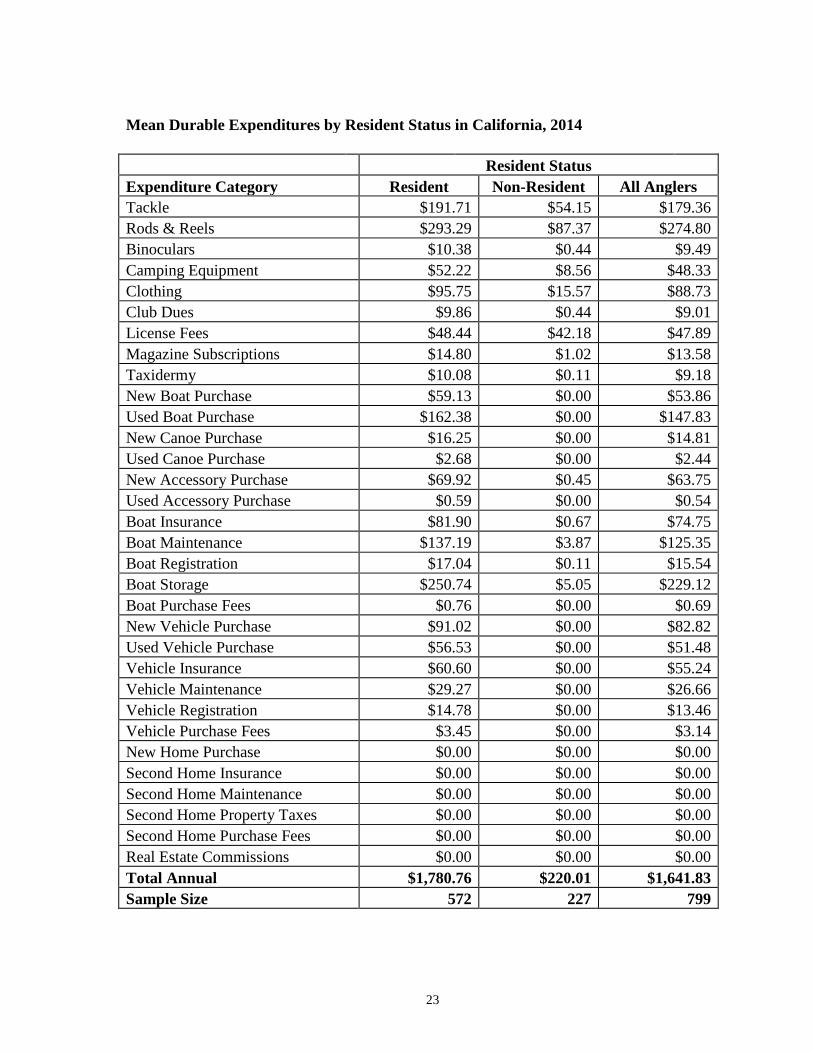
California In California, there were an estimated 964 thousand anglers in 2014; of these, 89% were residents of California and 11% were non-residents. Total angler expenditures on durable goods used for marine recreational fishing in California were $1.5 billion in 2014. Resident spending on durable goods purchased in California totaled $1.5 billion; non-resident spending on durable goods totaled $24 million. Resident anglers spent on average $1,781 on fishing-related durable goods; non-residents spent $220 on average. Angler expenditures on durable goods contributed 16,945 jobs to the state’s economy, generated $1.9 billion in output (sales), $1.3 billion to the state’s gross domestic product, and $828 million in income.
Tackle, Rods and Reels, License Fees
31%
Binoculars, camping equipment, clothing, club dues, magazine
subscriptions, taxidermy
11%
All boat related purchases
44%
All vehicle related purchases
14%
All home related purchases
0%
Durable Expenditures in California, 2014
23
Mean Durable Expenditures by Resident Status in California, 2014
Resident Status Expenditure Category Resident Non-Resident All Anglers Tackle $191.71 $54.15 $179.36 Rods & Reels $293.29 $87.37 $274.80 Binoculars $10.38 $0.44 $9.49 Camping Equipment $52.22 $8.56 $48.33 Clothing $95.75 $15.57 $88.73 Club Dues $9.86 $0.44 $9.01 License Fees $48.44 $42.18 $47.89 Magazine Subscriptions $14.80 $1.02 $13.58 Taxidermy $10.08 $0.11 $9.18 New Boat Purchase $59.13 $0.00 $53.86 Used Boat Purchase $162.38 $0.00 $147.83 New Canoe Purchase $16.25 $0.00 $14.81 Used Canoe Purchase $2.68 $0.00 $2.44 New Accessory Purchase $69.92 $0.45 $63.75 Used Accessory Purchase $0.59 $0.00 $0.54 Boat Insurance $81.90 $0.67 $74.75 Boat Maintenance $137.19 $3.87 $125.35 Boat Registration $17.04 $0.11 $15.54 Boat Storage $250.74 $5.05 $229.12 Boat Purchase Fees $0.76 $0.00 $0.69 New Vehicle Purchase $91.02 $0.00 $82.82 Used Vehicle Purchase $56.53 $0.00 $51.48 Vehicle Insurance $60.60 $0.00 $55.24 Vehicle Maintenance $29.27 $0.00 $26.66 Vehicle Registration $14.78 $0.00 $13.46 Vehicle Purchase Fees $3.45 $0.00 $3.14 New Home Purchase $0.00 $0.00 $0.00 Second Home Insurance $0.00 $0.00 $0.00 Second Home Maintenance $0.00 $0.00 $0.00 Second Home Property Taxes $0.00 $0.00 $0.00 Second Home Purchase Fees $0.00 $0.00 $0.00 Real Estate Commissions $0.00 $0.00 $0.00 Total Annual $1,780.76 $220.01 $1,641.83 Sample Size 572 227 799
24
Connecticut In Connecticut, there were an estimated 196 thousand anglers in 2014; of these, 73% were residents of Connecticut and 27% were non-residents. Total angler expenditures on durable goods used for marine recreational fishing in Connecticut were $235 million in 2014. Resident spending on durable goods purchased in Connecticut totaled $213 million; non-resident spending on durable goods totaled $22 million. Resident anglers spent on average $1,498 on fishing-related durable goods; non-residents spent $416 on average. Angler expenditures on durable goods contributed 2,542 jobs to the state’s economy, generated $243 million in output (sales), $185 million to the state’s gross domestic product, and $117 million in income.
Tackle, Rods and Reels, License Fees
24%
Binoculars, camping equipment, clothing, club dues, magazine
subscriptions, taxidermy
5% All boat related
purchases 66%
All vehicle related purchases
5%
All home related purchases
0%
Durable Expenditures in Connecticut, 2014
25
Mean Durable Expenditures by Resident Status in Connecticut, 2014
Resident Status Expenditure Category Resident Non-Resident All Anglers Tackle $114.14 $82.83 $112.66 Rods & Reels $191.16 $98.14 $186.75 Binoculars $4.46 $0.00 $4.24 Camping Equipment $14.50 $1.93 $13.90 Clothing $38.01 $16.23 $36.98 Club Dues $6.40 $1.90 $6.18 License Fees $11.23 $17.55 $11.54 Magazine Subscriptions $10.91 $2.27 $10.50 Taxidermy $0.00 $0.00 $0.00 New Boat Purchase $89.58 $0.00 $85.27 Used Boat Purchase $169.23 $0.00 $161.10 New Canoe Purchase $4.72 $0.00 $4.49 Used Canoe Purchase $2.80 $0.00 $2.67 New Accessory Purchase $72.99 $17.11 $70.30 Used Accessory Purchase $0.41 $0.00 $0.39 Boat Insurance $93.88 $16.33 $90.20 Boat Maintenance $138.41 $53.13 $134.31 Boat Registration $21.27 $3.69 $20.43 Boat Storage $431.28 $104.69 $415.85 Boat Purchase Fees $2.45 $0.09 $2.34 New Vehicle Purchase $0.00 $0.00 $0.00 Used Vehicle Purchase $18.71 $0.00 $17.81 Vehicle Insurance $29.00 $0.00 $27.60 Vehicle Maintenance $26.09 $0.00 $24.84 Vehicle Registration $6.06 $0.00 $5.77 Vehicle Purchase Fees $0.00 $0.00 $0.00 New Home Purchase $0.00 $0.00 $0.00 Second Home Insurance $0.00 $0.00 $0.00 Second Home Maintenance $0.00 $0.00 $0.00 Second Home Property Taxes $0.00 $0.00 $0.00 Second Home Purchase Fees $0.00 $0.00 $0.00 Real Estate Commissions $0.00 $0.00 $0.00 Total Annual $1,497.67 $415.89 $1,446.12 Sample Size 253 167 420
26
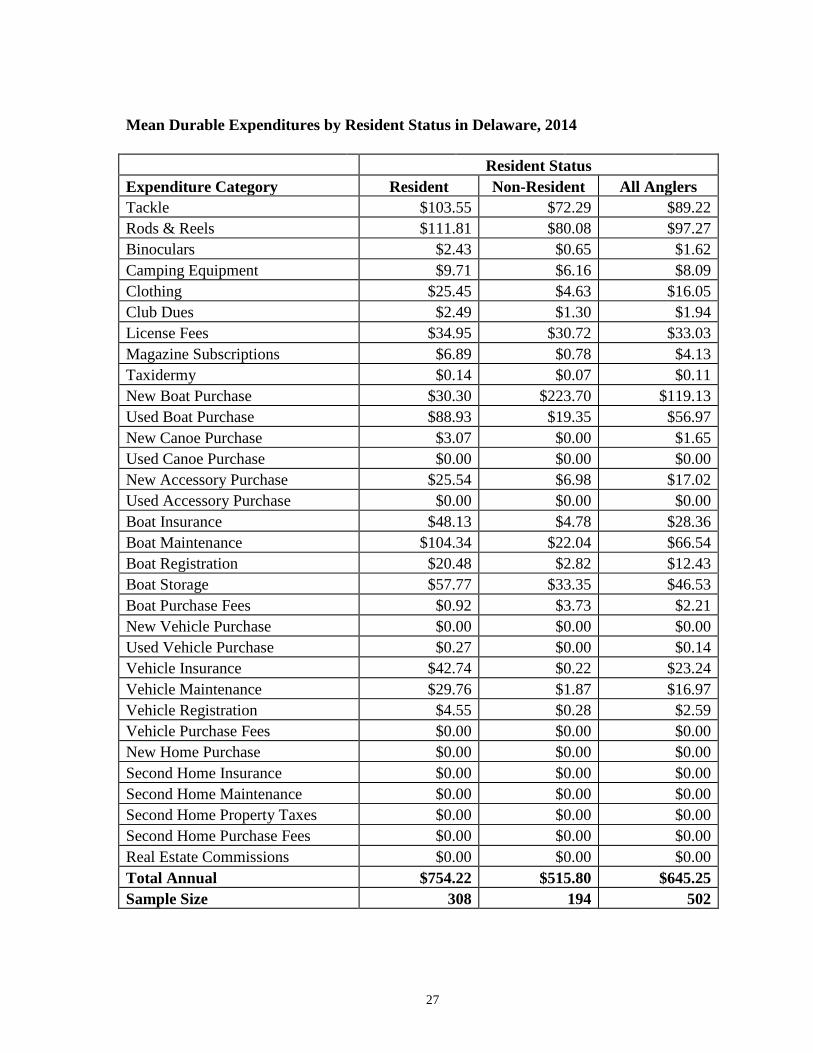
Delaware In Delaware, there were an estimated 203 thousand anglers in 2014; of these, 41% were residents of Delaware and 59% were non-residents. Total angler expenditures on durable goods used for marine recreational fishing in Delaware were $124 million in 2014. Resident spending on durable goods purchased in Delaware totaled $63 million; non-resident spending on durable goods totaled $62 million. Resident anglers spent on average $754 on fishing-related durable goods; non-residents spent $516 on average. Angler expenditures on durable goods contributed 1,065 jobs to the state’s economy, generated $96 million in output (sales), $73 million to the state’s gross domestic product, and $46 million in income.
Tackle, Rods and Reels, License Fees
34%
Binoculars, camping equipment, clothing, club dues, magazine
subscriptions, taxidermy
5%
All boat related purchases
56%
All vehicle related purchases
5%
All home related purchases
0%
Durable Expenditures in Delaware, 2014
27
Mean Durable Expenditures by Resident Status in Delaware, 2014
Resident Status Expenditure Category Resident Non-Resident All Anglers Tackle $103.55 $72.29 $89.22 Rods & Reels $111.81 $80.08 $97.27 Binoculars $2.43 $0.65 $1.62 Camping Equipment $9.71 $6.16 $8.09 Clothing $25.45 $4.63 $16.05 Club Dues $2.49 $1.30 $1.94 License Fees $34.95 $30.72 $33.03 Magazine Subscriptions $6.89 $0.78 $4.13 Taxidermy $0.14 $0.07 $0.11 New Boat Purchase $30.30 $223.70 $119.13 Used Boat Purchase $88.93 $19.35 $56.97 New Canoe Purchase $3.07 $0.00 $1.65 Used Canoe Purchase $0.00 $0.00 $0.00 New Accessory Purchase $25.54 $6.98 $17.02 Used Accessory Purchase $0.00 $0.00 $0.00 Boat Insurance $48.13 $4.78 $28.36 Boat Maintenance $104.34 $22.04 $66.54 Boat Registration $20.48 $2.82 $12.43 Boat Storage $57.77 $33.35 $46.53 Boat Purchase Fees $0.92 $3.73 $2.21 New Vehicle Purchase $0.00 $0.00 $0.00 Used Vehicle Purchase $0.27 $0.00 $0.14 Vehicle Insurance $42.74 $0.22 $23.24 Vehicle Maintenance $29.76 $1.87 $16.97 Vehicle Registration $4.55 $0.28 $2.59 Vehicle Purchase Fees $0.00 $0.00 $0.00 New Home Purchase $0.00 $0.00 $0.00 Second Home Insurance $0.00 $0.00 $0.00 Second Home Maintenance $0.00 $0.00 $0.00 Second Home Property Taxes $0.00 $0.00 $0.00 Second Home Purchase Fees $0.00 $0.00 $0.00 Real Estate Commissions $0.00 $0.00 $0.00 Total Annual $754.22 $515.80 $645.25 Sample Size 308 194 502
28
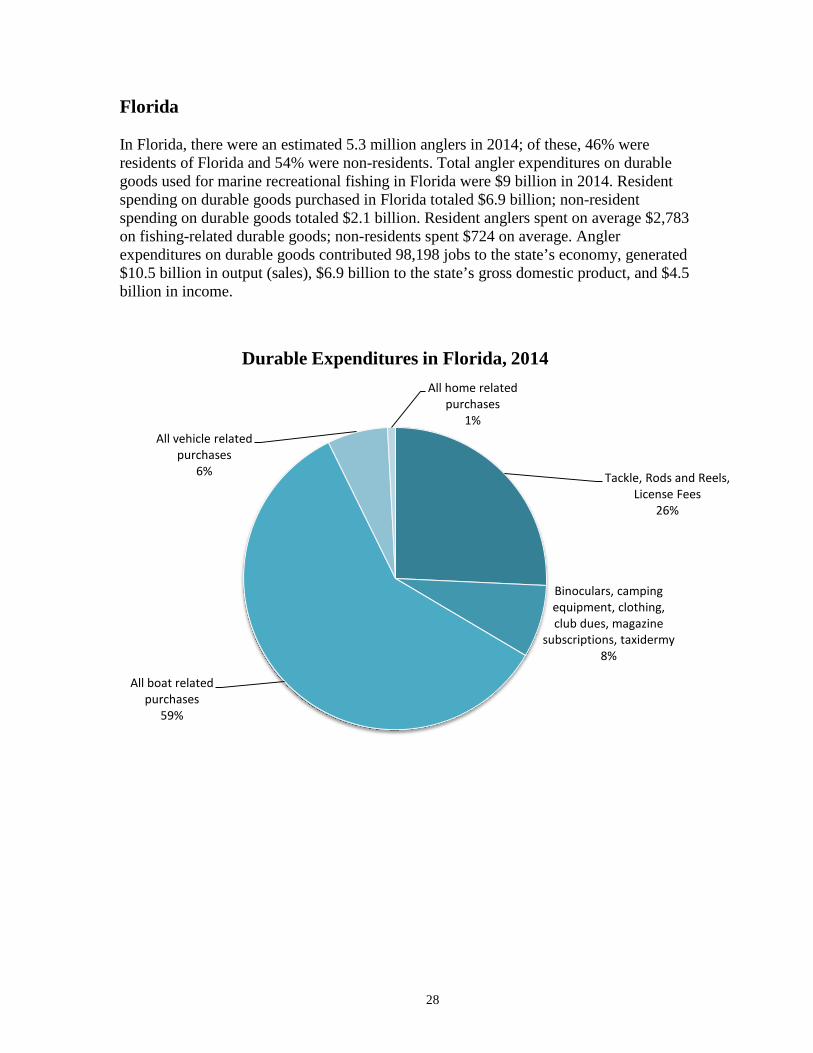
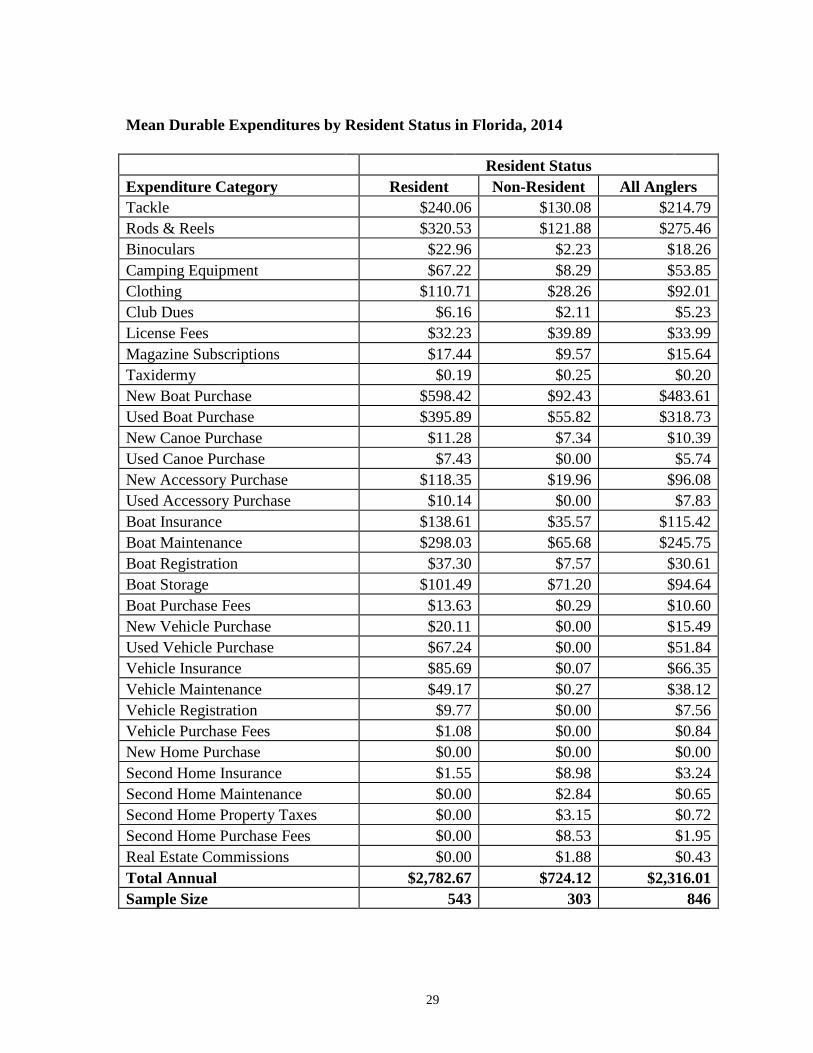
Florida In Florida, there were an estimated 5.3 million anglers in 2014; of these, 46% were residents of Florida and 54% were non-residents. Total angler expenditures on durable goods used for marine recreational fishing in Florida were $9 billion in 2014. Resident spending on durable goods purchased in Florida totaled $6.9 billion; non-resident spending on durable goods totaled $2.1 billion. Resident anglers spent on average $2,783 on fishing-related durable goods; non-residents spent $724 on average. Angler expenditures on durable goods contributed 98,198 jobs to the state’s economy, generated $10.5 billion in output (sales), $6.9 billion to the state’s gross domestic product, and $4.5 billion in income.
Tackle, Rods and Reels, License Fees
26%
Binoculars, camping equipment, clothing, club dues, magazine
subscriptions, taxidermy 8%
All boat related purchases
59%
All vehicle related purchases
6%
All home related purchases
1%
Durable Expenditures in Florida, 2014
29
Mean Durable Expenditures by Resident Status in Florida, 2014
Resident Status Expenditure Category Resident Non-Resident All Anglers Tackle $240.06 $130.08 $214.79 Rods & Reels $320.53 $121.88 $275.46 Binoculars $22.96 $2.23 $18.26 Camping Equipment $67.22 $8.29 $53.85 Clothing $110.71 $28.26 $92.01 Club Dues $6.16 $2.11 $5.23 License Fees $32.23 $39.89 $33.99 Magazine Subscriptions $17.44 $9.57 $15.64 Taxidermy $0.19 $0.25 $0.20 New Boat Purchase $598.42 $92.43 $483.61 Used Boat Purchase $395.89 $55.82 $318.73 New Canoe Purchase $11.28 $7.34 $10.39 Used Canoe Purchase $7.43 $0.00 $5.74 New Accessory Purchase $118.35 $19.96 $96.08 Used Accessory Purchase $10.14 $0.00 $7.83 Boat Insurance $138.61 $35.57 $115.42 Boat Maintenance $298.03 $65.68 $245.75 Boat Registration $37.30 $7.57 $30.61 Boat Storage $101.49 $71.20 $94.64 Boat Purchase Fees $13.63 $0.29 $10.60 New Vehicle Purchase $20.11 $0.00 $15.49 Used Vehicle Purchase $67.24 $0.00 $51.84 Vehicle Insurance $85.69 $0.07 $66.35 Vehicle Maintenance $49.17 $0.27 $38.12 Vehicle Registration $9.77 $0.00 $7.56 Vehicle Purchase Fees $1.08 $0.00 $0.84 New Home Purchase $0.00 $0.00 $0.00 Second Home Insurance $1.55 $8.98 $3.24 Second Home Maintenance $0.00 $2.84 $0.65 Second Home Property Taxes $0.00 $3.15 $0.72 Second Home Purchase Fees $0.00 $8.53 $1.95 Real Estate Commissions $0.00 $1.88 $0.43 Total Annual $2,782.67 $724.12 $2,316.01 Sample Size 543 303 846
30
Georgia In Georgia, there were an estimated 263 thousand anglers in 2014; of these, 79% were residents of Georgia and 21% were non-residents. Total angler expenditures on durable goods used for marine recreational fishing in Georgia were $148 million in 2014. Resident spending on durable goods purchased in Georgia totaled $137 million; non-resident spending on durable goods totaled $11 million. Resident anglers spent on average $658 on fishing-related durable goods; non-residents spent $195 on average. Angler expenditures on durable goods contributed 1,596 jobs to the state’s economy, generated $137 million in output (sales), $104 million to the state’s gross domestic product, and $68 million in income.
Tackle, Rods and Reels, License Fees
36%
Binoculars, camping equipment, clothing, club dues, magazine
subscriptions, taxidermy
7%
All boat related purchases
38%
All vehicle related purchases
19%
All home related
purchases 0%
Durable Expenditures in Georgia, 2014
31
Mean Durable Expenditures by Resident Status in Georgia, 2014
Resident Status Expenditure Category Resident Non-Resident All Anglers Tackle $97.94 $48.26 $93.01 Rods & Reels $112.76 $37.94 $105.43 Binoculars $0.66 $0.17 $0.62 Camping Equipment $13.03 $3.34 $12.08 Clothing $30.35 $8.58 $28.23 Club Dues $1.69 $0.83 $1.61 License Fees $13.58 $28.09 $14.98 Magazine Subscriptions $3.18 $0.92 $2.96 Taxidermy $0.02 $0.00 $0.02 New Boat Purchase $25.95 $27.69 $26.12 Used Boat Purchase $73.59 $1.01 $66.43 New Canoe Purchase $0.00 $0.64 $0.06 Used Canoe Purchase $4.78 $0.00 $4.30 New Accessory Purchase $49.09 $8.27 $45.07 Used Accessory Purchase $0.63 $0.00 $0.56 Boat Insurance $24.11 $2.26 $21.95 Boat Maintenance $46.63 $18.05 $43.81 Boat Registration $9.69 $0.65 $8.79 Boat Storage $17.13 $8.50 $16.28 Boat Purchase Fees $0.96 $0.03 $0.87 New Vehicle Purchase $0.00 $0.00 $0.00 Used Vehicle Purchase $97.79 $0.00 $88.16 Vehicle Insurance $15.22 $0.00 $13.72 Vehicle Maintenance $13.25 $0.00 $11.94 Vehicle Registration $4.77 $0.00 $4.30 Vehicle Purchase Fees $1.15 $0.00 $1.03 New Home Purchase $0.00 $0.00 $0.00 Second Home Insurance $0.00 $0.00 $0.00 Second Home Maintenance $0.00 $0.00 $0.00 Second Home Property Taxes $0.00 $0.00 $0.00 Second Home Purchase Fees $0.00 $0.00 $0.00 Real Estate Commissions $0.00 $0.00 $0.00 Total Annual $657.95 $195.25 $612.33 Sample Size 226 139 365
32
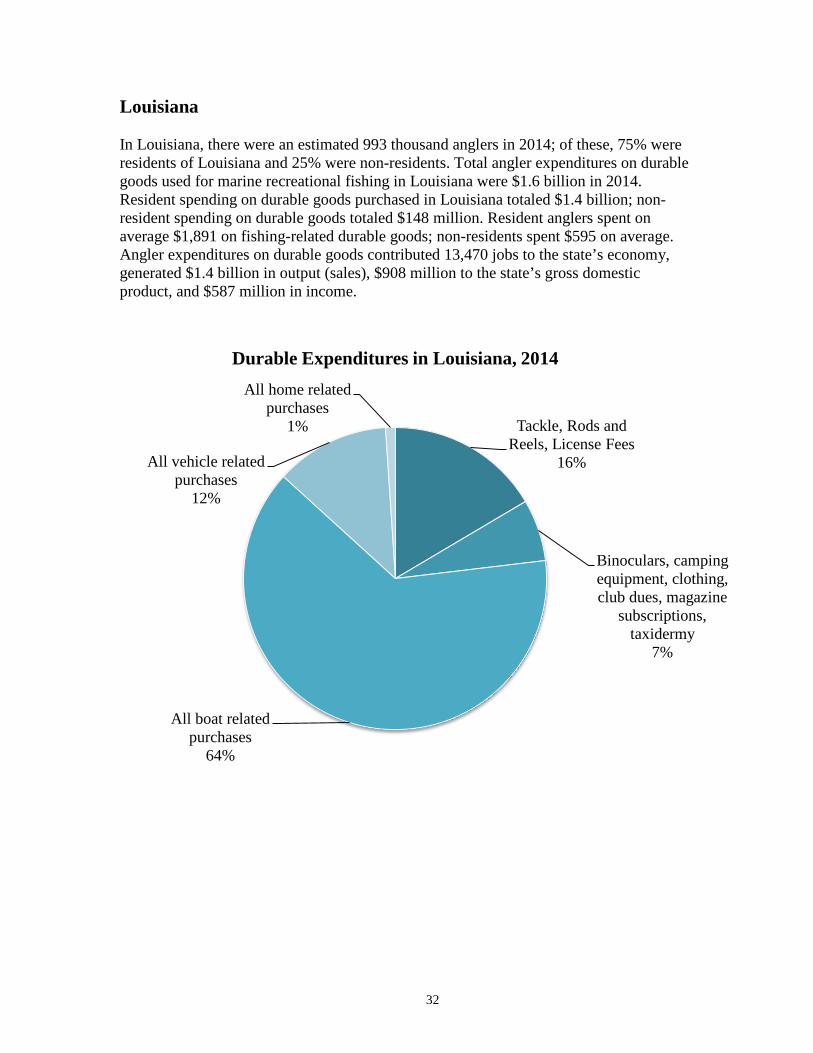
Louisiana In Louisiana, there were an estimated 993 thousand anglers in 2014; of these, 75% were residents of Louisiana and 25% were non-residents. Total angler expenditures on durable goods used for marine recreational fishing in Louisiana were $1.6 billion in 2014. Resident spending on durable goods purchased in Louisiana totaled $1.4 billion; non-resident spending on durable goods totaled $148 million. Resident anglers spent on average $1,891 on fishing-related durable goods; non-residents spent $595 on average. Angler expenditures on durable goods contributed 13,470 jobs to the state’s economy, generated $1.4 billion in output (sales), $908 million to the state’s gross domestic product, and $587 million in income.
Tackle, Rods and Reels, License Fees
16%
Binoculars, camping equipment, clothing, club dues, magazine
subscriptions, taxidermy
7%
All boat related purchases
64%
All vehicle related purchases
12%
All home related purchases
1%
Durable Expenditures in Louisiana, 2014
33
Mean Durable Expenditures by Resident Status in Louisiana, 2014
Resident Status Expenditure Category Resident Non-Resident All Anglers Tackle $155.62 $107.86 $146.45 Rods & Reels $192.42 $73.53 $169.79 Binoculars $11.66 $2.92 $9.97 Camping Equipment $44.65 $13.46 $38.73 Clothing $52.02 $32.43 $48.25 Club Dues $26.20 $6.53 $22.41 License Fees $13.64 $49.89 $20.65 Magazine Subscriptions $12.45 $3.27 $10.71 Taxidermy $5.40 $1.51 $4.65 New Boat Purchase $707.80 $370.94 $643.74 Used Boat Purchase $241.91 $82.49 $211.59 New Canoe Purchase $2.06 $6.75 $2.95 Used Canoe Purchase $0.00 $0.00 $0.00 New Accessory Purchase $119.43 $26.62 $101.96 Used Accessory Purchase $0.79 $0.00 $0.64 Boat Insurance $109.12 $1.37 $88.85 Boat Maintenance $200.97 $54.66 $173.44 Boat Registration $25.97 $0.13 $21.11 Boat Storage $58.05 $42.07 $55.01 Boat Purchase Fees $9.29 $5.62 $8.59 New Vehicle Purchase $164.78 $0.00 $132.59 Used Vehicle Purchase $51.77 $0.00 $41.70 Vehicle Insurance $67.11 $0.00 $54.00 Vehicle Maintenance $20.83 $0.50 $16.88 Vehicle Registration $5.33 $0.00 $4.29 Vehicle Purchase Fees $5.05 $0.00 $4.07 New Home Purchase $0.00 $0.00 $0.00 Second Home Insurance $8.26 $0.00 $6.67 Second Home Maintenance $18.06 $0.00 $14.58 Second Home Property Taxes $0.06 $0.00 $0.05 Second Home Purchase Fees $0.37 $0.00 $0.30 Real Estate Commissions $0.00 $0.00 $0.00 Total Annual $2,331.05 $882.54 $2,054.61 Sample Size 230 182 412
34
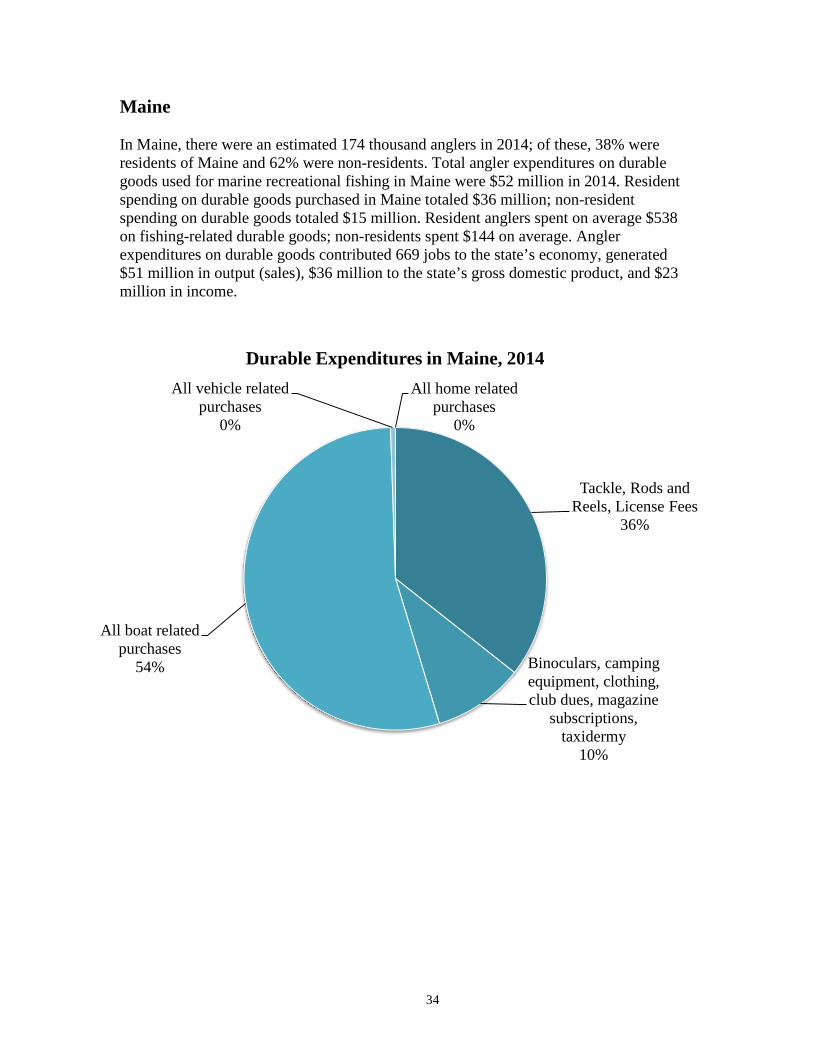
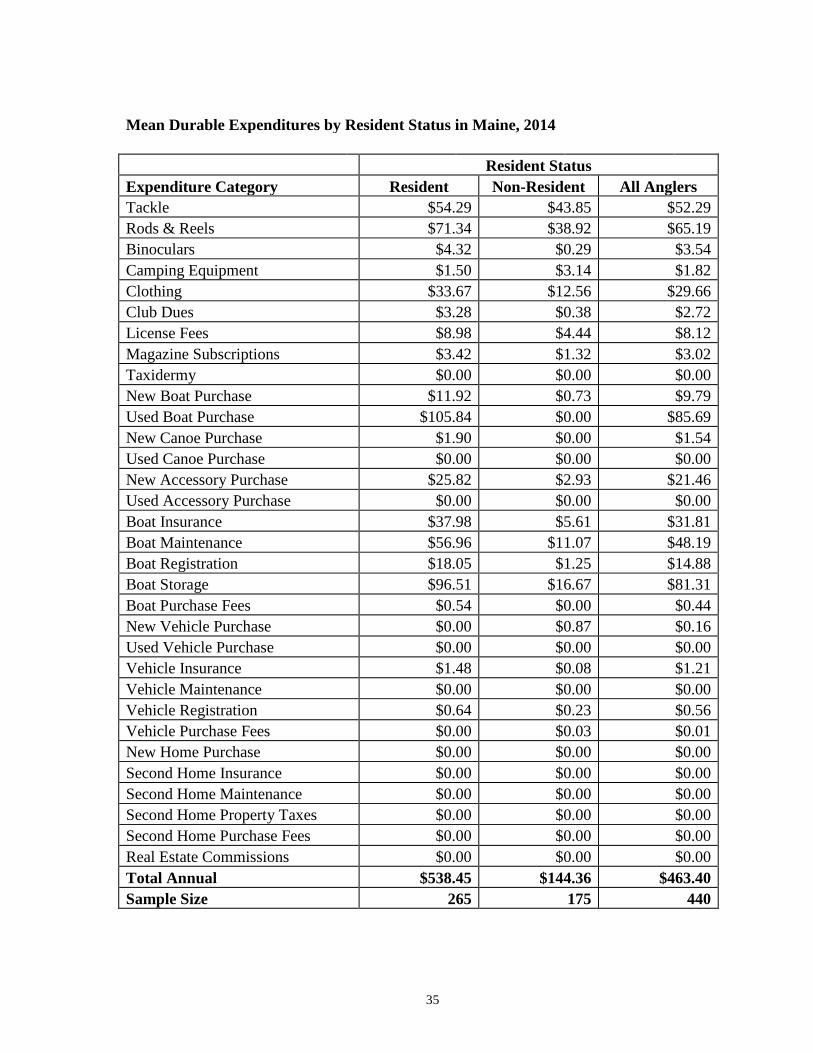
Maine In Maine, there were an estimated 174 thousand anglers in 2014; of these, 38% were residents of Maine and 62% were non-residents. Total angler expenditures on durable goods used for marine recreational fishing in Maine were $52 million in 2014. Resident spending on durable goods purchased in Maine totaled $36 million; non-resident spending on durable goods totaled $15 million. Resident anglers spent on average $538 on fishing-related durable goods; non-residents spent $144 on average. Angler expenditures on durable goods contributed 669 jobs to the state’s economy, generated $51 million in output (sales), $36 million to the state’s gross domestic product, and $23 million in income.
Tackle, Rods and Reels, License Fees
36%
Binoculars, camping equipment, clothing, club dues, magazine
subscriptions, taxidermy
10%
All boat related purchases
54%
All vehicle related purchases
0%
All home related purchases
0%
Durable Expenditures in Maine, 2014
35
Mean Durable Expenditures by Resident Status in Maine, 2014
Resident Status Expenditure Category Resident Non-Resident All Anglers Tackle $54.29 $43.85 $52.29 Rods & Reels $71.34 $38.92 $65.19 Binoculars $4.32 $0.29 $3.54 Camping Equipment $1.50 $3.14 $1.82 Clothing $33.67 $12.56 $29.66 Club Dues $3.28 $0.38 $2.72 License Fees $8.98 $4.44 $8.12 Magazine Subscriptions $3.42 $1.32 $3.02 Taxidermy $0.00 $0.00 $0.00 New Boat Purchase $11.92 $0.73 $9.79 Used Boat Purchase $105.84 $0.00 $85.69 New Canoe Purchase $1.90 $0.00 $1.54 Used Canoe Purchase $0.00 $0.00 $0.00 New Accessory Purchase $25.82 $2.93 $21.46 Used Accessory Purchase $0.00 $0.00 $0.00 Boat Insurance $37.98 $5.61 $31.81 Boat Maintenance $56.96 $11.07 $48.19 Boat Registration $18.05 $1.25 $14.88 Boat Storage $96.51 $16.67 $81.31 Boat Purchase Fees $0.54 $0.00 $0.44 New Vehicle Purchase $0.00 $0.87 $0.16 Used Vehicle Purchase $0.00 $0.00 $0.00 Vehicle Insurance $1.48 $0.08 $1.21 Vehicle Maintenance $0.00 $0.00 $0.00 Vehicle Registration $0.64 $0.23 $0.56 Vehicle Purchase Fees $0.00 $0.03 $0.01 New Home Purchase $0.00 $0.00 $0.00 Second Home Insurance $0.00 $0.00 $0.00 Second Home Maintenance $0.00 $0.00 $0.00 Second Home Property Taxes $0.00 $0.00 $0.00 Second Home Purchase Fees $0.00 $0.00 $0.00 Real Estate Commissions $0.00 $0.00 $0.00 Total Annual $538.45 $144.36 $463.40 Sample Size 265 175 440
36
Maryland In Maryland, there were an estimated 705 thousand anglers in 2014; of these, 55% were residents of Maryland and 45% were non-residents. Total angler expenditures on durable goods used for marine recreational fishing in Maryland were $622 million in 2014. Resident spending on durable goods purchased in Maryland totaled $405 million; non-resident spending on durable goods totaled $217 million. Resident anglers spent on average $1,037 on fishing-related durable goods; non-residents spent $691 on average. Angler expenditures on durable goods contributed 5,883 jobs to the state’s economy, generated $551 million in output (sales), $404 million to the state’s gross domestic product, and $266 million in income.
Tackle, Rods and Reels, License Fees
25%
Binoculars, camping equipment, clothing, club dues, magazine
subscriptions, taxidermy
6% All boat related purchases
60%
All vehicle related purchases
8%
All home related purchases
1%
Durable Expenditures in Maryland, 2014
37
Mean Durable Expenditures by Resident Status in Maryland, 2014
Resident Status Expenditure Category Resident Non-Resident All Anglers Tackle $110.60 $69.98 $100.83 Rods & Reels $122.56 $68.95 $109.66 Binoculars $6.59 $1.37 $5.34 Camping Equipment $20.07 $3.50 $16.14 Clothing $39.00 $6.63 $31.41 Club Dues $15.41 $2.12 $12.23 License Fees $35.76 $25.34 $33.27 Magazine Subscriptions $9.33 $1.75 $7.54 Taxidermy $0.00 $0.00 $0.00 New Boat Purchase $171.02 $317.42 $205.85 Used Boat Purchase $20.31 $0.00 $15.48 New Canoe Purchase $0.00 $0.00 $0.00 Used Canoe Purchase $0.00 $0.00 $0.00 New Accessory Purchase $67.71 $24.00 $57.31 Used Accessory Purchase $1.43 $0.00 $1.09 Boat Insurance $72.74 $15.19 $59.15 Boat Maintenance $103.12 $34.13 $86.83 Boat Registration $23.33 $1.99 $18.29 Boat Storage $94.93 $104.03 $97.10 Boat Purchase Fees $4.93 $2.00 $4.23 New Vehicle Purchase $0.00 $0.00 $0.00 Used Vehicle Purchase $78.79 $0.66 $60.14 Vehicle Insurance $21.86 $0.70 $16.81 Vehicle Maintenance $10.93 $0.70 $8.49 Vehicle Registration $4.83 $0.07 $3.69 Vehicle Purchase Fees $1.61 $0.00 $1.23 New Home Purchase $0.00 $0.00 $0.00 Second Home Insurance $0.00 $2.32 $0.55 Second Home Maintenance $0.00 $8.20 $1.96 Second Home Property Taxes $0.00 $0.00 $0.00 Second Home Purchase Fees $0.00 $0.00 $0.00 Real Estate Commissions $0.00 $0.00 $0.00 Total Annual $1,036.84 $691.05 $954.62 Sample Size 295 185 480
38
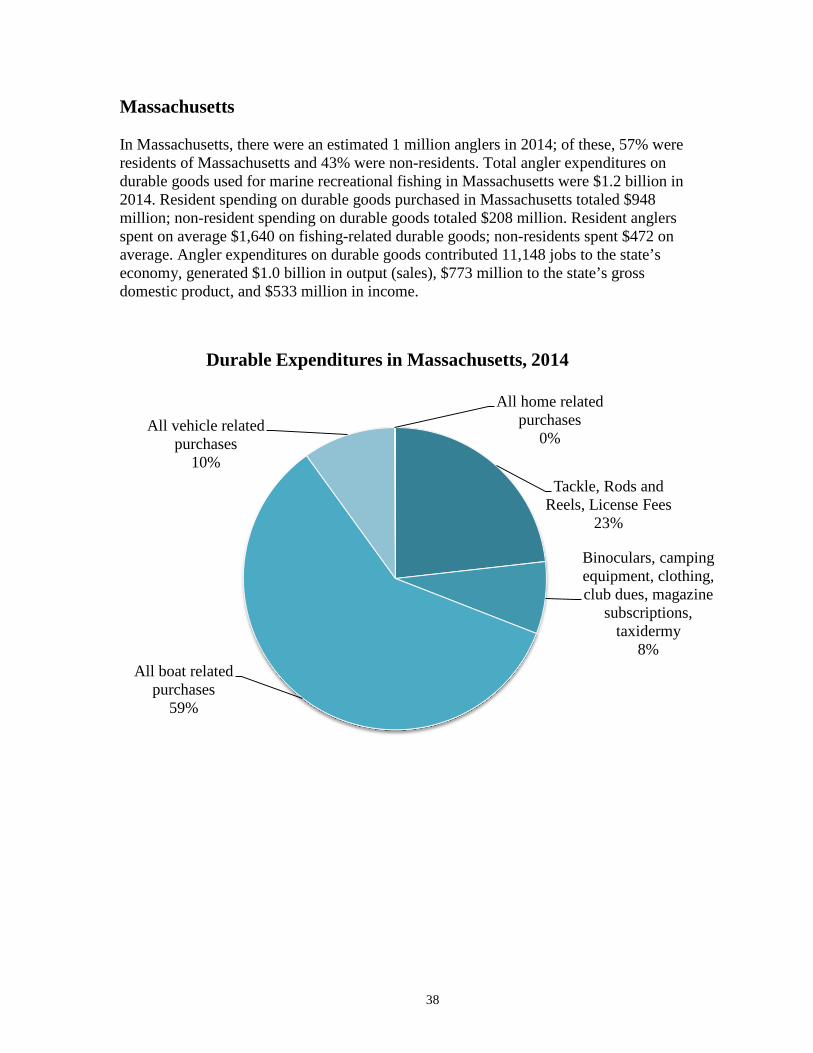
Massachusetts In Massachusetts, there were an estimated 1 million anglers in 2014; of these, 57% were residents of Massachusetts and 43% were non-residents. Total angler expenditures on durable goods used for marine recreational fishing in Massachusetts were $1.2 billion in 2014. Resident spending on durable goods purchased in Massachusetts totaled $948 million; non-resident spending on durable goods totaled $208 million. Resident anglers spent on average $1,640 on fishing-related durable goods; non-residents spent $472 on average. Angler expenditures on durable goods contributed 11,148 jobs to the state’s economy, generated $1.0 billion in output (sales), $773 million to the state’s gross domestic product, and $533 million in income.
Tackle, Rods and Reels, License Fees
23%
Binoculars, camping equipment, clothing, club dues, magazine
subscriptions, taxidermy
8% All boat related
purchases 59%
All vehicle related purchases
10%
All home related purchases
0%
Durable Expenditures in Massachusetts, 2014
39
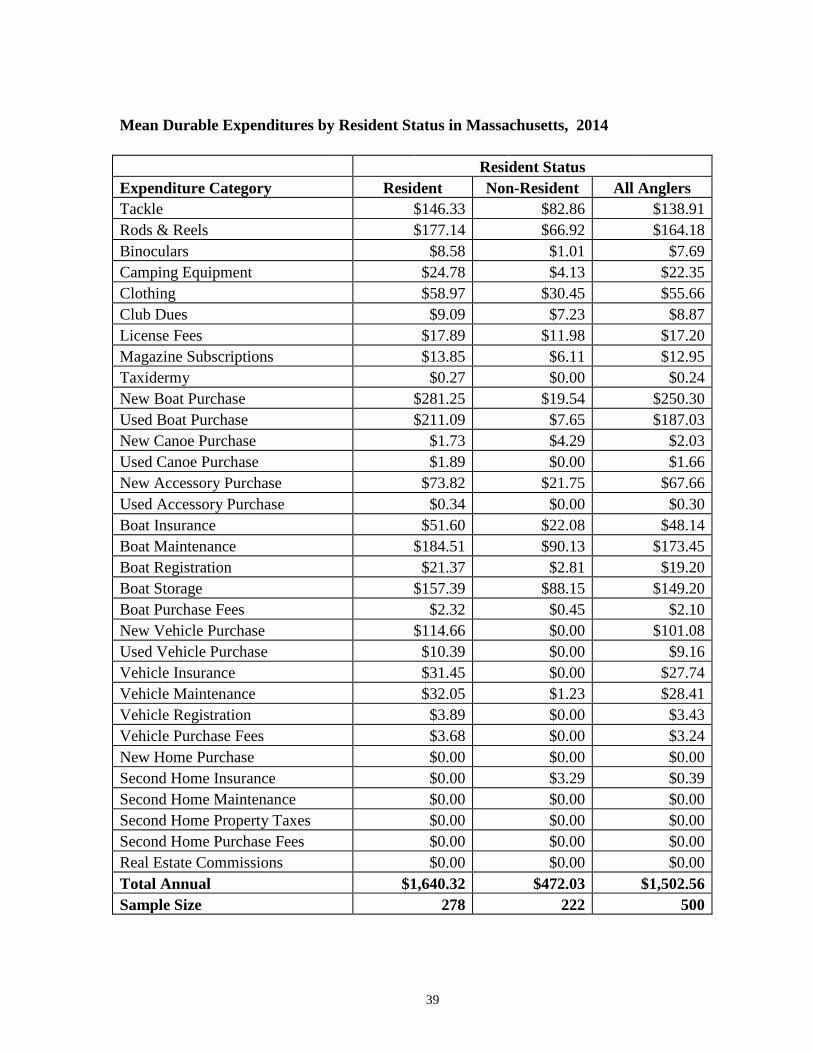
Mean Durable Expenditures by Resident Status in Massachusetts, 2014
Resident Status Expenditure Category Resident Non-Resident All Anglers Tackle $146.33 $82.86 $138.91 Rods & Reels $177.14 $66.92 $164.18 Binoculars $8.58 $1.01 $7.69 Camping Equipment $24.78 $4.13 $22.35 Clothing $58.97 $30.45 $55.66 Club Dues $9.09 $7.23 $8.87 License Fees $17.89 $11.98 $17.20 Magazine Subscriptions $13.85 $6.11 $12.95 Taxidermy $0.27 $0.00 $0.24 New Boat Purchase $281.25 $19.54 $250.30 Used Boat Purchase $211.09 $7.65 $187.03 New Canoe Purchase $1.73 $4.29 $2.03 Used Canoe Purchase $1.89 $0.00 $1.66 New Accessory Purchase $73.82 $21.75 $67.66 Used Accessory Purchase $0.34 $0.00 $0.30 Boat Insurance $51.60 $22.08 $48.14 Boat Maintenance $184.51 $90.13 $173.45 Boat Registration $21.37 $2.81 $19.20 Boat Storage $157.39 $88.15 $149.20 Boat Purchase Fees $2.32 $0.45 $2.10 New Vehicle Purchase $114.66 $0.00 $101.08 Used Vehicle Purchase $10.39 $0.00 $9.16 Vehicle Insurance $31.45 $0.00 $27.74 Vehicle Maintenance $32.05 $1.23 $28.41 Vehicle Registration $3.89 $0.00 $3.43 Vehicle Purchase Fees $3.68 $0.00 $3.24 New Home Purchase $0.00 $0.00 $0.00 Second Home Insurance $0.00 $3.29 $0.39 Second Home Maintenance $0.00 $0.00 $0.00 Second Home Property Taxes $0.00 $0.00 $0.00 Second Home Purchase Fees $0.00 $0.00 $0.00 Real Estate Commissions $0.00 $0.00 $0.00 Total Annual $1,640.32 $472.03 $1,502.56 Sample Size 278 222 500
40
Mississippi In Mississippi, there were an estimated 269 thousand anglers in 2014; of these, 69% were residents of Mississippi and 31% were non-residents. Total angler expenditures on durable goods used for marine recreational fishing in Mississippi were $473 million in 2014. Resident spending on durable goods purchased in Mississippi totaled $449 million; non-resident spending on durable goods totaled $23 million. Resident anglers spent on average $2,434 on fishing-related durable goods; non-residents spent $274 on average. Angler expenditures on durable goods contributed 3,740 jobs to the state’s economy, generated $334 million in output (sales), $225 million to the state’s gross domestic product, and $144 million in income.
Tackle, Rods and Reels, License Fees
19%
Binoculars, camping equipment, clothing, club dues, magazine
subscriptions, taxidermy
7%
All boat related purchases
57%
All vehicle related purchases
17%
All home related purchases
0%
Durable Expenditures in Mississippi, 2014
41
Mean Durable Expenditures by Resident Status in Mississippi, 2014
Resident Status Expenditure Category Resident Non-Resident All Anglers Tackle $186.99 $71.68 $169.71 Rods & Reels $197.86 $54.14 $176.67 Binoculars $7.71 $0.14 $6.55 Camping Equipment $82.80 $9.20 $71.68 Clothing $69.20 $7.47 $60.01 Club Dues $4.91 $0.53 $4.24 License Fees $24.51 $32.20 $25.67 Magazine Subscriptions $11.00 $1.60 $9.58 Taxidermy $1.01 $0.00 $0.85 New Boat Purchase $750.88 $1.93 $637.13 Used Boat Purchase $271.25 $38.93 $235.97 New Canoe Purchase $10.39 $0.00 $8.79 Used Canoe Purchase $0.00 $0.00 $0.00 New Accessory Purchase $88.57 $9.90 $76.63 Used Accessory Purchase $2.61 $0.81 $2.33 Boat Insurance $74.34 $3.99 $63.65 Boat Maintenance $152.57 $36.42 $134.93 Boat Registration $21.70 $1.60 $18.67 Boat Storage $29.65 $3.36 $25.66 Boat Purchase Fees $13.70 $0.04 $11.63 New Vehicle Purchase $18.29 $0.00 $15.46 Used Vehicle Purchase $231.48 $0.00 $196.08 Vehicle Insurance $99.40 $0.00 $84.35 Vehicle Maintenance $62.04 $0.00 $52.60 Vehicle Registration $14.99 $0.00 $12.70 Vehicle Purchase Fees $4.51 $0.00 $3.82 New Home Purchase $0.00 $0.00 $0.00 Second Home Insurance $0.82 $0.00 $0.69 Second Home Maintenance $0.70 $0.00 $0.59 Second Home Property Taxes $0.00 $0.00 $0.00 Second Home Purchase Fees $0.00 $0.00 $0.00 Real Estate Commissions $0.00 $0.00 $0.00 Total Annual $2,433.87 $273.93 $2,106.65 Sample Size 249 167 416
42
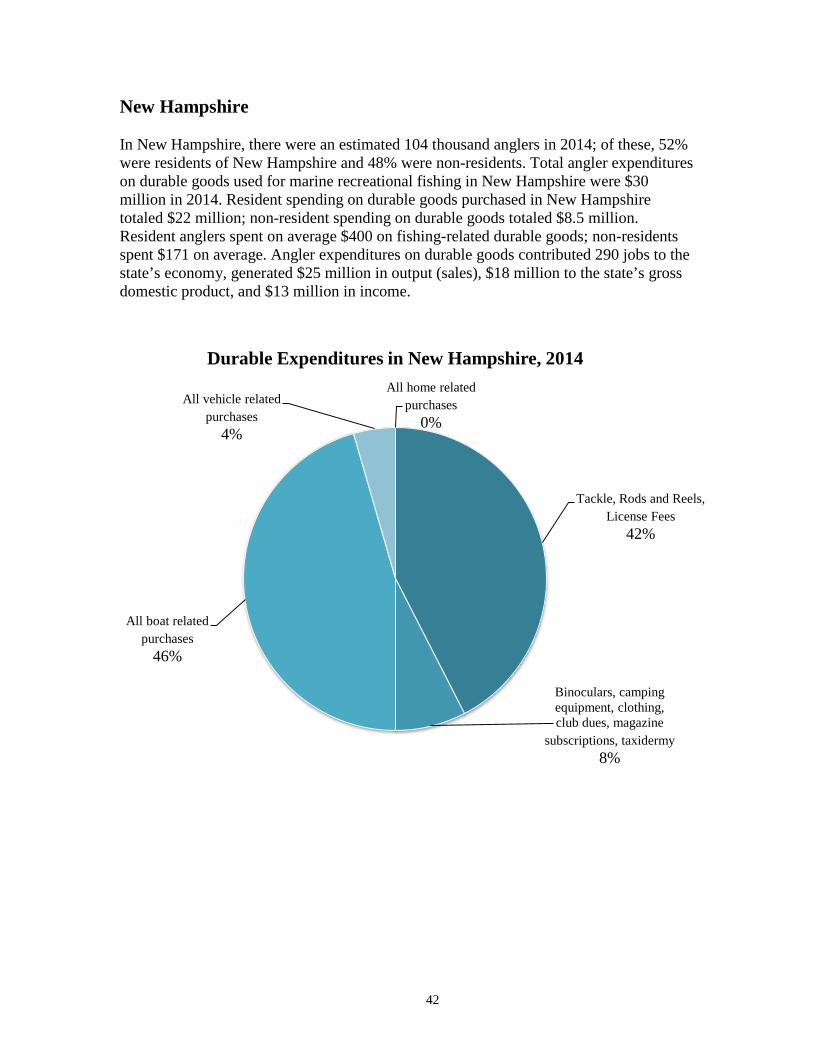
New Hampshire In New Hampshire, there were an estimated 104 thousand anglers in 2014; of these, 52% were residents of New Hampshire and 48% were non-residents. Total angler expenditures on durable goods used for marine recreational fishing in New Hampshire were $30 million in 2014. Resident spending on durable goods purchased in New Hampshire totaled $22 million; non-resident spending on durable goods totaled $8.5 million. Resident anglers spent on average $400 on fishing-related durable goods; non-residents spent $171 on average. Angler expenditures on durable goods contributed 290 jobs to the state’s economy, generated $25 million in output (sales), $18 million to the state’s gross domestic product, and $13 million in income.
Tackle, Rods and Reels, License Fees
42%
Binoculars, camping equipment, clothing, club dues, magazine
subscriptions, taxidermy 8%
All boat related purchases
46%
All vehicle related purchases
4%
All home related purchases
0%
Durable Expenditures in New Hampshire, 2014
43
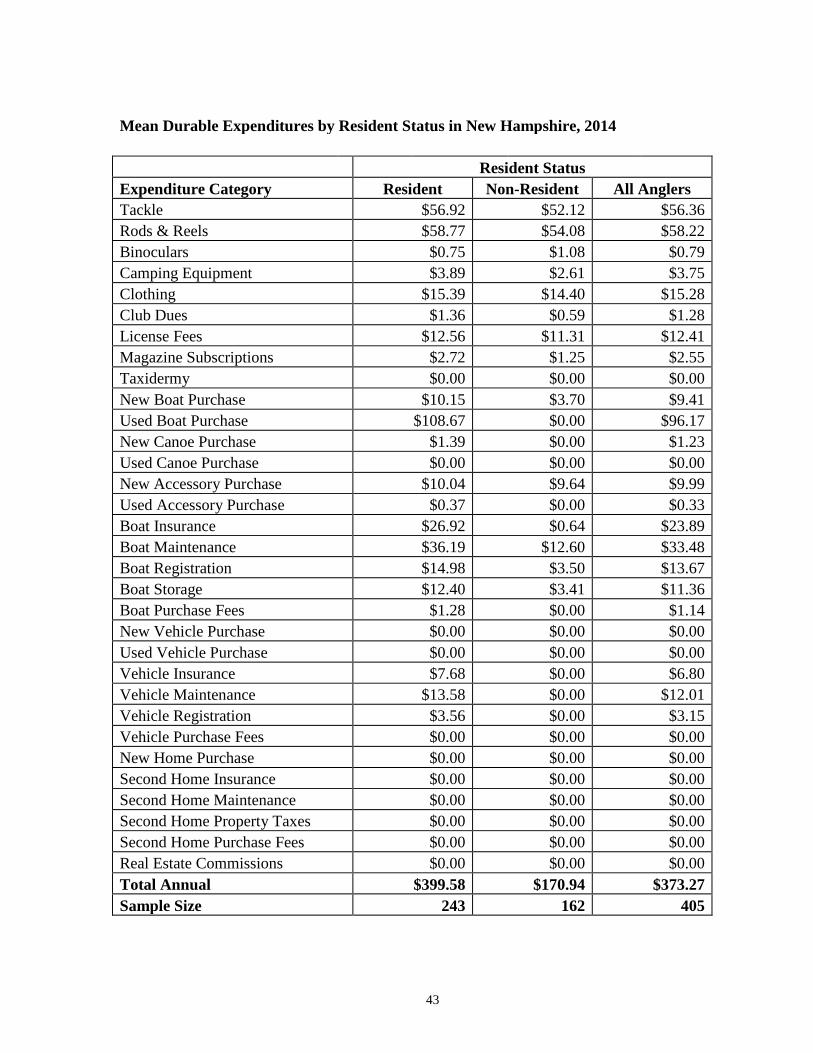
Mean Durable Expenditures by Resident Status in New Hampshire, 2014
Resident Status Expenditure Category Resident Non-Resident All Anglers Tackle $56.92 $52.12 $56.36 Rods & Reels $58.77 $54.08 $58.22 Binoculars $0.75 $1.08 $0.79 Camping Equipment $3.89 $2.61 $3.75 Clothing $15.39 $14.40 $15.28 Club Dues $1.36 $0.59 $1.28 License Fees $12.56 $11.31 $12.41 Magazine Subscriptions $2.72 $1.25 $2.55 Taxidermy $0.00 $0.00 $0.00 New Boat Purchase $10.15 $3.70 $9.41 Used Boat Purchase $108.67 $0.00 $96.17 New Canoe Purchase $1.39 $0.00 $1.23 Used Canoe Purchase $0.00 $0.00 $0.00 New Accessory Purchase $10.04 $9.64 $9.99 Used Accessory Purchase $0.37 $0.00 $0.33 Boat Insurance $26.92 $0.64 $23.89 Boat Maintenance $36.19 $12.60 $33.48 Boat Registration $14.98 $3.50 $13.67 Boat Storage $12.40 $3.41 $11.36 Boat Purchase Fees $1.28 $0.00 $1.14 New Vehicle Purchase $0.00 $0.00 $0.00 Used Vehicle Purchase $0.00 $0.00 $0.00 Vehicle Insurance $7.68 $0.00 $6.80 Vehicle Maintenance $13.58 $0.00 $12.01 Vehicle Registration $3.56 $0.00 $3.15 Vehicle Purchase Fees $0.00 $0.00 $0.00 New Home Purchase $0.00 $0.00 $0.00 Second Home Insurance $0.00 $0.00 $0.00 Second Home Maintenance $0.00 $0.00 $0.00 Second Home Property Taxes $0.00 $0.00 $0.00 Second Home Purchase Fees $0.00 $0.00 $0.00 Real Estate Commissions $0.00 $0.00 $0.00 Total Annual $399.58 $170.94 $373.27 Sample Size 243 162 405
44
New Jersey In New Jersey, there were an estimated 1 million anglers in 2014; of these, 52% were residents of New Jersey and 48% were non-residents. Total angler expenditures on durable goods used for marine recreational fishing in New Jersey were $1.4 billion in 2014. Resident spending on durable goods purchased in New Jersey totaled $1 billion; non-resident spending on durable goods totaled $387 million. Resident anglers spent on average $1,912 on fishing-related durable goods; non-residents spent $777 on average. Angler expenditures on durable goods contributed 16,779 jobs to the state’s economy, generated $1.7 billion in output (sales), $1.2 billion to the state’s gross domestic product, and $799 million in income.
Tackle, Rods and Reels, License Fees
27%
Binoculars, camping equipment, clothing, club dues, magazine
subscriptions, taxidermy
7%
All boat related purchases
60%
All vehicle related purchases
6%
All home related purchases
0%
Durable Expenditures in New Jersey, 2014
45
Mean Durable Expenditures by Resident Status in New Jersey, 2014
Resident Status Expenditure Category Resident Non-Resident All Anglers Tackle $174.38 $122.23 $159.88 Rods & Reels $262.87 $156.27 $233.47 Binoculars $4.00 $0.83 $3.13 Camping Equipment $22.13 $6.36 $17.81 Clothing $74.94 $37.56 $64.67 Club Dues $16.56 $5.16 $13.43 License Fees $9.13 $3.56 $7.60 Magazine Subscriptions $20.17 $7.42 $16.67 Taxidermy $0.00 $0.00 $0.00 New Boat Purchase $75.29 $1.37 $54.65 Used Boat Purchase $151.52 $21.67 $115.27 New Canoe Purchase $3.14 $0.00 $2.26 Used Canoe Purchase $0.26 $0.00 $0.19 New Accessory Purchase $121.36 $27.55 $95.17 Used Accessory Purchase $2.28 $0.00 $1.64 Boat Insurance $93.60 $36.95 $77.79 Boat Maintenance $226.04 $133.41 $200.18 Boat Registration $18.11 $4.55 $14.32 Boat Storage $478.98 $196.86 $400.85 Boat Purchase Fees $2.11 $0.57 $1.68 New Vehicle Purchase $53.81 $0.00 $38.81 Used Vehicle Purchase $4.18 $0.00 $3.02 Vehicle Insurance $54.27 $0.41 $39.35 Vehicle Maintenance $35.70 $2.83 $26.59 Vehicle Registration $4.90 $0.01 $3.54 Vehicle Purchase Fees $1.79 $0.00 $1.30 New Home Purchase $0.00 $0.00 $0.00 Second Home Insurance $0.00 $3.65 $1.01 Second Home Maintenance $0.00 $7.41 $2.05 Second Home Property Taxes $0.00 $0.00 $0.00 Second Home Purchase Fees $0.00 $0.00 $0.00 Real Estate Commissions $0.00 $0.00 $0.00 Total Annual $1,911.52 $776.64 $1,596.31 Sample Size 272 221 493
46
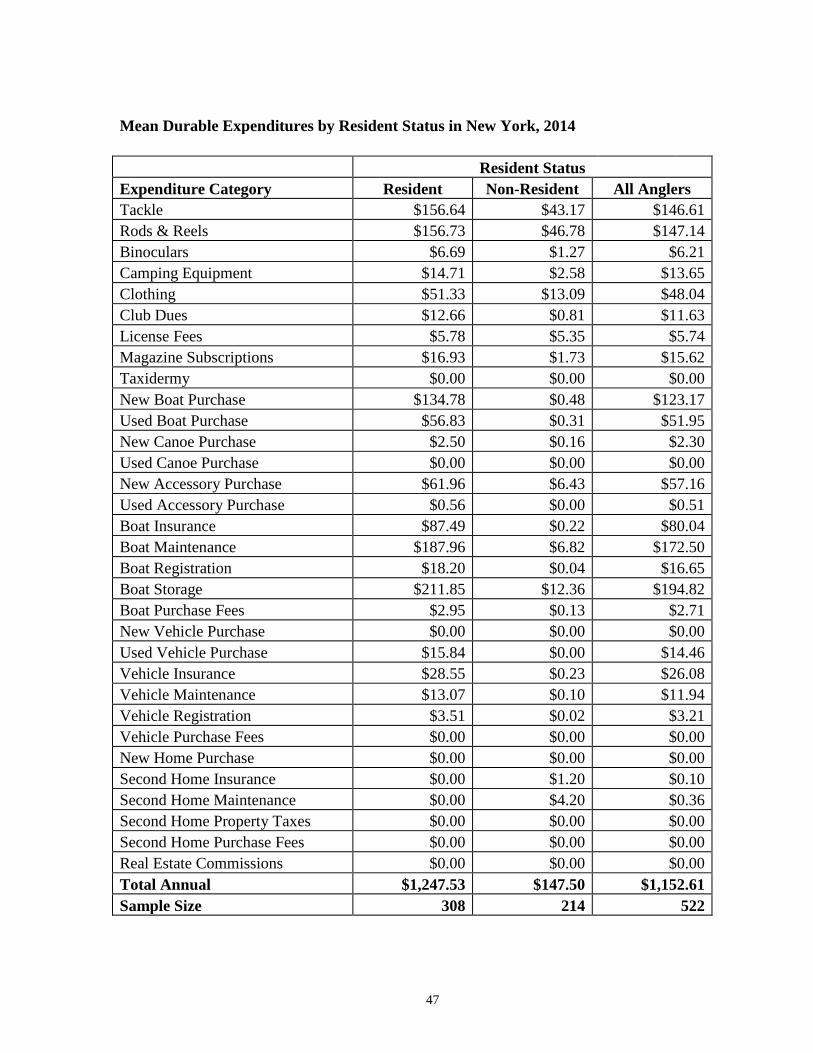
New York In New York, there were an estimated 693 thousand anglers in 2014; of these, 81% were residents of New York and 19% were non-residents. Total angler expenditures on durable goods used for marine recreational fishing in New York were $719 million in 2014. Resident spending on durable goods purchased in New York totaled $699 million; non-resident spending on durable goods totaled $20 million. Resident anglers spent on average $1,248 on fishing-related durable goods; non-residents spent $147 on average. Angler expenditures on durable goods contributed 7,417 jobs to the state’s economy, generated $743 million in output (sales), $567 million to the state’s gross domestic product, and $361 million in income.
Tackle, Rods and Reels, License Fees
27%
Binoculars, camping equipment, clothing, club dues, magazine
subscriptions, taxidermy
8%
All boat related purchases
60%
All vehicle related purchases
5%
All home related purchases
0%
Durable Expenditures in New York, 2014
47
Mean Durable Expenditures by Resident Status in New York, 2014
Resident Status Expenditure Category Resident Non-Resident All Anglers Tackle $156.64 $43.17 $146.61 Rods & Reels $156.73 $46.78 $147.14 Binoculars $6.69 $1.27 $6.21 Camping Equipment $14.71 $2.58 $13.65 Clothing $51.33 $13.09 $48.04 Club Dues $12.66 $0.81 $11.63 License Fees $5.78 $5.35 $5.74 Magazine Subscriptions $16.93 $1.73 $15.62 Taxidermy $0.00 $0.00 $0.00 New Boat Purchase $134.78 $0.48 $123.17 Used Boat Purchase $56.83 $0.31 $51.95 New Canoe Purchase $2.50 $0.16 $2.30 Used Canoe Purchase $0.00 $0.00 $0.00 New Accessory Purchase $61.96 $6.43 $57.16 Used Accessory Purchase $0.56 $0.00 $0.51 Boat Insurance $87.49 $0.22 $80.04 Boat Maintenance $187.96 $6.82 $172.50 Boat Registration $18.20 $0.04 $16.65 Boat Storage $211.85 $12.36 $194.82 Boat Purchase Fees $2.95 $0.13 $2.71 New Vehicle Purchase $0.00 $0.00 $0.00 Used Vehicle Purchase $15.84 $0.00 $14.46 Vehicle Insurance $28.55 $0.23 $26.08 Vehicle Maintenance $13.07 $0.10 $11.94 Vehicle Registration $3.51 $0.02 $3.21 Vehicle Purchase Fees $0.00 $0.00 $0.00 New Home Purchase $0.00 $0.00 $0.00 Second Home Insurance $0.00 $1.20 $0.10 Second Home Maintenance $0.00 $4.20 $0.36 Second Home Property Taxes $0.00 $0.00 $0.00 Second Home Purchase Fees $0.00 $0.00 $0.00 Real Estate Commissions $0.00 $0.00 $0.00 Total Annual $1,247.53 $147.50 $1,152.61 Sample Size 308 214 522
48
North Carolina In North Carolina, there were an estimated 1.5 million anglers in 2014; of these, 53% were residents of North Carolina and 47% were non-residents. Total angler expenditures on durable goods used for marine recreational fishing in North Carolina were $1.2 billion in 2014. Resident spending on durable goods purchased in North Carolina totaled $1 billion; non-resident spending on durable goods totaled $121 million. Resident anglers spent on average $1,342 on fishing-related durable goods; non-residents spent $177 on average. Angler expenditures on durable goods contributed 10,206 jobs to the state’s economy, generated $978 million in output (sales), $662 million to the state’s gross domestic product, and $435 million in income.
Tackle, Rods and Reels, License Fees
24%
Binoculars, camping equipment, clothing, club dues, magazine
subscriptions, taxidermy
6%
All boat related purchases
62%
All vehicle related purchases
6%
All home related purchases
2%
Durable Expenditures in North Carolina, 2014
49
Mean Durable Expenditures by Resident Status in North Carolina, 2014
Resident Status Expenditure Category Resident Non-Resident All Anglers Tackle $102.99 $51.05 $92.11 Rods & Reels $132.13 $52.16 $115.38 Binoculars $2.59 $0.00 $2.04 Camping Equipment $19.52 $5.10 $16.51 Clothing $39.25 $11.88 $33.59 Club Dues $3.61 $1.17 $3.10 License Fees $14.96 $26.94 $17.46 Magazine Subscriptions $8.20 $1.37 $6.79 Taxidermy $0.36 $1.53 $0.61 New Boat Purchase $440.52 $0.00 $347.58 Used Boat Purchase $213.69 $0.00 $168.61 New Canoe Purchase $0.00 $0.00 $0.00 Used Canoe Purchase $0.00 $0.38 $0.08 New Accessory Purchase $51.54 $2.26 $41.19 Used Accessory Purchase $1.54 $0.00 $1.22 Boat Insurance $41.36 $2.18 $33.20 Boat Maintenance $99.56 $3.25 $79.27 Boat Registration $13.78 $0.47 $11.01 Boat Storage $43.71 $2.05 $34.96 Boat Purchase Fees $10.70 $0.00 $8.46 New Vehicle Purchase $0.00 $0.00 $0.00 Used Vehicle Purchase $45.20 $0.00 $35.77 Vehicle Insurance $16.94 $0.00 $13.42 Vehicle Maintenance $17.81 $0.17 $14.15 Vehicle Registration $4.10 $0.06 $3.26 Vehicle Purchase Fees $0.51 $0.00 $0.40 New Home Purchase $0.00 $0.00 $0.00 Second Home Insurance $12.90 $12.37 $12.79 Second Home Maintenance $4.36 $2.79 $4.04 Second Home Property Taxes $0.00 $0.00 $0.00 Second Home Purchase Fees $0.00 $0.00 $0.00 Real Estate Commissions $0.00 $0.00 $0.00 Total Annual $1,341.83 $177.18 $1,097.00 Sample Size 274 181 455
50
Oregon In Oregon, there were an estimated 206 thousand anglers in 2014; of these, 93% were residents of Oregon and 7% were non-residents. Total angler expenditures on durable goods used for marine recreational fishing in Oregon were $224 million in 2014. Resident spending on durable goods purchased in Oregon totaled $220 million; non-resident spending on durable goods totaled $3.6 million. Resident anglers spent on average $1,142 on fishing-related durable goods; non-residents spent $270 on average. Angler expenditures on durable goods contributed 2,473 jobs to the state’s economy, generated $216 million in output (sales), $154 million to the state’s gross domestic product, and $110 million in income.
Tackle, Rods and Reels, License Fees
25%
Binoculars, camping equipment, clothing, club dues, magazine
subscriptions, taxidermy
8% All boat related
purchases 36%
All vehicle related purchases
29%
All home related purchases
2%
Durable Expenditures in Oregon, 2014
51
Mean Durable Expenditures by Resident Status in Oregon, 2014
Resident Status Expenditure Category Resident Non-Resident All Anglers Tackle $126.38 $57.60 $93.16 Rods & Reels $115.92 $26.91 $73.38 Binoculars $5.94 $0.00 $3.07 Camping Equipment $13.89 $7.57 $10.83 Clothing $58.28 $17.80 $38.85 Club Dues $3.78 $0.65 $2.26 License Fees $43.54 $52.41 $47.80 Magazine Subscriptions $6.29 $1.15 $3.80 Taxidermy $1.02 $0.61 $0.83 New Boat Purchase $131.35 $0.40 $67.69 Used Boat Purchase $53.51 $69.29 $61.18 New Canoe Purchase $5.88 $0.00 $3.01 Used Canoe Purchase $0.00 $0.00 $0.00 New Accessory Purchase $41.56 $14.66 $28.49 Used Accessory Purchase $1.15 $0.00 $0.59 Boat Insurance $38.29 $0.08 $19.71 Boat Maintenance $75.48 $14.60 $45.89 Boat Registration $22.78 $1.61 $12.57 Boat Storage $37.14 $4.84 $21.44 Boat Purchase Fees $2.09 $0.05 $1.10 New Vehicle Purchase $0.00 $0.00 $0.00 Used Vehicle Purchase $246.89 $0.00 $126.75 Vehicle Insurance $37.57 $0.00 $19.29 Vehicle Maintenance $40.58 $0.00 $20.97 Vehicle Registration $8.49 $0.00 $4.37 Vehicle Purchase Fees $2.37 $0.00 $1.23 New Home Purchase $0.00 $0.00 $0.00 Second Home Insurance $8.42 $0.00 $4.29 Second Home Maintenance $12.91 $0.00 $6.55 Second Home Property Taxes $0.00 $0.00 $0.00 Second Home Purchase Fees $0.00 $0.00 $0.00 Real Estate Commissions $0.00 $0.00 $0.00 Total Annual $1,141.52 $270.22 $719.08 Sample Size 210 155 365
52
Rhode Island In Rhode Island, there were an estimated 382 thousand anglers in 2014; of these, 35% were residents of Rhode Island and 65% were non-residents. Total angler expenditures on durable goods used for marine recreational fishing in Rhode Island were $371 million in 2014. Resident spending on durable goods purchased in Rhode Island totaled $220 million; non-resident spending on durable goods totaled $150 million. Resident anglers spent on average $1,661 on fishing-related durable goods; non-residents spent $601 on average. Angler expenditures on durable goods contributed 4,046 jobs to the state’s economy, generated $381 million in output (sales), $276 million to the state’s gross domestic product, and $182 million in income.
Tackle, Rods and Reels, License Fees
26%
Binoculars, camping equipment, clothing, club dues, magazine
subscriptions, taxidermy
6%
All boat related purchases
62%
All vehicle related purchases
6%
All home related purchases
0%
Durable Expenditures in Rhode Island, 2014
53
Mean Durable Expenditures by Resident Status in Rhode Island, 2014
Resident Status Expenditure Category Resident Non-Resident All Anglers Tackle $158.70 $83.10 $140.97 Rods & Reels $170.12 $108.17 $155.55 Binoculars $5.08 $1.75 $4.30 Camping Equipment $20.47 $5.30 $16.94 Clothing $76.75 $14.41 $62.24 Club Dues $13.72 $2.59 $11.12 License Fees $12.44 $12.70 $12.50 Magazine Subscriptions $11.69 $2.11 $9.47 Taxidermy $0.00 $0.09 $0.02 New Boat Purchase $78.43 $75.24 $77.68 Used Boat Purchase $158.92 $8.98 $123.69 New Canoe Purchase $18.91 $0.00 $14.49 Used Canoe Purchase $0.00 $0.00 $0.00 New Accessory Purchase $65.36 $69.80 $66.41 Used Accessory Purchase $0.34 $0.00 $0.26 Boat Insurance $84.57 $11.63 $67.58 Boat Maintenance $216.17 $44.57 $176.19 Boat Registration $20.85 $8.83 $18.05 Boat Storage $381.95 $145.73 $326.92 Boat Purchase Fees $1.60 $0.56 $1.35 New Vehicle Purchase $1.87 $0.00 $1.42 Used Vehicle Purchase $73.69 $0.00 $56.41 Vehicle Insurance $47.59 $0.14 $36.46 Vehicle Maintenance $33.23 $1.39 $25.74 Vehicle Registration $6.50 $0.00 $4.98 Vehicle Purchase Fees $2.29 $0.00 $1.75 New Home Purchase $0.00 $0.00 $0.00 Second Home Insurance $0.00 $1.88 $0.44 Second Home Maintenance $0.00 $1.99 $0.46 Second Home Property Taxes $0.00 $0.00 $0.00 Second Home Purchase Fees $0.00 $0.00 $0.00 Real Estate Commissions $0.00 $0.00 $0.00 Total Annual $1,661.24 $600.96 $1,413.37 Sample Size 271 161 432
54
South Carolina In South Carolina, there were an estimated 761 thousand anglers in 2014; of these, 36% were residents of South Carolina and 64% were non-residents. Total angler expenditures on durable goods used for marine recreational fishing in South Carolina were $338 million in 2014. Resident spending on durable goods purchased in South Carolina totaled $252 million; non-resident spending on durable goods totaled $85 million. Resident anglers spent on average $931 on fishing-related durable goods; non-residents spent $174 on average. Angler expenditures on durable goods contributed 3,328 jobs to the state’s economy, generated $293 million in output (sales), $196 million to the state’s gross domestic product, and $127 million in income.
Tackle, Rods and Reels, License Fees
32%
Binoculars, camping equipment, clothing, club dues, magazine
subscriptions, taxidermy
7%
All boat related purchases
54%
All vehicle related purchases
7%
All home related purchases
0%
Durable Expenditures in South Carolina, 2014
55
Mean Durable Expenditures by Resident Status in South Carolina, 2014
Resident Status Expenditure Category Resident Non-Resident All Anglers Tackle $74.24 $43.82 $69.00 Rods & Reels $99.94 $47.92 $91.02 Binoculars $0.10 $0.68 $0.20 Camping Equipment $19.83 $2.91 $16.90 Clothing $32.49 $9.91 $28.61 Club Dues $3.90 $1.70 $3.52 License Fees $13.47 $23.40 $15.19 Magazine Subscriptions $8.30 $0.79 $7.02 Taxidermy $0.08 $0.00 $0.07 New Boat Purchase $247.55 $0.89 $205.63 Used Boat Purchase $83.09 $7.27 $70.21 New Canoe Purchase $8.92 $0.00 $7.39 Used Canoe Purchase $0.00 $0.00 $0.00 New Accessory Purchase $46.78 $4.23 $39.55 Used Accessory Purchase $0.12 $0.00 $0.10 Boat Insurance $61.47 $0.00 $51.12 Boat Maintenance $100.42 $6.59 $84.47 Boat Registration $24.01 $0.41 $20.04 Boat Storage $36.41 $11.76 $32.22 Boat Purchase Fees $3.95 $0.05 $3.29 New Vehicle Purchase $0.00 $0.00 $0.00 Used Vehicle Purchase $26.26 $11.36 $23.74 Vehicle Insurance $22.01 $0.00 $18.28 Vehicle Maintenance $12.95 $0.28 $10.81 Vehicle Registration $4.78 $0.00 $3.97 Vehicle Purchase Fees $0.00 $0.32 $0.05 New Home Purchase $0.00 $0.00 $0.00 Second Home Insurance $0.00 $0.00 $0.00 Second Home Maintenance $0.00 $0.00 $0.00 Second Home Property Taxes $0.00 $0.00 $0.00 Second Home Purchase Fees $0.00 $0.00 $0.00 Real Estate Commissions $0.00 $0.00 $0.00 Total Annual $931.09 $174.31 $802.38 Sample Size 251 178 429
56
Texas In Texas, there were an estimated 751 thousand anglers in 2014; of these, 91% were residents of Texas and 9% were non-residents. Total angler expenditures on durable goods used for marine recreational fishing in Texas were $1.3 billion in 2014. Resident spending on durable goods purchased in Texas totaled $1.3 billion; non-resident spending on durable goods totaled $31 million. Resident anglers spent on average $1,881 on fishing-related durable goods; non-residents spent $474 on average. Angler expenditures on durable goods contributed 10,920 jobs to the state’s economy, generated $1.2 billion in output (sales), $840 million to the state’s gross domestic product, and $537 million in income.
Tackle, Rods and Reels, License Fees
21%
Binoculars, camping equipment, clothing, club dues, magazine
subscriptions, taxidermy
9%
All boat related purchases
37%
All vehicle related purchases
30%
All home related purchases
3%
Durable Expenditures in Texas, 2014
57
Mean Durable Expenditures by Resident Status in Texas, 2014
Resident Status Expenditure Category Resident Non-Resident All Anglers Tackle $164.46 $78.43 $153.96 Rods & Reels $183.88 $79.93 $171.33 Binoculars $7.60 $0.19 $6.70 Camping Equipment $69.48 $8.73 $62.17 Clothing $64.74 $31.29 $60.69 Club Dues $11.92 $0.57 $10.53 License Fees $36.51 $44.74 $37.50 Magazine Subscriptions $11.50 $2.37 $10.40 Taxidermy $1.82 $4.00 $2.08 New Boat Purchase $272.91 $78.38 $249.43 Used Boat Purchase $132.20 $82.60 $126.21 New Canoe Purchase $0.00 $0.00 $0.00 Used Canoe Purchase $2.65 $0.00 $2.32 New Accessory Purchase $56.61 $22.54 $52.50 Used Accessory Purchase $1.97 $0.17 $1.75 Boat Insurance $40.62 $5.93 $36.42 Boat Maintenance $105.36 $9.93 $93.84 Boat Registration $26.95 $3.35 $24.13 Boat Storage $47.51 $16.55 $43.77 Boat Purchase Fees $7.49 $0.01 $6.59 New Vehicle Purchase $249.04 $0.00 $218.63 Used Vehicle Purchase $243.35 $0.00 $213.53 Vehicle Insurance $35.30 $0.00 $30.99 Vehicle Maintenance $29.88 $3.50 $26.67 Vehicle Registration $6.27 $0.37 $5.55 Vehicle Purchase Fees $13.85 $0.00 $12.16 New Home Purchase $0.00 $0.00 $0.00 Second Home Insurance $30.41 $0.00 $26.57 Second Home Maintenance $21.34 $0.00 $18.63 Second Home Property Taxes $2.08 $0.00 $1.81 Second Home Purchase Fees $3.25 $0.00 $2.84 Real Estate Commissions $0.00 $0.00 $0.00 Total Annual $1,880.92 $473.56 $1,709.71 Sample Size 260 238 498
58
Virginia In Virginia, there were an estimated 531 thousand anglers in 2014; of these, 63% were residents of Virginia and 37% were non-residents. Total angler expenditures on durable goods used for marine recreational fishing in Virginia were $334 million in 2014. Resident spending on durable goods purchased in Virginia totaled $308 million; non-resident spending on durable goods totaled $26 million. Resident anglers spent on average $919 on fishing-related durable goods; non-residents spent $132 on average. Angler expenditures on durable goods contributed 3,919 jobs to the state’s economy, generated $350 million in output (sales), $258 million to the state’s gross domestic product, and $164 million in income.
Tackle, Rods and Reels, License Fees
35%
Binoculars, camping equipment, clothing, club dues, magazine
subscriptions, taxidermy
7%
All boat related purchases
50%
All vehicle related purchases
6%
All home related purchases
2%
Durable Expenditures in Virginia, 2014
59
Mean Durable Expenditures by Resident Status in Virginia, 2014
Resident Status Expenditure Category Resident Non-Resident All Anglers Tackle $120.59 $51.98 $105.47 Rods & Reels $140.45 $32.55 $116.94 Binoculars $3.09 $0.15 $2.45 Camping Equipment $19.33 $5.91 $16.41 Clothing $31.79 $7.19 $26.45 Club Dues $3.71 $0.36 $2.97 License Fees $28.11 $12.59 $24.71 Magazine Subscriptions $6.84 $0.27 $5.41 Taxidermy $1.32 $0.00 $1.03 New Boat Purchase $51.46 $3.49 $40.87 Used Boat Purchase $2.79 $0.00 $2.17 New Canoe Purchase $8.54 $0.00 $6.64 Used Canoe Purchase $1.05 $0.00 $0.82 New Accessory Purchase $38.51 $4.89 $31.09 Used Accessory Purchase $3.83 $0.06 $3.00 Boat Insurance $72.86 $0.38 $56.99 Boat Maintenance $188.43 $7.07 $148.72 Boat Registration $12.24 $0.50 $9.67 Boat Storage $106.60 $2.02 $83.51 Boat Purchase Fees $0.77 $0.02 $0.60 New Vehicle Purchase $0.00 $0.00 $0.00 Used Vehicle Purchase $21.44 $0.00 $16.71 Vehicle Insurance $22.29 $0.00 $17.41 Vehicle Maintenance $13.22 $0.00 $10.32 Vehicle Registration $3.86 $0.00 $3.01 Vehicle Purchase Fees $0.56 $0.00 $0.43 New Home Purchase $0.00 $0.00 $0.00 Second Home Insurance $10.62 $0.00 $8.21 Second Home Maintenance $4.64 $2.25 $4.10 Second Home Property Taxes $0.00 $0.00 $0.00 Second Home Purchase Fees $0.00 $0.00 $0.00 Real Estate Commissions $0.00 $0.00 $0.00 Total Annual $918.94 $131.69 $746.14 Sample Size 279 179 458
60
Washington In Washington, there were an estimated 233 thousand anglers in 2014; of these, 93% were residents of Washington and 7% were non-residents. Total angler expenditures on durable goods used for marine recreational fishing in Washington were $495 million in 2014. Resident spending on durable goods purchased in Washington totaled $493 million; non-resident spending on durable goods totaled $1.9 million. Resident anglers spent on average $2,274 on fishing-related durable goods; non-residents spent $121 on average. Angler expenditures on durable goods contributed 4,811jobs to the state’s economy, generated $498 million in output (sales), $361 million to the state’s gross domestic product, and $220 million in income.
Tackle, Rods and Reels, License Fees
16%
Binoculars, camping equipment, clothing, club dues, magazine
subscriptions, taxidermy
5%
All boat related purchases
72%
All vehicle related purchases
7%
All home related purchases
0%
Durable Expenditures in Washington, 2014
61
Mean Durable Expenditures by Resident Status in Washington, 2014
Resident Status Expenditure Category Resident Non-Resident All Anglers Tackle $195.03 $33.63 $171.58 Rods & Reels $117.74 $31.52 $105.33 Binoculars $5.83 $0.00 $4.96 Camping Equipment $17.12 $4.18 $15.18 Clothing $68.72 $8.23 $59.87 Club Dues $12.00 $0.00 $10.21 License Fees $42.76 $39.15 $42.23 Magazine Subscriptions $8.15 $0.67 $7.04 Taxidermy $1.00 $0.00 $0.85 New Boat Purchase $263.49 $0.00 $224.33 Used Boat Purchase $422.18 $0.00 $359.73 New Canoe Purchase $3.57 $0.00 $3.05 Used Canoe Purchase $5.31 $0.00 $4.53 New Accessory Purchase $154.09 $0.00 $131.40 Used Accessory Purchase $4.80 $0.00 $4.09 Boat Insurance $106.62 $0.08 $91.10 Boat Maintenance $346.82 $1.46 $296.53 Boat Registration $57.60 $0.56 $49.29 Boat Storage $282.29 $1.84 $241.45 Boat Purchase Fees $8.10 $0.00 $6.91 New Vehicle Purchase $0.00 $0.00 $0.00 Used Vehicle Purchase $81.11 $0.00 $69.12 Vehicle Insurance $31.96 $0.00 $27.26 Vehicle Maintenance $30.13 $0.00 $25.70 Vehicle Registration $7.49 $0.00 $6.39 Vehicle Purchase Fees $0.30 $0.00 $0.26 New Home Purchase $0.00 $0.00 $0.00 Second Home Insurance $0.00 $0.00 $0.00 Second Home Maintenance $0.00 $0.00 $0.00 Second Home Property Taxes $0.00 $0.00 $0.00 Second Home Purchase Fees $0.00 $0.00 $0.00 Real Estate Commissions $0.00 $0.00 $0.00 Total Annual $2,274.20 $121.32 $1,958.38 Sample Size 310 184 494
62
United States In the United States, there were an estimated 9.9 million resident anglers in 2014. Angler spending on durable goods purchased in United States totaled $28 billion. Anglers spent on average $2,823 on fishing-related durable goods. Purchases of new and used boats and boat-related expenditures accounted for 69% of total angler expenditures. Angler expenditures on durable goods contributed 357,978 jobs to the country’s economy, generated $49.6 billion in output (sales), $29 billion to the country’s gross domestic product, and $18 billion in income.
Tackle, Rods and Reels, License Fees
1%
Binoculars, camping equipment, clothing, club dues, magazine
subscriptions, taxidermy
5%
All boat related purchases
69%
All vehicle related purchases
16%
All home related purchases
9%
Durable Expenditures in the United States, 2014
63
Mean Durable Expenditures in the United States, 2014
Expenditure Category All Anglers Tackle $171.15 Rods & Reels $226.09 Binoculars $14.61 Camping Equipment $43.52 Clothing $71.40 Club Dues $17.00 License Fees $35.67 Magazine Subscriptions $13.86 Taxidermy $9.98 New Boat Purchase $530.87 Used Boat Purchase $380.81 New Canoe Purchase $26.48 Used Canoe Purchase $10.65 New Accessory Purchase $159.27 Used Accessory Purchase $21.65 Boat Insurance $106.14 Boat Maintenance $221.00 Boat Registration $27.15 Boat Storage $169.26 Boat Purchase Fees $12.58 New Vehicle Purchase $142.00 Used Vehicle Purchase $127.13 Vehicle Insurance $51.64 Vehicle Maintenance $42.73 Vehicle Registration $10.15 Vehicle Purchase Fees $4.03 New Home Purchase $111.49 Second Home Insurance $9.75 Second Home Maintenance $19.11 Second Home Property Taxes $13.61 Second Home Purchase Fees $20.22 Real Estate Commissions $42.38 Total Annual $2,863.40 Sample Size 10722
64
65
HMS PERMIT HOLDERS RESULTS
66
HMS Northeast In the HMS northeast regional fishery, there were an estimated 11,836 anglers in 2014. Resident spending on durable goods attributed to HMS fishing in the northeast totaled $61 million. Resident anglers spent on average $5,284 on fishing-related durable goods. Angler expenditures on durable goods contributed 697 jobs to the region’s economy, generated $73 million in output (sales), $56 million to the region’s gross domestic product, and $38 million in income.
Tackle, Rods and Reels, License Fees
9%
Binoculars, camping equipment, clothing, club dues, magazine
subscriptions, taxidermy
2%
All boat related purchases
82%
All vehicle related purchases
2%
All home related purchases
5%
Durable Expenditures in HMS NE, 2014
67
Mean Durable Expenditures Attributed to HMS Fishing in the Northeast, 2014
Fishery Expenditure Category All Marine Angling HMS Angling
Tackle $496.18 $187.30 Rods & Reels $641.15 $243.44 Binoculars $34.38 $5.08 Camping Equipment $40.30 $12.83 Clothing $135.50 $45.25 Club Dues $69.36 $13.18 License Fees $53.83 $20.35 Magazine Subscriptions $46.57 $17.44 Taxidermy $2.21 $0.59 New Boat Purchase $3,304.66 $1,565.92 Used Boat Purchase (Dealer) $2,834.85 $1,383.74 New Canoe Purchase $16.61 $4.80 Used Canoe Purchase (Dealer) $0.00 $0.00 New Accessory Purchase $686.17 $302.60 Used Accessory Purchase (Dealer) $4.97 $2.31 Boat Insurance $476.93 $169.60 Boat Maintenance $1,532.41 $341.40 Boat Registration $64.23 $24.11 Boat Storage $1,485.74 $523.61 Boat Purchase Fees $101.08 $42.85 New Vehicle Purchase $206.82 $75.48 Used Vehicle Purchase (Dealer) $18.46 $0.00 Vehicle Insurance $42.74 $4.48 Vehicle Maintenance $15.38 $3.44 Vehicle Registration $3.25 $0.57 Vehicle Purchase Fees $5.43 $2.13 New Home Purchase $234.58 $87.97 Second Home Insurance $48.57 $21.39 Second Home Maintenance $134.92 $94.29 Second Home Property Taxes $37.40 $18.37 Second Home Purchase Fees $42.74 $22.63 Real Estate Commissions $95.81 $47.22 Total Durable Expenditures $12,913.23 $5,284.37
68
HMS Southeast In the HMS southeast regional fishery, there were an estimated 7,540 anglers in 2014. Resident spending on durable goods attributed to HMS fishing in the southeast totaled $108 million. Resident anglers spent on average $15,296 on fishing-related durable goods. Angler expenditures on durable goods contributed 1,331 jobs to the region’s economy, generated $152 million in output (sales), $104 million to the region’s gross domestic product, and $68 million in income.
Tackle, Rods and Reels, License Fees
10%
Binoculars, camping equipment, clothing, club dues, magazine
subscriptions, taxidermy
2%
All boat related purchases
77%
All vehicle related purchases
4%
All home related purchases
7%
Durable Expenditures in HMS SE, 2014
69
Mean Durable Expenditures Attributed to HMS Fishing in the Southeast, 2014
Fishery Expenditure Category All Marine Angling HMS Angling Tackle $1,160.08 $586.49 Rods & Reels $1,608.12 $831.99 Binoculars $80.84 $36.00 Camping Equipment $153.16 $73.73 Clothing $298.98 $137.86 Club Dues $165.00 $50.32 License Fees $73.81 $34.18 Magazine Subscriptions $79.70 $37.18 Taxidermy $53.19 $26.54 New Boat Purchase $8,953.50 $4,201.69 Used Boat Purchase (Dealer) $6,578.76 $3,275.23 New Canoe Purchase $41.35 $17.99 Used Canoe Purchase (Dealer) $2.16 $1.09 New Accessory Purchase $1,356.21 $580.41 Used Accessory Purchase (Dealer) $36.85 $14.57 Boat Insurance $1,534.74 $790.26 Boat Maintenance $3,027.98 $1,782.96 Boat Registration $98.60 $42.14 Boat Storage $1,813.82 $1,028.03 Boat Purchase Fees $212.31 $116.31 New Vehicle Purchase $274.71 $452.99 Used Vehicle Purchase (Dealer) $244.79 $68.09 Vehicle Insurance $99.99 $48.48 Vehicle Maintenance $99.97 $33.81 Vehicle Registration $14.34 $4.13 Vehicle Purchase Fees $11.49 $14.79 New Home Purchase $531.91 $390.07 Second Home Insurance $211.55 $125.84 Second Home Maintenance $313.84 $167.43 Second Home Property Taxes $59.19 $33.89 Second Home Purchase Fees $131.37 $108.06 Real Estate Commissions $209.75 $183.61 Total Durable Expenditures $29,532.06 $15,296.16
Department of Labor, Bureau of Labor Statistics. Dillman, D.A., J.D. Smyth, and L.M. Christian. 2009. Internet, Mail, and Mixed-Mode Surveys: The Tailor
Design Method. Wiley, New York. Hibsch, E. Personal Communication. Recreational Fisheries Information Network. Pacific States Marine
Fisheries Commission. 205 SE Spokane Street, Suite 100. Portland, Oregon 97202. Lovell, S., S. Steinback, and J.Hilger. The Economic Contribution of Marine Angler Expenditures in the
United States, 2011. US Dep. Commerce, NOAA Tech. Memo. NMFS-F/SPO-134. Minnesota IMPLAN Group, Inc. 2012. IMPLAN professional: social accounting and impact analysis
software. Minnesota IMPLAN Group, Inc., Minneapolis. National Association of Realtors. Existing Home Sales. Accessed on January 14, 2016.
http://www.realtor.org/topics/existing-home-sales. SAS. 2012. SAS Version 9.4 SAS Institute Inc. Cary, N.C. Tax Foundation. 2010. Property taxes by state. Accessed on October 11, 2012 at
http://taxfoundation.org/article/property-taxes-owner-occupied-housing-state-2004-2009. USFWS. 2011. U.S. Department of the Interior, Fish and Wildlife Service, and U.S. Department of
Commerce, U.S. Census Bureau. 2011 National Survey of Fishing, Hunting, and Wildlife-Associated Recreation.
A person catching finfish with no intent to sell, including people releasing the catch. Also known as a recreational fisherman.
Durable Equipment Expenditures or Durable Goods Expenditures For this report, this term refers to expenses related to equipment used for recreational fishing activities. These expenses include the purchase of: semi-durable goods (tackle, rods, reels, line, etc.), durable goods (motor boats and accessories, non-motorized boats, boating electronics, mooring, boat storage, boat insurance, and vehicles or homes), and angling accessories and multi-purpose items (magazines, club dues, saltwater angling specific clothing and camping gear).
Economic Contribution
Refers to the amount of output generated, the number of jobs supported, and the contribution to gross domestic product by state (also known as value-added impacts) from expenditures related to marine recreational fishing under the status quo in a region. The distinction between economic impacts and economic contributions is that economic impact analysis refers to the difference in the level of economic contributions attributed to an activity, such as recreational fishing, when there is a change in the level of the activity under analysis.
Economic Impact Model
Economic impact models capture how sales in a sector generate economic impacts directly in the sector in which the sale was made and then ripple throughout the state and national economy as each dollar spent generates additional sales by other firms and consumers.
Economic Impacts
Economic impacts of marine recreational fishing activities refer to the amount of output generated, the number of jobs supported, and the contribution to gross domestic product by state (also known as value-added impacts) from expenditures related to marine recreational fishing.
Economic Value
Total net economic value is generally defined as willingness to pay for a good, service, or resource in excess of actual expenditures. Economic value and economic impacts do not measure the same things and should not be considered substitutes for each other. Different economic models are used to calculate economic value versus economic impacts. Economic values are generally used in benefit-cost analyses whereas economic impacts are often used in distributional analyses.
Employee Compensation
This is related to Gross Domestic Product (GDP) by state and is an estimate of the sum of employee wages and salaries and supplements to wages and salaries. Wages and salaries are measured on an accrual, or “when earned” basis, which may be different from the measure of wages and salaries measured on a disbursement, or “when paid” basis. Wages and salaries and supplements of Federal military and civilian government employees stationed abroad are excluded from the measure of GDP by state.
Expenditures The money spent by anglers which is related to their marine recreational fishing activities and described as being one of two types: 1) expenditures related to a specific fishing trip; or 2) durable equipment expenditures.
72
Gross Domestic Product (GDP) by State
The value added in production by the labor and capital located in a state. GDP for a state is derived as the sum of the GDP originating in all industries in the state.
Non-resident A non-resident at the state level refers to a recreational fisherman (angler) who did not reside in the state where they fished.
Resident A resident at the state level refers to an angler who resides in the state where they fished. At the U.S. level, resident anglers refer only to U.S. residents who fished in the state where they live in order to avoid double counting for anglers who fish in both their home state and other states.
Value-added The net sales of a firm, defined as gross revenue minus the cost of the goods and services it purchases from other industries in the production of its outputs.