63
Spring 2013 The Economic Impact of Austin’s Food Sector TXP, Inc. 1310 South 1st Street, #105 Austin, Texas 78704 (512) 328-8300 phone www.txp.com
Spring 2013
The Economic Impact of Austin’s Food Sector
TXP, Inc. 1310 South 1st Street, #105 Austin, Texas 78704 (512) 328-8300 phone www.txp.com
Austin Food Sector Economic Impact | Spring 2013
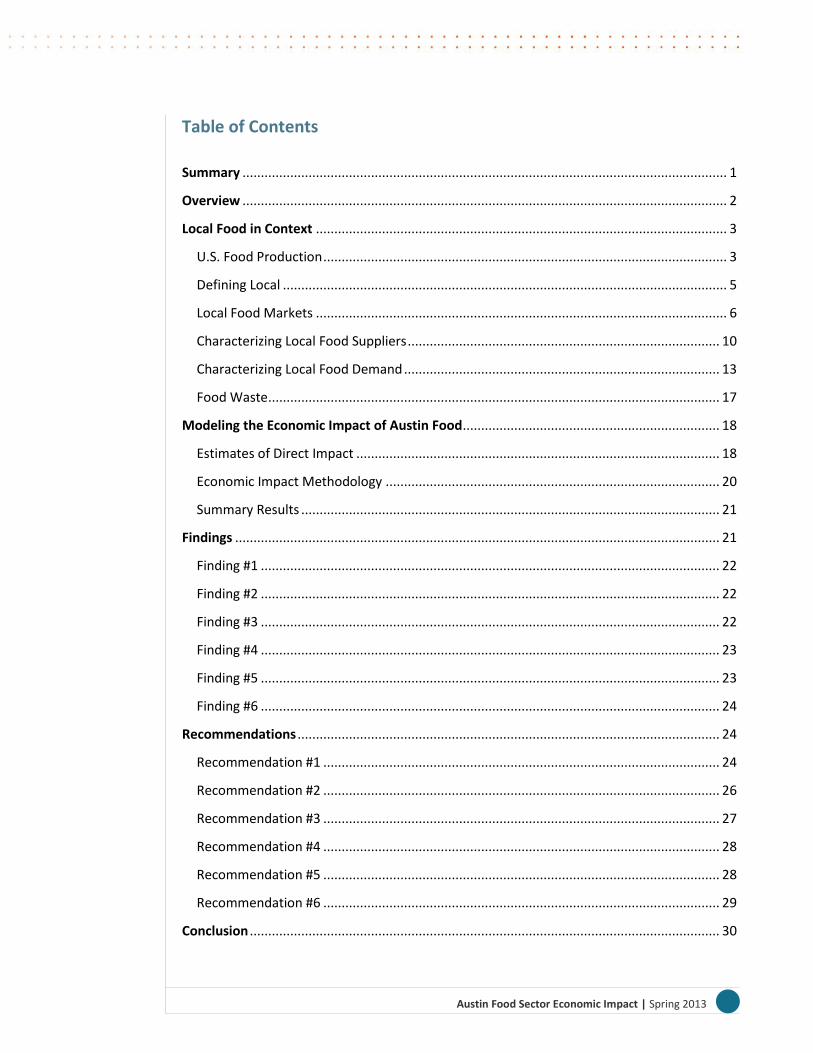
Table of Contents
Summary .................................................................................................................................... 1
Overview .................................................................................................................................... 2
Local Food in Context ................................................................................................................ 3
U.S. Food Production .............................................................................................................. 3
Defining Local ......................................................................................................................... 5
Local Food Markets ................................................................................................................ 6
Characterizing Local Food Suppliers ..................................................................................... 10
Characterizing Local Food Demand ...................................................................................... 13
Food Waste ........................................................................................................................... 17
Modeling the Economic Impact of Austin Food ...................................................................... 18
Estimates of Direct Impact ................................................................................................... 18
Economic Impact Methodology ........................................................................................... 20
Summary Results .................................................................................................................. 21
Findings .................................................................................................................................... 21
Finding #1 ............................................................................................................................. 22
Finding #2 ............................................................................................................................. 22
Finding #3 ............................................................................................................................. 22
Finding #4 ............................................................................................................................. 23
Finding #5 ............................................................................................................................. 23
Finding #6 ............................................................................................................................. 24
Recommendations ................................................................................................................... 24
Recommendation #1 ............................................................................................................ 24
Recommendation #2 ............................................................................................................ 26
Recommendation #3 ............................................................................................................ 27
Recommendation #4 ............................................................................................................ 28
Recommendation #5 ............................................................................................................ 28
Recommendation #6 ............................................................................................................ 29
Conclusion ................................................................................................................................ 30
Austin Food Sector Economic Impact | Spring 2013
Appendix 1: Detailed Economic Impacts by Sector ............................................................... 31
A1.1: Detailed Total Local Food Economic Impacts (2011) ................................................. 31
A1.2: Detailed Local Agriculture Economic Impacts (2011) ................................................ 32
A1.3: Detailed Food Production Economic Impacts (2011) ................................................. 33
A1.4: Detailed Food Distribution Economic Impacts (2011) ............................................... 34
A1.5: Detailed Tourism-Grocery Economic Impacts (2011) ................................................ 35
A1.6: Detailed Tourism-Eating & Drinking Impacts (2011) .................................................. 36
Appendix 2: Group Meeting Notes ......................................................................................... 37
Farm Stakeholders ................................................................................................................ 37
Restaurants ........................................................................................................................... 39
Appendix 3: Social Media and Austin Food ............................................................................ 40
Appendix 4: Current City of Austin Efforts .............................................................................. 47
A4.1 Case Study/Best Practices Research Related to Public Land/Urban Agriculture ......... 47
A4.2 Water-Related Issues ................................................................................................... 51
Appendix 5: Maps .................................................................................................................... 52
Legal Disclaimer ....................................................................................................................... 53
1 Austin Food Sector Economic Impact | Spring 2013
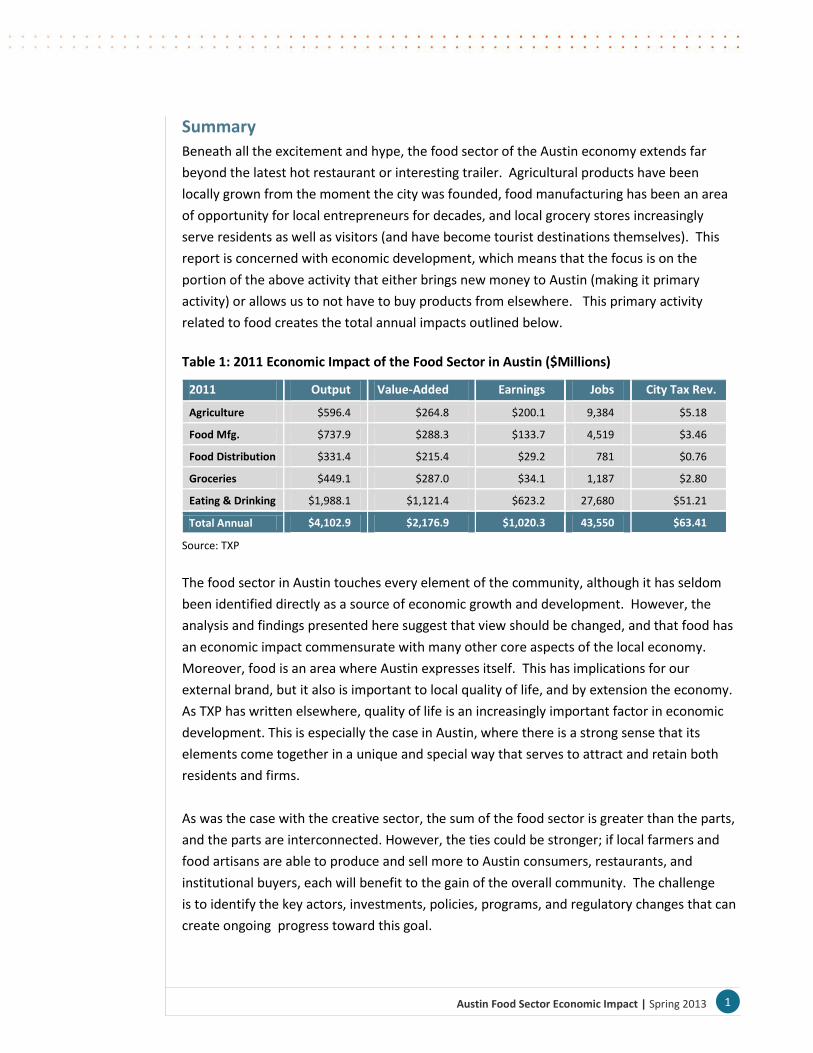
Summary
Beneath all the excitement and hype, the food sector of the Austin economy extends far
beyond the latest hot restaurant or interesting trailer. Agricultural products have been
locally grown from the moment the city was founded, food manufacturing has been an area
of opportunity for local entrepreneurs for decades, and local grocery stores increasingly
serve residents as well as visitors (and have become tourist destinations themselves). This
report is concerned with economic development, which means that the focus is on the
portion of the above activity that either brings new money to Austin (making it primary
activity) or allows us to not have to buy products from elsewhere. This primary activity
related to food creates the total annual impacts outlined below.
Table 1: 2011 Economic Impact of the Food Sector in Austin ($Millions)
2011 Output Value-Added Earnings Jobs City Tax Rev.
Agriculture $596.4 $264.8 $200.1 9,384 $5.18
Food Mfg. $737.9 $288.3 $133.7 4,519 $3.46
Food Distribution $331.4 $215.4 $29.2 781 $0.76
Groceries $449.1 $287.0 $34.1 1,187 $2.80
Eating & Drinking $1,988.1 $1,121.4 $623.2 27,680 $51.21
Total Annual $4,102.9 $2,176.9 $1,020.3 43,550 $63.41
Source: TXP
The food sector in Austin touches every element of the community, although it has seldom
been identified directly as a source of economic growth and development. However, the
analysis and findings presented here suggest that view should be changed, and that food has
an economic impact commensurate with many other core aspects of the local economy.
Moreover, food is an area where Austin expresses itself. This has implications for our
external brand, but it also is important to local quality of life, and by extension the economy.
As TXP has written elsewhere, quality of life is an increasingly important factor in economic
development. This is especially the case in Austin, where there is a strong sense that its
elements come together in a unique and special way that serves to attract and retain both
residents and firms.
As was the case with the creative sector, the sum of the food sector is greater than the parts,
and the parts are interconnected. However, the ties could be stronger; if local farmers and
food artisans are able to produce and sell more to Austin consumers, restaurants, and
institutional buyers, each will benefit to the gain of the overall community. The challenge
is to identify the key actors, investments, policies, programs, and regulatory changes that can
create ongoing progress toward this goal.
2 Austin Food Sector Economic Impact | Spring 2013
Overview
From our vantage point, the food sector in Austin (at least at the point of consumption),
appears to be taking its turn as the latest reason for the rest of the world to pay homage to
Central Texas. Not that the list of accolades isn’t already extensive. For example, Austin
took the top spot for the third year in a row on Forbes’ list of “America’s 20 Fastest Growing
Cities.” Forbes also thinks we’re the best city for Young People and Jobs. Kiplinger thinks
these trends will continue, naming Austin the best city for the Next Decade. According to the
Austin Business Journal, “Austin is home to some of the best events for entrepreneurs, it
hosts some of the best bars in America for beer seekers, has one of the best schools for
entrepreneurs, is hitched to some of the best food trucks, is home to one of the coolest co-
working joints, and the University of Texas stood strong on a list of the nation’s best colleges
for the dollar.” No wonder Austin has been named the No. 1 destination on the rise in the
United States by TripAdvisor. In that same vein, Southern Living summed up the local
restaurant scene recently on their website:
Austin's restaurant scene is as hot as its notorious summers. With a posse of star chefs (Tyson Cole of Uchi and Uchiko; David Bull at Congress; Bryce Gilmore at Barley Swine; James Holmes at Olivia and Lucy's Fried Chicken), there are ample opportunities to swill and chomp in style. Barbecue groupies camp out at Franklin Barbecue, Aaron Franklin's shrine to brisket. Top chef Paul Qui is poised to open his first brick and mortar restaurant early next year. An increasingly bustling strip on South First Street provides modern ethnic (Elizabeth Street Café for French Vietnamese, and Sway, a new Thai restaurant), and smart bistros. Austin's hip East side serves up artisan bread, pretzels, and craft beer (at Easy Tiger), East Asian food trucks, urban farm dinners, and cocktail shrines. . . Add live music at every turn, tacos galore, and lethal margaritas and you’ll see why locals are smitten with Austin’s indie style.
Beneath all the excitement and hype, the food sector of the Austin economy extends far
beyond the latest hot restaurant or trailer. Agricultural products have been locally grown
from the moment the city was founded, with the variety and quality available likely never
higher than at present. Food manufacturing has been an area of opportunity for local
entrepreneurs for decades, from soup makers to nut providers and everything in between,
while local grocery stores increasingly serve visitors as well as residents (and have become
tourist destinations themselves).
In light of the above, Austin City Council passed Resolution 20120802-072, which directs the
City Manager to conduct an economic impact analysis of urban agriculture and the local food
sector in the City of Austin. For these purposes, the local food sector includes agriculture,
food-related manufacturing & distribution, food consumed at home, eating & drinking
places, and food waste. This effort is concerned with economic development, which means
that the focus is on the portion of the above activity that either brings new money to Austin
3 Austin Food Sector Economic Impact | Spring 2013
(making it primary activity) or allows us to not have to buy products from elsewhere (also
called import substitution – more on this later). Bearing this in mind, the structure of the
report is to provide context on the role that local food plays in the economy, develop an
economic impact assessment of each aspect of the food sector in Austin, provide overall
findings, and offer recommendations that can promote local food sector economic
development.
Local Food in Context
As human beings, food is central to our sense of identity. As described by anthropologist
Claude Fischler, the way any given human group eats helps it assert its diversity, hierarchy,
and organization, and at the same time, both its oneness and the otherness of whoever eats
differently.1 In a similar vein, followers of the local food movement promote the values and
benefits of consuming locally grown food in a collaborative effort to build more locally based,
self-reliant food systems. The systems are in direct contrast with the global industrial food
system, which has a much wider geographic reach. As we shall see in this section, defining
what constitutes “local” is complicated, and without a definitive answer.
In May 2010, the United States Department of Agriculture (USDA) published a report Local
Food Systems: Concepts, Impacts, and Issues2. The report is a comprehensive literature
review of food systems in the United States, including ways to define local food, estimates of
market size, descriptions of local food consumers and producers, and some preliminary
estimates as to the economic and health impact of the local food movement. Information in
this section was primarily taken directly from this USDA report.
U.S. Food Production
Throughout most of human history, eating local was not a movement but a necessity, with
the vast majority of food bought and consumed grown locally. Up through the first half of
the 20th century, few foods in the United States were processed or packaged, and the
majority of fruits and vegetables, fish, and dairy products typically traveled less than a day to
market.3 For most communities, consumption of food was dictated by what was in season
locally.
1 Fischler, Claude (June 1, 1988). Food, self, and identity. Social Science Information, Volume 27 (2) 275.
2 Martinez, Steve; Hand, Michael; Da Pra, Michelle; Pollack, Susan; Ralston, Katherine; Smith, Travis; Vogel,
Stephen; Clark, Shellye; Lohr, Luanne; Low, Sarah; and Newman, Constance (May, 2010). Local Food Systems:
Concepts, Impacts, and Issues. United States Department of Agriculture, Economic Research Report Number 97. 3 Giovannucci, D; Barnham, E; and Pirog, R. (2010). Defining and Marketing “Local” Foods: Geographic Indications
for U.S. Products. Journal of World Intellectual Property, Special Issue: The Law and Economics of Geographical
Indications, Vol. 13, March 2010.
4 Austin Food Sector Economic Impact | Spring 2013
After World War II, regional and global specialization became the norm due in part to
improvements in refrigerated trucking and lower transportation costs. Now perishable items
such as meats, eggs, fruits, and vegetables could easily be transported across the country
and the globe at affordable prices. Regions began to specialize, based on their land and
climate, and mono-cropping (in the case of fruits and vegetable) and factory farming (in the
case of animal products) became the norm. For example, fruit and tree nut production
became concentrated in California and Florida because of their climate and environment.
As the U.S. consumer was exposed to a wider array of choice, consumer tastes and
preferences changed as well. Tropical fruits such as bananas, pineapples, mangos, and
papayas typically cannot be produced profitably in the U.S., but are regularly imported from
other countries due to consumer demand. Other factors have increased U.S. imports of food
products as well, including a growing immigrant population, improvements in shipping and
quarantine methods, and the implementation of free-trade agreements. Agricultural exports
have helped some farmers stay economically viable even in the face of changing domestic
demand. For example, because Americans consume fewer grapefruit products than in the
past, nearly half of all U.S. grapefruit was exported in the first decade of the 2000’s.
Today, the mainstream food production-distribution network starts on large, industrial
farms, where products are transported to a centralized facility for further packaging,
processing, and/or inspection, then transported nationally or internationally to finally reach
their destination. As farms have consolidated over the past 50 years, so has the food
processing industry. This means that food is transported over vastly greater distances, and
the production and processing of our food is in the hands of a relatively small number of
corporations.4 This is in direct contrast to local food production-distribution networks, which
often start on smaller, sustainable family farms. Farm products are transported over shorter
distances, generally processed either on the farm itself, or with smaller processors.
According to the USDA report, there is an increasing demand for locally produced foods in
the U.S. Four out of five respondents to a 2006 national survey said they purchased fresh
produce directly from growers either occasionally or always. In another survey, half of
respondents said they purchased food directly from growers either via farmers’ markets,
joining a Community Supported Agriculture program (CSA), or buying direct from the farmer.
Interest in local food is the result of several movements. The environmental movement
considers the carbon footprint of food, and eschews long-distance transfer of food as
contributing to greenhouse gas emissions. The community food-security movement is
interested in providing access to healthy food for all income groups, and the Slow Food
4 Local & Regional Food Systems. Grace Communications Foundation. Retrieved from http://www.gracelinks.org
5 Austin Food Sector Economic Impact | Spring 2013
movement encourages traditional ways of growing, producing, and preparing foods. The
local food movement also reflects an interest in supporting local farmers and better
understanding where our food comes from. Regardless of the motivation, Americans are
increasingly drawn to consume local foods.
Defining Local
Whereas organic food has a legal definition, there is no universally accepted definition of
local food. In general, it refers to food that is grown (or raised) and harvested close to
consumers’ homes, then distributed over much shorter distances than is common in the
conventional global industrial food system. Using geography to define food as local can be
complicated, however. Federal law defines “local” as within 400 miles or inside the state,
whichever is less. A “locavore” is defined by the New Oxford American Dictionary as a
resident who tries to eat food only produced within a 100-mile radius. Others disagree with
the 100-mile radius, finding it either too broad or too restrictive. A 2008 survey found that
half of consumers surveyed described local as “made or produced within a hundred miles”
(of their homes), while another 37% described local as “made or produced in my state.”5
Closer to home, Central Texas is home to 114 farms occupying over 9,400 acres that produce
vegetables, fruits, nuts, and livestock in the five county Austin MSA region (Bastrop, Caldwell,
Hays, Travis, and Williamson). In a 2011 report done for the Sustainable Food Center (SFC),
the author calls for a delineation of what constitutes the specific boundaries of the Central
Texas foodshed – i.e., what is “local” to the Austin area. It is not unreasonable to assume the
five county region is equivalent to local, however, as the primary market for their products is
in the Austin metropolitan area.6
Population density is a factor in determining what constitutes local, because what is
considered local in a sparsely populated area may be quite different from what constitutes
local in a more heavily populated region. The ability to eat locally can also vary depending on
the type region in question; people who live in areas that are agriculturally productive year-
round would have an easier time sourcing food that is grown or raised close to their homes
than people in cold or arid regions.
In addition to geographic proximity, some consumers identify sustainable production and
distribution practices as part of what defines local. Practices that fall under this definition
include reducing use of synthetic chemicals and energy-based fertilizers, and implementing
fair farm labor practices and promoting animal welfare.
5 Local & Regional Food Systems. Grace Communications Foundation. Retrieved from http://www.gracelinks.org.
6 Banks, Karen (2011). Central Texas Foodshed Assessment, a report produced for the Sustainable Food Center.
Retrieved from http://www.sustainablefoodcenter.org/about.
6 Austin Food Sector Economic Impact | Spring 2013
Who produced the food, or “the story behind it,” is another powerful identifier that many
associate with the local food movement. The personality and ethics of the grower, the
attractiveness of the farm and surrounding landscape and the size of the farm (smaller =
better) are other factors that make up the story behind the food. Ultimately, without any
standard definition from which to draw, it is up to individual consumers to determine what
“local” means to them.
Local Food Markets
Local food distribution networks rely on two primary markets: the direct-to-consumer
market, where transactions are conducted directly between the farmers and consumers, and
the direct-to-retail/foodservice market, where farmers sell directly to restaurants, retail
stores, and institutions such as hospitals and schools.
Direct-to-consumer
Direct-to-consumer sales of agricultural products account for a small, but fast-growing
segment of U.S. agriculture. In 2007, 6 percent of all farms in the U.S. sold $1.2 billion worth
of farm products directly to consumers, or 0.8 percent of agriculture sales (excluding non-
edible products). Venues for direct-to-consumer marketing of local foods include farmers’
markets, community supported agriculture (CSAs), farm stands, on-farm sales, and “pick your
own” operations. Farmers’ markets are communal spaces in which multiple farmers gather
to sell their farm products directly to consumers. Historically, they were the primary way to
sell fresh products in urban centers, but their significance gradually declined as cities grew
larger and more mobile. Farmers’ markets may be municipally or privately managed, and
may be seasonal or year-round. Farmers usually pay a vendor’s fee to participate, which can
take the form of a flat space fee, a membership fee for the entire season, or a fee based on
percentage of vendor sales. The USDA reported that the number of farmers’ markets
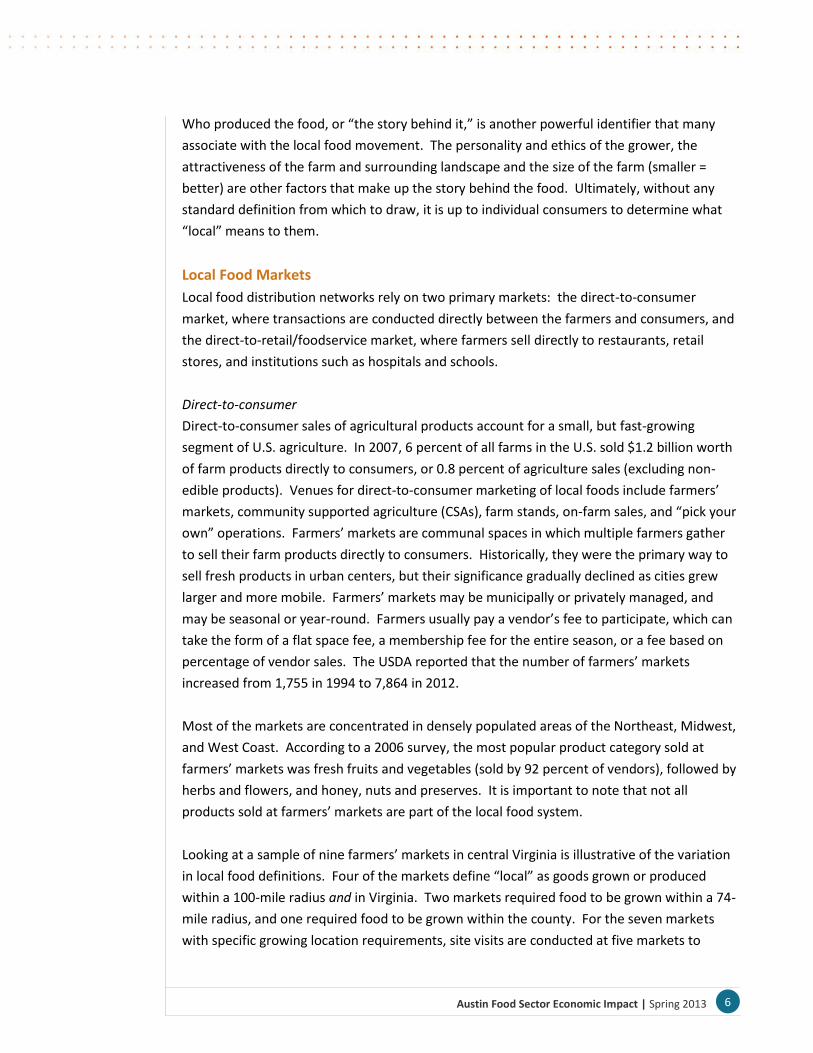
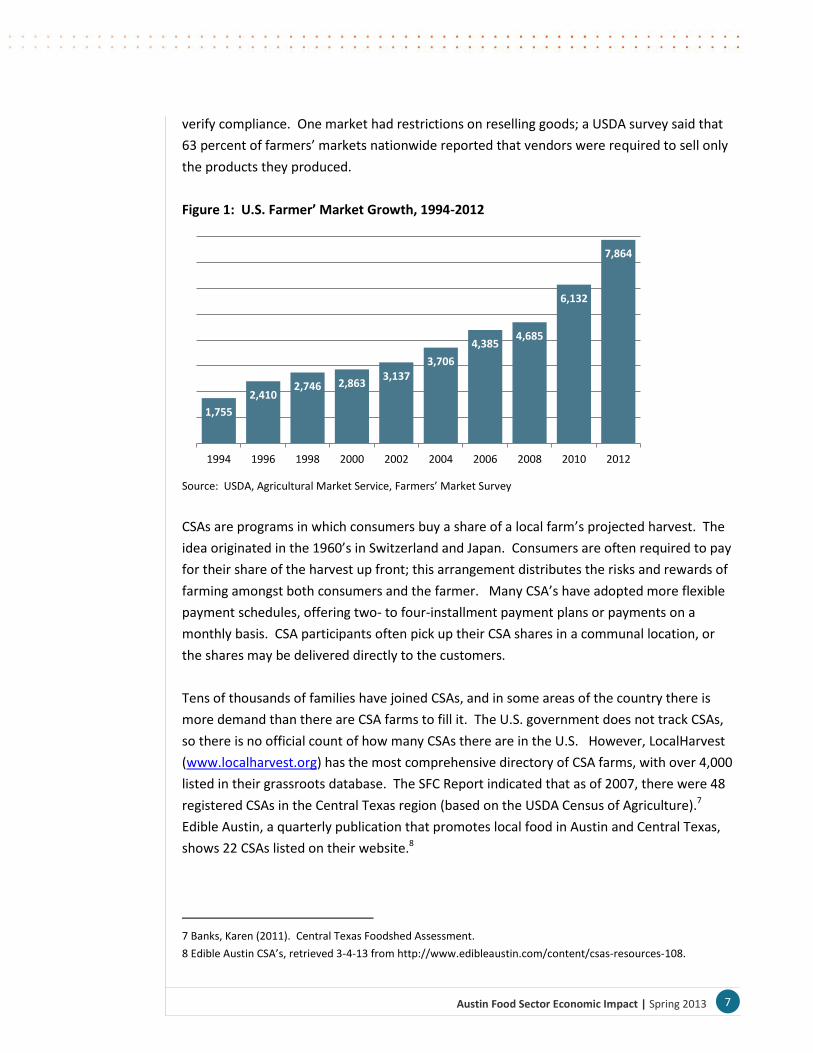
increased from 1,755 in 1994 to 7,864 in 2012.
Most of the markets are concentrated in densely populated areas of the Northeast, Midwest,
and West Coast. According to a 2006 survey, the most popular product category sold at
farmers’ markets was fresh fruits and vegetables (sold by 92 percent of vendors), followed by
herbs and flowers, and honey, nuts and preserves. It is important to note that not all
products sold at farmers’ markets are part of the local food system.
Looking at a sample of nine farmers’ markets in central Virginia is illustrative of the variation
in local food definitions. Four of the markets define “local” as goods grown or produced
within a 100-mile radius and in Virginia. Two markets required food to be grown within a 74-
mile radius, and one required food to be grown within the county. For the seven markets
with specific growing location requirements, site visits are conducted at five markets to
7 Austin Food Sector Economic Impact | Spring 2013
verify compliance. One market had restrictions on reselling goods; a USDA survey said that
63 percent of farmers’ markets nationwide reported that vendors were required to sell only
the products they produced.
Figure 1: U.S. Farmer’ Market Growth, 1994-2012
Source: USDA, Agricultural Market Service, Farmers’ Market Survey
CSAs are programs in which consumers buy a share of a local farm’s projected harvest. The
idea originated in the 1960’s in Switzerland and Japan. Consumers are often required to pay
for their share of the harvest up front; this arrangement distributes the risks and rewards of
farming amongst both consumers and the farmer. Many CSA’s have adopted more flexible
payment schedules, offering two- to four-installment payment plans or payments on a
monthly basis. CSA participants often pick up their CSA shares in a communal location, or
the shares may be delivered directly to the customers.
Tens of thousands of families have joined CSAs, and in some areas of the country there is
more demand than there are CSA farms to fill it. The U.S. government does not track CSAs,
so there is no official count of how many CSAs there are in the U.S. However, LocalHarvest
(www.localharvest.org) has the most comprehensive directory of CSA farms, with over 4,000
listed in their grassroots database. The SFC Report indicated that as of 2007, there were 48
registered CSAs in the Central Texas region (based on the USDA Census of Agriculture).7
Edible Austin, a quarterly publication that promotes local food in Austin and Central Texas,
shows 22 CSAs listed on their website.8
7 Banks, Karen (2011). Central Texas Foodshed Assessment.
8 Edible Austin CSA’s, retrieved 3-4-13 from http://www.edibleaustin.com/content/csas-resources-108.
1,755
2,410 2,746 2,863
3,137 3,706
4,385 4,685
6,132
7,864
1994 1996 1998 2000 2002 2004 2006 2008 2010 2012
8 Austin Food Sector Economic Impact | Spring 2013
Business organizations for CSAs include single farm, partnerships and farm cooperatives
(multiple farms), and limited liability corporations. An advantage of multi-farm CSAs is that
individual farms can specialize in production and pool their offerings to provide more variety
to customers. Nationally, the typical CSA offers a mix of between 8 and 12 types of produce
and herbs per week per shareholder during the growing season. Many CSAs offer non-
produce items for sale such as eggs, meat, and flowers. Twenty-nine percent of CSAs
surveyed did not produce all of their own products, with most reporting purchases from
other local growers.
A much smaller proportion of the direct-to-consumer market are options such as pick-your-
own (PYO) farms, on-site farm stands and stores, and community gardening. PYO operations
became popular in the 1930’s and 1940’s when produce prices were low and labor and
material costs were relatively higher. Some crops are better suited to PYO operations,
including berries, tomatoes, pumpkins, and Christmas trees. Roadside farm stands and on-
farm stores can either operate year round from a permanent structure or only during harvest
season from a truck, trailer or tent.
Community gardening, broadly defined, can be an urban, suburban, or rural garden that
grows flowers or vegetables. It can be one community plot, or can be many individual plots,
and can be located at a school, hospital, or in a neighborhood. According to the National
Gardening Association, 33 million households had a food garden at home, and 2 million had
one at the home of a friend, neighbor or relative, while 1 million participated in a traditional
community garden. In addition to benefitting the people who work the garden, community
gardens also benefit food banks, which often suffer from a lack of fresh vegetables. Research
also shows that gardening is correlated with increased awareness and consumption of fresh
fruits and vegetables and greater physical activity among children, urban adults, and seniors.
Direct-to-Retail/Foodservice Market
A growing component of local food systems are programs that provide farm products directly
to retail, foodservice, and institutions. These types of programs cut out the middlemen
involved in storing, processing, and/or transporting food destined for grocery and other retail
stores, restaurants, schools, hospitals, and other institutions. Some farmers rely on a “food
hub,” which is a centralized location where many farmers drop off their farm products for
distribution amongst multiple establishments. Most local food sold falls into this category.
According to USDA research, $5 billion in local foods were sold in 2007, but only $1.2 billion
of that was direct-to-consumer.
Grocery retailers promote local products as “special” or “premium” and tend to employ
common marketing strategies such as showing photographs of farmers or farm supplies.
9 Austin Food Sector Economic Impact | Spring 2013
Fresh produce is the most popular local food item, followed by dairy and eggs. Small
independent grocery retailers are better positioned to incorporate local food as part of their
corporate identity. Grocers differ as to what they designate “local” – Whole Foods, for
example, has guidelines that vary from store to store. For Whole Foods, to be considered for
the local designation, products must have traveled less than a day (7 or fewer hours by car or
truck) from farm to store. However, most of its stores have established even shorter
maximum distances.
Some large retailers are getting into the local market as well. Wal-Mart and Safeway have
both expressed commitments to increase their focus on locally grown produce, and other
national retailers have launched local campaigns meant to highlight produce grown in a
particular state (“Fresh From Florida,” “Michigan’s Best,” etc.).
In 2006, Packaged Facts reported that 87 percent of fine-dining establishments served local
items, as did 75 percent of family dining and casual dining restaurants. Surveys conducted by
the National Restaurant Association show an increasing interest in local foods by restaurants
and their customers. In an annual survey of professional chefs from 2010, locally grown
produce ranked #1 in hot trends. Seventy percent of adults in the same survey reported they
were more likely to visit a restaurant that offered locally produced food items. In a survey of
restaurant chefs and food buyers, the vast majority promoted the use of local foods on their
menus or advertising materials, purchased ingredients directly from farmers or shopped at
farmers’ markets.
Farm to school programs are another growing component of the institutional market for
locally grown produce. These programs connect schools with local food producers with the
objectives of serving local, healthy food in school cafeterias; improving student nutrition;
providing agriculture, health, and nutrition education opportunities; and supporting local and
regional farmers. Figure 2 shows results of a 2012 web-based, nine-question survey sent to
representatives in all 50 states and the District of Columbia. The goal was to obtain basic
information about Farm to School activities in each state.
10 Austin Food Sector Economic Impact | Spring 2013
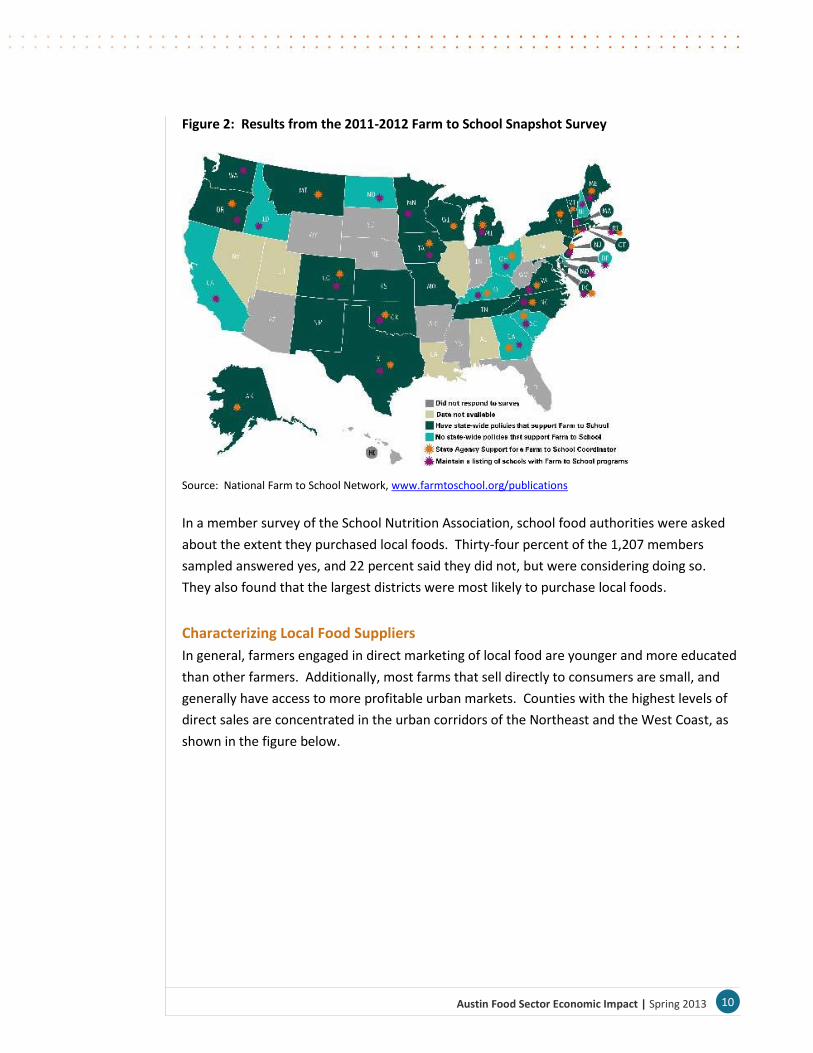
Figure 2: Results from the 2011-2012 Farm to School Snapshot Survey
Source: National Farm to School Network, www.farmtoschool.org/publications
In a member survey of the School Nutrition Association, school food authorities were asked
about the extent they purchased local foods. Thirty-four percent of the 1,207 members
sampled answered yes, and 22 percent said they did not, but were considering doing so.
They also found that the largest districts were most likely to purchase local foods.
Characterizing Local Food Suppliers
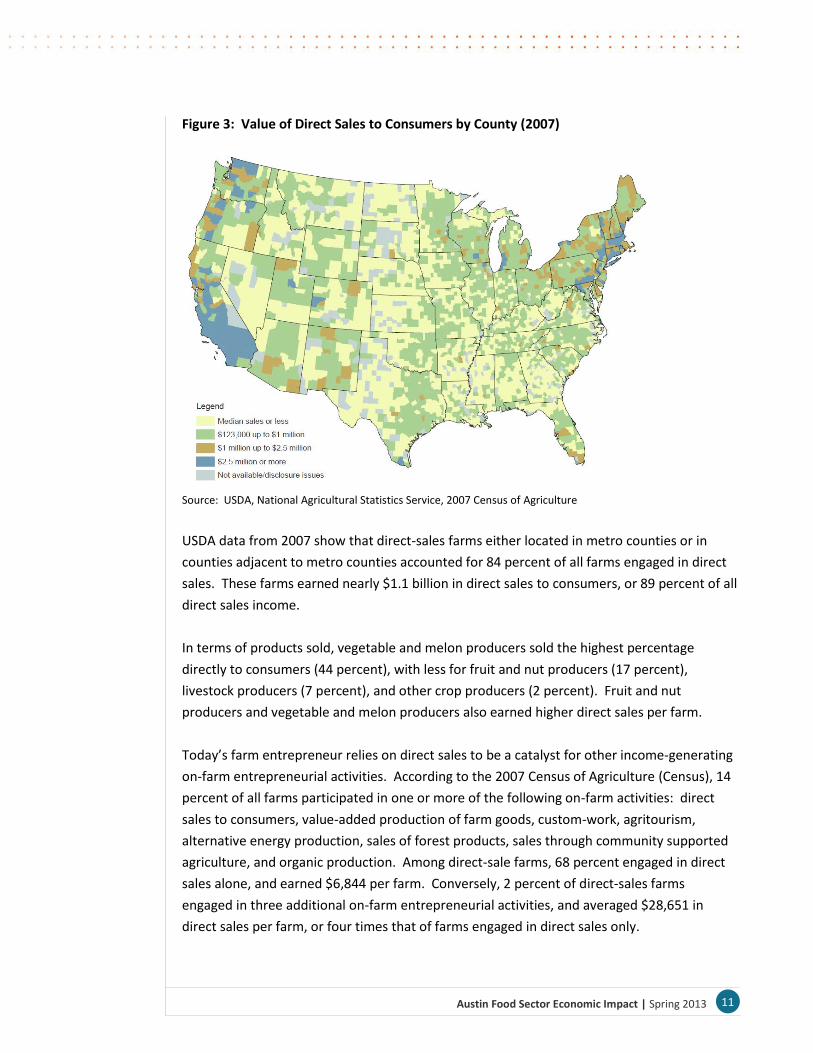
In general, farmers engaged in direct marketing of local food are younger and more educated
than other farmers. Additionally, most farms that sell directly to consumers are small, and
generally have access to more profitable urban markets. Counties with the highest levels of
direct sales are concentrated in the urban corridors of the Northeast and the West Coast, as
shown in the figure below.
11 Austin Food Sector Economic Impact | Spring 2013
Figure 3: Value of Direct Sales to Consumers by County (2007)
Source: USDA, National Agricultural Statistics Service, 2007 Census of Agriculture
USDA data from 2007 show that direct-sales farms either located in metro counties or in
counties adjacent to metro counties accounted for 84 percent of all farms engaged in direct
sales. These farms earned nearly $1.1 billion in direct sales to consumers, or 89 percent of all
direct sales income.
In terms of products sold, vegetable and melon producers sold the highest percentage
directly to consumers (44 percent), with less for fruit and nut producers (17 percent),
livestock producers (7 percent), and other crop producers (2 percent). Fruit and nut
producers and vegetable and melon producers also earned higher direct sales per farm.
Today’s farm entrepreneur relies on direct sales to be a catalyst for other income-generating
on-farm entrepreneurial activities. According to the 2007 Census of Agriculture (Census), 14
percent of all farms participated in one or more of the following on-farm activities: direct
sales to consumers, value-added production of farm goods, custom-work, agritourism,
alternative energy production, sales of forest products, sales through community supported
agriculture, and organic production. Among direct-sale farms, 68 percent engaged in direct
sales alone, and earned $6,844 per farm. Conversely, 2 percent of direct-sales farms
engaged in three additional on-farm entrepreneurial activities, and averaged $28,651 in
direct sales per farm, or four times that of farms engaged in direct sales only.
12 Austin Food Sector Economic Impact | Spring 2013
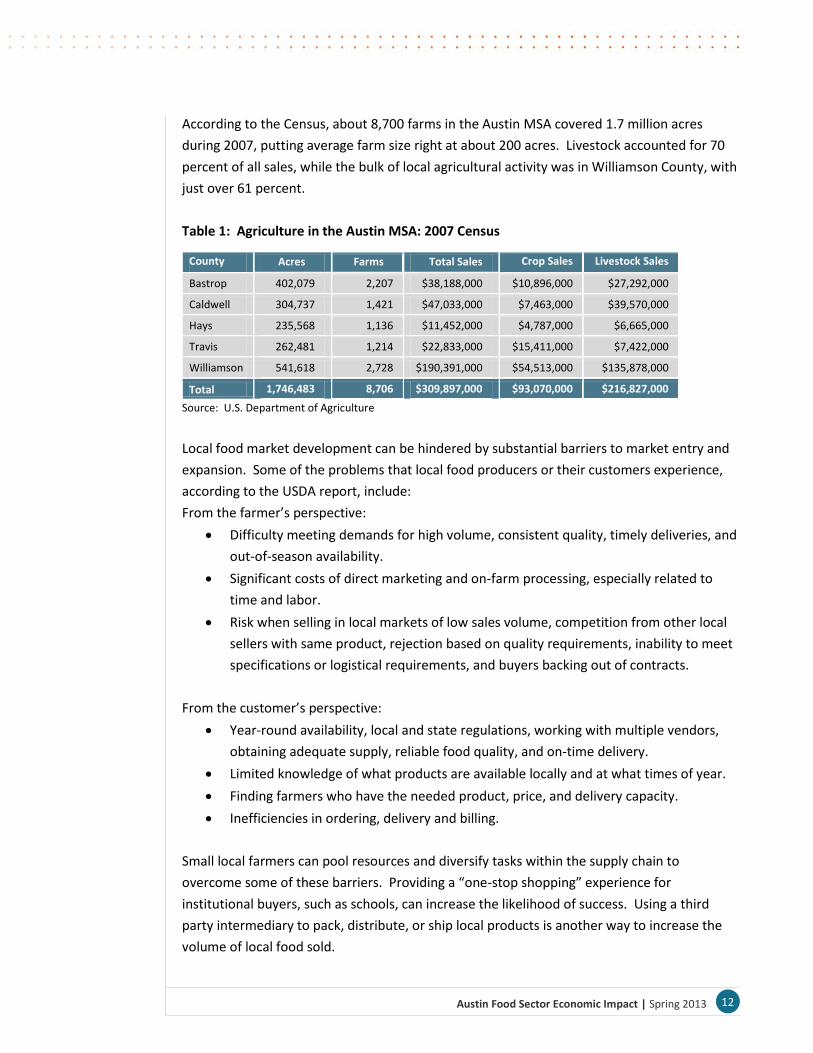
According to the Census, about 8,700 farms in the Austin MSA covered 1.7 million acres
during 2007, putting average farm size right at about 200 acres. Livestock accounted for 70
percent of all sales, while the bulk of local agricultural activity was in Williamson County, with
just over 61 percent.
Table 1: Agriculture in the Austin MSA: 2007 Census
County
Acres Farms Total Sales Crop Sales Livestock Sales
Bastrop 402,079 2,207 $38,188,000 $10,896,000 $27,292,000
Caldwell 304,737 1,421 $47,033,000 $7,463,000 $39,570,000
Hays 235,568 1,136 $11,452,000 $4,787,000 $6,665,000
Travis 262,481 1,214 $22,833,000 $15,411,000 $7,422,000
Williamson 541,618 2,728 $190,391,000 $54,513,000 $135,878,000
Total 1,746,483 8,706 $309,897,000 $93,070,000 $216,827,000
Source: U.S. Department of Agriculture
Local food market development can be hindered by substantial barriers to market entry and
expansion. Some of the problems that local food producers or their customers experience,
according to the USDA report, include:
From the farmer’s perspective:
Difficulty meeting demands for high volume, consistent quality, timely deliveries, and
out-of-season availability.
Significant costs of direct marketing and on-farm processing, especially related to
time and labor.
Risk when selling in local markets of low sales volume, competition from other local
sellers with same product, rejection based on quality requirements, inability to meet
specifications or logistical requirements, and buyers backing out of contracts.
From the customer’s perspective:
Year-round availability, local and state regulations, working with multiple vendors,
obtaining adequate supply, reliable food quality, and on-time delivery.
Limited knowledge of what products are available locally and at what times of year.
Finding farmers who have the needed product, price, and delivery capacity.
Inefficiencies in ordering, delivery and billing.
Small local farmers can pool resources and diversify tasks within the supply chain to
overcome some of these barriers. Providing a “one-stop shopping” experience for
institutional buyers, such as schools, can increase the likelihood of success. Using a third
party intermediary to pack, distribute, or ship local products is another way to increase the
volume of local food sold.
13 Austin Food Sector Economic Impact | Spring 2013
In addition to the above-mentioned barriers, lack of infrastructure has a direct effect on
production capacity. As mentioned in the USDA report,
The local food supply chain lacks mid-scale, aggregation and distribution systems that
move local food into mainstream markets in a cost-effective manner. Lack of
investment capital for supply chain infrastructure such as vehicles, temperature-
controlled storage facilities, and processing plants can be a significant barrier to
starting local aggregation and distribution businesses.
Despite interest in regional foods, institutional food buyers in particular are hampered by
current ordering methods, complicated logistics, unreliable supply and on-time delivery.
School systems, which rely on a steady supply of precooked food, are often unprepared to
handle foods that come directly from farms due to limited storage and processing facilities at
schools, and the extra preparation time required for unprocessed produce.
The inability to trace farmers’ products that have been pooled with others is another barrier.
Without the ability to trace, buyers must assume higher levels of risk and liability in cases of
foodborne illness. However, traceability requirements are often cost-prohibitive for small
producers. Buyers have also complained about farmers’ lack of expertise and training in
areas such as risk management (related to weather, pests, etc.), quality inconsistencies, food
safety liability, and fluctuating input prices. In order for local food systems to grow, many
believe that leadership and training for young farmers is a necessary first step.
Lastly, regulations with regard to food safety and processing are often unclear, and confusing
for farmers. Federal, state, county, and municipal rules may not always mesh perfectly, so
what is considered “voluntary” as a food safety requirement by the Federal Government may
not be interpreted as such by state enforcing officials.
Characterizing Local Food Demand
The local food movement has captured the attention of American consumers, producers,
food marketers, and policymakers. In this section, we summarize the USDA report’s reasons
for interest in local food markets from the perspective of the consumer, restaurants, and
food retailers.
14 Austin Food Sector Economic Impact | Spring 2013
Consumers
Several national studies have examined the characteristics, perceptions, and attitudes of
local food buyers. Participants in a 2009 national study cited the following reasons for
buying local:9
Freshness (82 percent)
Support for local economy (75 percent)
Knowing the source of the product (58 percent)
Two national studies found that local food consumers are socioeconomically diverse10,11,
while other studies have found local food buyers to be higher-earning, higher-educated
professionals.12 Characteristics common to consumers buying local food were those who
enjoy cooking, growing a food garden, frequenting health food stores, and purchasing
organic food. Interestingly, environmental and health-related attitudes were not cited as
important reasons for those buying local foods. Other studies indicated that local food
consumers tended to be female, older, more educated, higher income earners, and members
of environmental groups.13 CSA membership was found to be positively linked to higher
education, a preference for organic products, and finding out about CSA via word-of-mouth.
Consumers who don’t buy local do so due to difficulty finding local food markets, limited
accessibility, limited awareness of farmers’ market locations, inconvenience, and high prices.
CSA membership is deterred by a lack of product choice and the amount of produce
provided, as well as transportation and inconvenience of pickup place and/or time. Time-
constraining factors (such as having children under the age of 18) affect this decision more
than income level does.
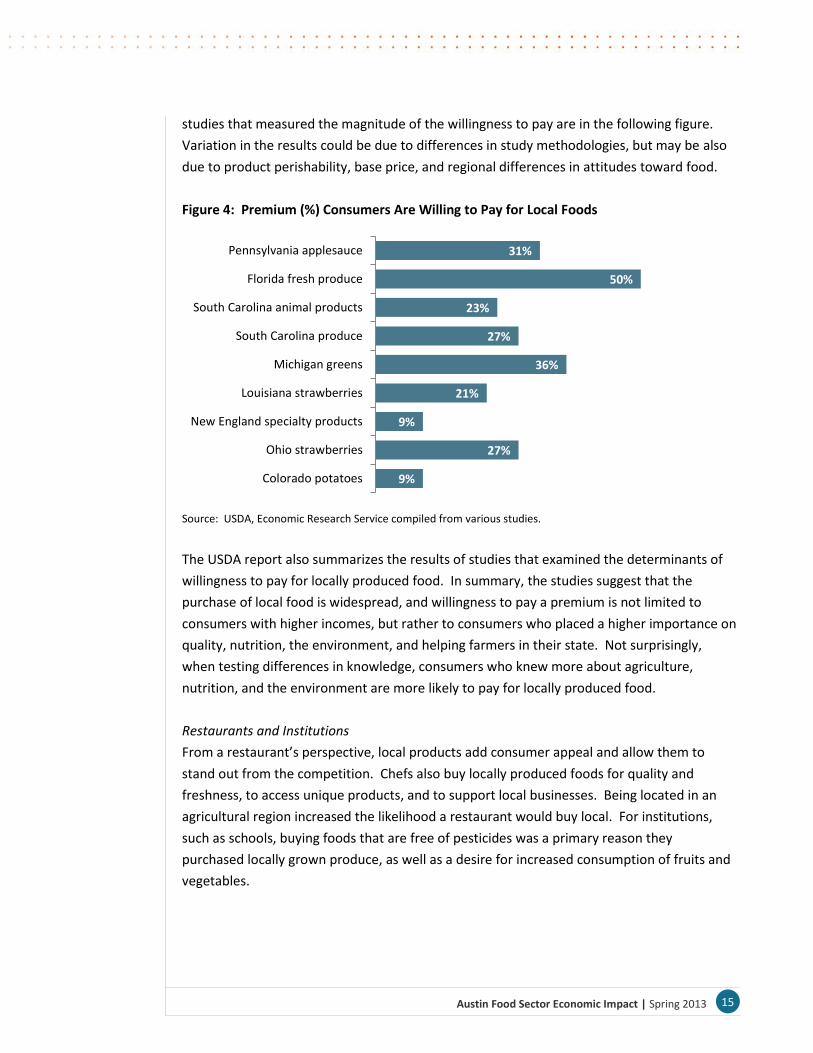
Other studies have creatively measured the additional premium that consumers would be
willing to pay for locally produced foods in ten states.14 Products in the studies included
produce (potatoes, strawberries, and salad greens), animal products (beef and pork), and
value added products (syrup, salsa, blueberry products, and applesauce). The results of the
9 Food Marketing Institute (2009). U.S. Grocery Shopper Trends, Food Marketing Institute: Arlington, VA.
10 Keeling-Bond, J., Thilmany, D., and Bond, C. (2009). What Influences Consumer Choice of Fresh Produce
Purchase Location? Journal of Agricultural and Applied Economics, 41(1):61-74. 11
Zepeda, L. and Li, J. (2006). Who Buys Local Food? Journal of Food Distribution Research, Vol. 37, pp. 1-11. 12
For example: Eastwood, D.B., Brooker, J.R., and Gray, M.D. (March, 1999). Location and Other Market
Attributes Affecting Farmers’ Market Patronage: The Case of Tennessee. Journal of Food Distribution Research,
Vol. 30, pp. 63-72. 13
For example: Brown, C. (2003). Consumers’ Preferences for Locally Produced Food: A Study in Southeast
Missouri, American Journal of Alternative Agriculture, Vol. 18, pp. 213-224. 14
Colorado, Ohio, Tennessee, Louisiana, Michigan, South Carolina, Kentucky, Pennsylvania, Maine, and West
Virginia, as well as New England.
15 Austin Food Sector Economic Impact | Spring 2013
studies that measured the magnitude of the willingness to pay are in the following figure.
Variation in the results could be due to differences in study methodologies, but may be also
due to product perishability, base price, and regional differences in attitudes toward food.
Figure 4: Premium (%) Consumers Are Willing to Pay for Local Foods
Source: USDA, Economic Research Service compiled from various studies.
The USDA report also summarizes the results of studies that examined the determinants of
willingness to pay for locally produced food. In summary, the studies suggest that the
purchase of local food is widespread, and willingness to pay a premium is not limited to
consumers with higher incomes, but rather to consumers who placed a higher importance on
quality, nutrition, the environment, and helping farmers in their state. Not surprisingly,
when testing differences in knowledge, consumers who knew more about agriculture,
nutrition, and the environment are more likely to pay for locally produced food.
Restaurants and Institutions
From a restaurant’s perspective, local products add consumer appeal and allow them to
stand out from the competition. Chefs also buy locally produced foods for quality and
freshness, to access unique products, and to support local businesses. Being located in an
agricultural region increased the likelihood a restaurant would buy local. For institutions,
such as schools, buying foods that are free of pesticides was a primary reason they
purchased locally grown produce, as well as a desire for increased consumption of fruits and
vegetables.
9%
27%
9%
21%
36%
27%
23%
50%
31%
Colorado potatoes
Ohio strawberries
New England specialty products
Louisiana strawberries
Michigan greens
South Carolina produce
South Carolina animal products
Florida fresh produce
Pennsylvania applesauce
16 Austin Food Sector Economic Impact | Spring 2013
In a survey of buyers for foodservice establishments, reasons for purchasing locally grown
food included:15
Locally grown foods have higher or better quality.
Locally grown products are fresher.
Positive relationships have developed with producers.
Customer requests have been received for locally grown products, especially after
carrying local foods for a period of time.
The availability of unique or specialty products.
Food Retailers
Unlike the interest researchers have shown in the local preferences of consumers, there are
few studies on retailers’ perspectives on local food. In a study of seven grocery store
owners, they reported that locally grown food is a growing trend that is important to
consumers and their organizations.16 Most perceived that consumer interest derived from
“their preference for high-quality fresh produce, and concerns about the local economy, food
safety, chemical use, and genetic engineering.”
In another study, it was reported that both farmers and retailers believe that increased
opportunities exist for selling more local foods if larger grocers began to source more local
farm products.17 Consumers valued local foods for both their social and food quality
benefits. Social benefits included support for the local economy and environmental benefits.
Quality benefits included freshness, taste, and high quality.
Lastly, a number of large food retailers such as Safeway, Ahold, and Delhaize have included
local food procurement as part of their reported corporate social responsibility (CSR)
activities.18 This interest in local food is seen as positively differentiating themselves from
the competition.
15
Food Processing Center (2003). Approaching Foodservice Establishments With Locally Grown Products,
University of Nebraska-Institute of Agriculture and Natural Resources, Lincoln, NE. 16
Guptill, A., and Wilkins, J.L. (2002). Buying into the Food System: Trends in Food Retailing in the U.S. and
Implications for Local Foods, Agriculture and Human Values, Vol. 19, pp. 39-51. 17
Lawless, G. et al (1999). The Farmer-Food Buyer Dialogue Project, UWCC Occasional Paper No. 13, University of
Wisconsin-Madison Center for Cooperatives, Madison, WI. 18
Corporate social responsibility reports are voluntary reports of a company’s social and environmental activities,
with accompanying financial information.
17 Austin Food Sector Economic Impact | Spring 2013
Food Waste
According to the 2011 Austin Resource Recovery Zero Waste Master Plan (the Plan), an
equally important element of the food system is in waste materials.19 Food is a major
portion of the Nation’s waste stream yet it is also a valuable resource that can be used to
protect soil and water or grow Austin’s next generation of crops. Organics, such as yard
trimmings, food scraps, compostable food-soiled paper and untreated wood, are the largest
fraction of the national waste stream, representing more than 47 percent of materials
currently disposed in landfills based on a national average. When buried in a landfill,
organics do not break down as they would in nature or in a compost pile, and so in the
process become the number one source of human-caused methane released into the
atmosphere. Other research efforts show adding nutrient-rich compost made from food
scraps to the area’s soils helps it retain water, reducing need for additional watering.
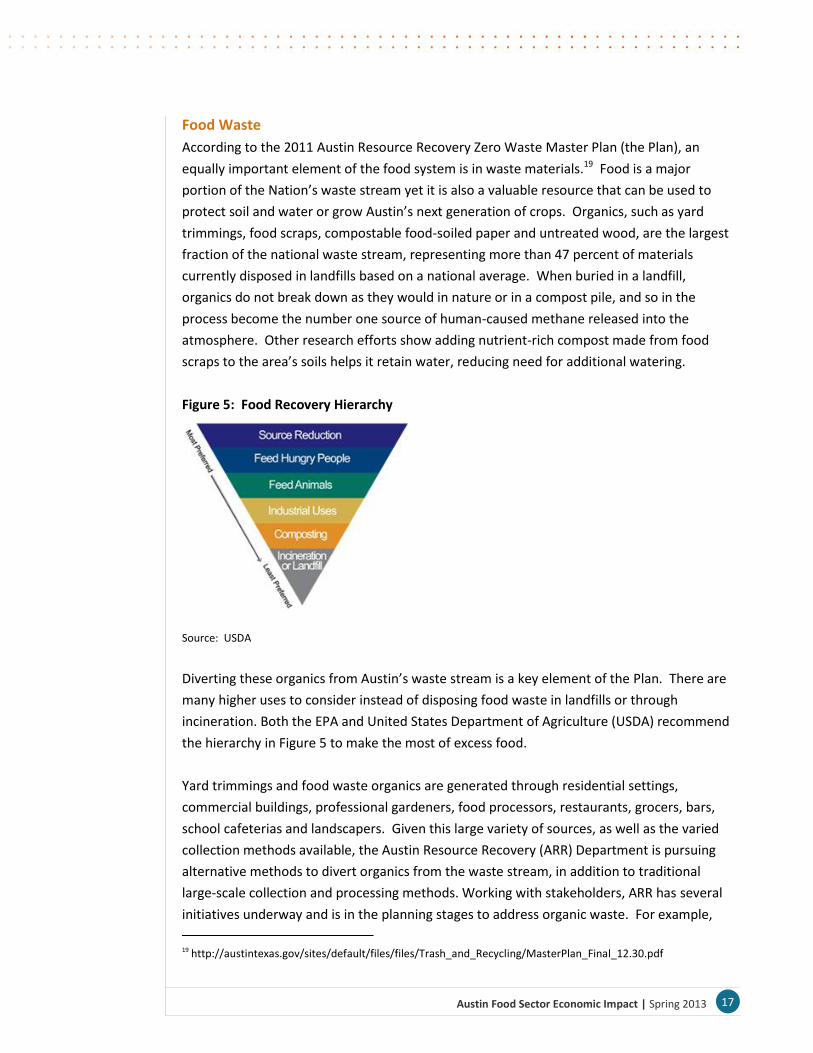
Figure 5: Food Recovery Hierarchy
Source: USDA
Diverting these organics from Austin’s waste stream is a key element of the Plan. There are
many higher uses to consider instead of disposing food waste in landfills or through
incineration. Both the EPA and United States Department of Agriculture (USDA) recommend
the hierarchy in Figure 5 to make the most of excess food.
Yard trimmings and food waste organics are generated through residential settings,
commercial buildings, professional gardeners, food processors, restaurants, grocers, bars,
school cafeterias and landscapers. Given this large variety of sources, as well as the varied
collection methods available, the Austin Resource Recovery (ARR) Department is pursuing
alternative methods to divert organics from the waste stream, in addition to traditional
large-scale collection and processing methods. Working with stakeholders, ARR has several
initiatives underway and is in the planning stages to address organic waste. For example,
19 http://austintexas.gov/sites/default/files/files/Trash_and_Recycling/MasterPlan_Final_12.30.pdf
18 Austin Food Sector Economic Impact | Spring 2013
starting in January 2013, approximately 7,900 curbside residential City customers in five pilot
areas began receiving weekly collection of organic materials that allows food scraps to be
included in the weekly curbside collection of yard trimmings. Depending on how the pilot
areas perform, additional households could be added, with the goal providing curbside
organics collection to every ARR curbside customer by 2016.
Modeling the Economic Impact of Austin Food
As discussed in the introduction, an economic impact study should focus on net gains to the
community. In this case, that means activity that either produces products that are sold
outside the local area or become substitutes for locally-consumed goods made elsewhere,
and products sold to visitors. Collectively, this is known as primary economic activity. The
following provides detail by sector of the food economy on how the inputs for the economic
impact model were derived.
Estimates of Direct Impact
Agriculture
2007 Census of Agriculture estimates for Austin MSA were grown forward to 2011 by the
national growth rate for Agriculture, with 2007 Economic Census and Census of Agriculture
ratios then used to derive estimates of payroll/income and employment as a function of
gross sales. Note that income includes government subsidy payments, as federal dollars
flowing to Austin are net new local money. Also noteworthy is the fact that total MSA
Agriculture sales during 2007 were reported at approximately $310 million (two-thirds of
which was Livestock); direct MSA sales to customers were reported at $1.3 million. Based on
that, Austin MSA residents consumed about $0.82 worth of direct agricultural products in
2007; the national average was $4.02.
Food Manufacturing
2011 Austin MSA Quarterly Census of Employment and Wages (QCEW) detailed employment
and wage data for NAICS codes that comprise Food Manufacturing was crossed against 2007
Economic Census ratios to derive gross sales estimates.
All Agriculture and Food Manufacturing is counted as net new spending; while some
inevitably is consumed by locals, the fractional amount is likely offset by the fact that locally-
produced goods provide import substitution.
Distribution and Visitor Spending
Total Distribution was calculated using the same sources and approach as Food
Manufacturing. Dean Runyon and Associates, as part of contract with State of Texas,
provides annual Austin MSA estimates of Visitor Spending for both Food at Home (Grocery
19 Austin Food Sector Economic Impact | Spring 2013
Stores) and Eating & Drinking Places (Restaurants, Bars, etc.). Those figures collectively were
approximately $1.3 billion during 2011. Meanwhile, the Texas Comptroller’s Office tracks
total gross sales (unaudited) estimates for each sector for the Austin MSA, which totaled
approximately $8.6 billion during 2011. Therefore, visitor food and drink spending was
equivalent to about 15 percent of the total. This figure is consistent with a separate
methodology developed using the Consumer Expenditure Survey to estimate what Austin
MSA residents would be expected to spend on food and drink versus the actual total, with
the delta assumed to come from spending by those who reside outside the area. The actual
Dean Runyon estimates were used as inputs for Grocery and Eating and Drinking; the 15
percent ratio was applied to the Total Distribution figure.
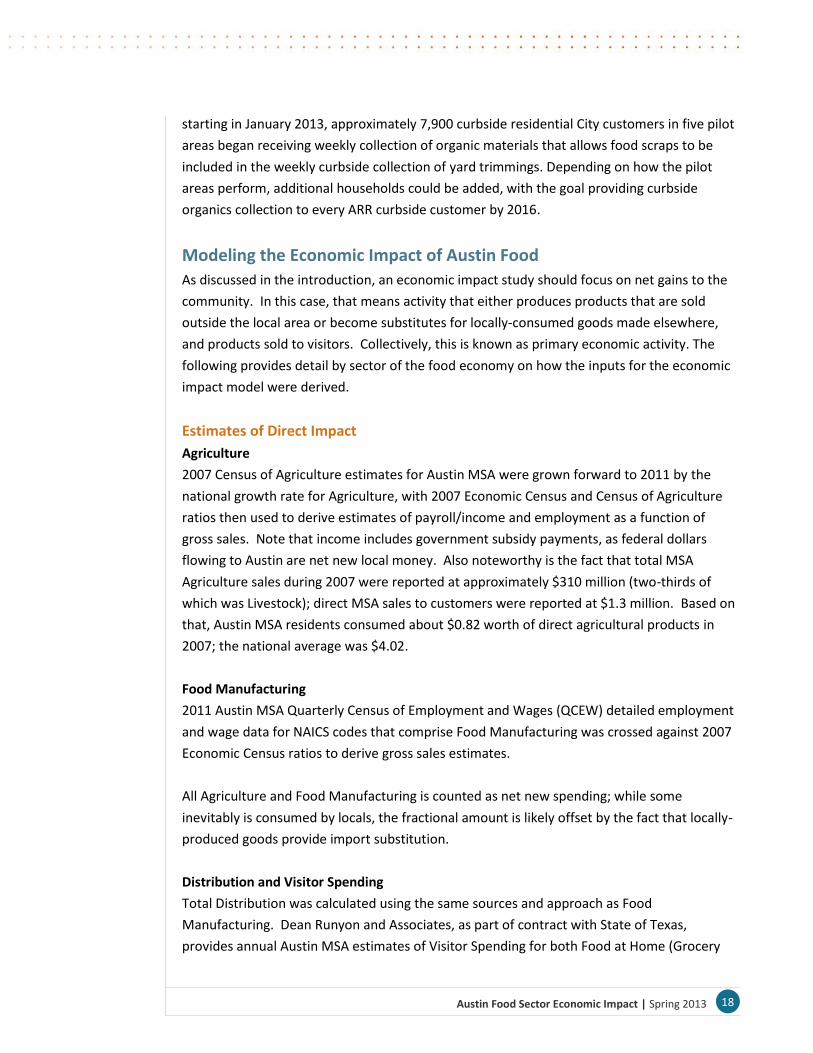
Table 2: Total Austin MSA Activity in Food-Related Sectors (2011)
2011 Totals
Sales ($Millions) Payroll ($Millions) Employment
Agriculture $350.1 $88.4 5,972
Food Manufacturing $454.4 $58.9 1,927
Food Distribution $1,228.2 $111.2 2,179
Groceries $5,072.2 $419.9 16,658
Eating & Drinking $3,509.6 $1,170.9 69,875
Total $10,614.5 $1,849.2 96,611
Source: TXP
Total sales activity in Austin MSA food-related sectors exceeded $10.6 billion last year, along
with slightly less than 100,000 jobs. The bulk of this activity serves retail consumers, either in
grocery stores or restaurant bars, as these segments account for about 90 percent of the
total.
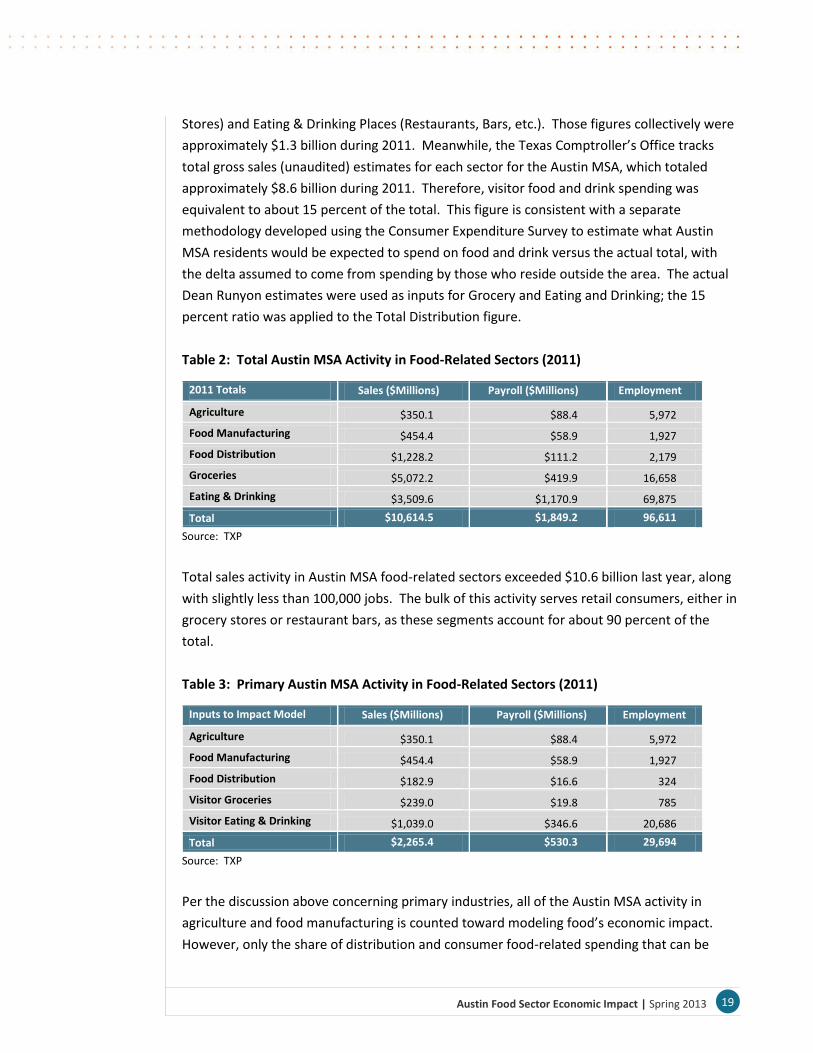
Table 3: Primary Austin MSA Activity in Food-Related Sectors (2011)
Inputs to Impact Model
Sales ($Millions) Payroll ($Millions) Employment
Agriculture $350.1 $88.4 5,972
Food Manufacturing $454.4 $58.9 1,927
Food Distribution $182.9 $16.6 324
Visitor Groceries $239.0 $19.8 785
Visitor Eating & Drinking $1,039.0 $346.6 20,686
Total $2,265.4 $530.3 29,694
Source: TXP
Per the discussion above concerning primary industries, all of the Austin MSA activity in
agriculture and food manufacturing is counted toward modeling food’s economic impact.
However, only the share of distribution and consumer food-related spending that can be
20 Austin Food Sector Economic Impact | Spring 2013
attributed to those who live outside the community is what is appropriate for economic
impact modeling, which in this case is again about 15 percent of the total for distribution,
grocery stores, and eating & drinking places. As a result, while consumer-related is still the
majority of primary food-related activity in Austin, its share drops closer to 70 percent of the
primary food-related jobs in Austin.
Economic Impact Methodology
In an input-output analysis of new economic activity, it is useful to distinguish three types of
expenditure effects: direct, indirect, and induced. Direct effects are production changes
associated with the immediate effects or final demand changes. The payment made by an
out-of-town visitor to a hotel operator is an example of a direct effect, as would be the taxi
fare that visitor paid to be transported into town from the airport.
Indirect effects are production changes in backward-linked industries caused by the changing
input needs of directly affected industries – typically, additional purchases to produce
additional output. Satisfying the demand for an overnight stay will require the hotel
operator to purchase additional cleaning supplies and services, for example, and the taxi
driver will have to replace the gasoline consumed during the trip from the airport. These
downstream purchases affect the economic status of other local merchants and workers.
Induced effects are the changes in regional household spending patterns caused by changes
in household income generated from the direct and indirect effects. Both the hotel operator
and taxi driver experience increased income from the visitor’s stay, for example, as do the
cleaning supplies outlet and the gas station proprietor. Induced effects capture the way in
which this increased income is in turn spent in the local economy.
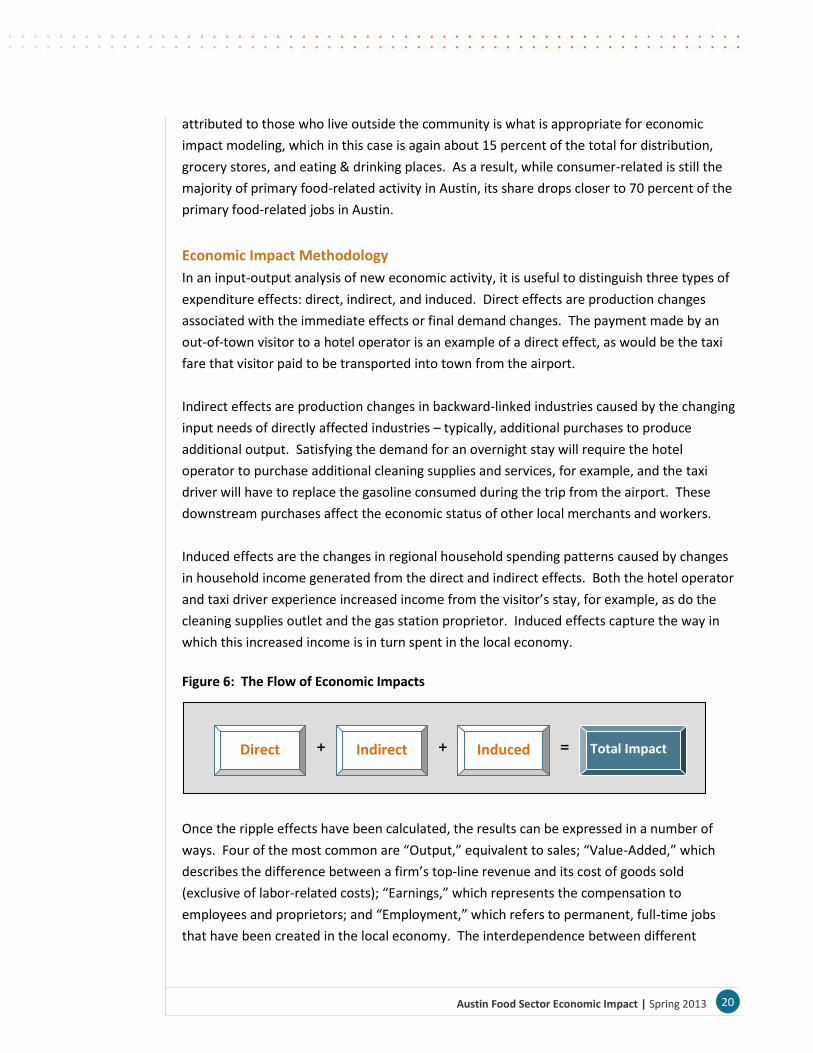
Figure 6: The Flow of Economic Impacts
Once the ripple effects have been calculated, the results can be expressed in a number of
ways. Four of the most common are “Output,” equivalent to sales; “Value-Added,” which
describes the difference between a firm’s top-line revenue and its cost of goods sold
(exclusive of labor-related costs); “Earnings,” which represents the compensation to
employees and proprietors; and “Employment,” which refers to permanent, full-time jobs
that have been created in the local economy. The interdependence between different
Indirect Induced Total Impact Direct + + =
21 Austin Food Sector Economic Impact | Spring 2013
sectors of the economy is reflected in the concept of a “multiplier.” An output multiplier, for
example, divides the total (direct, indirect and induced) effects of an initial spending injection
by the value of that injection – i.e., the direct effect.
In this analysis, the aggregate economic activity multiplier for the entire food sector is 1.86,
meaning that a dollar of direct activity creates an additional $0.86 of indirect and induced
activity. That $1.86 in turn creates $0.99 in value-added, and $0.46 in wages. On the jobs
side, the multiplier for the local food sector is 1.46, meaning that every two direct jobs create
approximately one additional job through the indirect and induced effects.
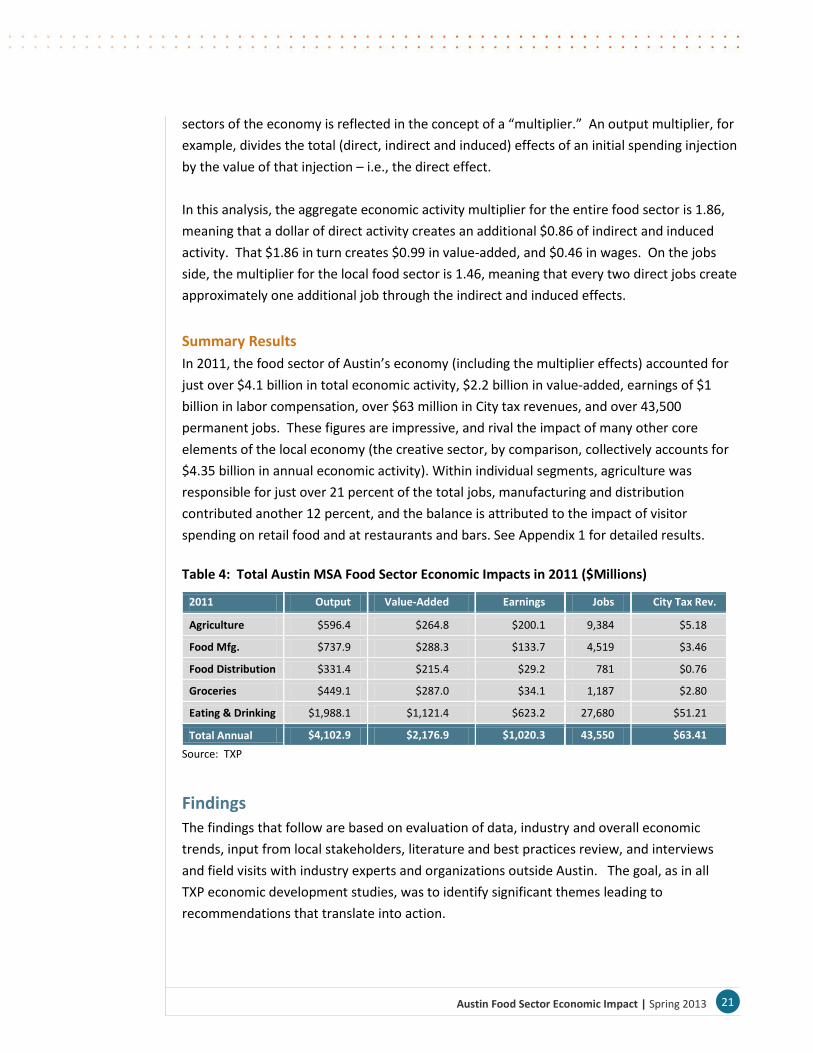
Summary Results
In 2011, the food sector of Austin’s economy (including the multiplier effects) accounted for
just over $4.1 billion in total economic activity, $2.2 billion in value-added, earnings of $1
billion in labor compensation, over $63 million in City tax revenues, and over 43,500
permanent jobs. These figures are impressive, and rival the impact of many other core
elements of the local economy (the creative sector, by comparison, collectively accounts for
$4.35 billion in annual economic activity). Within individual segments, agriculture was
responsible for just over 21 percent of the total jobs, manufacturing and distribution
contributed another 12 percent, and the balance is attributed to the impact of visitor
spending on retail food and at restaurants and bars. See Appendix 1 for detailed results.
Table 4: Total Austin MSA Food Sector Economic Impacts in 2011 ($Millions)
2011 Output Value-Added Earnings Jobs City Tax Rev.
Agriculture $596.4 $264.8 $200.1 9,384 $5.18
Food Mfg. $737.9 $288.3 $133.7 4,519 $3.46
Food Distribution $331.4 $215.4 $29.2 781 $0.76
Groceries $449.1 $287.0 $34.1 1,187 $2.80
Eating & Drinking $1,988.1 $1,121.4 $623.2 27,680 $51.21
Total Annual $4,102.9 $2,176.9 $1,020.3 43,550 $63.41
Source: TXP
Findings
The findings that follow are based on evaluation of data, industry and overall economic
trends, input from local stakeholders, literature and best practices review, and interviews
and field visits with industry experts and organizations outside Austin. The goal, as in all
TXP economic development studies, was to identify significant themes leading to
recommendations that translate into action.
22 Austin Food Sector Economic Impact | Spring 2013
Finding #1
The role of food in the local economy is intertwined across sectors and industries.
If the food sector of the economy is seen as a pyramid, then local agriculture represents the
peak, while food consumption by visitors provides the broad base. The economic impact
figures document this finding, as the dollar value of locally-grown food sold directly for
consumption (approximately $1.3 million in 2007, according to the Census) is literally a
thousand times smaller than tourist food spending (close to $1.3 billion that same year).
However, this “food pyramid” cannot be easily deconstructed, as substantial part of the
appeal for visitors is a sense that the food and drink they consume is grown, processed, or
provided by a local source. This is a crucial point, and reinforces the need to see the local
food sector holistically.
Finding #2
“Local food” is a powerful brand that means different things to different people at
different points along the food chain.
While the “local” brand is increasingly powerful when applied to Austin food, it means
different things to different people. Over the course of a number of conversations with
stakeholders in the area, the responses to the question “what do you think of when you hear
the expression ‘Austin food’?” ranged from “locally-produced using sustainable growing
practices” for some whose focus is agriculture to “[insert the name of locally-owned, iconic
restaurant here]” for those with a local small business orientation to “the trailer that serves
eggrolls with corn tortilla wrappers” for those who are Keeping It Weird to “Mexican and
BBQ!” for the old school set. The point, consistent with the first finding, is that the phrase
“Austin food” is a big tent that touches every part of the community, with the common
denominator that it is valuable and important across the spectrum.
Finding #3
Austin’s burgeoning food scene is garnering external attention, reinforcing the overall
tourism value proposition.
The introduction to this report outlined some of the external attention being paid to Austin
food. In order to take it a step further, TXP contracted with I&O Communications to use the
social media analytical tools at their disposal to evaluate the nature and scope of the
conversation. The findings (more fully outlined in Appendix 3) were interesting; it appears
that the majority of the discussion on the Austin food scene now takes place outside Austin,
and that interest spikes in and around major Austin tourist events and/or mention of Austin
food in other media. While none of that is especially surprising, it does document that the
food sector is an important element of the overall tourism asset package (along with visitor
food spending accounting for slightly less than $2.5 billion in economic impact last year), and
that social media and more traditional channels actually serve to reinforce each other for
23 Austin Food Sector Economic Impact | Spring 2013
these purposes. Even more evidence of the role of food in tourism: the listing of food events
recently by the Austin American-Statesman that are explicitly part of South by Southwest®
(SXSW®).
Finding #4
Strong demand creates substantial room for growth and economic development in the
local food sector.
The appeal of Austin food to visitors is evident in the impact figures and the media attention
(both social and traditional) that has surged in recent years. At the same time, conversations
with chefs, retailers, and institutional buyers all reinforce the notion that consumer desire for
local products, per the value of the “Austin food” brand in its many forms, is very strong. As
a result, economic development efforts across this sector likely would bear fruit. Further
expanding demand and growing supply will yield much greater overall economic activity in
this space, with the additional benefit of hopefully causing prices to drop, creating net gains
for all concerned.
Finding #5
Locally-produced food has larger multiplier effects than food “imported” from outside the
region that is consumed in Austin.
Significant time and energy has been devoted in recent years to documenting the fact that
“local” economic activity has a larger impact on the regional economy than alternatives that
rely more extensively on inputs procured from outside the trade area. Simply put, local
production (or local processing, in the case of food manufacturing) means that more money
stays in the region (i.e., has a higher multiplier) than would otherwise be the case, yielding a
larger overall local economic impact. As with much economic thinking, this is hardly a novel
concept, as developing nations have made import substitution, where economic
development focuses on domestically producing goods and services currently provided by
overseas firms, a cornerstone of trade policy for centuries. The same approach applies here,
and properly implemented, can have similar positive effects. An important caveat is to retain
the idea of comparative advantage, where nations or regions produce what they do well
relative to their competitors. The translation: it likely makes little sense to attempt to grow
agricultural products locally (at least using conventional techniques) that are not well-suited
to Central Texas growing conditions. However, expansion of cost-competitive agriculture, as
well as increased food-related processing and production, is a logical economic development
target. This is especially true in light of Finding #4, and points toward the policy
recommendations that follow.
24 Austin Food Sector Economic Impact | Spring 2013
Finding #6
In spite of Austin’s bounty, issues related to hunger and food access remain.
While the focus of this report is on food sector-related economic impact and economic
development, there clearly are much broader issues related to food that have community
implications. The SFC Report provides substantial documentation of the interaction between
hunger and food access.20 To quote from the Introduction:
According to a report by Feeding America and the Capital Area Food Bank (CAFB),
between 200,900 and 368,800 people seek help from the CAFB annually. Of those
households receiving services from CAFB, only 24.5 percent are employed, 78.3 percent
have income below 130 percent of the federal poverty level, 80 percent are food
insecure, and only 26 percent receive Supplemental Nutrition Assistance Program
(SNAP) benefits.21
Further information that illuminates the issues and some of their implications can be found
in Appendix 5, which includes maps. Specific programs to explicitly address these issues are
beyond the scope and expertise of this project, but economic development efforts that lead
to wider availability of fresh food at lower costs inevitably will have positive community
effects beyond the economic gains that accrue to producers, processors, and consumers.
Recommendations The following recommendations are based on the findings articulated above. In general,
these should be viewed as providing general guidance, rather than outlining a specific
program of work. By the same token, some are directed towards the City, while others might
be implemented by the City in conjunction with other organizations, and some may occur
entirely without direct City involvement.
Recommendation #1
Conduct detailed feasibility analysis related to creating a permanent food market(s), and a
food hub(s).
Responds to Findings: 1-6
Permanent food markets and food hubs could well speak to all of the major findings of this
report, as they offer the possibility of enhancing the Austin food sector in a way that appeals
to both tourists and locals. In that context, the field visits to the Pacific Northwest were eye-
opening in many ways, perhaps none more so than in visiting the markets and organizations
that provide a bridge between local producers and customers. 21 Acres Center for Local
20
Available at http://www.sustainablefoodcenter.org/about/reports. 21
Data originally drawn from Hunger in America 2010: Local Report Prepared for The Capital Area Food Banks of
Texas, Inc. by Mabil, et al. Available at http://cafbtx.convio.net/site/DocServer/4408.
25 Austin Food Sector Economic Impact | Spring 2013
Food & Sustainable Living is a comprehensive campus with a farm, school, food hub,
commercial kitchen, market and green-built facility outside Seattle.22 The site is the first
operating, community-oriented food hub in the region and serves as an aggregation and
distribution site for Seattle and Tacoma deliveries of food produced in the region. It helps
local farms grow their profitability by providing a central point of purchase and reducing
travel time. The Puget Sound Food Network, which is associated with 21 Acres, supports
increased production, distribution and consumption of regionally produced foods. 23
Included in members services:
weekly list of products for direct sale to increasing number of independent
producers, commercial and institutional buyers, and logistical partners in the Puget
Sound region;
discounts on popular Northwest Agriculture Business Center (NABC) workshops and
invitations to participate in marketing events; and
exclusive access to online network to list or locate products, post photos, and reach
potential customers or vendors.
Collectively, 21 Acres and the Puget Sound Food Network serve as the connection between
farmers, small scale processors, and local consumers. This is an important function that
could add substantial value in Austin. Restaurants, institutional buyers, and other food
retailers all expressed interest is some type of centralized local food market; business form
(cooperative, for-profit, 501c3, or something else) and location (physical, virtual or some
combination) are yet to be determined.
Pike Place Market in Seattle, by contrast, is one of the premier permanent markets in the
nation. Operating since the early 1900s, Pike Place hosts 90-120 farmers and artisans in a
central urban public market, as well as being home to permanent restaurants and shops
(including the original Starbucks and Sur La Table) that collectively account for over $100
million in sales annually. Approximately 60 percent of the 10 million annual patrons are
tourists (including 900,000 from cruise ships). Organized as a redevelopment authority, Pike
Place owns and manages 14 buildings on 9 acres, including 350 affordable apartments for
seniors, a child-care center and senior center, and medical clinic. Some keys to their success
include:
22
http://21acres.org/farm-to-table/regional-food-hub-at-21-acres 23
http://www.psfn.org/index.php
26 Austin Food Sector Economic Impact | Spring 2013
easy access via public and alternative transportation (bus, street car, walking, bikes);
the presence of major retail outlets, fish markets, and restaurants that pay premium
rent (i.e., Sur La Table, etc.); and,
working with day vendors to make sure they gross sufficient revenue ( $500-
$800/day) to be worth the effort.
Several important lessons emerged. First, there is no real “one-size fits all” approach to
creating food hubs or permanent markets, and additional analysis and research would be
necessary to determine the appropriate mix, location(s), and scale of efforts for Austin. This
may or may not involve the City. In Portland, for example, the approximately 45 markets are
privately developed, owned and managed, although they do rely on the city for assistance
with parking and other regulatory issues. However, these are not permanent markets, and so
do not enjoy either the infrastructure or market presence of Pike Place. In terms of the
“product mix” in the market, it was clear that the relationship between day vendors and
larger, permanent tenants was very much one of synergy - visitors are drawn to the ever-
changing diversity of products from day vendors and then extend their stay for a meal or to
go shopping for home goods, to the benefit of all. This interconnection likely would
translate, suggesting a diversity of both providers and product offerings would be
appropriate. An important caveat to this view is that, in order to maximize the value, the
overall experience must feel authentic to Austin.
Recommendation #2
Identify infrastructure, facilities, and programs that could further support local food
manufacturing/processing.
Responds to Findings: 1,2,4,5
Food processing traditionally (at least in the most recent sense) is largely about economies of
scale, wide-spread distribution, and a focus on cost-competitiveness. However, the artisan
movement has created demand for not only locally-sourced agriculture, but small-batch
value-added products made locally as well. While Austin hosts a range of successful
processed food entrepreneurs (such as Lamme’s Candies, Sweet Leaf Tea, Tito’s Vodka, etc.)
additional resources related to business development and processing capacity could make
the situation even better. An example of this type of resource is the Oregon State Food
Innovation Center in Portland, which provides comprehensive technical assistance to start-up
food manufacturers. Faculty and staff work with clients on product development, nutrition
analysis and sourcing of ingredients, packaging, food safety, marketing and distribution.
Contract processing facilities seems to be an area of opportunity as well, as there does not
appear to be a slaughterhouse in the Austin area focused on smaller-scale producers.
Overall, the basic idea is to bring the same kind of business support and networks (including
27 Austin Food Sector Economic Impact | Spring 2013
financing) that have sprung up around technology-related activity in Austin to the food
sector, in the process creating additional infrastructure related to food manufacturing.
Recommendation #3
Work to make vacant lands available for urban agriculture.
Responds to Findings: 1-6
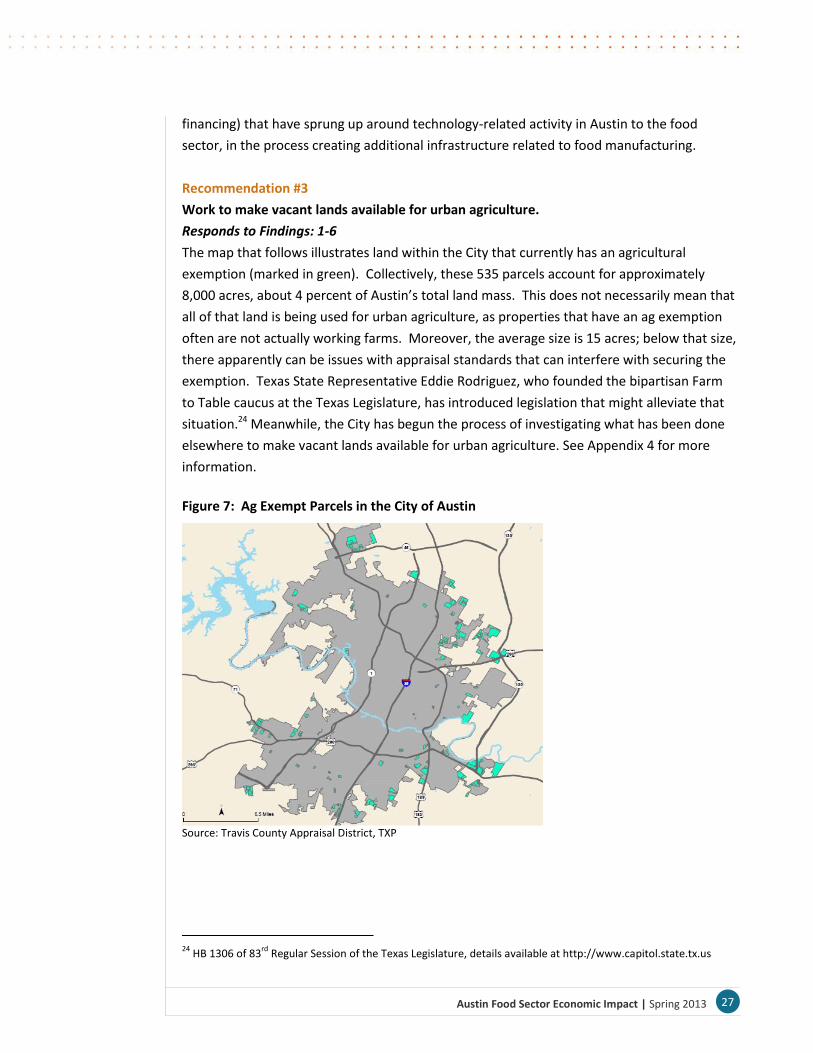
The map that follows illustrates land within the City that currently has an agricultural
exemption (marked in green). Collectively, these 535 parcels account for approximately
8,000 acres, about 4 percent of Austin’s total land mass. This does not necessarily mean that
all of that land is being used for urban agriculture, as properties that have an ag exemption
often are not actually working farms. Moreover, the average size is 15 acres; below that size,
there apparently can be issues with appraisal standards that can interfere with securing the
exemption. Texas State Representative Eddie Rodriguez, who founded the bipartisan Farm
to Table caucus at the Texas Legislature, has introduced legislation that might alleviate that
situation.24 Meanwhile, the City has begun the process of investigating what has been done
elsewhere to make vacant lands available for urban agriculture. See Appendix 4 for more
information.
Figure 7: Ag Exempt Parcels in the City of Austin
Source: Travis County Appraisal District, TXP
24
HB 1306 of 83rd
Regular Session of the Texas Legislature, details available at http://www.capitol.state.tx.us
28 Austin Food Sector Economic Impact | Spring 2013
Recommendation #4
Investigate and promote resources to provide economic development support to local
farmers.
Responds to Findings: 1-5
A range of resources exist that can provide financial and technical support to urban farming.
For example, the USDA has recently announced a new micro-lending program that makes
available up to $35,000 at competitive interest rates for operating expenses. Terms are
somewhat flexible, although repayment must occur within seven years. Meanwhile, the
Texas A&M Agrilife Extension Service makes available locally their Strong Starts: Urban
Farming 101 series “to teach new and aspiring small acreage farmers with an interest in
sustainable methods.” According to their annual report, 35 participants from 11 Central
Texas counties attended last year, with “most owning five acres or less.” Seminar topics
included business and marketing strategies; appropriate vegetable and fruit varieties;
techniques and strategies for urban farms; a site visit to a local urban farm, and resources
available to small farmers including TDA, USDA-NRCS, and USDA-FSA. The report states that
“participants reported increased knowledge and intention to implement best management
practices. 95 percent gained understanding of business planning and marketing strategies for
small farming operations, and nearly 70 percent reported planning to utilize creative,
community-centered income streams, such as holding farm camps, hosting special events, or
adding a small Bed and Breakfast facility to their operations. One participants comment was:
“Very good experience led by capable experts. Considering this was the first of its kind, very
well done. This should be replicated in the counties surrounding all large metropolitan
areas.”
Beyond these resources, the market-related recommendations outlined above could have a
measurable impact on increasing demand for local food and improving market conditions for
local farmers and artisans. Zoning and regulation also is an issue, with Portland an example
of a regulatory environment that better accommodates urban agriculture and farm stands.
Finally, additional focused technical assistance around business planning, securing financing,
etc. could be provided through the City’s Small Business Development office.
Recommendation #5
Explore ways to use mobile vendors to mitigate access issues in certain parts of the
community.
Responds to Finding: 6
As discussed above it’s clear that access and affordability issues around fresh food remain for
many segments of our community. There are a range of ideas on how best to deal with this
problem (such incentivizing grocery stores, expanding the footprint of community gardens
and farmer’s markets, SNAP multiplier programs, subsidized public transportation to expand
29 Austin Food Sector Economic Impact | Spring 2013
access, etc.) that have either been implemented or explored elsewhere. However, mobile
vendors appear to be a largely untried idea locally that could be part of the answer. In
Portland, My Street Grocery is a community mobile grocer that sees itself as “a traveling
farmers market or a mini grocery story on wheels.” Another interesting version of this model
is New York City’s Green Cart initiative. Since 2008, the city has made provisions to authorize
1,000 new permits for street vendors who can sell only raw fruits and vegetables in areas of
the city that have been designated in need of them. The idea is to harness the enterprise of
small-business people to mitigate a social problem in a sustainable way. Approximately 500
carts are in operation today, at a startup cost of $1,800 to $3,000. According to the online
content from the New York Times, “success depends on several factors, but the most
important seem to be the resourcefulness of the entrepreneur, the ability to secure a good
location and the ability to build relationships with customers. Finding entrepreneurs who
want to serve their own neighborhoods seems particularly helpful.”25
Recommendation #6
Explicitly incorporate the role of local food in external marketing and community education
efforts.
Responds to Findings: 1, 3
As outlined in the Overview and Finding #3, it looks like the rest of the world is talking a lot
about food in Austin. This is a significant opportunity to further expand the brand, and
continue the evolution of our external identity to include a broader view of entertainment,
creativity, and lifestyle. More specific research likely is needed to refine the exact structure
and form of the messages, but the payoff could be enormous. Community education is also
important, as greater take-up of local food in its many forms will have positive implications
for both the community’s economic and physical well-being. In both cases, the City can
provide leadership, not only through its own efforts, but in partnership with other
institutions and stakeholders. Finally, much of the ultimate measure of these
recommendations and other City actions is not just implementation but awareness, which
puts further emphasis on outreach efforts.
25
Available at http://opinionator.blogs.nytimes.com/2012/04/18/conquering-food-deserts-with-green-carts/
30 Austin Food Sector Economic Impact | Spring 2013
Conclusion
The food sector in Austin touches every element of the community, although it has seldom
been identified directly as a source of economic growth and development. However, the
analysis and findings presented here suggest that view should be changed, and that food has
an economic impact commensurate with many other core aspects of the local economy.
Moreover, food is an area where Austin expresses itself. This has implications for our
external brand, but it also is important to local quality of life, and by extension the economy.
As we’ve written before, quality of life is an increasingly important factor in economic
development. This is especially the case in Austin, where there is a strong sense that its
elements come together in a unique and special way that serves to attract and retain both
residents and firms.
As was the case with the creative sector, the sum of the food sector is greater than the parts,
and the parts are interconnected. However, the ties could be stronger; if local farmers and
food artisans are able to produce and sell more to Austin consumers, restaurants, and
institutional buyers, each will benefit to the gain of the overall community. The challenge
is to identify the key actors, investments, policies, programs, and regulatory changes that can
create ongoing progress toward this goal.
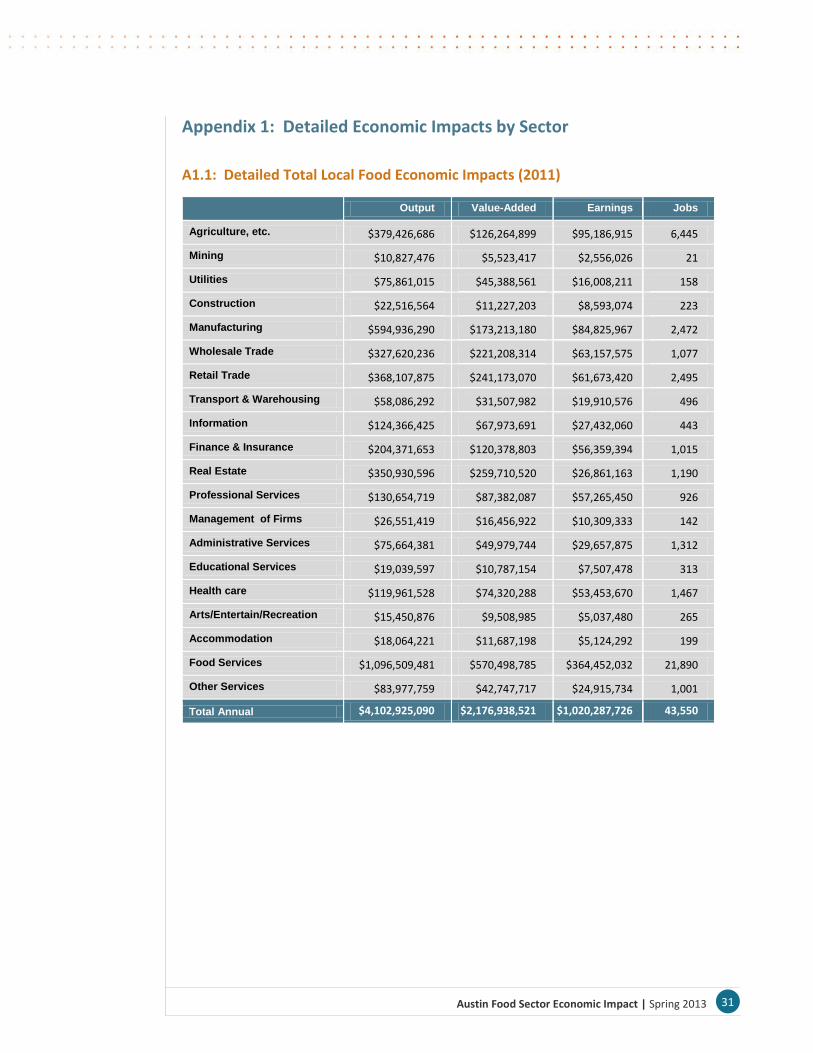
31 Austin Food Sector Economic Impact | Spring 2013
Appendix 1: Detailed Economic Impacts by Sector
A1.1: Detailed Total Local Food Economic Impacts (2011)
Output Value-Added Earnings Jobs
Agriculture, etc. $379,426,686 $126,264,899 $95,186,915 6,445
Mining $10,827,476 $5,523,417 $2,556,026 21
Utilities $75,861,015 $45,388,561 $16,008,211 158
Construction $22,516,564 $11,227,203 $8,593,074 223
Manufacturing $594,936,290 $173,213,180 $84,825,967 2,472
Wholesale Trade $327,620,236 $221,208,314 $63,157,575 1,077
Retail Trade $368,107,875 $241,173,070 $61,673,420 2,495
Transport & Warehousing $58,086,292 $31,507,982 $19,910,576 496
Information $124,366,425 $67,973,691 $27,432,060 443
Finance & Insurance $204,371,653 $120,378,803 $56,359,394 1,015
Real Estate $350,930,596 $259,710,520 $26,861,163 1,190
Professional Services $130,654,719 $87,382,087 $57,265,450 926
Management of Firms $26,551,419 $16,456,922 $10,309,333 142
Administrative Services $75,664,381 $49,979,744 $29,657,875 1,312
Educational Services $19,039,597 $10,787,154 $7,507,478 313
Health care $119,961,528 $74,320,288 $53,453,670 1,467
Arts/Entertain/Recreation $15,450,876 $9,508,985 $5,037,480 265
Accommodation $18,064,221 $11,687,198 $5,124,292 199
Food Services $1,096,509,481 $570,498,785 $364,452,032 21,890
Other Services $83,977,759 $42,747,717 $24,915,734 1,001
Total Annual $4,102,925,090 $2,176,938,521 $1,020,287,726 43,550
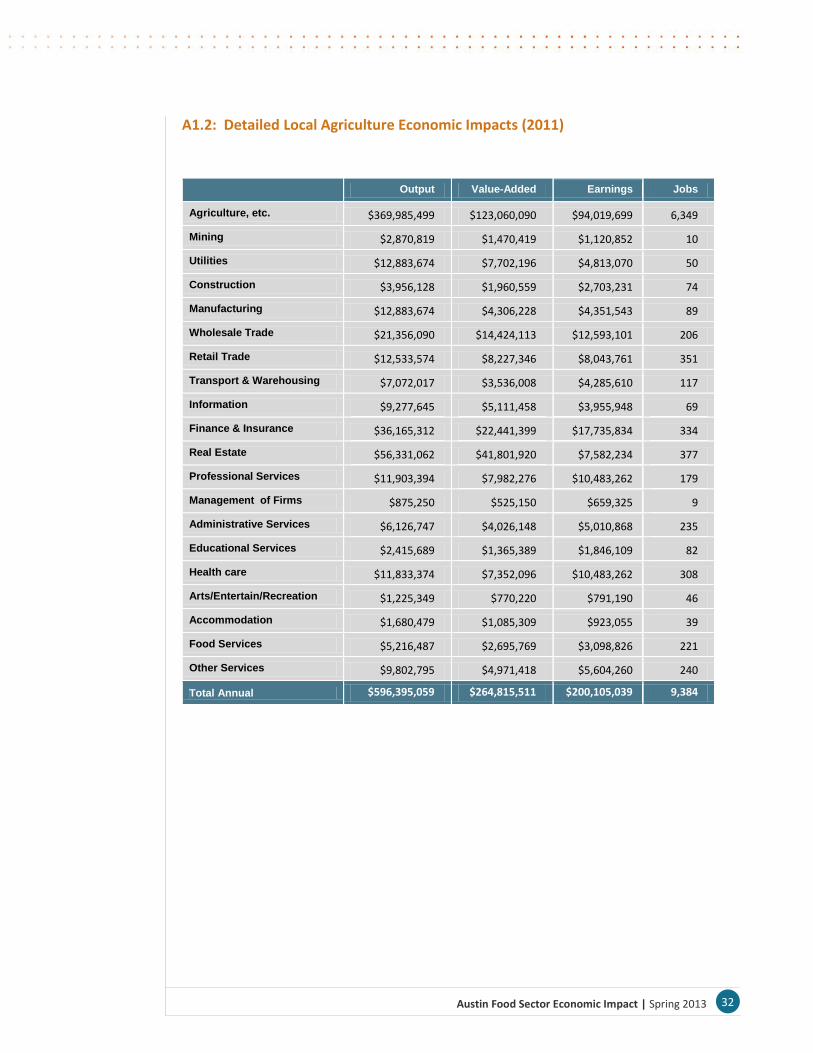
32 Austin Food Sector Economic Impact | Spring 2013
A1.2: Detailed Local Agriculture Economic Impacts (2011)
Output Value-Added Earnings Jobs
Agriculture, etc. $369,985,499 $123,060,090 $94,019,699 6,349
Mining $2,870,819 $1,470,419 $1,120,852 10
Utilities $12,883,674 $7,702,196 $4,813,070 50
Construction $3,956,128 $1,960,559 $2,703,231 74
Manufacturing $12,883,674 $4,306,228 $4,351,543 89
Wholesale Trade $21,356,090 $14,424,113 $12,593,101 206
Retail Trade $12,533,574 $8,227,346 $8,043,761 351
Transport & Warehousing $7,072,017 $3,536,008 $4,285,610 117
Information $9,277,645 $5,111,458 $3,955,948 69
Finance & Insurance $36,165,312 $22,441,399 $17,735,834 334
Real Estate $56,331,062 $41,801,920 $7,582,234 377
Professional Services $11,903,394 $7,982,276 $10,483,262 179
Management of Firms $875,250 $525,150 $659,325 9
Administrative Services $6,126,747 $4,026,148 $5,010,868 235
Educational Services $2,415,689 $1,365,389 $1,846,109 82
Health care $11,833,374 $7,352,096 $10,483,262 308
Arts/Entertain/Recreation $1,225,349 $770,220 $791,190 46
Accommodation $1,680,479 $1,085,309 $923,055 39
Food Services $5,216,487 $2,695,769 $3,098,826 221
Other Services $9,802,795 $4,971,418 $5,604,260 240
Total Annual $596,395,059 $264,815,511 $200,105,039 9,384

33 Austin Food Sector Economic Impact | Spring 2013
A1.3: Detailed Food Production Economic Impacts (2011)
Output Value-Added Earnings Jobs
Agriculture, etc. $7,997,340 $2,680,926 $1,046,578 87
Mining $1,408,622 $727,031 $261,645 3
Utilities $12,086,889 $7,224,870 $2,311,193 29
Construction $3,226,200 $1,590,380 $1,133,793 38
Manufacturing $494,108,378 $136,999,886 $65,149,483 2,098
Wholesale Trade $35,488,196 $23,946,580 $10,640,210 215
Retail Trade $16,858,029 $11,041,782 $5,494,535 297
Transport & Warehousing $10,132,993 $5,043,777 $3,096,127 107
Information $15,676,604 $8,588,053 $3,663,023 77
Finance & Insurance $22,992,352 $13,540,951 $5,974,216 142
Real Estate $36,942,258 $27,218,219 $2,834,482 156
Professional Services $20,993,017 $14,040,784 $9,419,202 199
Management of Firms $8,724,371 $5,407,292 $3,444,986 59
Administrative Services $11,223,540 $7,406,627 $4,665,994 271
Educational Services $2,362,850 $1,317,744 $915,756 50
Health care $15,540,286 $9,633,159 $7,020,794 254
Arts/Entertain/Recreation $1,772,138 $1,090,546 $566,896 41
Accommodation $2,362,850 $1,544,941 $654,111 34
Food Services $7,270,309 $3,771,473 $2,223,978 194
Other Services $10,769,145 $5,498,171 $3,139,734 167
Total Annual $737,936,368 $288,313,193 $133,656,736 4,519
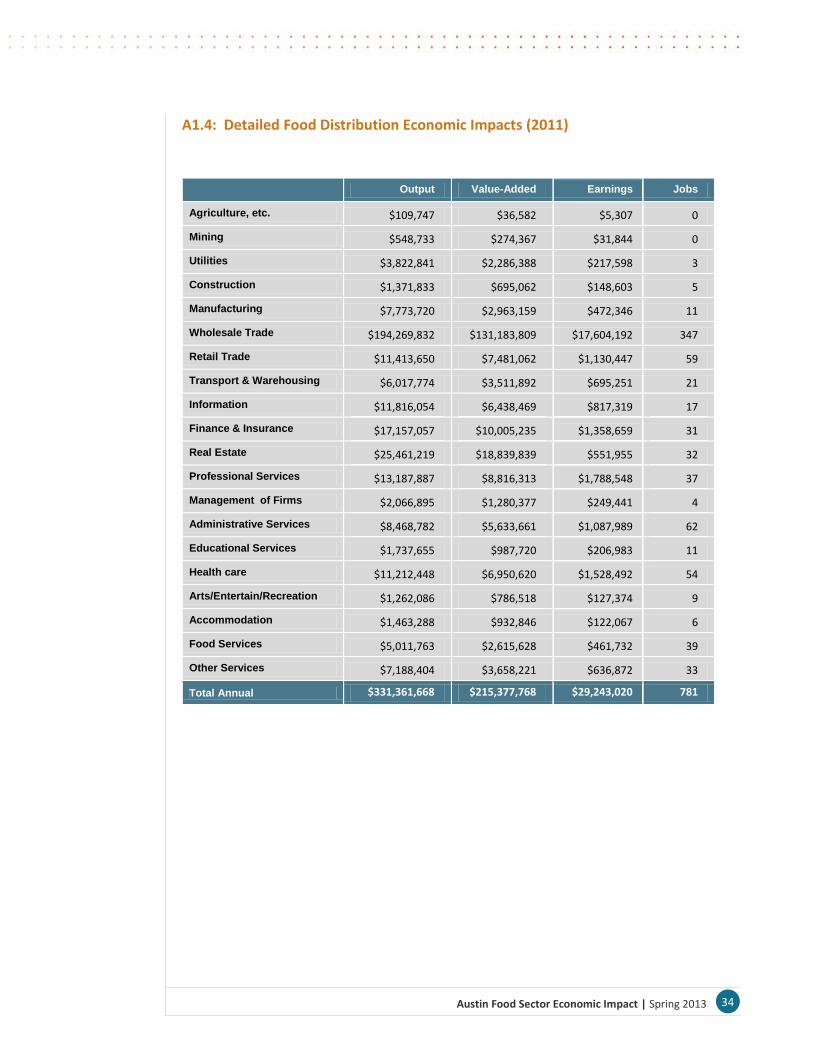
34 Austin Food Sector Economic Impact | Spring 2013
A1.4: Detailed Food Distribution Economic Impacts (2011)
Output Value-Added Earnings Jobs
Agriculture, etc. $109,747 $36,582 $5,307 0
Mining $548,733 $274,367 $31,844 0
Utilities $3,822,841 $2,286,388 $217,598 3
Construction $1,371,833 $695,062 $148,603 5
Manufacturing $7,773,720 $2,963,159 $472,346 11
Wholesale Trade $194,269,832 $131,183,809 $17,604,192 347
Retail Trade $11,413,650 $7,481,062 $1,130,447 59
Transport & Warehousing $6,017,774 $3,511,892 $695,251 21
Information $11,816,054 $6,438,469 $817,319 17
Finance & Insurance $17,157,057 $10,005,235 $1,358,659 31
Real Estate $25,461,219 $18,839,839 $551,955 32
Professional Services $13,187,887 $8,816,313 $1,788,548 37
Management of Firms $2,066,895 $1,280,377 $249,441 4
Administrative Services $8,468,782 $5,633,661 $1,087,989 62
Educational Services $1,737,655 $987,720 $206,983 11
Health care $11,212,448 $6,950,620 $1,528,492 54
Arts/Entertain/Recreation $1,262,086 $786,518 $127,374 9
Accommodation $1,463,288 $932,846 $122,067 6
Food Services $5,011,763 $2,615,628 $461,732 39
Other Services $7,188,404 $3,658,221 $636,872 33
Total Annual $331,361,668 $215,377,768 $29,243,020 781
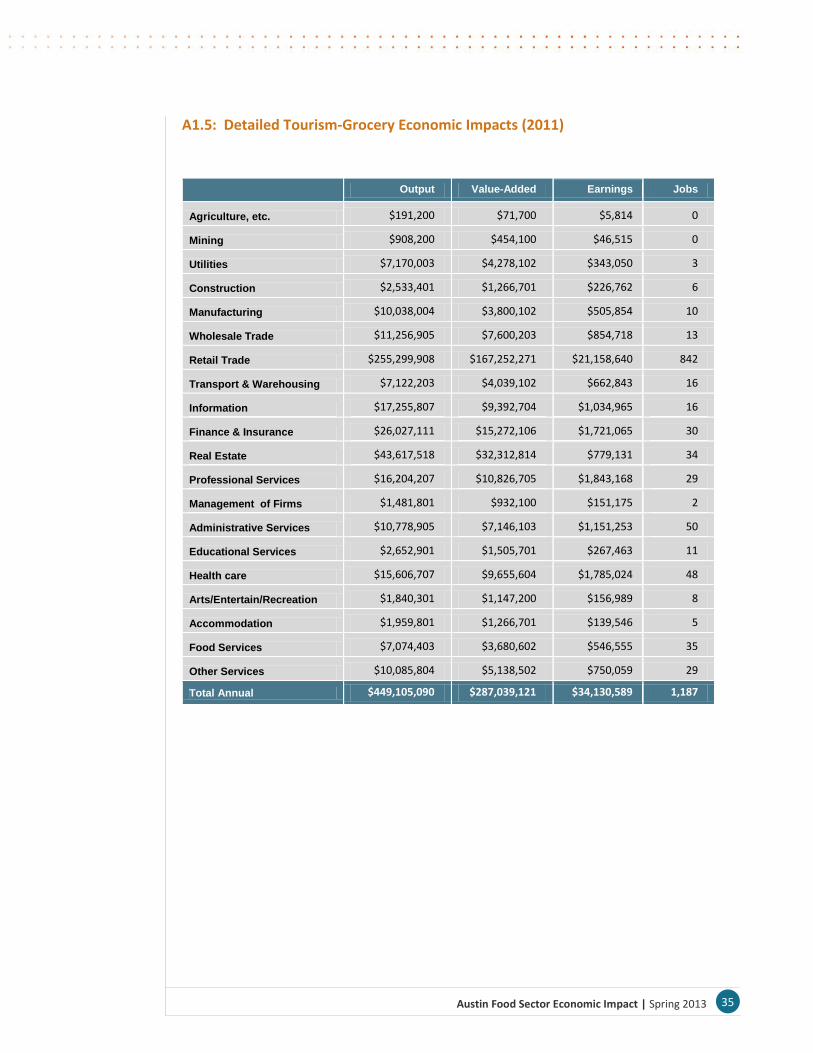
35 Austin Food Sector Economic Impact | Spring 2013
A1.5: Detailed Tourism-Grocery Economic Impacts (2011)
Output Value-Added Earnings Jobs
Agriculture, etc. $191,200 $71,700 $5,814 0
Mining $908,200 $454,100 $46,515 0
Utilities $7,170,003 $4,278,102 $343,050 3
Construction $2,533,401 $1,266,701 $226,762 6
Manufacturing $10,038,004 $3,800,102 $505,854 10
Wholesale Trade $11,256,905 $7,600,203 $854,718 13
Retail Trade $255,299,908 $167,252,271 $21,158,640 842
Transport & Warehousing $7,122,203 $4,039,102 $662,843 16
Information $17,255,807 $9,392,704 $1,034,965 16
Finance & Insurance $26,027,111 $15,272,106 $1,721,065 30
Real Estate $43,617,518 $32,312,814 $779,131 34
Professional Services $16,204,207 $10,826,705 $1,843,168 29
Management of Firms $1,481,801 $932,100 $151,175 2
Administrative Services $10,778,905 $7,146,103 $1,151,253 50
Educational Services $2,652,901 $1,505,701 $267,463 11
Health care $15,606,707 $9,655,604 $1,785,024 48
Arts/Entertain/Recreation $1,840,301 $1,147,200 $156,989 8
Accommodation $1,959,801 $1,266,701 $139,546 5
Food Services $7,074,403 $3,680,602 $546,555 35
Other Services $10,085,804 $5,138,502 $750,059 29
Total Annual $449,105,090 $287,039,121 $34,130,589 1,187

36 Austin Food Sector Economic Impact | Spring 2013
A1.6: Detailed Tourism-Eating & Drinking Impacts (2011)
Output Value-Added Earnings Jobs
Agriculture, etc. $1,142,900 $415,600 $109,517 9
Mining $5,091,101 $2,597,501 $1,095,171 7
Utilities $39,897,608 $23,897,005 $8,323,300 73
Construction $11,429,002 $5,714,501 $4,380,684 101
Manufacturing $70,132,514 $25,143,805 $14,346,741 264
Wholesale Trade $65,249,213 $44,053,609 $21,465,353 296
Retail Trade $72,002,715 $47,170,610 $25,846,037 946
Transport & Warehousing $27,741,306 $15,377,203 $11,170,745 236
Information $70,340,314 $38,443,008 $17,960,806 263
Finance & Insurance $102,029,821 $59,119,112 $29,569,619 477
Real Estate $188,578,538 $139,537,728 $15,113,361 592
Professional Services $68,366,214 $45,716,009 $33,731,269 482
Management of Firms $13,403,103 $8,312,002 $5,804,407 68
Administrative Services $39,066,408 $25,767,205 $17,741,771 694
Educational Services $9,870,502 $5,610,601 $4,271,167 159
Health care $65,768,713 $40,728,808 $32,636,098 804
Arts/Entertain/Recreation $9,351,002 $5,714,501 $3,395,030 161
Accommodation $10,597,802 $6,857,401 $3,285,513 115
Food Services $1,071,936,519 $557,735,314 $358,120,941 21,400
Other Services $46,131,609 $23,481,405 $14,784,810 533
Total Annual $1,988,126,906 $1,121,392,929 $623,152,341 27,680
37 Austin Food Sector Economic Impact | Spring 2013
Appendix 2: Group Meeting Notes
Meetings with local farm stakeholders and restaurants took place at the City of Austin on
December 17, 2012. The following notes reflect the flow of conversation in the open-ended
discussion:
Farm Stakeholders
What is meant by “local food”? One definition offered was food grown within 150
miles from the epicenter of the city. If a food was not able to be grown locally, the
definition could reasonably expand (for example, citrus grown in the Texas valley).
There is definitely a trend of restaurants offering local food on their menu. One
problem is the inability to regulate this. One participant mentioned as a solution the
Growers Alliance of Central Texas (“GROW ACT”) which offers a report card of
restaurants based on how often they buy local from growers versus from
distributors.
Local food is definitely seen as desirable by a majority of the population. Why?
Reasons cited included a change in the national landscape (a garden in the White
House), the explosion of food TV and chef-driven shows, importation of residents
from the East and West coasts who have already hopped on the local bandwagon.
The explosion of farmers’ markets in Austin has not been great for farmers because
resources get spread out over too many locations. One example cited was the close
proximity of the Barton Creek Farmers’ Market new location at Highland Mall, which
is approximately one mile from the Mueller Farmers’ Market.
There was a desire expressed for the city to provide a permanent, covered farmers’
market with plenty of parking (similar to what was done in Davis, CA). The
downtown farmers’ market gets shut down too often due to downtown events.
Who are the shoppers at the markets? Tourists don’t tend to by much produce. One
participant reported that new customers tend to spend between $1-5 a visit, while
regular customers spend about $13 per visit on average.
The most current data they know about regarding CSA’s is from the 2007 Census of
Agriculture. However, there has been so much growth in the number of farms in the
Austin area since then. There is some data on farmers’ markets that tracks the
number of visitors, as well as has estimates of sales from vendors since 2003.
It is hard to be a farmer in Central Texas, and burnout is common. The 1990’s were
the heyday, but today all farmers work harder. It is hard to grow organic produce
due to the heat, insects, and weather patterns. Farmers strive to pay their workers a
decent wage, but it’s difficult. It’s hard to raise prices because oftentimes their food
is already seen as too expensive.
38 Austin Food Sector Economic Impact | Spring 2013
One stakeholder hires many college graduates (likely working at a lower wage due to
the experience), but many farms hire Hispanic labor.
To be certified organic, there is a 112 page application, and a $1,000 fee.
Additionally, the Texas Department of Agriculture has 2 inspectors for 47 counties.
Who do these farmers sell to? One stakeholder sells 30-40 percent wholesale
(including restaurants). CSA and farmers’ markets sell at a premium. Some smaller
farms are all wholesale (e.g., one farm sells exclusively to Central Market).
One of the biggest challenges for farmers is water availability. 40 foot wells have
gone dry during droughts. One stakeholder bought a farm in another county
because water ran out on their Travis County farm (the city dried the aquifer up to
water fields). When asked, they couldn’t estimate their per acre use of water. Old
water laws in Texas date back to 1905.
Minimum threshold for an ag exemption was thought to be 10-12 acres. An owner
can’t get an ag exemption for 5 years after the purchase of a new piece of property.
Hidden costs of non-local food include wastewater, pollution, and transport costs.
Most of farms must overplant in order to meet their needs. Of 15 varieties of
vegetables, for example, 8-12 will produce.
The Sustainable Food Center has a farm-to-work initiative and acts as a broker for
institutional buyers, such as schools. They take a 10 percent sales commission.
Small scale diversified vegetable farming is still relatively new to Texas compared to
other parts of the U.S. – this is still cattle country.
The Intervale Center in Vermont is an organization that trains new farmers and helps
build the next generation of farmers. Their model is solid and could be replicated.
It is too capital intensive to start a new farm here.
Does demand for local food exceed supply? One local stakeholder says no.
Because Central Market and Whole Foods sell “local,” many people feel like they’ve
bought local and don’t necessary feel the need to support local farmers. The vast
majority (over 75%) of “local” food is sold via these two grocers and a small
percentage is sold via farmers’ markets and CSAs.
Getting access to markets is one of the biggest challenges of these farmers.
Farm to Table is an organization that connects growers with restaurants.
39 Austin Food Sector Economic Impact | Spring 2013
Restaurants
With the opening question of “how’s business?” one participant, who has been in
business for 14 years, is getting back to his roots and learning “tail to snout” and
“root to blossom” ways of cooking. He is a member of a number of organizations
that promote sustainability and local foods. He is finally aligning his business and
personal interests. The challenges for him is that expenses are up (insurance and
food costs), and profits are down. There are less talented, skilled workers than in the
past, and they have less pride in their work.
Another participant, who has been in business for 25 years, said that the last 2 years
have been tough. Food costs are up, even though she grows some of her own.
Challenges include having former workers learn on the job and then spin off
different restaurants over the years. Now she hires culinary school workers. She is
expanding her packaged food production and would love to use organic, natural
products.
A number of participants have had problems with city inspectors searching for
problems in their restaurants - they are not customer-service oriented. There are
constantly changing rules and regulations that are hard to keep up with. Inspectors
make demands that are irrational from a business standpoint (add a dishwasher,
another employee, etc.) and seem to disregard personal money. One participant
was nitpicked to death over regulations when she tried to open up a trailer.
Competition is an issue. Trailers are an attractive option – they are cheaper to get
going but are perceived to be unfair regarding regulations. It seems they have an
unfair advantage. It’s hard to compete with national chains with deeper pockets on
food costs – they can always offer a better deal.
The problem with buying local for their restaurants is that it’s too expensive to do it
on a large scale. Smaller, higher end restaurants have an advantage, but it’s not
feasible for a mid-level restaurant where customers appear more price sensitive (for
a chicken fried steak, for example). One participant has explored custom direct
farming, where she gave seeds for a farmer to grow for her use.
There is a need for education about the benefits of healthy eating in the local
minority communities. One participant works with low income youth in a church
garden in what he calls a “laboratory classroom.” In addition to learning about the
benefits of eating vegetables, it helps the kids explore their culture and history.
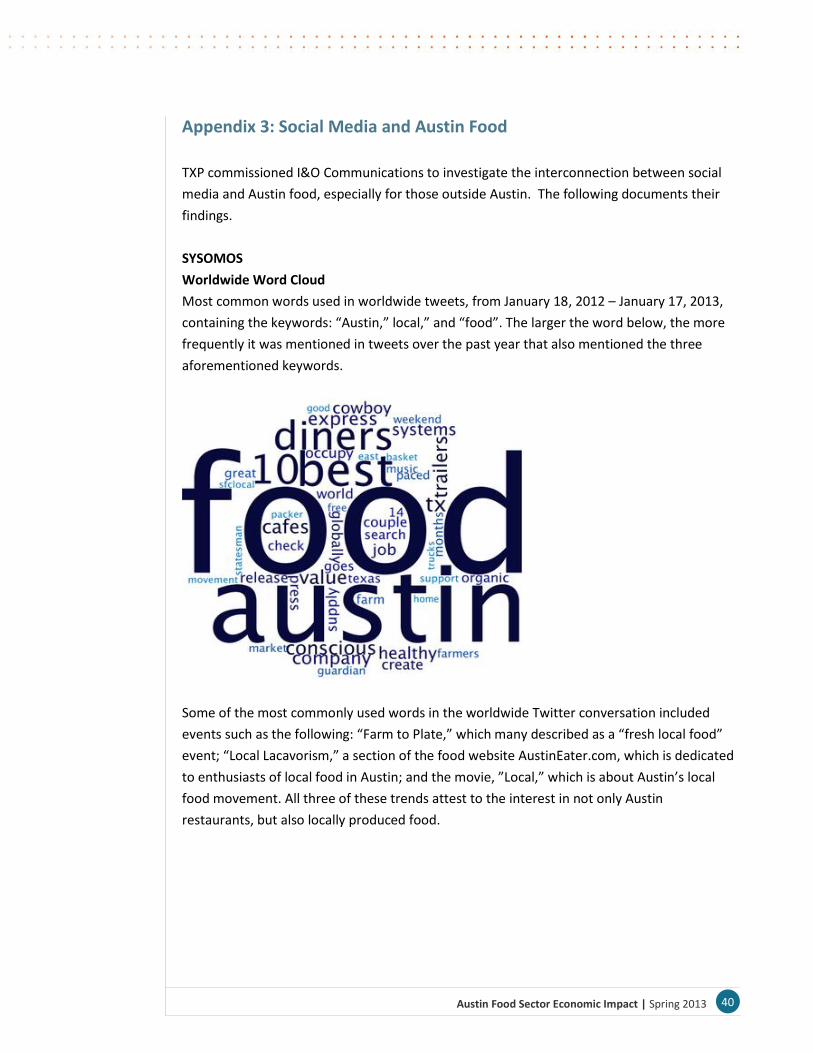
40 Austin Food Sector Economic Impact | Spring 2013
Appendix 3: Social Media and Austin Food
TXP commissioned I&O Communications to investigate the interconnection between social
media and Austin food, especially for those outside Austin. The following documents their
findings.
SYSOMOS
Worldwide Word Cloud
Most common words used in worldwide tweets, from January 18, 2012 – January 17, 2013,
containing the keywords: “Austin,” local,” and “food”. The larger the word below, the more
frequently it was mentioned in tweets over the past year that also mentioned the three
aforementioned keywords.
Some of the most commonly used words in the worldwide Twitter conversation included
events such as the following: “Farm to Plate,” which many described as a “fresh local food”
event; “Local Lacavorism,” a section of the food website AustinEater.com, which is dedicated
to enthusiasts of local food in Austin; and the movie, ”Local,” which is about Austin’s local
food movement. All three of these trends attest to the interest in not only Austin
restaurants, but also locally produced food.
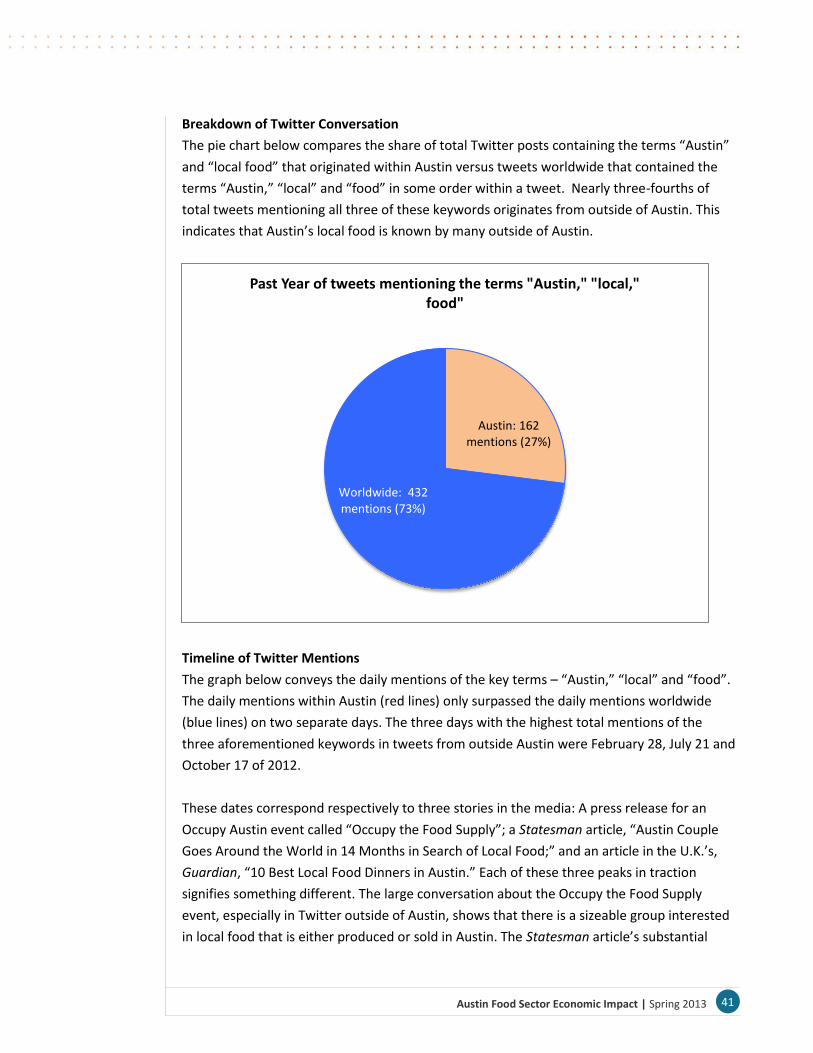
41 Austin Food Sector Economic Impact | Spring 2013
Breakdown of Twitter Conversation
The pie chart below compares the share of total Twitter posts containing the terms “Austin”
and “local food” that originated within Austin versus tweets worldwide that contained the
terms “Austin,” “local” and “food” in some order within a tweet. Nearly three-fourths of
total tweets mentioning all three of these keywords originates from outside of Austin. This
indicates that Austin’s local food is known by many outside of Austin.
Timeline of Twitter Mentions
The graph below conveys the daily mentions of the key terms – “Austin,” “local” and “food”.
The daily mentions within Austin (red lines) only surpassed the daily mentions worldwide
(blue lines) on two separate days. The three days with the highest total mentions of the
three aforementioned keywords in tweets from outside Austin were February 28, July 21 and
October 17 of 2012.
These dates correspond respectively to three stories in the media: A press release for an
Occupy Austin event called “Occupy the Food Supply”; a Statesman article, “Austin Couple
Goes Around the World in 14 Months in Search of Local Food;” and an article in the U.K.’s,
Guardian, “10 Best Local Food Dinners in Austin.” Each of these three peaks in traction
signifies something different. The large conversation about the Occupy the Food Supply
event, especially in Twitter outside of Austin, shows that there is a sizeable group interested
in local food that is either produced or sold in Austin. The Statesman article’s substantial
Austin: 162 mentions (27%)
Worldwide: 432 mentions (73%)
Past Year of tweets mentioning the terms "Austin," "local," food"
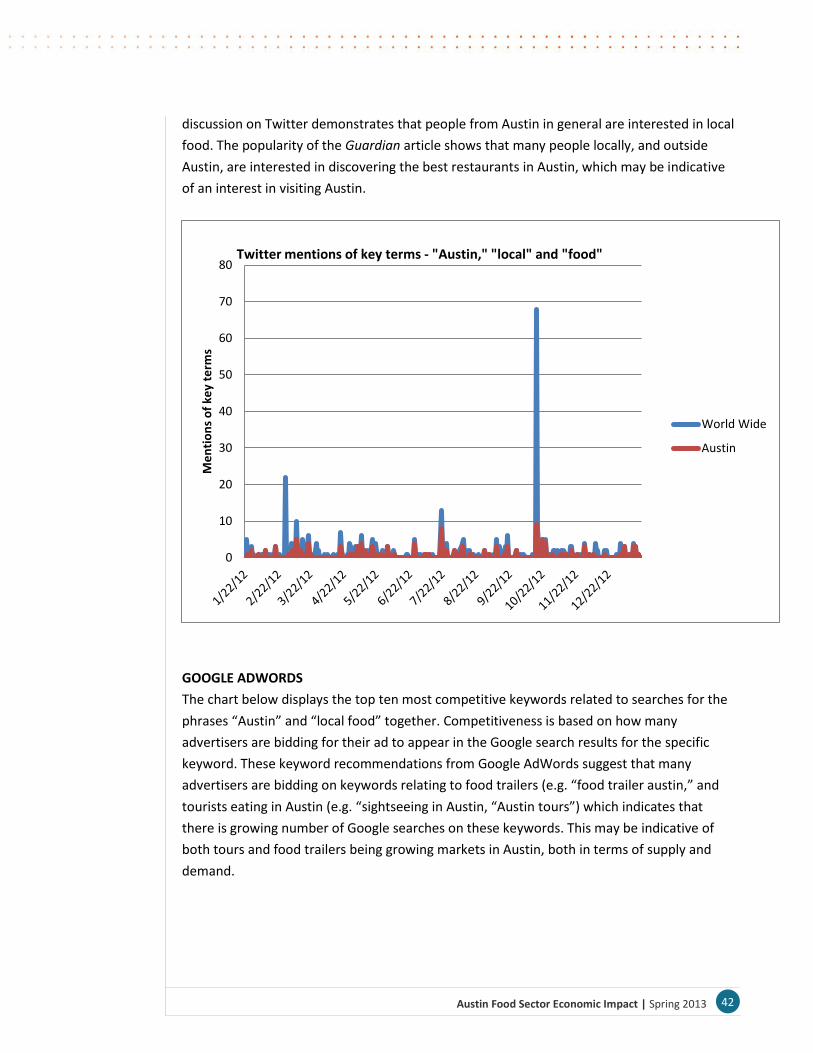
42 Austin Food Sector Economic Impact | Spring 2013
discussion on Twitter demonstrates that people from Austin in general are interested in local
food. The popularity of the Guardian article shows that many people locally, and outside
Austin, are interested in discovering the best restaurants in Austin, which may be indicative
of an interest in visiting Austin.
GOOGLE ADWORDS
The chart below displays the top ten most competitive keywords related to searches for the
phrases “Austin” and “local food” together. Competitiveness is based on how many
advertisers are bidding for their ad to appear in the Google search results for the specific
keyword. These keyword recommendations from Google AdWords suggest that many
advertisers are bidding on keywords relating to food trailers (e.g. “food trailer austin,” and
tourists eating in Austin (e.g. “sightseeing in Austin, “Austin tours”) which indicates that
there is growing number of Google searches on these keywords. This may be indicative of
both tours and food trailers being growing markets in Austin, both in terms of supply and
demand.
0
10
20
30
40
50
60
70
80
Me
nti
on
s o
f ke
y te
rms
Twitter mentions of key terms - "Austin," "local" and "food"
World Wide
Austin
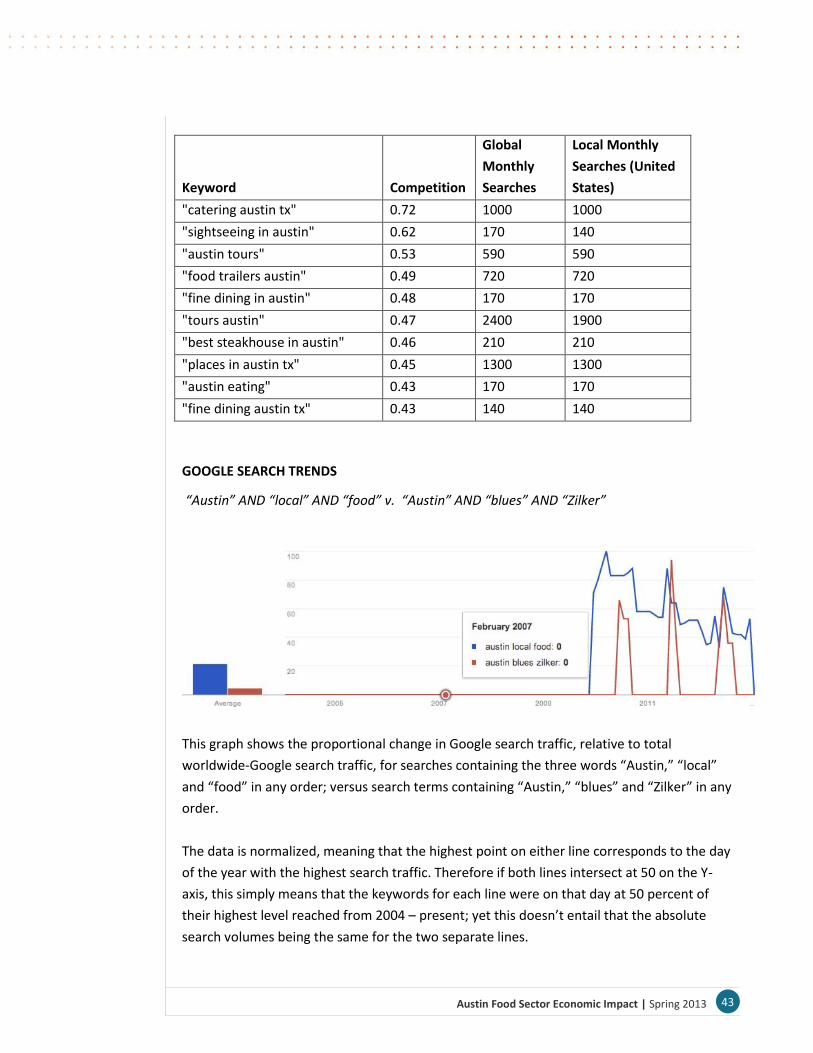
43 Austin Food Sector Economic Impact | Spring 2013
Keyword Competition
Global
Monthly
Searches
Local Monthly
Searches (United
States)
"catering austin tx" 0.72 1000 1000
"sightseeing in austin" 0.62 170 140
"austin tours" 0.53 590 590
"food trailers austin" 0.49 720 720
"fine dining in austin" 0.48 170 170
"tours austin" 0.47 2400 1900
"best steakhouse in austin" 0.46 210 210
"places in austin tx" 0.45 1300 1300
"austin eating" 0.43 170 170
"fine dining austin tx" 0.43 140 140
GOOGLE SEARCH TRENDS
“Austin” AND “local” AND “food” v. “Austin” AND “blues” AND “Zilker”
This graph shows the proportional change in Google search traffic, relative to total
worldwide-Google search traffic, for searches containing the three words “Austin,” “local”
and “food” in any order; versus search terms containing “Austin,” “blues” and “Zilker” in any
order.
The data is normalized, meaning that the highest point on either line corresponds to the day
of the year with the highest search traffic. Therefore if both lines intersect at 50 on the Y-
axis, this simply means that the keywords for each line were on that day at 50 percent of
their highest level reached from 2004 – present; yet this doesn’t entail that the absolute
search volumes being the same for the two separate lines.
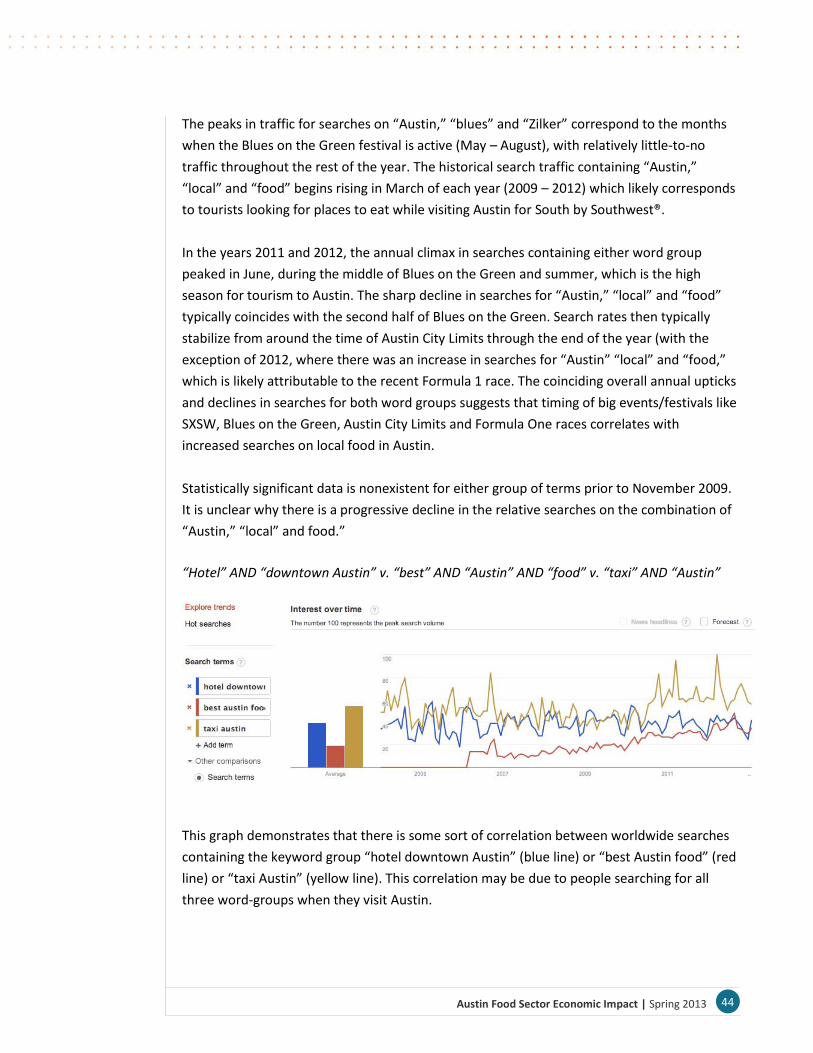
44 Austin Food Sector Economic Impact | Spring 2013
The peaks in traffic for searches on “Austin,” “blues” and “Zilker” correspond to the months
when the Blues on the Green festival is active (May – August), with relatively little-to-no
traffic throughout the rest of the year. The historical search traffic containing “Austin,”
“local” and “food” begins rising in March of each year (2009 – 2012) which likely corresponds
to tourists looking for places to eat while visiting Austin for South by Southwest®.
In the years 2011 and 2012, the annual climax in searches containing either word group
peaked in June, during the middle of Blues on the Green and summer, which is the high
season for tourism to Austin. The sharp decline in searches for “Austin,” “local” and “food”
typically coincides with the second half of Blues on the Green. Search rates then typically
stabilize from around the time of Austin City Limits through the end of the year (with the
exception of 2012, where there was an increase in searches for “Austin” “local” and “food,”
which is likely attributable to the recent Formula 1 race. The coinciding overall annual upticks
and declines in searches for both word groups suggests that timing of big events/festivals like
SXSW, Blues on the Green, Austin City Limits and Formula One races correlates with
increased searches on local food in Austin.
Statistically significant data is nonexistent for either group of terms prior to November 2009.
It is unclear why there is a progressive decline in the relative searches on the combination of
“Austin,” “local” and food.”
“Hotel” AND “downtown Austin” v. “best” AND “Austin” AND “food” v. “taxi” AND “Austin”
This graph demonstrates that there is some sort of correlation between worldwide searches
containing the keyword group “hotel downtown Austin” (blue line) or “best Austin food” (red
line) or “taxi Austin” (yellow line). This correlation may be due to people searching for all
three word-groups when they visit Austin.
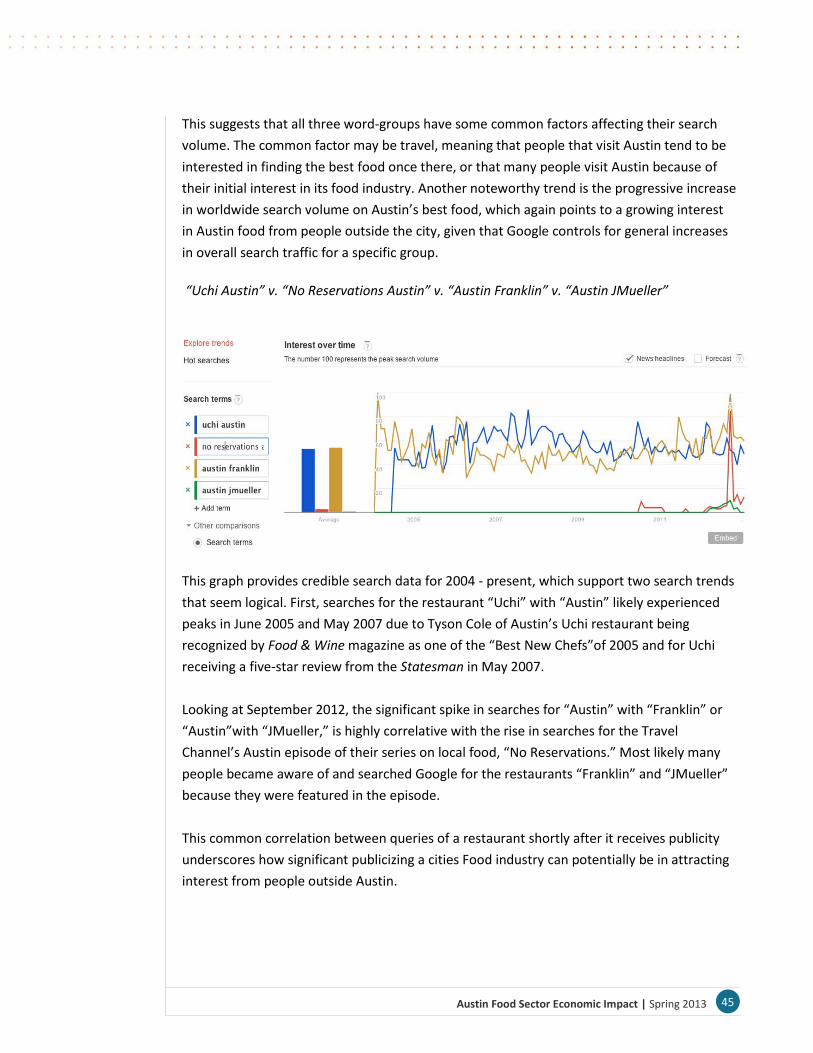
45 Austin Food Sector Economic Impact | Spring 2013
This suggests that all three word-groups have some common factors affecting their search
volume. The common factor may be travel, meaning that people that visit Austin tend to be
interested in finding the best food once there, or that many people visit Austin because of
their initial interest in its food industry. Another noteworthy trend is the progressive increase
in worldwide search volume on Austin’s best food, which again points to a growing interest
in Austin food from people outside the city, given that Google controls for general increases
in overall search traffic for a specific group.
“Uchi Austin” v. “No Reservations Austin” v. “Austin Franklin” v. “Austin JMueller”
This graph provides credible search data for 2004 - present, which support two search trends
that seem logical. First, searches for the restaurant “Uchi” with “Austin” likely experienced
peaks in June 2005 and May 2007 due to Tyson Cole of Austin’s Uchi restaurant being
recognized by Food & Wine magazine as one of the “Best New Chefs”of 2005 and for Uchi
receiving a five-star review from the Statesman in May 2007.
Looking at September 2012, the significant spike in searches for “Austin” with “Franklin” or
“Austin”with “JMueller,” is highly correlative with the rise in searches for the Travel
Channel’s Austin episode of their series on local food, “No Reservations.” Most likely many
people became aware of and searched Google for the restaurants “Franklin” and “JMueller”
because they were featured in the episode.
This common correlation between queries of a restaurant shortly after it receives publicity
underscores how significant publicizing a cities Food industry can potentially be in attracting
interest from people outside Austin.
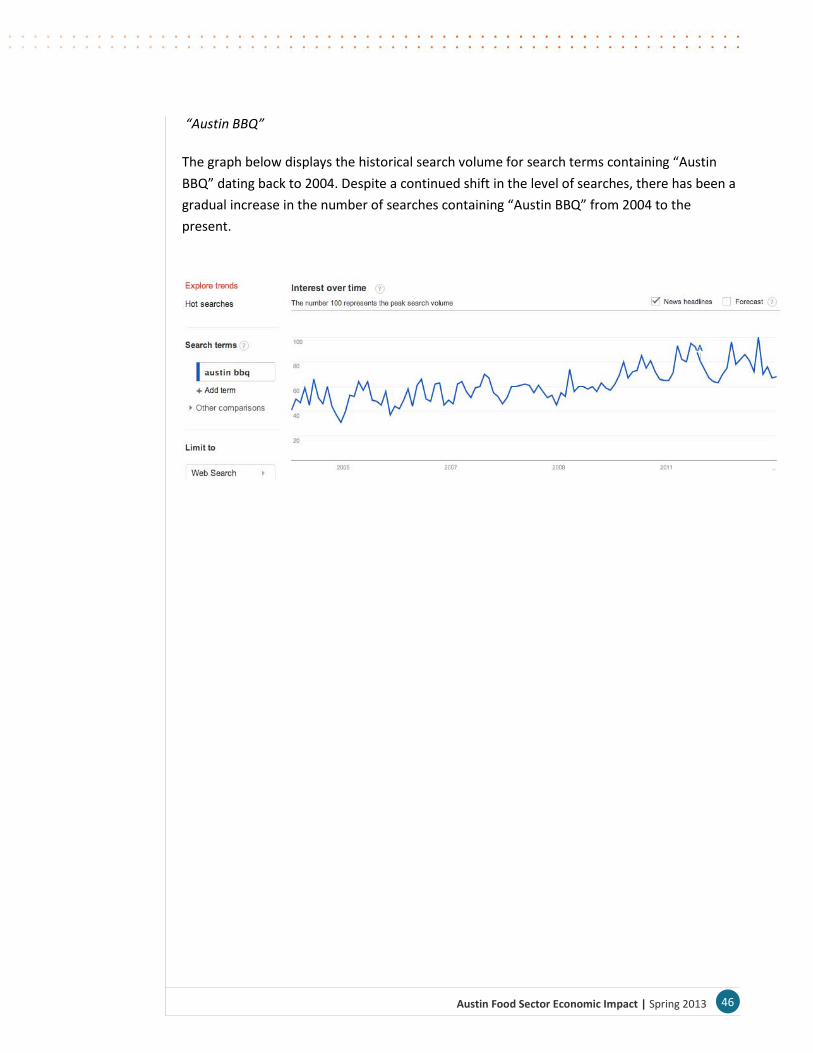
46 Austin Food Sector Economic Impact | Spring 2013
“Austin BBQ”
The graph below displays the historical search volume for search terms containing “Austin
BBQ” dating back to 2004. Despite a continued shift in the level of searches, there has been a
gradual increase in the number of searches containing “Austin BBQ” from 2004 to the
present.
47 Austin Food Sector Economic Impact | Spring 2013
Appendix 4: Current City of Austin Efforts
A4.1 Case Study/Best Practices Research Related to Public Land/Urban Agriculture
This document sets out many relevant factors to consider when establishing a program to
lease public land for urban farming. It is based on preliminary research into Seattle and
Baltimore’s programs, which have different approaches and are at different stages of
implementation. The lessons learned from these two programs can provide useful guidance
for Austin in crafting its bid process and leases for urban farming on public land.
This research was conducted and compiled by University of Texas Students of Law in 2012 for the
Sustainable Food Policy Board and Austin’s Sustainable Urban Agriculture and Community Gardens
program.
Relevant factors:
1. Definition of Urban Farming o Seattle’s definition from Department of Planning and Development (DPD)26:
“Urban farm” is a use in which plants, and products derived from them, are grown and sold on the same lot or off site. No other items can be sold onsite. Examples may include flower and vegetable raising orchards and vineyards.”
o Baltimore’s Definition from RFQ: Land used for the cultivation of fruits, vegetables, plants, flowers or herbs by an individual, organization, or business with the primary purpose of growing food for sale (including for-profit and non-profit enterprises). Urban agriculture should provide economic development and entrepreneurial opportunities in the City’s food system, and provide a source of fresh, local food for food markets.
2. Farm Size o Seattle- From a survey of about 100 farmers, the DPD was surprised to learn that
some farmers would be interested in farming land as small as 2500 square feet. This was much smaller than they had anticipated. As a result of feedback from farmers, they are going to recommend in the report that no plot of city land is too small to use for urban farming.
o Baltimore- The plots that the city has identified to lease for urban farming are a minimum of 1 acre. Up to 35 acres total will be available for urban agriculture over the next three years.
3. Availability of Land o Key issues from other cities: finding suitable land for agricultural purposes that
does not have any development plans.
26
Seattle Department of Planning and Development, Client Assistance Memo 244, Urban Agriculture, November
17, 2010, available at http://www.seattle.gov/DPD/Publications/CAM/cam244.pdf
48 Austin Food Sector Economic Impact | Spring 2013
o Seattle- DPD searched through city database of land to find plots suitable for urban agriculture. This was difficult because the database was not created with agriculture in mind, so it was hard to determine what would be good for farming (in terms of soil quality, sun exposure, etc). One lesson DPD learned from this was the need to have people with farming expertise who know what type of land is actually suitable for farming involved in the process, in addition to those with real estate experience. For the pilot project, the city has identified two plots of land—one is 5000
square feet and the other is 4500 square feet. Both are located in areas with less access to healthy food.
o Baltimore- Department of Planning identified vacant land publicly owned by the Mayor or City Council with no short- to mid-term development purposes that could be used for urban farming.
4. Bid Process o Key issues from other cities: determining how extensive to make the application. o Seattle- The city is currently developing a proposal for a pilot project for
commercial farming on city land, which will result in an RFP. Seattle received survey responses from ~100 farmers that have helped in
determining possible conditions of the lease Key concern: doesn’t want RFP to be too onerous.
o Baltimore- the Request for Qualification (RFQ) for urban agriculture in Baltimore was issued by the Department of Planning and the Department of Housing and Community Development and applications on March 25, 2011 and were due May 6, 2011. Overall, the RFQ is fairly lengthy and involved. The RFQ itself is 15 pages
long, and requires applicants to submit at a minimum the following sections: table of contents, financial criteria, a narrative statement of farmer capacity, a proposed urban agriculture concept, a cost estimate and economic feasibility analysis with supporting market assumptions and sources, and a minority- and women-owned business participation list.
The RFQ includes threshold financial and experience criteria that all applicants must meet. If an applicant meets the threshold criteria, then the committee will judge the applicant based on a series of other factors (§3.2-3.5).
As a result of the RFQ, the City is currently working actively with two farmers to select sites to lease for urban farms within the city.27
5. Farm Business Structure, Ownership and Experience o Key issues from other cities: Does the city want to… lease land to non-profit or for-
profit farmers? … give preference to disadvantaged farmers? … help beginning farmers or experienced farmers?
27
http://www.baltimorecity.gov/Government/AgenciesDepartments/Planning/BaltimoreFoodPolicyInitia
tive/UrbanAgriculture.aspx
49 Austin Food Sector Economic Impact | Spring 2013
o Seattle- The RFP will be open to all forms of farming entities (non-profits, for-profits, individuals, etc). Farming experience will be very important for the pilot project because they
want to start the program off strong with farmers who have experience. In future phases, however, the program may not weigh this as heavily to give
new farmers a chance too. They may give preference to minority farmers.
o Baltimore- Applicants can be non-profits or for-profits. At least one member of the farm team must have at least one year of farming experience, preferably in an urban context. City policy that minority- and women-owned businesses should have
maximum opportunity to participate in all components of the farm.
6. Length of Leases o Key issues from other cities: Cities may want to retain some control over farms,
but leases must be long enough for it to be worth it for farmers to invest in soil improvement, infrastructure, etc. Issue of whether the land may be taken out of farming and used for development or other purposes later on.
o Seattle- Leases will be at least 3 years, preferably 5. o Baltimore- Leases will not exceed 5 years, with potential for renewal.
The land chosen had no identified short- to mid-term development purposes, but may be used for other forms of development in the future.
7. Costs o Key issues from other cities: Property taxes; Water permits; Fairness concerns for
other farmers who have to pay market price for land if the city land is offered at below market rate; Revenue considerations for the city.
o Seattle- The cost of the lease will be determined by the bids of the applicants through an RFP. Cost will be a factor in choosing the successful applicants but the bid will not necessarily go to the highest bidder—bid price will be one factor that will be weighed along with other factors. Installation of water meters will cost $10-15k, and the Department of
Planning cannot pay for this given their limited budget, so right now the farmers would have to pay.
o Baltimore- anticipated cost for a lease is $100 per year for each site. Property taxes: City is looking into the feasibility of a Payment in Lieu of
Taxes (PILOT). Maryland state law provides that a property owned by the City and leased to a business for profit is subject to the property tax; however, the City may, by ordinance, exempt City-owned property from City real estate taxes and negotiate a PILOT.
Farmer will pay for all permits, regulatory approvals, required studies, appraisals, legal descriptions, etc. (§4.5)
Farmers will be invited to apply for city grants or loan bond funding for capital projects.
50 Austin Food Sector Economic Impact | Spring 2013
8. Insurance/Liability o Key issues from other cities: there a minimum amount of liability insurance
required? o Seattle- unknown. o Baltimore- farmer must have liability insurance. Applicants in RFQ process must
provide a letter of intent from an insurance company to provide liability insurance (§2.2(f)).
9. Environmental criteria o Key issues from other cities: Want to ensure environmentally friendly farming
practices, but don’t want to impose costly or unenforceable requirements. o Seattle- will require organic practices, not sure if will require certification. They
will also require best practices for water usage, but do not want to actually monitor usage or get too detailed because don’t want to micromanage farmers.
o Baltimore- requires “sustainable farming practices” which are defined in §4.2 of RFQ under the following categories: weed management, insect management, disease management and waste management. No animal husbandry for at least first year. Land offered “as is” without any environmental testing done by City and City
not responsible for any cleanup or damages. Farmers are responsible for either cleaning up the site to meet MD environmental regulations as necessary or using raised beds with a barrier between new soil and existing soil.
10. Public Benefit o Key issues from other cities: how to ensure that the farms are providing public
benefits while farming on public land? o Seattle- All farms on city land will have to provide a public benefit. They don’t
know exactly how this will be defined yet, but ideas include requiring the farms to have a public tour and visitation day each year, to donate produce to food banks/shelters, etc. Each lease will be negotiated to require one or more of the criteria depending on the farm.
o Baltimore- RFQ requires applicants to list benefits that it will provide to the local community of city as a whole, and states that preference will be given to applicants who address access to green jobs, education and/or food access. (§2.3(e)) Chosen farmers must meet with local community members around the area
where their farm is to discuss the farm and any concerns they have.
Examples of other non-profit urban farms on city land
o Chicago: City Farm A one and one-quarter acre farm on formerly vacant city land in Chicago. The
non-profit Resource Center operates the farm as a permanent demonstration and training facility to teach others about food and urban agriculture.
51 Austin Food Sector Economic Impact | Spring 2013
The city allows the farm to operate free of rent but acknowledges that as the neighborhood continues to grow, the land on which City Farm sits will eventually be sold for development.
o Detroit: Detroit Black Community Food Security Network In June 2008, this non-profit acquired use of a two-acre site on city land as
the long-term home for D-Town Farm. They had two years of meetings and negotiations with the Detroit City
Council, and the City’s Planning, General Services and Recreation Departments to agree upon the lease.
They lease the site for $1 annually for 10 years. o Sunol Ag Park, California:
Non-profit (SAGE) leases public land and then several different farmers farm the land. The farmers share equipment, resources, etc.
A4.2 Water-Related Issues
In October 2009, Austin City Council directed staff to work with the Sustainable Food Policy Board (SFPB) and other stakeholders to examine water and wastewater rates and other measures to ensure agriculture and farms have affordable access to water. Austin Water Utility in collaboration with Parks’ Sustainable Urban Agriculture and Community Garden Program met often with the SFPB and operators of urban farms and then made recommendations regarding the cost of water, wastewater and meter installation. First, Austin Water studied whether a separate agricultural water rate could be offered, and chose not to recommend it since the current commercial rate available to community gardens and urban farms is significantly lower than a separate cost-of-service based agricultural rate would be. This is due to the high peaking factors associated with the irrigation needs of these customers. Farms and gardens were also paying for wastewater despite the fact that most of their water usage is for irrigation. Austin Water recommends a separate water meter for irrigation be installed to accurately track the property’s water usage. While retrofitting existing plumbing to separate irrigation water from domestic usage can be expensive, the volume of water used in agriculture may make it a cost-effective solution. City code already requires new commercial and multifamily accounts to have separate irrigation meters. Several fees apply when a separate water meter is installed. Austin Water recommended and City Council adopted code amendments in February 2011 that exempt qualified community gardens from impact, tap and reconnection fees. By Spring 2013, Austin Water has waived fees for four community gardens and is reviewing the application of a fifth garden. Such fee waivers were not recommended nor City Council approved for urban farms as they are considered commercial businesses. Additionally, Austin Water worked with gardens and farms to allow for alternative compliance to the City’s watering restrictions, and established procedures to move community gardens and urban agriculture projects through the tap and permitting process more easily.

52 Austin Food Sector Economic Impact | Spring 2013
Appendix 5: Maps
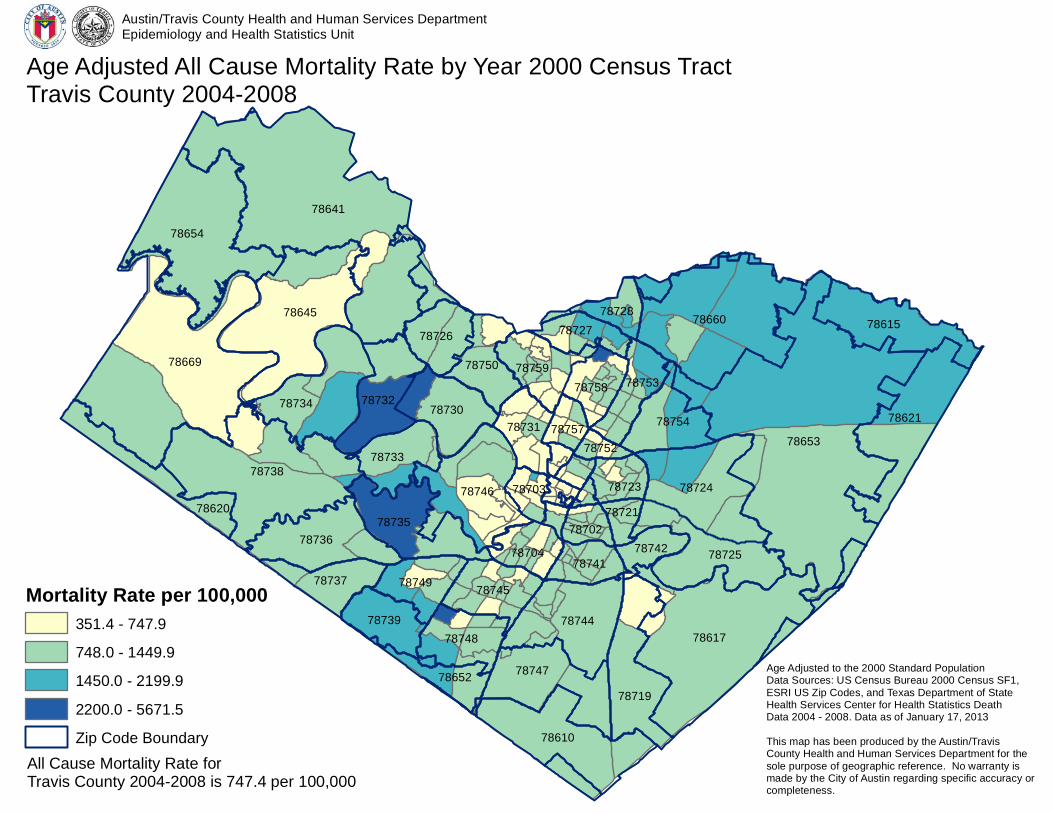
78721
78653
78641
78669
78617
78738
78660
78654
78645
78621
78724
78610
78746
78734
78744
7871978747
7872578736
78615
78735
78732 7873078754
78745
78748
78620
78759
78733
78750
78739
78749
78726
78737
78753
78731
78758
78704
78727
78741
78652
78723
78728
7874278702
78757
78703
78752
Age Adjusted All Cause Mortality Rate by Year 2000 Census TractTravis County 2004-2008
Mortality Rate per 100,000351.4 - 747.9748.0 - 1449.91450.0 - 2199.92200.0 - 5671.5Zip Code Boundary
All Cause Mortality Rate for Travis County 2004-2008 is 747.4 per 100,000
Age Adjusted to the 2000 Standard Population Data Sources: US Census Bureau 2000 Census SF1,ESRI US Zip Codes, and Texas Department of State Health Services Center for Health Statistics Death Data 2004 - 2008. Data as of January 17, 2013This map has been produced by the Austin/Travis County Health and Human Services Department for the sole purpose of geographic reference. No warranty is made by the City of Austin regarding specific accuracy orcompleteness.
Austin/Travis County Health and Human Services DepartmentEpidemiology and Health Statistics Unit
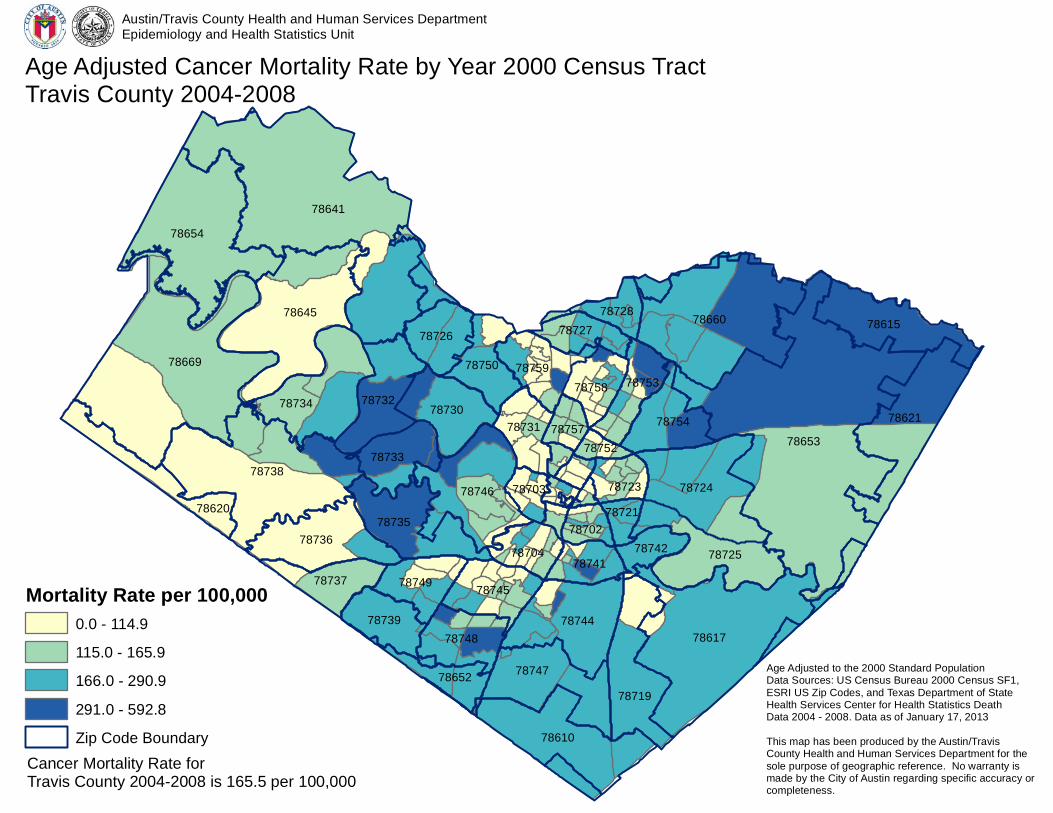
78721
78653
78641
78669
78617
78738
78660
78654
78645
78621
78724
78610
78746
78734
78744
7871978747
7872578736
78615
78735
78732 7873078754
78745
78748
78620
78759
78733
78750
78739
78749
78726
78737
78753
78731
78758
78704
78727
78741
78652
78723
78728
7874278702
78757
78703
78752
Age Adjusted Cancer Mortality Rate by Year 2000 Census TractTravis County 2004-2008
Mortality Rate per 100,0000.0 - 114.9115.0 - 165.9166.0 - 290.9291.0 - 592.8Zip Code Boundary
Cancer Mortality Rate for Travis County 2004-2008 is 165.5 per 100,000
Age Adjusted to the 2000 Standard Population Data Sources: US Census Bureau 2000 Census SF1,ESRI US Zip Codes, and Texas Department of State Health Services Center for Health Statistics Death Data 2004 - 2008. Data as of January 17, 2013This map has been produced by the Austin/Travis County Health and Human Services Department for the sole purpose of geographic reference. No warranty is made by the City of Austin regarding specific accuracy orcompleteness.
Austin/Travis County Health and Human Services DepartmentEpidemiology and Health Statistics Unit
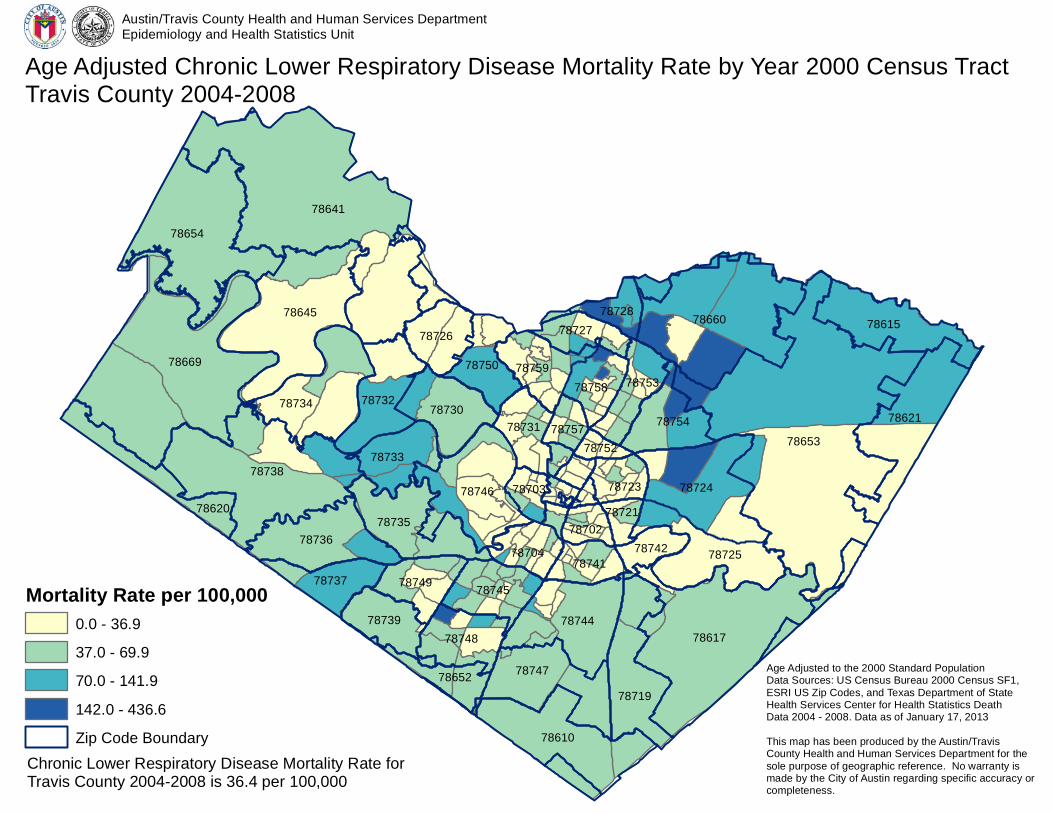
78721
78653
78641
78669
78617
78738
78660
78654
78645
78621
78724
78610
78746
78734
78744
7871978747
7872578736
78615
78735
78732 7873078754
78745
78748
78620
78759
78733
78750
78739
78749
78726
78737
78753
78731
78758
78704
78727
78741
78652
78723
78728
7874278702
78757
78703
78752
Age Adjusted Chronic Lower Respiratory Disease Mortality Rate by Year 2000 Census TractTravis County 2004-2008
Mortality Rate per 100,0000.0 - 36.937.0 - 69.970.0 - 141.9142.0 - 436.6Zip Code Boundary
Chronic Lower Respiratory Disease Mortality Rate for Travis County 2004-2008 is 36.4 per 100,000
Age Adjusted to the 2000 Standard Population Data Sources: US Census Bureau 2000 Census SF1,ESRI US Zip Codes, and Texas Department of State Health Services Center for Health Statistics Death Data 2004 - 2008. Data as of January 17, 2013This map has been produced by the Austin/Travis County Health and Human Services Department for the sole purpose of geographic reference. No warranty is made by the City of Austin regarding specific accuracy orcompleteness.
Austin/Travis County Health and Human Services DepartmentEpidemiology and Health Statistics Unit
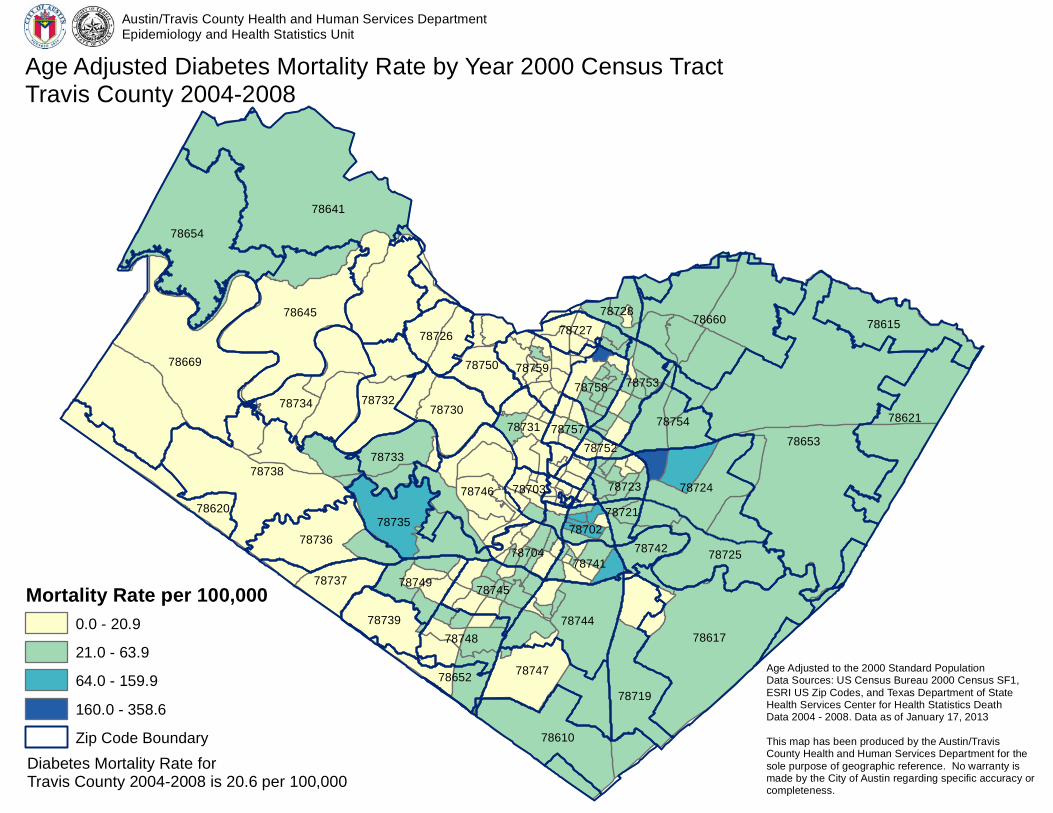
78721
78653
78641
78669
78617
78738
78660
78654
78645
78621
78724
78610
78746
78734
78744
7871978747
7872578736
78615
78735
78732 7873078754
78745
78748
78620
78759
78733
78750
78739
78749
78726
78737
78753
78731
78758
78704
78727
78741
78652
78723
78728
7874278702
78757
78703
78752
Age Adjusted Diabetes Mortality Rate by Year 2000 Census TractTravis County 2004-2008
Mortality Rate per 100,0000.0 - 20.921.0 - 63.964.0 - 159.9160.0 - 358.6Zip Code Boundary
Diabetes Mortality Rate for Travis County 2004-2008 is 20.6 per 100,000
Age Adjusted to the 2000 Standard Population Data Sources: US Census Bureau 2000 Census SF1,ESRI US Zip Codes, and Texas Department of State Health Services Center for Health Statistics Death Data 2004 - 2008. Data as of January 17, 2013This map has been produced by the Austin/Travis County Health and Human Services Department for the sole purpose of geographic reference. No warranty is made by the City of Austin regarding specific accuracy orcompleteness.
Austin/Travis County Health and Human Services DepartmentEpidemiology and Health Statistics Unit
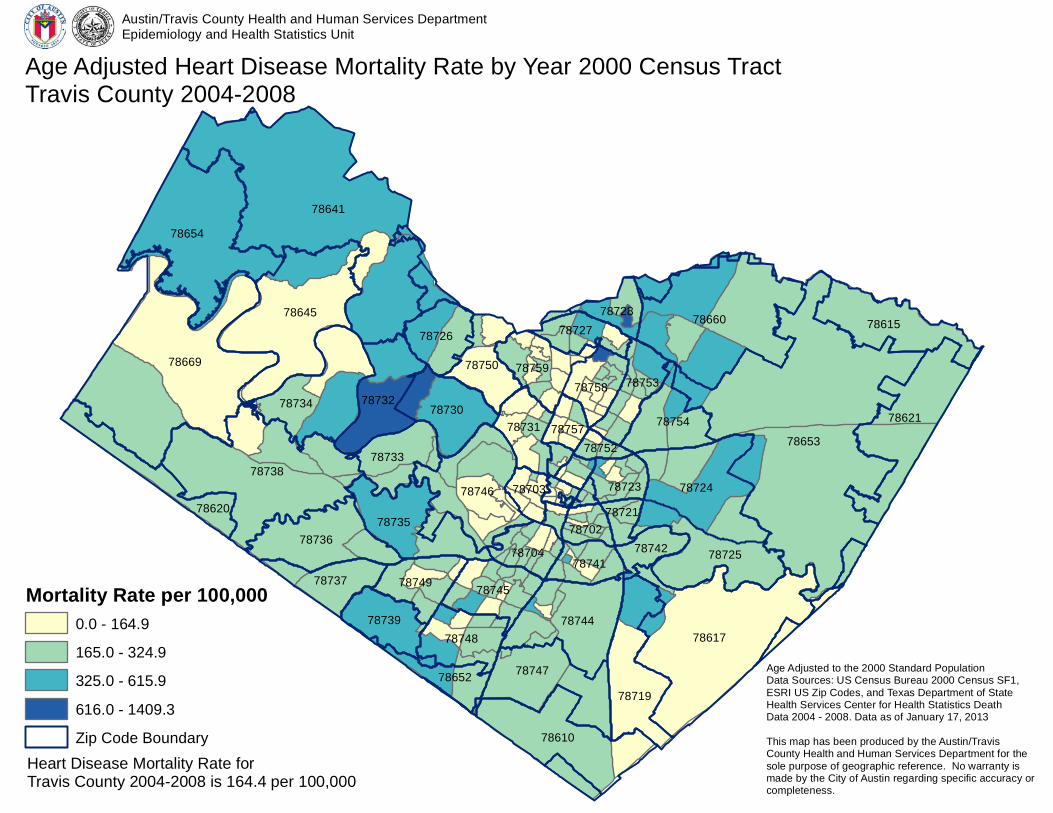
78721
78653
78641
78669
78617
78738
78660
78654
78645
78621
78724
78610
78746
78734
78744
7871978747
7872578736
78615
78735
78732 7873078754
78745
78748
78620
78759
78733
78750
78739
78749
78726
78737
78753
78731
78758
78704
78727
78741
78652
78723
78728
7874278702
78757
78703
78752
Age Adjusted Heart Disease Mortality Rate by Year 2000 Census TractTravis County 2004-2008
Mortality Rate per 100,0000.0 - 164.9165.0 - 324.9325.0 - 615.9616.0 - 1409.3Zip Code Boundary
Heart Disease Mortality Rate for Travis County 2004-2008 is 164.4 per 100,000
Age Adjusted to the 2000 Standard Population Data Sources: US Census Bureau 2000 Census SF1,ESRI US Zip Codes, and Texas Department of State Health Services Center for Health Statistics Death Data 2004 - 2008. Data as of January 17, 2013This map has been produced by the Austin/Travis County Health and Human Services Department for the sole purpose of geographic reference. No warranty is made by the City of Austin regarding specific accuracy orcompleteness.
Austin/Travis County Health and Human Services DepartmentEpidemiology and Health Statistics Unit
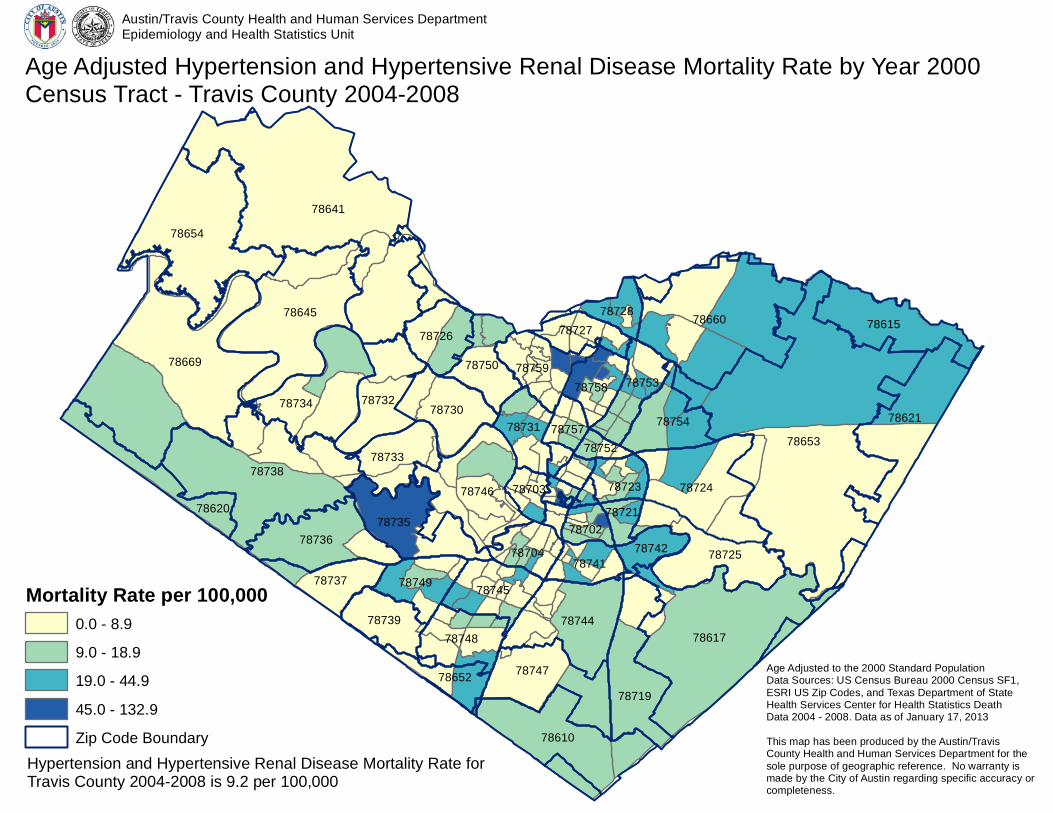
78721
78653
78641
78669
78617
78738
78660
78654
78645
78621
78724
78610
78746
78734
78744
7871978747
7872578736
78615
78735
78732 7873078754
78745
78748
78620
78759
78733
78750
78739
78749
78726
78737
78753
78731
78758
78704
78727
78741
78652
78723
78728
7874278702
78757
78703
78752
Age Adjusted Hypertension and Hypertensive Renal Disease Mortality Rate by Year 2000 Census Tract - Travis County 2004-2008
Mortality Rate per 100,0000.0 - 8.99.0 - 18.919.0 - 44.945.0 - 132.9Zip Code Boundary
Hypertension and Hypertensive Renal Disease Mortality Rate for Travis County 2004-2008 is 9.2 per 100,000
Age Adjusted to the 2000 Standard Population Data Sources: US Census Bureau 2000 Census SF1,ESRI US Zip Codes, and Texas Department of State Health Services Center for Health Statistics Death Data 2004 - 2008. Data as of January 17, 2013This map has been produced by the Austin/Travis County Health and Human Services Department for the sole purpose of geographic reference. No warranty is made by the City of Austin regarding specific accuracy orcompleteness.
Austin/Travis County Health and Human Services DepartmentEpidemiology and Health Statistics Unit
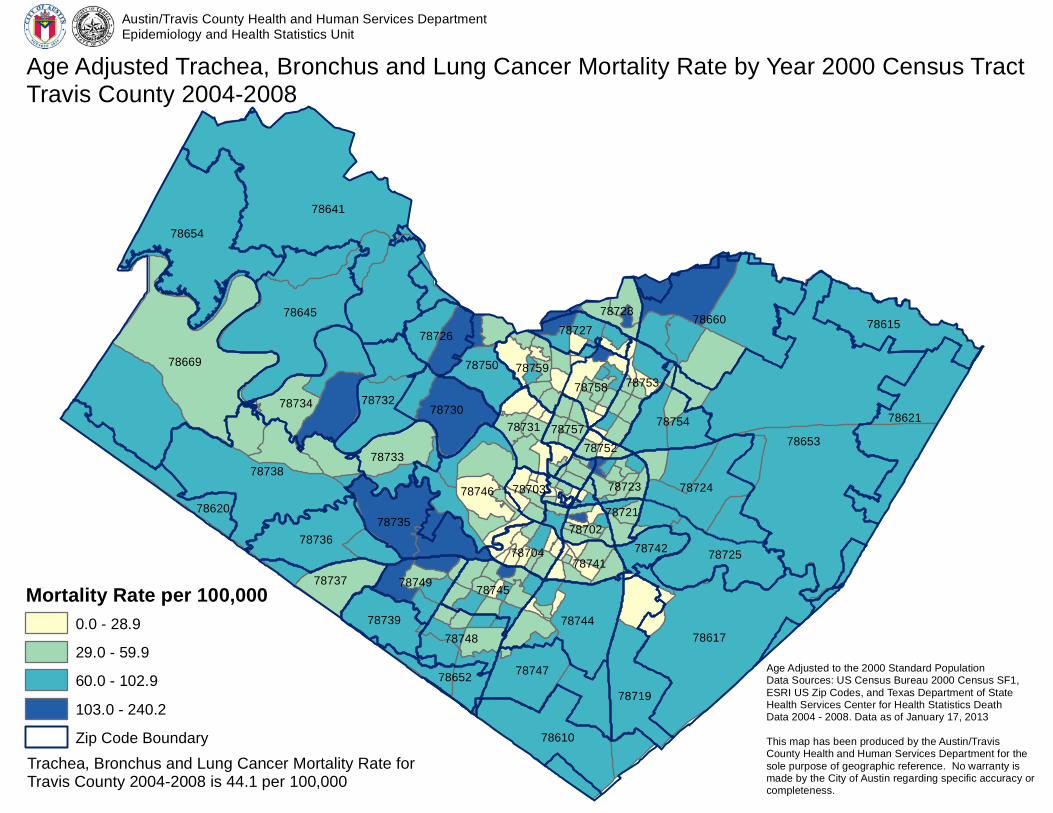
78721
78653
78641
78669
78617
78738
78660
78654
78645
78621
78724
78610
78746
78734
78744
7871978747
7872578736
78615
78735
78732 7873078754
78745
78748
78620
78759
78733
78750
78739
78749
78726
78737
78753
78731
78758
78704
78727
78741
78652
78723
78728
7874278702
78757
78703
78752
Age Adjusted Trachea, Bronchus and Lung Cancer Mortality Rate by Year 2000 Census TractTravis County 2004-2008
Mortality Rate per 100,0000.0 - 28.929.0 - 59.960.0 - 102.9103.0 - 240.2Zip Code Boundary
Trachea, Bronchus and Lung Cancer Mortality Rate for Travis County 2004-2008 is 44.1 per 100,000
Age Adjusted to the 2000 Standard Population Data Sources: US Census Bureau 2000 Census SF1,ESRI US Zip Codes, and Texas Department of State Health Services Center for Health Statistics Death Data 2004 - 2008. Data as of January 17, 2013This map has been produced by the Austin/Travis County Health and Human Services Department for the sole purpose of geographic reference. No warranty is made by the City of Austin regarding specific accuracy orcompleteness.
Austin/Travis County Health and Human Services DepartmentEpidemiology and Health Statistics Unit
53 Austin Food Sector Economic Impact | Spring 2013
Legal Disclaimer
TXP reserves the right to make changes, corrections, and/or improvements at any time and
without notice. In addition, TXP disclaims any and all liability for damages incurred directly or
indirectly as a result of errors, omissions, or discrepancies. TXP disclaims any liability due to
errors, omissions, or discrepancies made by third parties whose material TXP relied on in
good faith to produce the report.
Any statements involving matters of opinion or estimates, whether or not so expressly
stated, are set forth as such and not as representations of fact, and no representation is
made that such opinions or estimates will be realized. The information and expressions of
opinion contained herein are subject to change without notice, and shall not, under any
circumstances, create any implications that there has been no change or updates.


