The Economic Impacts of the San Luis Obispo County and Paso Robles AVA Wine Industry A Report Prepared for the Paso Robles Wine Country Alliance and the San Luis Obispo Wine Country Association Photo Source: Paso Robles Wine Country Alliance William A. Matthews, and Josué Medellín-Azuara* University of California Agricultural Issues Center *William A. Matthews is a project scientist with the University of California Agricultural Issues Center (AIC) and Josué Medellín-Azuara is a project scientist at the U.C. Davis Center for Watershed Sciences.
Transcript
The Economic Impacts of the San Luis Obispo County and Paso Robles AVA
Wine Industry
A Report Prepared for the Paso Robles Wine Country Alliance and the San Luis Obispo Wine Country Association
Photo Source: Paso Robles Wine Country Alliance
William A. Matthews, and Josué Medellín-Azuara*
University of California Agricultural Issues Center
*William A. Matthews is a project scientist with the University of California Agricultural Issues Center (AIC) and Josué Medellín-Azuara is a project scientist at the U.C. Davis Center for Watershed Sciences.
1
Executive Summary
The San Luis Obispo County and Paso Robles AVA wine industry is a large and
dynamic part of SLO County and Central California Coast agriculture and makes major
contributions to the county and regional economy. Wine grape production has been a
generator of agricultural revenues for San Luis County since the 1970s. The recognition
of the quality of wine produced in the area from local grapes launched the establishment
of the Paso Robles AVA (American Viticultural Area) in 1983 and spawned over 30
years of continued growth in wine grape acreage and wine production by the industry.
The Paso Robles AVA accounts for 87 percent of SLO County wine industry output and
economic impact.
Contributions of the wine industry to the regional economy can be understood by
distinguishing between direct, indirect, and induced effects of economic activity and by
looking at both the value of industry output as well as the value added above the cost of
goods and services purchased from other sectors. Direct effects are impacts within the
affected industry; indirect effects are the changes to industries that support but are outside
the directly affected industry; induced effects are economic ripples from added
consumption generated by the direct and indirect effects. Value of industry output is the
value of the direct output or service contribution of the industry; whereas, the value
added calculations measure the economic contribution of the industry above the cost of
goods and services purchased from supporting industries.
This report uses projections of the value of the 2015 wine grape crop and winery
sales, with comparisons to 2014, to estimate contributions of the wine industry to the
regional economy. This report also includes analysis of the wine industry’s economic
2
contributions via its impact on the regional tourism industry from winery and wine
tasting room visitors.
We estimate that the 2015 output from SLO County and Paso Robles AVA
vineyards and wineries, combined with the output generated by the tourism industry from
wine-related visits to the area contributes much to the regional economy with most of this
impact occurring within SLO County.
• The total impact on the value of regional output, including direct, indirect, and
induced economic output, is about $1.9 billion.
• Of the total output value of $1.9 billion, about $924 million is value added. This
includes indirect and induced value added. Value added is the economic output
measure that contributed to the size of the regional economy (Gross Regional
Product).
• Of the $924 million of total value added to the regional economy, about $417 million
is attributable to wine grape production and $398 million to wine production. The
remaining $109 million is the value added from wine-related tourism to the area.
• The whole wine industry, including wine-related tourism, generates about 13,627
jobs, over half of which are in supporting industries and the tourism industry.
• Of these 13,627 jobs, total employment generated by grape growing is 4,349 jobs,
wine making generates an additional 6,905 jobs and wine related tourism accounts for
the remaining 2,372 jobs.
• Vineyards and wineries within SLO County and Paso Robles AVA account for 28
percent of all property tax revenue collected by SLO County in 2015. In addition,
3
wine sales generate an equivalent of 10 percent of total 2015 California sales tax
revenue collected from San Luis Obispo County.
4
Section 1. Background, Context and Methods for the Economic Contributions of the Wine Industry in San Luis Obispo County and the Paso Robles AVA.
1.1 Economic Background and Context of the Wine Industry in San Luis Obispo County and the Evolution of the Designated Paso Robles AVA
Wine making and the growing of wine grapes within San Luis Obispo (SLO)
County has been a part of the region’s agriculture since before California was a state.
The founding of the Mission of San Luis Obispo in 1772 included the planting of grape
vines to produce sacramental wines (SLO Wine Country Association). A century later
commercial winemaking began with the planting of Zinfandel varieties in the Arroyo
Grande Valley in 1880 but it would be almost another century before commercial
winemaking in the county would flourish. The modern wine industry in SLO County
emerged in the early 1970’s when Chardonnay and Pinot Noir vineyards were planted in
the Edna Valley region. The success of these early plantings and the distinct
characteristics of the wine produced from these vineyards launched the reputation of SLO
County and, eventually, the Paso Robles AVA as an area that produced good quality
wines.
On October 4, 1983 the U.S. Department of Treasury first designated a portion of
the Northern part of SLO County as a definitive American Viticultural Area. Since the
initial designation the Paso Robles AVA (PR AVA), it has expanded and currently covers
approximately 614,000 acres within SLO County (Figure 1.1). When the Paso Robles
AVA was first recognized the wine industry within the PR AVA consisted of seventeen
bonded wineries and more than 5,000 acres of vineyards (Hass, 2016) which represented
almost all of the wine grapes grown in SLO County in 1983 (Figure 1.2). Today grapes
5
grown within the PR AVA designation represent between 85-90 percent of wine grape
production within the county.
From the designation of the PR AVA the trend for bearing vineyard acres within
SLO County is one of steady to exceptional growth. For the first fifteen years between
1983-1998 harvested grape acreage increased by an average of 461 acres per year (Figure
1.2). This was followed by an 8-year period of exceptional growth that saw the annual
number of bearing grape acres increase by an average of 2,615 acres per year, an almost 5
fold increase. Grape acres fell slightly from 2006 to 2010 but the trend for growth has
regenerated in recent years.
Increased grape acreage in SLO County and the PR AVA over the past three
decades coincides with the increased importance of wine grape production to agriculture
in SLO County. From 1983 to 2005 the value of wine grape crops in SLO County grew
from under $9 million to over $190 million (Figure 1.3). During this time wine grapes
drove the annual value of fruit and nut crops, accounting for an average of 60 percent of
annual production value (Figure 1.4). In certain years, for example 2000 and 2005, wine
grapes accounted for 80 percent of the value of fruit and nut production in SLO County.
Although revenue generated from the production of wine grapes continues to increase,
competing fruit and nut crops are contributing a greater portion to overall crop values in
SLO County. Overall, wine grape production in SLO County still accounts for
approximately 20 percent of farm production value within SLO County (Figure 1.4).
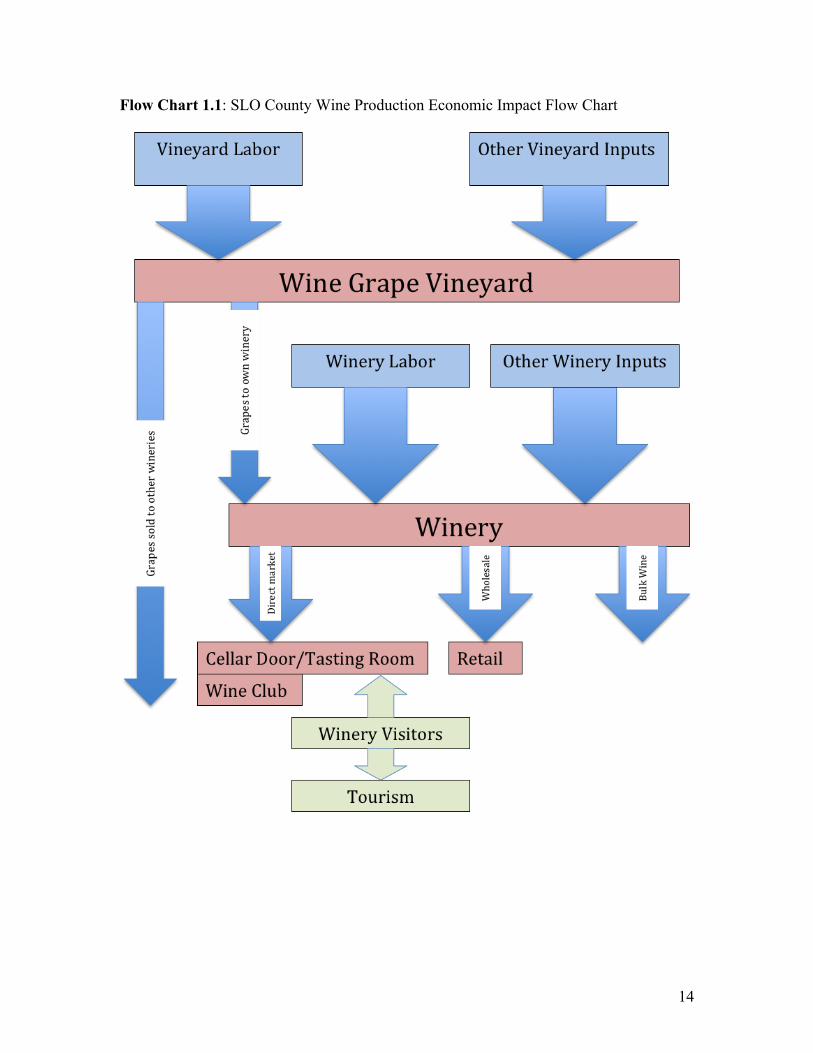
1.2 Modeling and Measuring the Economic Linkages and Contribution
Flow Chart 1.1 describes economic linkages for SLO County and PR AVA grape
and wine production. Grape production in the region requires labor inputs and other
6
inputs such as farm chemicals, vineyard nursery stock, trellis equipment and supplies and
other such inputs. These items are purchased from intermediate suppliers who also need
inputs and labor to provide the goods and services used in grape production. Grapes are
then processed into wine by the winery tied to the vineyard or sold to be processed by an
autonomous winery. Wine production requires its own set of inputs plus labor and,
therefore, interacts with intermediate suppliers of these specific inputs.
This analysis traces these economic linkage and contributions using an input-
output model. Input-output models link the magnitude of changes in an industry to the
associated changes in all the other industries and segments throughout the economy. An
expansion in the demand for wine produced and processed in SLO County and the PR
AVA causes more employment and other economic activity on vineyards and wineries in
the region. But that additional production and processing causes increased demand for
materials and services supplied by firms from outside the wine industry, such as corks,
barrels, bottles, labels, accounting services, supplies used in the vineyards, and
electricity, equipment and trucking used by wineries. Moreover, income generated by this
wine-induced economic expansion will be spent on other services, from groceries and
new cars to schoolteachers and bus drivers. Input-output models and the associated data
on economic linkages in the economy allow us to quantify these impacts using recent
spending and employment patterns, without leaving out impacts or double counting.
We use the IMPLAN model and database for 2012 to model the PR AVA and
database for 2014 to model the rest of SLO County. The 2012 database includes detailed
information for specific zip codes. This level of detail allowed for distinguishing
between the PR AVA and the remainder of SLO County. Each of these data have a
7
complete set of flows of purchases among every industry and sector of the economy. We
supplemented this dataset with specific costs and revenue data provided via questionnaire
by regional wine industry members that account for about 25 percent of grape and wine
production in SLO County and include members in the PR AVA and other parts of SLO
County. Cost and revenue data was provided at the vineyard and winery level. This data
enabled a customization of the IMPLAN model to better fit the specifics of the industry
in SLO County and the PR AVA.
We report contributions using three standard economic measures that have
specific definitions.
Value of Output simply measures the market prices multiplied by the quantities of
outputs or services produced by an industry. For example, the value of vineyard output is
the average price received per ton of grapes produced in SLO County and PR AVA
multiplied by the total tons of grape production. Moreover, the value of winery output
for the area is the average price received per unit of wine reported by wine industry
sources in SLO County and PR AVA, multiplied by the quantities of wine manufactured.
Value Added measures salaries and wages, proprietor income and profit and
indirect business taxes. Value added is that portion of value of output contributed by
labor and capital within the wine industry. The wine industry’s value added is its
economic contribution above the cost of goods and services that were purchased from
other sectors and were therefore already measured as the outputs of those sectors. When
we consider grape growing and winemaking, we recognize that the value of grapes either
purchased or produced onsite is the major cost item for wineries. So, when measuring the
contribution of processing to the economy, we must “net-out” the value of the grapes
8
before assigning the value that was added in the winemaking stage. Value added is an
industry’s contribution to the size of the regional and state economy, with no double
counting of output that is sold from one industry to the next.
Employment is defined as the number of jobs, including part-time or seasonal
employment, within an industry. These jobs include the business owners and family
members who share in entrepreneurial income as well as full-time and part-time hired
workers.
The economic impacts of additional economic activity with the wine industry are
generally classified as direct, indirect and induced effects on each of the aggregates just
defined.
Direct effects are simply impacts on output, value added or employment directly
within the affected industry. For example, when wine output goes up by $10 million, the
direct effect is to add $10 million to the value of output for the economy. When a winery
hires an additional 20 workers, the direct employment effect is 20 jobs.
Indirect effects are those changes that occur through purchases of input goods and
services from supporting industries. For example, if wineries produce more wine, they
are likely to buy more barrels, use more electricity and hire additional hauling services.
Our data has quantitative measures of all these relationships, as the effects of purchases
ripple through the regional economy and the economy of California.
Induced effects trace consumption expenditures. They measure the economic
impacts in each industry that result from added consumption generated by spending by
those earning new income from the direct and indirect effects. For example, PR AVA
wine producers selling wine for a higher price have employees, who may get higher
9
wages or work more hours and spend their incomes at regional grocery stores,
barbershops and so on, and these local firms have workers of their own. Workers also pay
more taxes and provide more support for government services such as schools.
Total effects are the sum of direct, indirect and induced impacts telling us the
complete impact or contribution of the wine industry to California’s Central Coast
region’s and SLO County’s value of output, value added and employment.
10
Figure 1.1: Paso Robles American Viticultural Area
Source: Mike Bobbitt & Associates
11
Figure 1.2: San Luis Obispo Annual Bearing Grape Acres, 1983-2015
Source: San Luis Obispo County Agriculture Commissioner Annual Crop Reports.
0
5
10
15
20
25
30
35
40
45
50
1983
1985
1987
1989
1991
1993
1995
1997
1999
2001
2003
2005
2007
2009
2011
2013
2015
Bea
ring
Gra
pe A
cres
(1,0
00 a
cres
)
12
Figure 1.3: Annual Value of Grape Crop and All Fruit and Nut Crops in San Luis Obispo County, 1983-2014
Source: San Luis Obispo County Agriculture Commissioner Annual Crop Reports.
$0
$50
$100
$150
$200
$250
$300
$350
$400
$450
$500
1983
1985
1987
1989
1991
1993
1995
1997
1999
2001
2003
2005
2007
2009
2011
2013
Valu
e of
Cro
p (in
$m
illio
n)
Grape Value
All Fruit and Nut Value
13
Figure 1.4: Wine Grape Share of Value for Fruit Crops and All Commodities Produced in San Luis Obispo County, 1983-2014
Source: San Luis Obispo County Agriculture Commissioner Annual Crop Reports.
0%
10%
20%
30%
40%
50%
60%
70%
80%
90%
100%
1983
1985
1987
1989
1991
1993
1995
1997
1999
2001
2003
2005
2007
2009
2011
2013
Shar
e of
Val
ue
Grape Share of Fruit Grape Share of All Commody Value
14
Flow Chart 1.1: SLO County Wine Production Economic Impact Flow Chart
15
Section 2. Economic Contributions of the Wine Industry in San Luis Obispo County and the Paso Robles AVA.
This section traces how the San Luis Obispo County (SLO County) and Paso
Robles AVA (PR AVA) wine industry affect the employment, value of output and value
added to the regional economy through the direct, indirect and induced effects outlined in
subsection 1.2. Our estimates use grape and wine production and prices provided by
industry stakeholders for the 2014 and 2015 calendar years to modify the IMPLAN data
that is available for 2014 at the county level and 2012 at the zip code level, which was
used to estimate impacts from the Paso Robles AVA.
2.1 SLO County and PR AVA Wine Industry Impact Multipliers
We begin with table 2.1 that shows the multipliers that turn direct wine industry
output, value added, employment and labor income into the full economic contributions
for both vineyard and winery operations including the indirect and induced impacts. The
direct output multiplier for both vineyards and wineries is one by definition: $1.00 of
direct output by both sectors equals $1.00 of direct output for the economy. The indirect
output multiplier is interpreted as the number of dollars of output generated in supporting
industries from a $1.00 increase in direct output by each of the two wine industry sectors.
For example, in table 2.1 under the column for PR AVA winery, the value of the indirect
output multiplier for wineries is 0.42 meaning that every dollar of expanded direct output
by wineries in the PR AVA results in $0.42 of additional output generated by supporting
industries that provide materials and services in the winemaking process. “Indirect”
output multipliers for the PR AVA wineries are higher than for the PR AVA vineyards
because wine making requires more purchased inputs from supporting industries such as
16
barrel suppliers, bottle and cork suppliers and transport services. This is not apparent
when comparing SLO County vineyards that are outside of the PR AVA. The “induced”
effects multiplier measures the output in the rest of the economy linked to an increase in
direct output through consumption activities of employees and owners within the sector.
The total effects multiplier is the sum of direct, indirect and induced effects multipliers.
It measures additional regional economic output from an increase in output by the wine
industry. Again within the PR AVA wineries have a higher total effect from increased
output than do vineyards due to their greater dependence upon supporting industries for
purchased inputs. The opposite effect seen in the SLO County multipliers could be a
result of a greater share of wine grapes being processed outside of the county or within
the PR AVA.
Value added can also be interpreted on a per dollar basis. As defined in Section 1,
value added is the measure of “new” value generated from the inputs held within an
industry during the process of combining purchased inputs into a marketable product.
This “new” value is represented by salaries and wages, proprietor income, profit and
indirect business taxes. The direct value-added for vineyards and wineries is the
economic contribution of these two sectors above the costs of goods and services that
were purchased from other sectors and were therefore already measured as the outputs of
those sectors. When considering vineyards and wineries separately, we recognize that
grapes “purchased” from vineyards is the major cost item for wine makers. So when
measuring the contributions of wineries to the economy we must “net-out” the value of
grapes purchased before assigning the value that was added in the winemaking stage.
This portion of output value is what the SLO County and PR AVA wine industry
17
contributes to the gross regional and gross state products, which are also measured on a
value added basis. For grape growers within the PR AVA, $0.51 of every $1.00 of
additional output from wine grape production ends up as on-farm salaries and wages,
proprietor income, business profit and sales taxes. Between SLO County and PR AVA
wineries and vineyards, grape growing has the highest direct value-added multiplier with
$0.51 of every $1.00 of output adding to the regional and state economy. Wine making
in the PR AVA has a lower direct value-added but a slightly higher indirect value-added
multiplier than grape growing. Again, the higher dependence on support industries for
inputs to wine making is the reason for the higher indirect effects. Induced value-added
effects are fairly similar across vineyards and wineries and represent how consumer
purchases using income from the wine industry cause additional economic output as they
ripple through the economy.
The employment multiplier in each cell can be interpreted as the number of jobs
added to the economy by a $1 million increase in the value of direct output by SLO
County and PR AVA vineyards and wineries. Sectors that are labor intensive and buy
services from labor intensive industries have high employment multipliers. For example,
every $1 million in added output of grape growing creates about 15 additional jobs in the
region, the majority of these jobs, about 10, are created directly. The high dependency on
hand labor in SLO County and PR AVA vineyards creates a large number of jobs in the
region. Induced employment numbers indicate the number of jobs created in the rest of
the economy as a result of increased income within the wine industry and in supporting
industries. Added labor and proprietor income creates greater spending within the
economy which spurs further job creation.
18
Labor income multipliers indicate the amount that is paid out in salaries and
benefits to employees and proprietors for every dollar of additional output generated. It
is the portion of the value-added to the economy by the industry that is in the form of
wages and salaries. The multipliers in table 2.1 indicate that a large portion of value
added to the economy from the SLO County and PR AVA wine industry is done via
direct labor income.
In addition to examining the economic ripple effects caused by the output of wine
grapes and wine from the SLO County and PR AVA wine industry, this study also
includes an analysis of the regional wine industries’ economic impact via tourism to the
area. Wine is unique when compared to other agricultural products in that its production
and marketing traditions serve to attract consumers to the areas where grape growing and
wine making take place. Wine tourists who visit the SLO County and PR AVA wine
region provide an increase to the output of area hotels, restaurants and retail markets.
These boosts in output also impact the regional economy through direct, indirect and
induced impacts on output, value added, labor income and employment. The impact
multipliers for these industries are presented in Table 2.2.
Total value of output for each of these three industries increases between $0.53
and $0.57 per $1.00 of direct output. The relative uniformity across the three tourist
related industries indicate that they each depend upon an equal amount of support from
outside industries and, therefore, also provide an equal boost to the economy. This fact is
also witnessed in the value-added impacts each industry has on the regional and state
economy. The biggest difference across the three is found in comparing employment
multipliers. Restaurants employ an additional 22 people for each $1 million of increased
19
output, which is almost double the number of jobs added by hotels. The increase in
number of meals served by restaurants requires additional labor for service, kitchen staff
and cleaning.
We apply these multipliers in table 2.1 and 2.2 to data on production, value of
output and employment in the SLO County and PR AVA wine industry in order to
estimate the contributions the industry makes to the regional and state economy during
2014 and 2015.
2.2 SLO County and PR AVA Wine Industry Economic Impacts
The rest of this chapter quantifies the economic relationships of the wine industry
and the regional and state economy and shows how the economic impacts flow through
the economy in 2014 and 2015. We estimated output values for vineyards and wineries
using a combination of publicly available data and calculations of revenue per unit of
production based on information provided by industry participants who responded to
questionnaires about their business. The resulting value of output estimates provide the
basis for applying the previously discussed multipliers and estimating the statewide
economic impacts of each sector and the industry as a whole (Table 2.3).
Estimates of vineyard direct output for SLO County in 2015 was $279 million, up
from an estimated $244 million in 2014 (Table 2.4). The majority of this output, $258
million, occurred within the boundary of PR AVA. In general, the PR AVA accounts for
87 percent of total grape and wine production within SLO County. Total direct output,
which includes indirect output from all intermediate industries and induced output, from
2015 grape production in SLO County was $456 million.
20
Vineyard operations within SLO County generated $150 million in direct value-
added production to the regional and state economy in 2015, up from $123 million in
2014. Of the 2015 contribution, about $130 million was directly added from grape
growing in the PR AVA. When including indirect and induced effects from SLO County
vineyard operations, a total of $244 million was added to the regional and state economy
in 2015.
The vineyards in SLO County and the PR AVA rely on a great deal of hand labor
to perform many tasks including pruning and harvesting, which creates employment for
the region. In 2015 vineyard operations in SLO County provided 2,910 direct jobs with
2,526 of these jobs within the PR AVA. Supporting industries provided an additional
786 jobs in the region due to vineyard production. The salary and wages paid to direct
and indirect employees rippled through the economy and generated another 654 jobs
from induced effects. In total, grape growing in SLO County generated 4,349 jobs in the
regional economy in 2015.
Winery direct output for SLO County in 2015 is estimated at $732 million. Of
this, $636 million was produced within the Paso Robles AVA (Table 2.5). In total,
output for the economy generated by winery operations in SLO County amounted to over
$1.2 billion in 2015, up from $1.1 billion in 2014. This output total includes the value of
wine grape production output presented in Table 2.4. Value-added to the regional and
state economy from wine production in SLO County, including direct, indirect and
induced effects was $570 million in 2015, with $505 million of this coming from winery
operations in the PR AVA.
21
Direct employment in SLO County wineries is estimated at 3,442 jobs in 2015.
Close to 3,000 of these jobs are with wineries located within the PR AVA. An additional
1,780 jobs within supporting industries and 1,683 jobs in other parts of the economy are
estimated to exist due to wine industry operations. In total, 6,905 jobs were contributed
to the economy in 2015 from the SLO County wine industry with 6,113 of these jobs
attributed to the PR AVA.
Economic impacts to the region from the SLO County and PR AVA wine
industry also come from revenues generated for the tourism industry by visitors to area
wineries and tasting rooms. For this project, regional industry stakeholders provided data
on the number of people who visited their wineries and tasting rooms in 2014 and 2015.
Using this information, we estimated an aggregate number of wine-related visits to SLO
County and the PR AVA. We combined the number of wine visits with per capita
expenditure data provided by the Paso Robles Wine Country Alliance from a previous
consumer study done in the Spring of 2015. With these data we were able to estimate the
contribution to the regional and state economy generated from wine tourism.
The total number of visits to SLO County wineries in 2015 is estimated at 1.56
million, which is up 20 percent from an estimated 1.31 million visits in 2014 (Table 2.6).
Estimates from data provided by industry sources suggest about 67 percent of visitors to
SLO County wineries were from outside the county and the length of stay in the area was
just under 2 days per visit. Combining this information with estimates of the average
daily expenditures on hotel accommodations, restaurant meals and retail shopping
provided estimates of total direct output from each of these tourist sectors as well as
indirect and induced effects of wine tourism on the regional economy (Table 2.6).
22
In 2015 it is estimated that wine tourism generated about $194 million in direct
output from tourist related industries in SLO County, which is a 24 percent increase from
the previous year (Table 2.6). The largest contributing sector to wine-tourism output is
hotel accommodations, which generated $88 million of direct wine-tourism related output
and accounted for $134 million in total output in 2015, up from $107 million in 2014
(Table 2.7 and Table 2.8). Comparing wine-tourism generated hotel stays with hotel
industry demand numbers provided by industry sources, wine-tourism accounts for
approximately 28 percent of the total demand for hotel space in SLO County in 2015,
which is up from 24 percent in 2014. In total, the value added to the regional and state
economy from SLO County wine tourism in 2015 was $109 million. Of this total,
accommodations account for $75 million in value added followed by restaurants at $26
million and retail sales with $9 million. An additional 2,372 jobs are generated for the
economy from the wine industry’s impact on the tourism industry.
2.3 Wine Industry Economic Impacts in the Context of the SLO County Economy
We now place the economic contributions of the SLO County and PR AVA wine
industry into the context of SLO County totals for jobs and total county gross product or
total county value added. One caveat to this comparison is that although a majority of
impacts do take place within SLO County it should be assumed that not all output, value-
added or jobs from the SLO County or PR AVA wine industry are contained within SLO
County. The economic ripple effects from the wine industry would carry economic
impacts beyond county lines. For example the use of input suppliers from outside the
23
county or direct-employed winery sales staff located in different parts of California or
outside the state.
Our first comparison examines total output in the region from the presence of the
wine industry that results from the process of growing grapes, turning grapes into wine
for sale, as well as from the influence of tourism to the area due to the presence of the
wine industry, and compares this to total SLO County output. In 2015 total economic
output from wine related business is estimated at $1.88 billion, which increased from
$1.61 billion in 2014 (Table 2.9). When compared to all of SLO County in these two
years, the wine industry generates the equivalent of 7 to 8 percent of total output from the
county. Over half of the total output generated results from direct output of vineyards
and wineries.
Including employment generated in the tourism industry from wine-related
tourism, the number of jobs from the wine industry in 2014 was 11,561 and increased to
13,627 in 2015. These totals equal to 10.1 percent and of all wage and salary jobs in
SLO County in 2014 and 11.5 percent in 2015 (Table 2.10). Again, the largest share of
jobs are generated directly by the vineyards and wineries themselves.
Gross regional product (GRP) for San Luis Obispo County in 2014 was $13.4
billion and grew to $14.3 billion in 2015 (Table 2.11). Value added from grape growing,
wine production and wine-related tourism totaled $789 million, or close to 6 percent of
total GRP in 2014 for the region and $924 million, or 6.5 percent of total GRP in 2015.
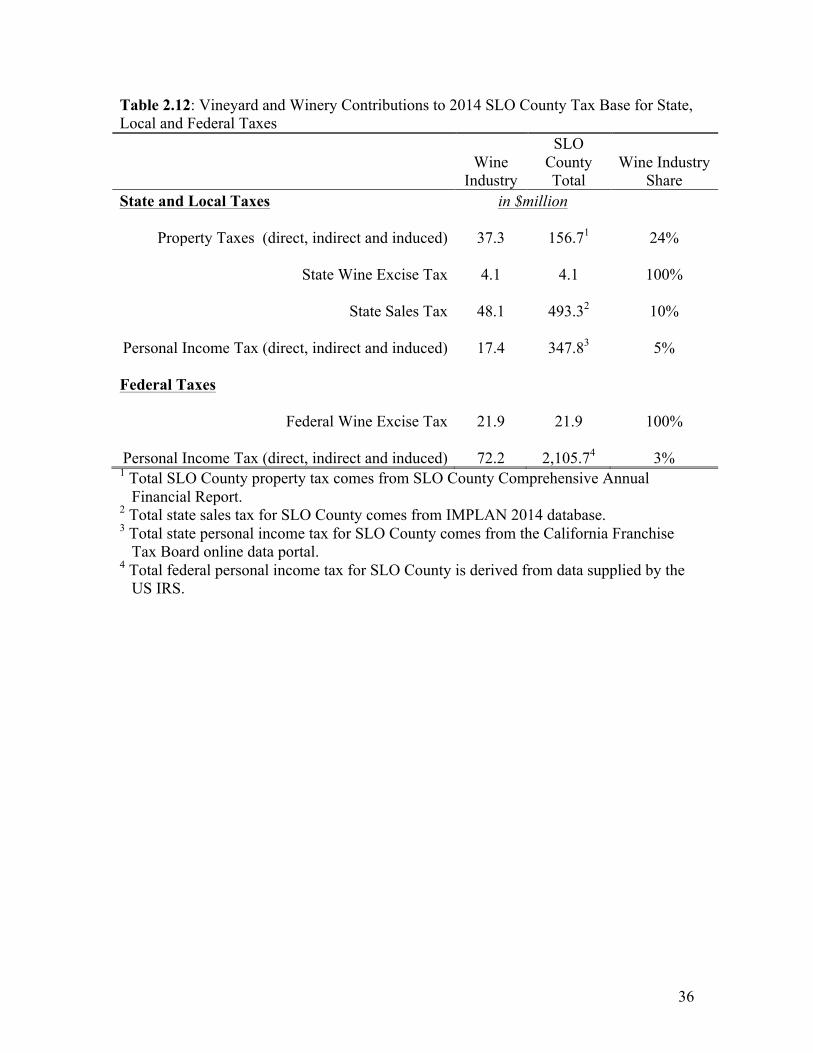
We examine the contribution of the wine industry to the tax base generated by
businesses and residents of SLO County (Table 2.12 and Table 2.13). Specifically we
estimate the amount of property tax generated from SLO County vineyards and wineries
24
and compare this to the total property tax base for the county as reported by the SLO
County Auditor-Controller Office. We also estimate the amount of California State sales
tax generated from the wine industry and compare that to SLO County totals. Both
California state and federal personal income tax is also compared. Finally, total
California state wine excise tax and federal wine excise tax are reported. Taxes paid by
the tourism industry are not included in these comparisons.
Property tax assessments to vineyards and wineries are estimated at $37.3 million
in 2014 and $44.8 million in 2015. These totals account for 24 percent of total SLO
County property tax revenues collected in 2014 and 28 percent in 2015. Sales of SLO
County wine, including PR AVA, equal 10 percent of total sales tax generated in SLO
County in each of the two years reported. Employees and proprietors of SLO County
vineyards and wineries paid an estimated $17.4 million in personal income tax to the
State of California in 2014 or 5 percent of the total state income tax paid by residents of
SLO County for the year. The amount of state personal income tax increased to $19.9
million and 6 percent of SLO County totals in 2015. Federal personal income tax paid by
employees and proprietors of the wine industry equaled $72 million in 2014 or 3 percent
of SLO County totals and increased to $86 million and 4 percent of county totals in 2015.
The wine industry also contributed over $4 million to California’s tax base and close to
$22 million to the U.S. tax base from wine excise taxes in each of the two years reported.
25
Table 2.1: SLO County1 and Paso Robles AVA Wine Industry Impact Multipliers Multiplier Vineyard Winery
Paso Robles AVA SLO County Paso Robles AVA SLO County Value of Output $ of output for economy per $1.00 output by wine sector
Total Effect 0.63 0.63 0.63 0.47 Source: Multipliers were generated in IMPLAN using revenue and costs data provided by industry respondents to project questionnaire. 1 SLO County multipliers were estimated independent of PR AVA.
26
Table 2.2: SLO County and Paso Robles AVA Wine Tourism Impact Multipliers Multiplier Accommodations Restaurants Retail Spending
Value of Output $ of output for economy per $1.00 output by wine related tourism
Total Employment 16.41 26.70 17.79 Source: Multipliers were generated in IMPLAN using revenue and costs data provided by industry respondents to project questionnaire.
27
Table 2.3: Output of SLO County1 and PR AVA Vineyards and Wineries, 2014 and 2015
2014 2015
Paso Robles AVA
SLO County1
Paso Robles AVA
SLO County1
Vineyard Output Grapes produced (in tons) 110,916 127,784 110,555 127,367
Revenue per ton of grapes2 $1,911 $1,911 $2,329 $2,329
Total grape revenue (in $million) $212 $244 $257 $297
Winery Output
Gallons of wine produced (million gallons) 17.7 20.4 17.7 20.4
Revenue per gallon of wine3 $31 $31 $36 $36
Total wine revenue (in $million) $557 $642 $636 $732 1 SLO County totals include production from PR AVA. 2 Revenue per ton of grapes is a weighted average estimated from data provided by industry respondents to project questionnaire. 3 Revenue per gallon of wine is a weighted average estimated from data provided by industry respondents to project questionnaire.
28
Table 2.4: Economic Impacts of SLO County1 and PR AVA Vineyards, 2014-20152 Multiplier 2014 20152
Total Employment 3,107 3,579 3,775 4,349 Source: Values were estimated by UC AIC staff by applying input-output multipliers generated in IMPLAN and using revenue and costs data provided by industry respondents to project questionnaire. 1 Includes Paso Robles AVA. 2 Values for 2015 crop year are estimated from data provided by industry respondents to project questionnaire.
29
Table 2.5: Economic Impacts of SLO County1 and PR AVA Wineries, 2014-20152 Multiplier 2014 20152
Total Employment 5,358 6,053 6,113 6,905 Source: Values were estimated by UC AIC staff by applying input-output multipliers generated in IMPLAN and using revenue and costs data provided by industry respondents to project questionnaire. 1 Includes Paso Robles AVA. 2 Values for 2015 crop year are estimated from data provided by industry respondents to project questionnaire.
30
Table 2.6: Number of Visits and Total Economic Effect of Wine Tourism in SLO County
2014 2015
Total number of wine tourists (in million visits) 1.31 1.56 Total output from wine tourism (in $million) $157 $194 Total value added from wine tourism (in $million) $88 $109 Total employment from wine tourism (number of jobs) 1,929 2,372 Source: Values were estimated by UC AIC staff by applying input-output multipliers generated in IMPLAN and using winery visits data provided by industry respondents to project questionnaire.
31
Table 2.7: Economic Impacts of SLO County and Paso Robles AVA Wine Tourism 2014 Multiplier Accommodations Restaurants Retail Spending
Value of Output $1,000,000 Direct Output $69 $25 $8
Total Employment 1,140 655 134 Source: Values were estimated by UC AIC staff by applying input-output multipliers generated in IMPLAN and using winery visits data provided by industry respondents to project questionnaire.
32
Table 2.8: Economic Impacts of SLO County and Paso Robles AVA Wine Tourism 2015 Multiplier Accommodations Restaurants Retail Spending
Value of Output $1,000,000 Direct Output $88 $29 $9
Total Employment 1,436 776 159 Source: Values were estimated by UC AIC staff by applying input-output multipliers generated in IMPLAN and using winery visits data provided by industry respondents to project questionnaire.
33
Table 2.9: Economic Impacts of SLO County and Paso Robles AVA Wine Industry Including Tourism 2014 2015
Output ($millions)
Output Generated Directly by Wine Industry Vineyard output 244 297 Winery output 642 732
Total output 886 1,029 Output Generated in Other Sectors of Economy by Wine Industry Operations From vineyard operations 131 159 From winery operations 438 500
Total output 570 660 Output Generated from Wine Related Tourism
Direct tourism related output 102 126 Other output generated from tourism operations 55 68
Total output 157 194 Total Output Generated from Vineyards, Wineries and Wine Tourism 1,612 1,882
Total Economic Output San Luis Obispo County1,2
(in $ billion) $23.0 $23.2
Ratio of Wine Industry Output to all San Luis Obispo County Economic Output. 7% 8% Source: Values were estimated by UC AIC staff by applying input-output multipliers generated in IMPLAN and using winery visits data provided by industry respondents to project questionnaire. 1 Total 2014 economic output for SLO County comes from IMPLAN 2014 database. 2 Total 2015 economic output for SLO County is estimated using IMPLAN 2014 data and applying a 1 percent projected growth rate.
34
Table 2.10: Number of Jobs Generated in San Luis Obispo County from Wine Industry Operations and Wine Related Tourism 2014 2015
Number of People Employed
Jobs Generated Directly by Wine Industry Vineyard jobs 2,395 2,910
Winery jobs 3,017 3,442 Total Jobs 5,412 6,352
Jobs Generated in Other Sectors of Economy by Wine Industry Operations From vineyard operations 1,185 1,440
From winery operations 3,036 3,463 Total Jobs 4,220 4,903
Total Jobs Generated from Wine Related Tourism Direct tourism related jobs 1,447 1,776
Other jobs generated from tourism operations 482 596 Total Jobs 1,929 2,372
Total Jobs Generated from Vineyards, Wineries and Wine Tourism Direct jobs 6,859 8,128
Other jobs generated in other parts of economy 4,702 5,499 Total Jobs 11,561 13,627
Total wage and salary jobs in San Luis Obispo County1 114,670 117,982
Ratio of wine industry generated jobs to all wage and salary jobs in San Luis Obispo County 10.1% 11.5%
1 Total wage and salary jobs data comes from the California Department of Transportation “2015 County-Level Economic Forecast 2015-2040”.
35
Table 2.11: Value Added to SLO County Gross Regional Product from Wine Industry Operations and Wine Related Tourism 2014 2015
Value Added ($millions)
Value Added Directly by Wine Industry Vineyard Value Added 123 150 Winery Value Added 234 267
Total Value Added 357 417 Value Added in Other Sectors of Economy by Wine Industry Operations
From vineyard operations 78 94 From winery operations 266 303
Total Value Added 344 398 Value Added from Wine Related Tourism
Direct Value Added from Tourism 58 71 Value added by other sectors from tourism operations 31 38
Total Value Added 88 109 Total Value Added from Vineyards, Wineries and Wine Tourism
Direct Value Added 415 488 Value Added by other sectors from wine related business 374 436
Total Value Added 789 924
San Luis Obispo County Gross Regional Product1 13,446 14,272
Ratio of Value Added to San Luis Obispo County Gross Regional Product by Wine Industry 5.9% 6.5%
1 Total gross regional product data comes from the California Department of Transportation “2015 County-Level Economic Forecast 2015-2040”.
36
Table 2.12: Vineyard and Winery Contributions to 2014 SLO County Tax Base for State, Local and Federal Taxes
Wine Industry
SLO County Total
Wine Industry Share
State and Local Taxes in $million
Property Taxes (direct, indirect and induced) 37.3 156.71 24%
State Wine Excise Tax 4.1 4.1 100%
State Sales Tax 48.1 493.32 10%
Personal Income Tax (direct, indirect and induced) 17.4 347.83 5% Federal Taxes
Federal Wine Excise Tax 21.9 21.9 100%
Personal Income Tax (direct, indirect and induced) 72.2 2,105.74 3%
1 Total SLO County property tax comes from SLO County Comprehensive Annual Financial Report.
2 Total state sales tax for SLO County comes from IMPLAN 2014 database. 3 Total state personal income tax for SLO County comes from the California Franchise
Tax Board online data portal. 4 Total federal personal income tax for SLO County is derived from data supplied by the
US IRS.
37
Table 2.13: Vineyard and Winery Contributions to 2015 SLO County Tax Base for State, Local and Federal Taxes
Wine Industry
SLO County Total
Wine Industry Share
State and Local Taxes in $million
Property Taxes (direct, indirect and induced) 44.8 160.21 28%
State Wine Excise Tax 4.1 4.1 100%
State Sales Tax 54.9 528.8 10%
Personal Income Tax (direct, indirect and induced) 19.9 350.92 6% Federal Taxes
Federal Wine Excise Tax 21.8 21.8 100%
Personal Income Tax (direct, indirect and induced) 86.0 2,334.63 4%
1 Total SLO County property tax comes from SLO County Comprehensive Annual Financial Report.
2 Total state sales tax for SLO County is estimated from IMPLAN 2014 database and applying a 7.2 percent growth rate.
3 Total state personal income tax for SLO County comes from the California Franchise Tax Board online data portal.
4 Total federal personal income tax for SLO County is derived from data supplied by the US IRS.
38
Concluding Remarks
Wine grape growing and wine production within SLO County, and specifically within
the Paso Robles AVA is an important component of regional agriculture and a major
contributor to the economic wellbeing of the area. The impacts of grape growing and
wine production on the regional economy are augmented by the tradition of wine
consumers visiting where wine is produced and providing an additional economic boost
to the local economy through increased output by the tourism industry. In total the
presence of the wine industry in the area accounts for an equivalent of 10 to 12 percent of
all salary and wage jobs in SLO County, injects almost $1 billion in added value to the
economy and contributes 25 to 30 percent of the total property tax revenue generated in