24

THE ECONOMICS OF LNG SUPPLY
BASED ON HYBRID PV-WIND
POWER PLANTS
Mahdi Fasihi and Christian BreyerNeo-Carbon Energy 2nd Researchers’ SeminarLappeenranta, 16.03.2015
First insights on economics of global PtG based LNG trading in 2030
NEO-CARBON ENERGY 2nd Researchers’ SeminarMahdi Fasihi [email protected]
Agenda
MotivationMethodology and DataResultsFurther StudySummary
NEO-CARBON ENERGY 2nd Researchers’ SeminarMahdi Fasihi [email protected]
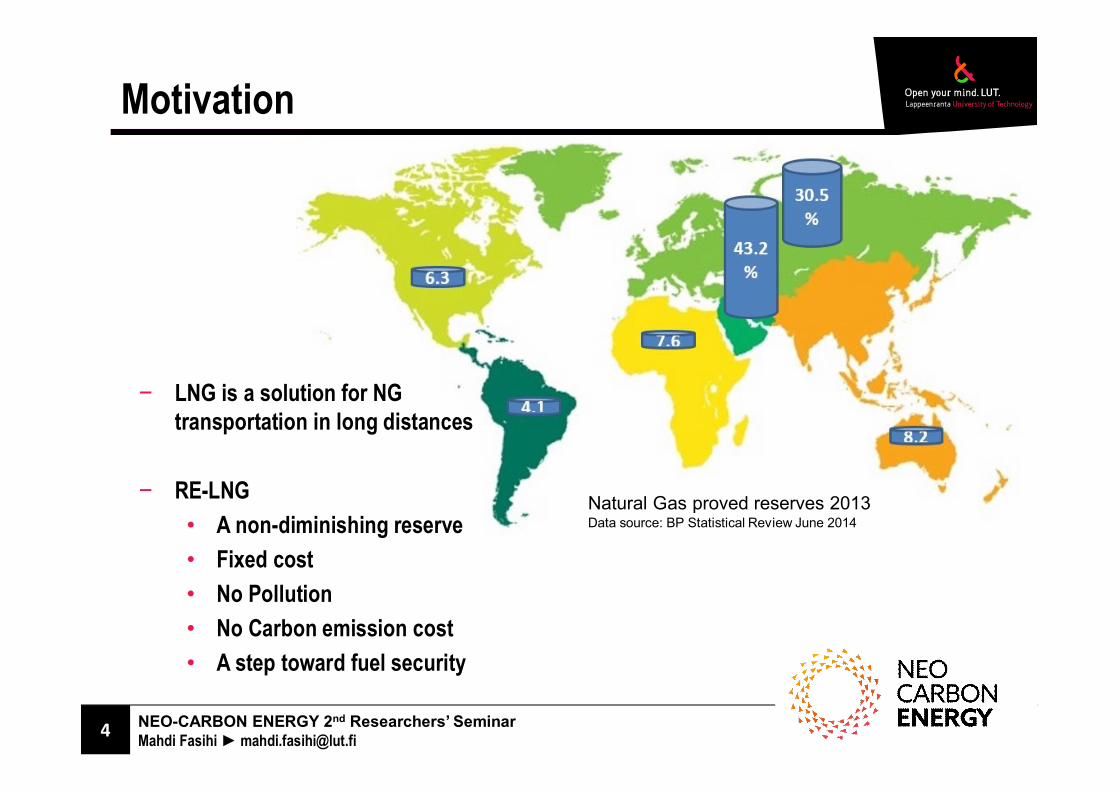
Motivation
Natural Gas proved reserves 2013Data source: BP Statistical Review June 2014
LNG is a solution for NG transportation in long distances
RE-LNG• A non-diminishing reserve• Fixed cost• No Pollution• No Carbon emission cost• A step toward fuel security

NEO-CARBON ENERGY 2nd Researchers’ SeminarMahdi Fasihi [email protected]
Agenda
MotivationMethodology and DataResultsFurther StudySummary
NEO-CARBON ENERGY 2nd Researchers’ SeminarMahdi Fasihi [email protected]
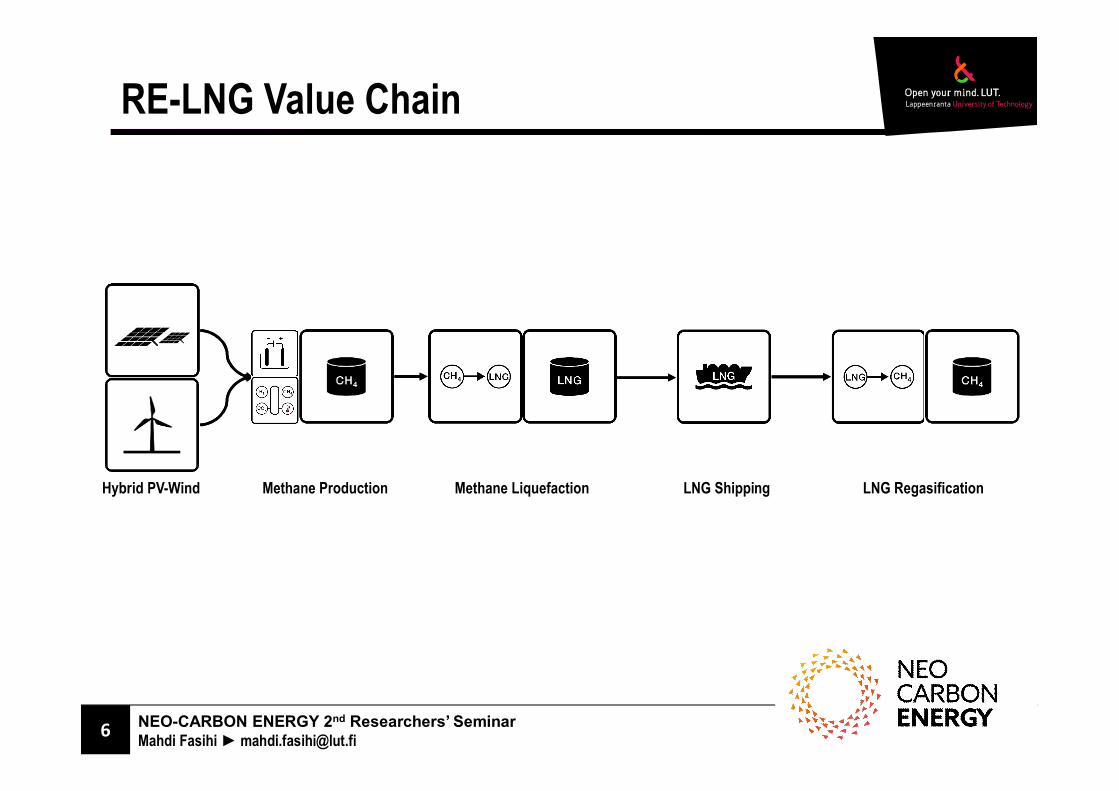
RE-LNG Value Chain
Hybrid PV-Wind Methane Production Methane Liquefaction LNG Shipping LNG Regasification
NEO-CARBON ENERGY 2nd Researchers’ SeminarMahdi Fasihi [email protected]
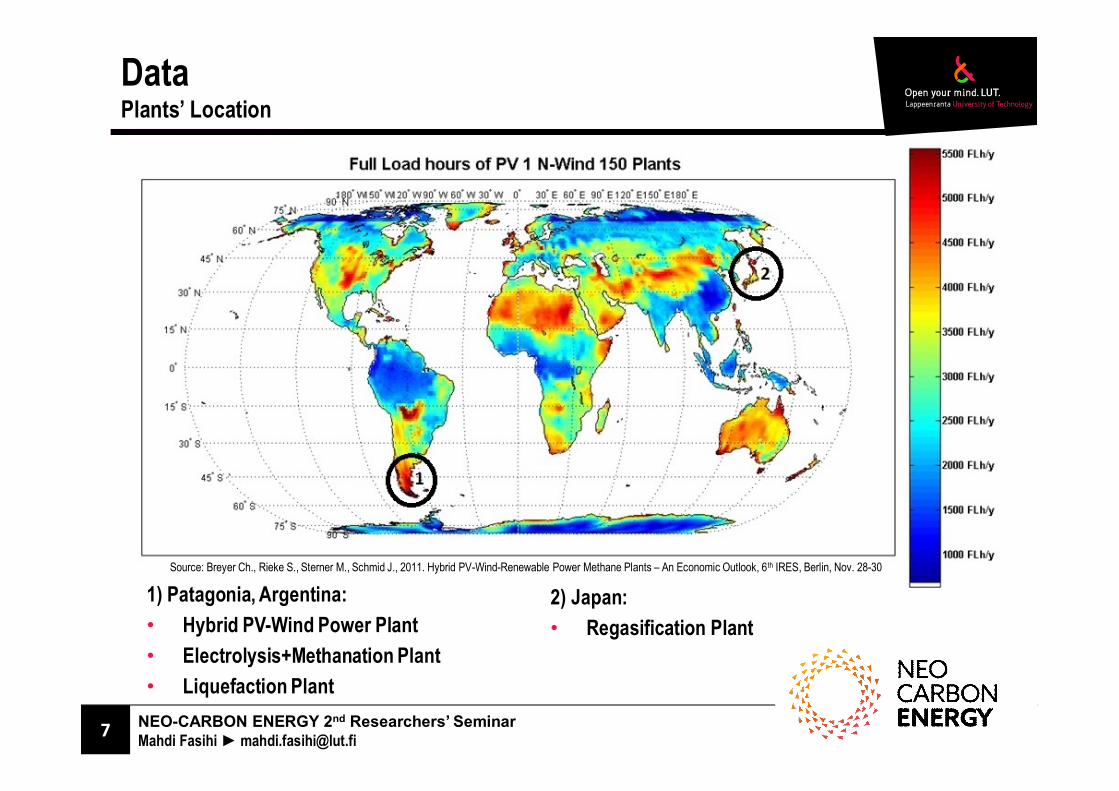
DataPlants’ Location
Source: Breyer Ch., Rieke S., Sterner M., Schmid J., 2011. Hybrid PV-Wind-Renewable Power Methane Plants – An Economic Outlook, 6th IRES, Berlin, Nov. 28-30
1) Patagonia, Argentina:• Hybrid PV-Wind Power Plant• Electrolysis+Methanation Plant• Liquefaction Plant
2) Japan:• Regasification Plant
NEO-CARBON ENERGY 2nd Researchers’ SeminarMahdi Fasihi [email protected]
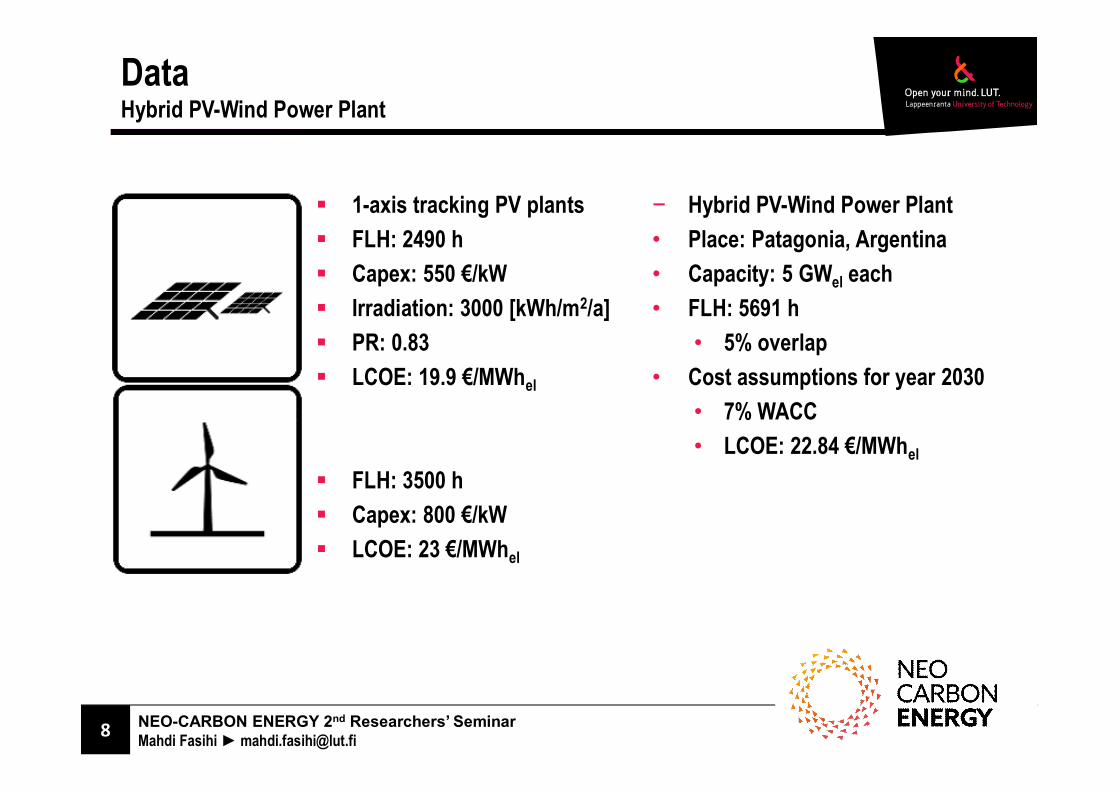
DataHybrid PV-Wind Power Plant
Hybrid PV-Wind Power Plant• Place: Patagonia, Argentina• Capacity: 5 GWel each• FLH: 5691 h
• 5% overlap• Cost assumptions for year 2030
• 7% WACC• LCOE: 22.84 €/MWhel
1-axis tracking PV plantsFLH: 2490 hCapex: 550 €/kWIrradiation: 3000 [kWh/m2/a]PR: 0.83LCOE: 19.9 €/MWhel
FLH: 3500 hCapex: 800 €/kWLCOE: 23 €/MWhel
NEO-CARBON ENERGY 2nd Researchers’ SeminarMahdi Fasihi [email protected]
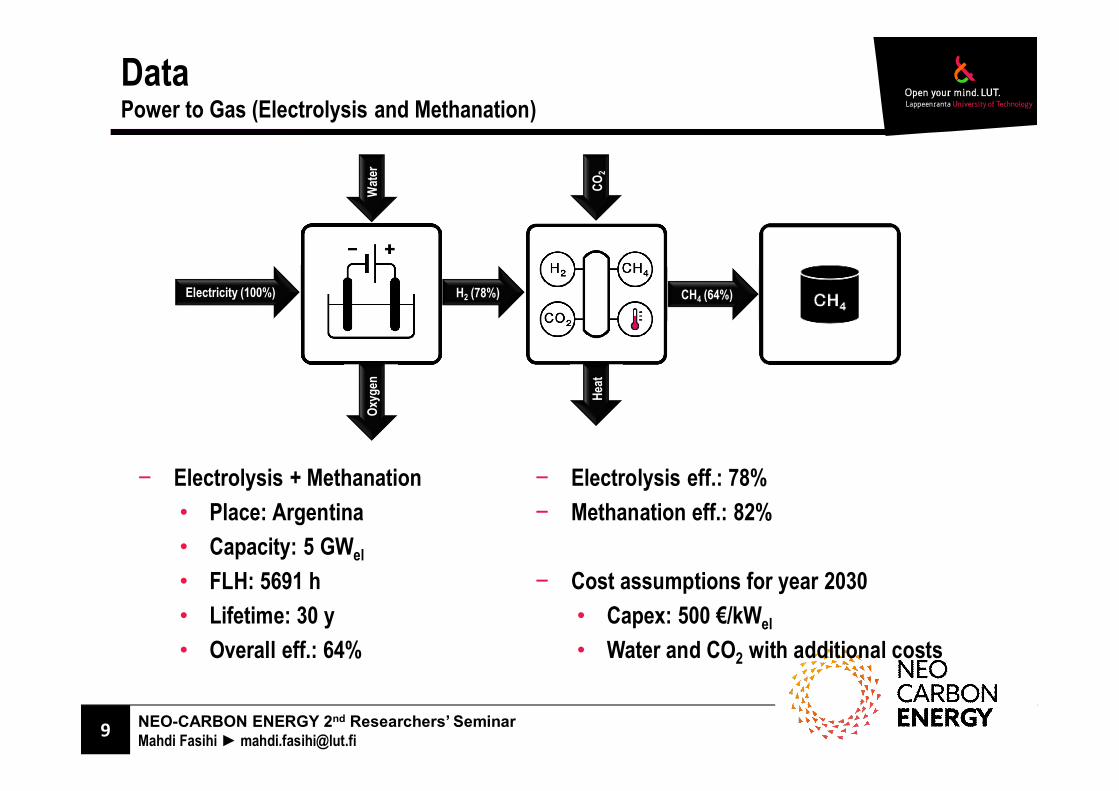
DataPower to Gas (Electrolysis and Methanation)
Electrolysis + Methanation• Place: Argentina• Capacity: 5 GWel
• FLH: 5691 h• Lifetime: 30 y• Overall eff.: 64%
Electricity (100%)
CO2
Wat
er
Heat
Oxyg
en
H2 (78%) CH4 (64%)
Electrolysis eff.: 78%Methanation eff.: 82%
Cost assumptions for year 2030• Capex: 500 €/kWel
• Water and CO2 with additional costs
NEO-CARBON ENERGY 2nd Researchers’ SeminarMahdi Fasihi [email protected]
DataLiquefaction
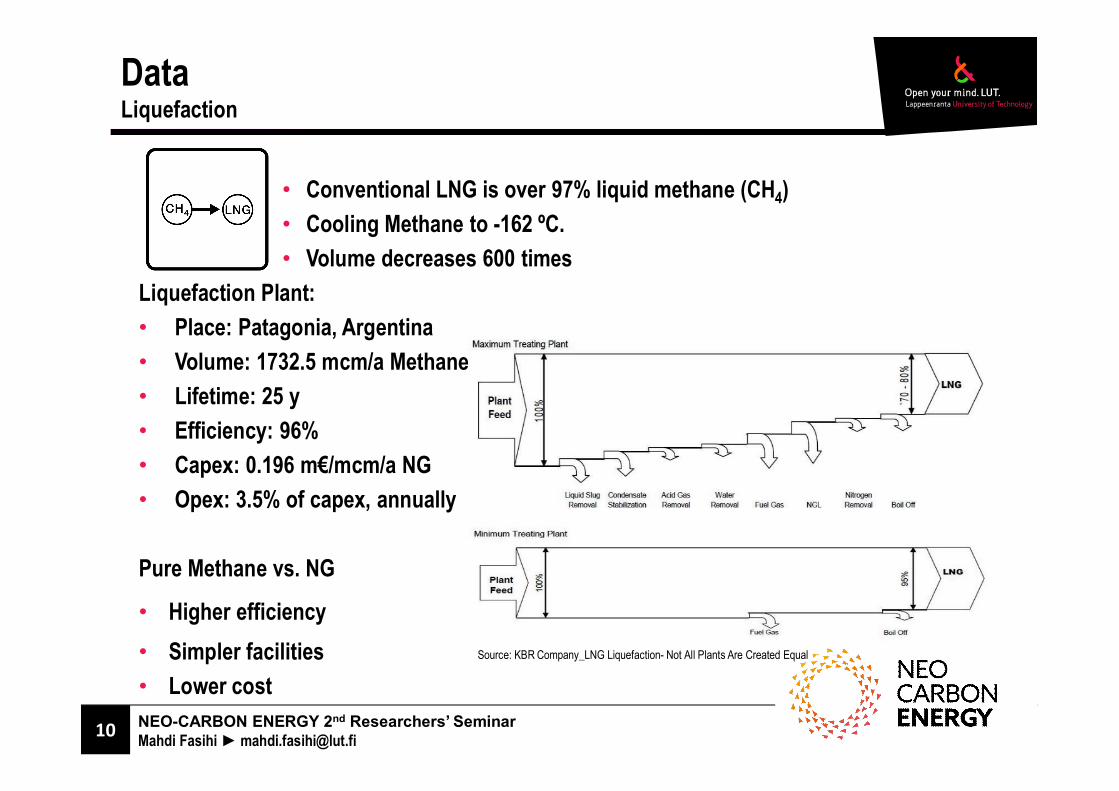
• Conventional LNG is over 97% liquid methane (CH4)• Cooling Methane to -162 ºC.• Volume decreases 600 times
Liquefaction Plant:• Place: Patagonia, Argentina• Volume: 1732.5 mcm/a Methane• Lifetime: 25 y• Efficiency: 96%• Capex: 0.196 m€/mcm/a NG• Opex: 3.5% of capex, annually
Pure Methane vs. NG
• Higher efficiency• Simpler facilities• Lower cost
Source: KBR Company_LNG Liquefaction- Not All Plants Are Created Equal
NEO-CARBON ENERGY 2nd Researchers’ SeminarMahdi Fasihi [email protected]
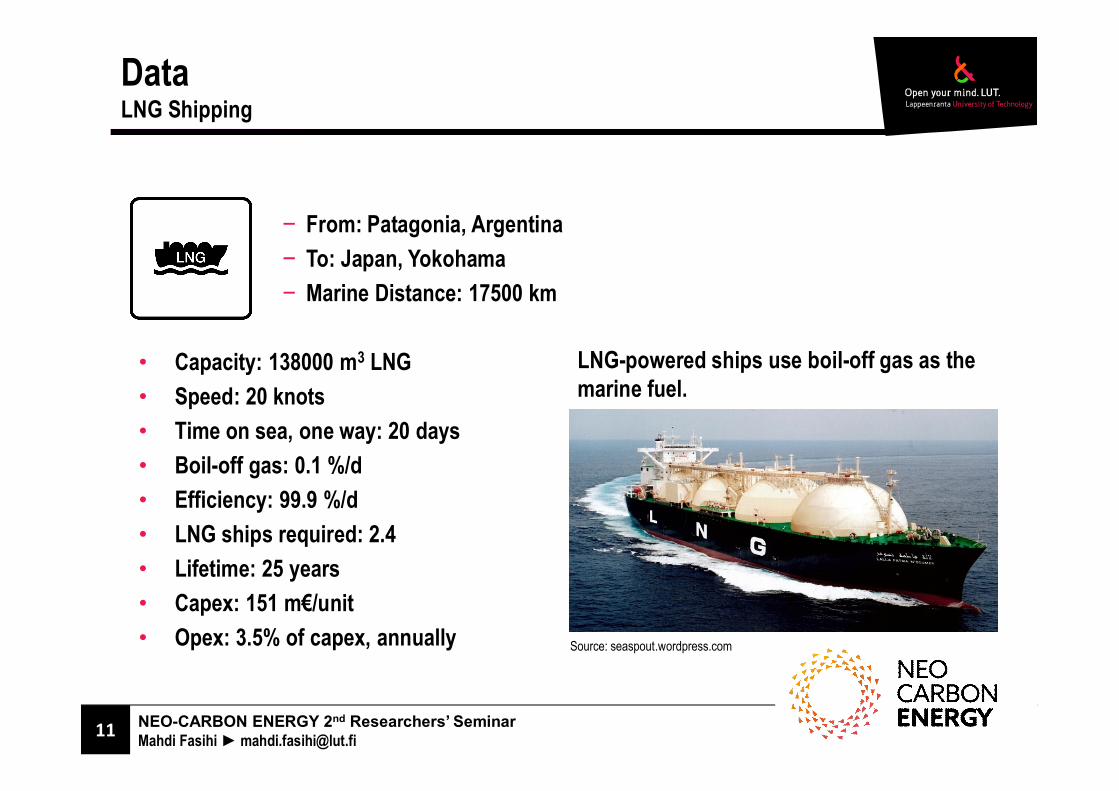
DataLNG Shipping
Source: seaspout.wordpress.com
From: Patagonia, ArgentinaTo: Japan, YokohamaMarine Distance: 17500 km
• Capacity: 138000 m3 LNG• Speed: 20 knots• Time on sea, one way: 20 days• Boil-off gas: 0.1 %/d• Efficiency: 99.9 %/d• LNG ships required: 2.4• Lifetime: 25 years• Capex: 151 m€/unit• Opex: 3.5% of capex, annually
LNG-powered ships use boil-off gas as the marine fuel.
NEO-CARBON ENERGY 2nd Researchers’ SeminarMahdi Fasihi [email protected]
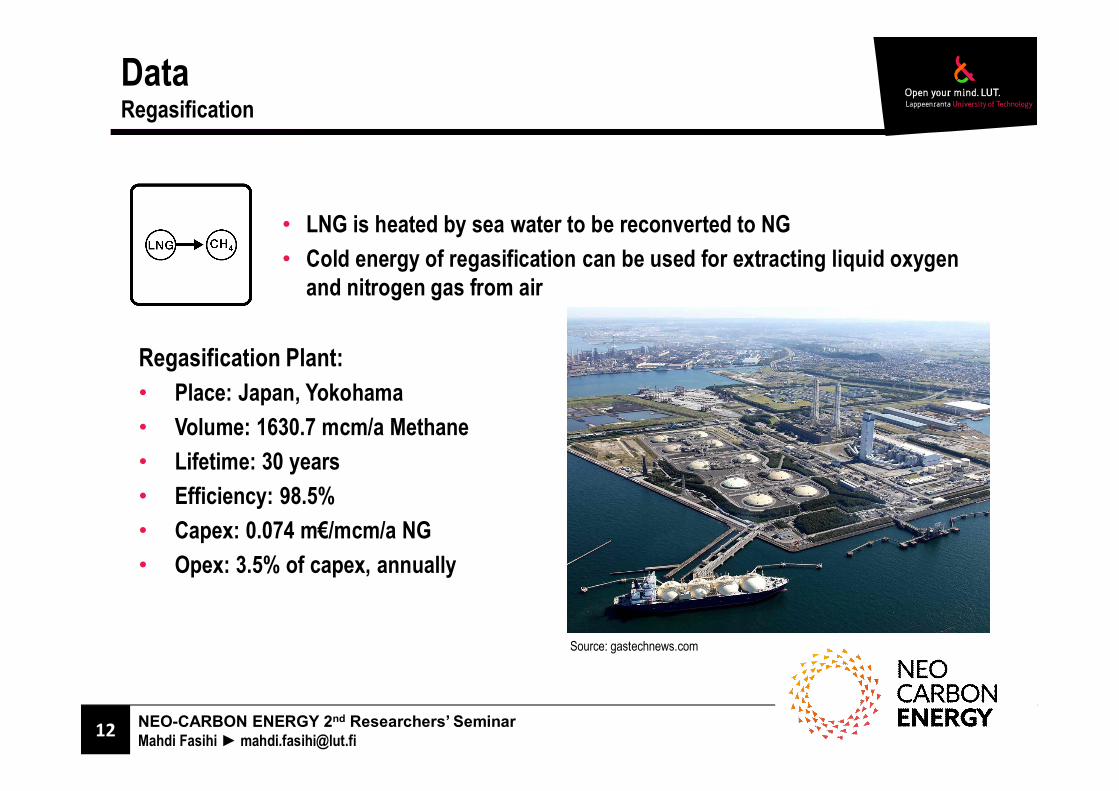
DataRegasification
Source: gastechnews.com
• LNG is heated by sea water to be reconverted to NG• Cold energy of regasification can be used for extracting liquid oxygen
and nitrogen gas from air
Regasification Plant:• Place: Japan, Yokohama• Volume: 1630.7 mcm/a Methane• Lifetime: 30 years• Efficiency: 98.5%• Capex: 0.074 m€/mcm/a NG• Opex: 3.5% of capex, annually
NEO-CARBON ENERGY 2nd Researchers’ SeminarMahdi Fasihi [email protected]
Agenda
MotivationMethodology and DataResultsFurther StudySummary
NEO-CARBON ENERGY 2nd Researchers’ SeminarMahdi Fasihi [email protected]
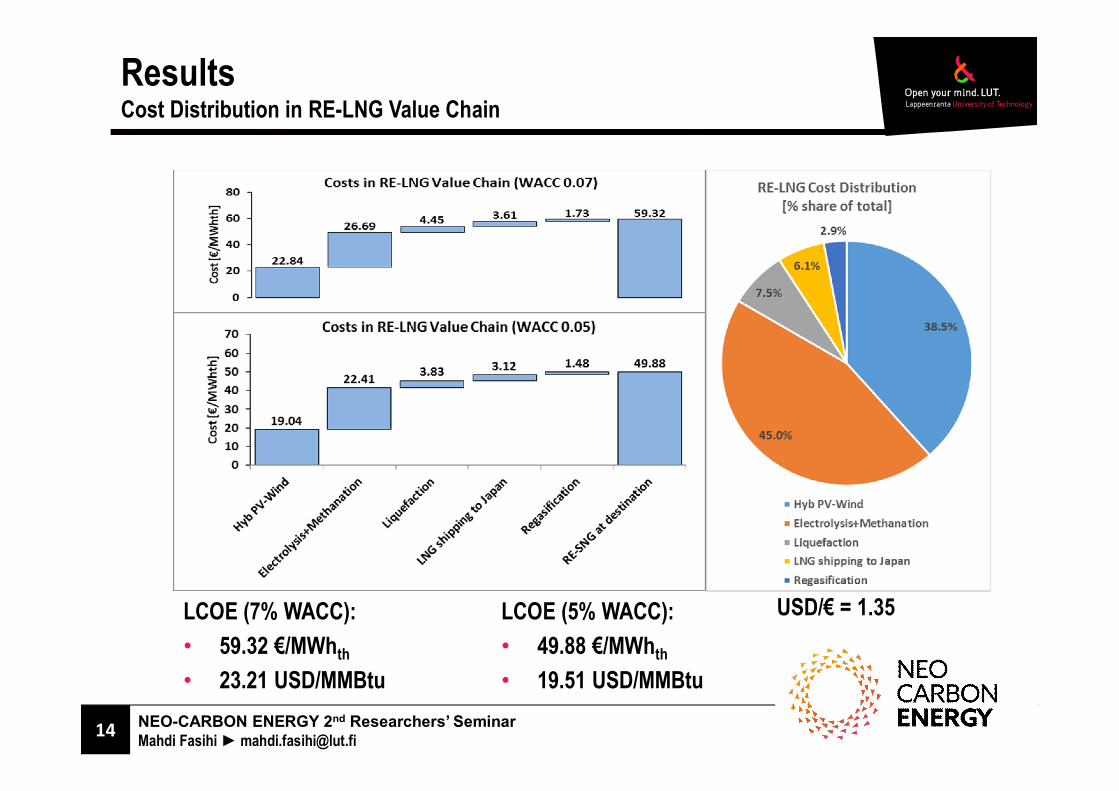
ResultsCost Distribution in RE-LNG Value Chain
LCOE (7% WACC):• 59.32 €/MWhth
• 23.21 USD/MMBtu
LCOE (5% WACC):• 49.88 €/MWhth
• 19.51 USD/MMBtu
USD/€ = 1.35
NEO-CARBON ENERGY 2nd Researchers’ SeminarMahdi Fasihi [email protected]
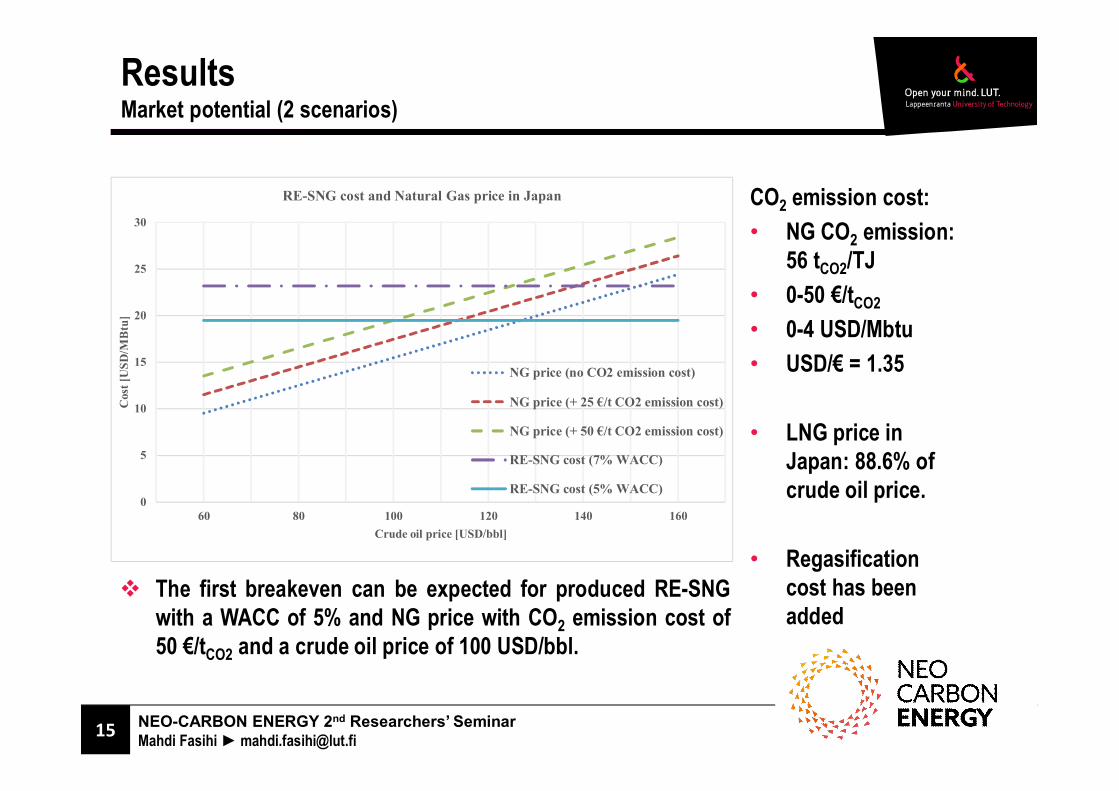
ResultsMarket potential (2 scenarios)
The first breakeven can be expected for produced RE-SNGwith a WACC of 5% and NG price with CO2 emission cost of50 €/tCO2 and a crude oil price of 100 USD/bbl.
CO2 emission cost:• NG CO2 emission:
56 tCO2/TJ• 0-50 €/tCO2
• 0-4 USD/Mbtu• USD/€ = 1.35
• LNG price in Japan: 88.6% of crude oil price.
• Regasificationcost has beenadded
0
5
10
15
20
25
30
60 80 100 120 140 160
Cos
t [U
SD/M
Btu
]
Crude oil price [USD/bbl]
RE-SNG cost and Natural Gas price in Japan
NG price (no CO2 emission cost)
NG price (+ 25 €/t CO2 emission cost)
NG price (+ 50 €/t CO2 emission cost)
RE-SNG cost (7% WACC)
RE-SNG cost (5% WACC)
NEO-CARBON ENERGY 2nd Researchers’ SeminarMahdi Fasihi [email protected]
Agenda
MotivationMethodology and DataResultsFurther StudySummary
NEO-CARBON ENERGY 2nd Researchers’ SeminarMahdi Fasihi [email protected]
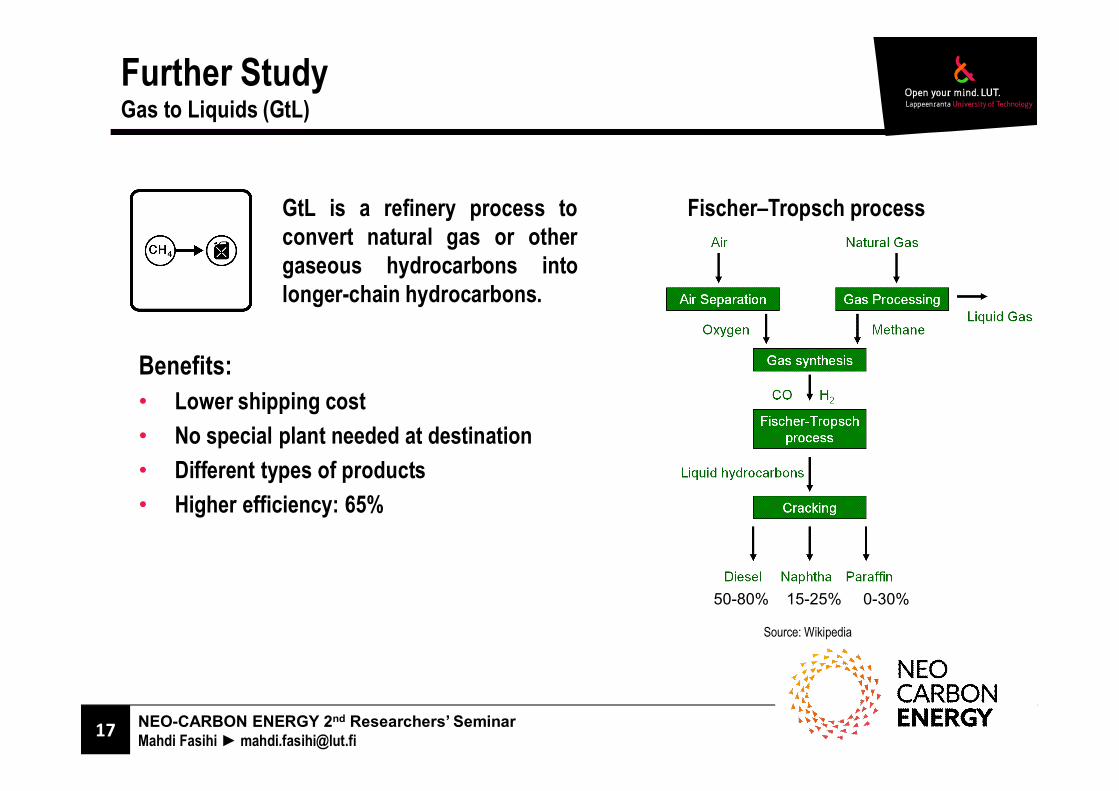
Further StudyGas to Liquids (GtL)
GtL is a refinery process toconvert natural gas or othergaseous hydrocarbons intolonger-chain hydrocarbons.
Benefits:• Lower shipping cost• No special plant needed at destination• Different types of products• Higher efficiency: 65%
Source: Wikipedia
50-80% 15-25% 0-30%
Fischer–Tropsch process
NEO-CARBON ENERGY 2nd Researchers’ SeminarMahdi Fasihi [email protected]
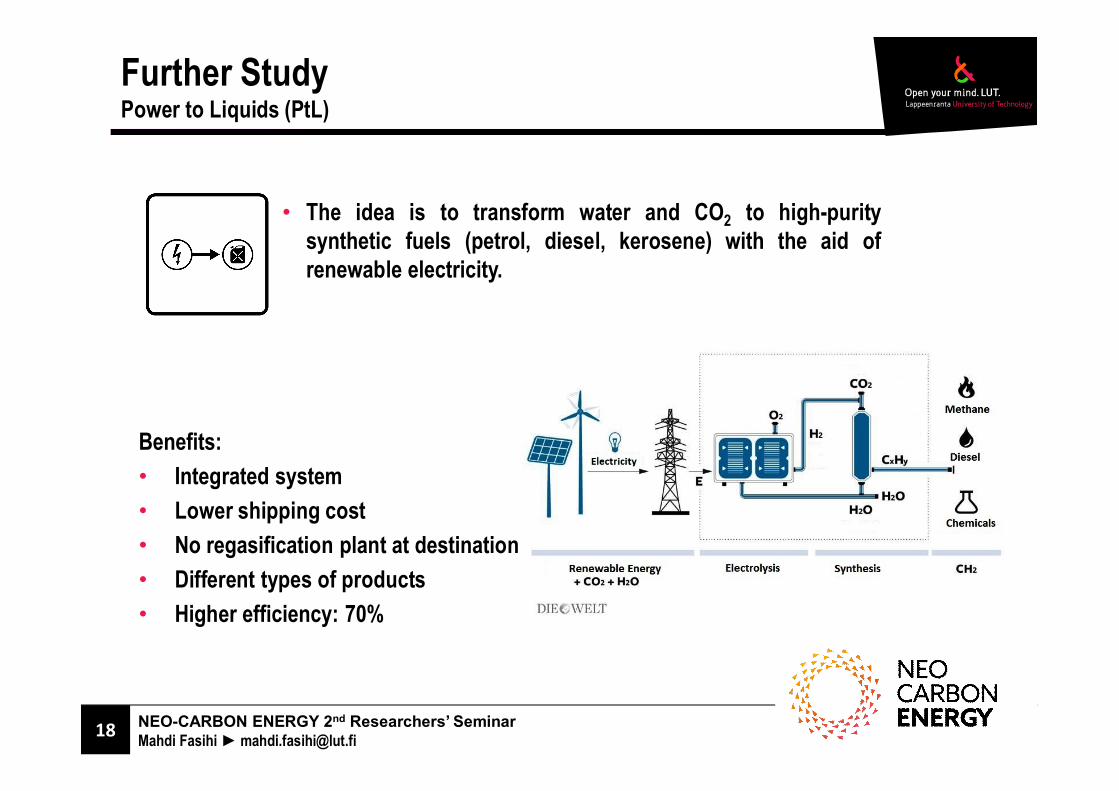
Further StudyPower to Liquids (PtL)
• The idea is to transform water and CO2 to high-puritysynthetic fuels (petrol, diesel, kerosene) with the aid ofrenewable electricity.
Benefits:• Integrated system• Lower shipping cost• No regasification plant at destination• Different types of products• Higher efficiency: 70%
NEO-CARBON ENERGY 2nd Researchers’ SeminarMahdi Fasihi [email protected]
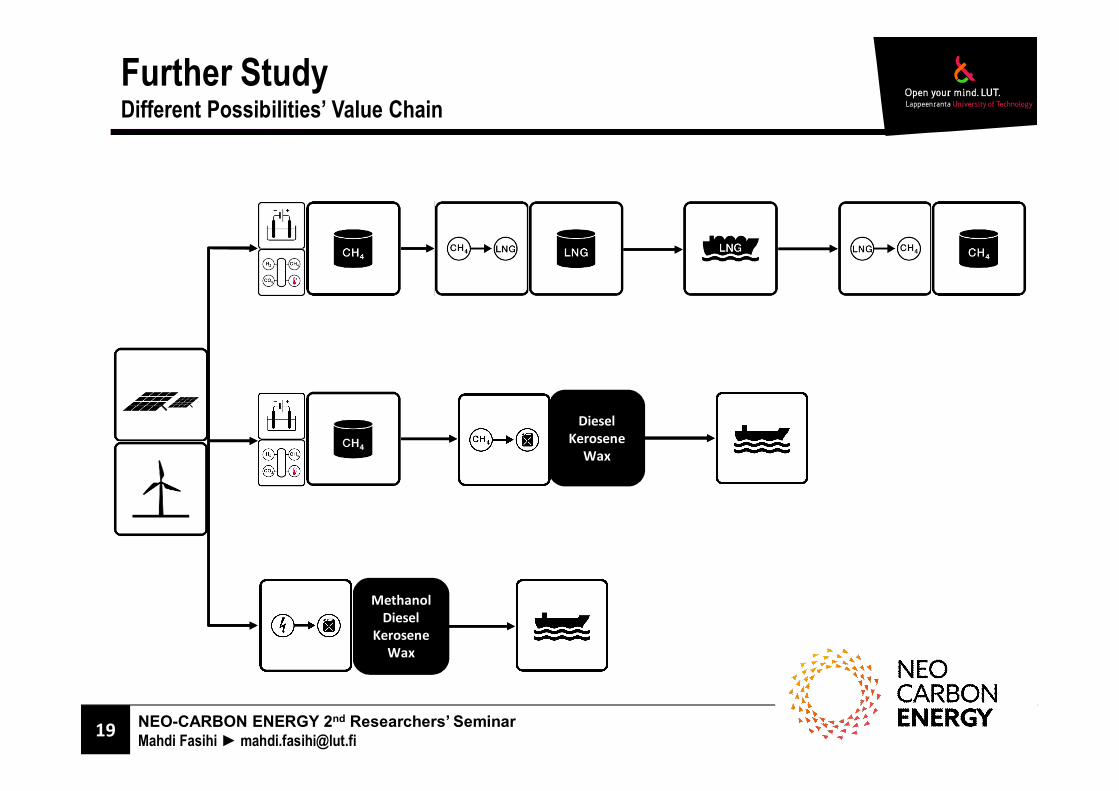
Further StudyDifferent Possibilities’ Value Chain
DieselKerosene
Wax
MethanolDiesel
KeroseneWax
NEO-CARBON ENERGY 2nd Researchers’ SeminarMahdi Fasihi [email protected]
Agenda
MotivationMethodology and DataResultsFurther StudySummary
NEO-CARBON ENERGY 2nd Researchers’ SeminarMahdi Fasihi [email protected]
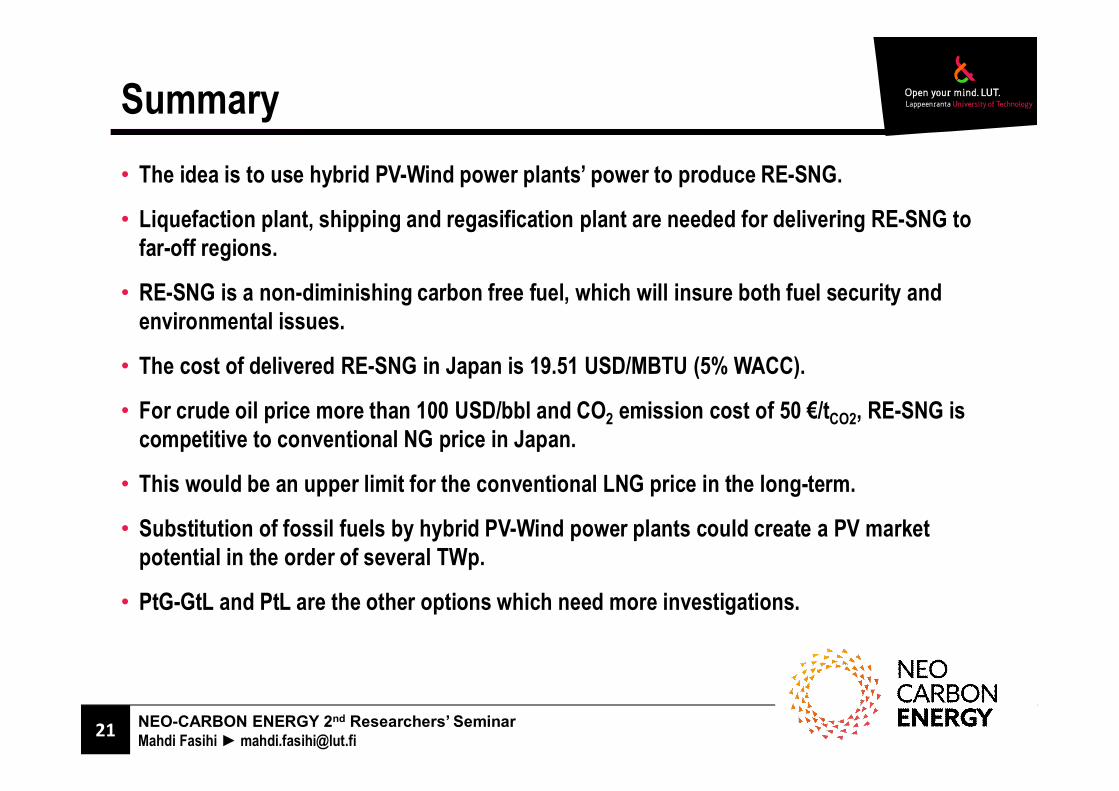
Summary• The idea is to use hybrid PV-Wind power plants’ power to produce RE-SNG.
• Liquefaction plant, shipping and regasification plant are needed for delivering RE-SNG to far-off regions.
• RE-SNG is a non-diminishing carbon free fuel, which will insure both fuel security and environmental issues.
• The cost of delivered RE-SNG in Japan is 19.51 USD/MBTU (5% WACC).
• For crude oil price more than 100 USD/bbl and CO2 emission cost of 50 €/tCO2, RE-SNG is competitive to conventional NG price in Japan.
• This would be an upper limit for the conventional LNG price in the long-term.
• Substitution of fossil fuels by hybrid PV-Wind power plants could create a PV market potential in the order of several TWp.
• PtG-GtL and PtL are the other options which need more investigations.
NEO-CARBON ENERGY 2nd Researchers’ SeminarMahdi Fasihi [email protected]
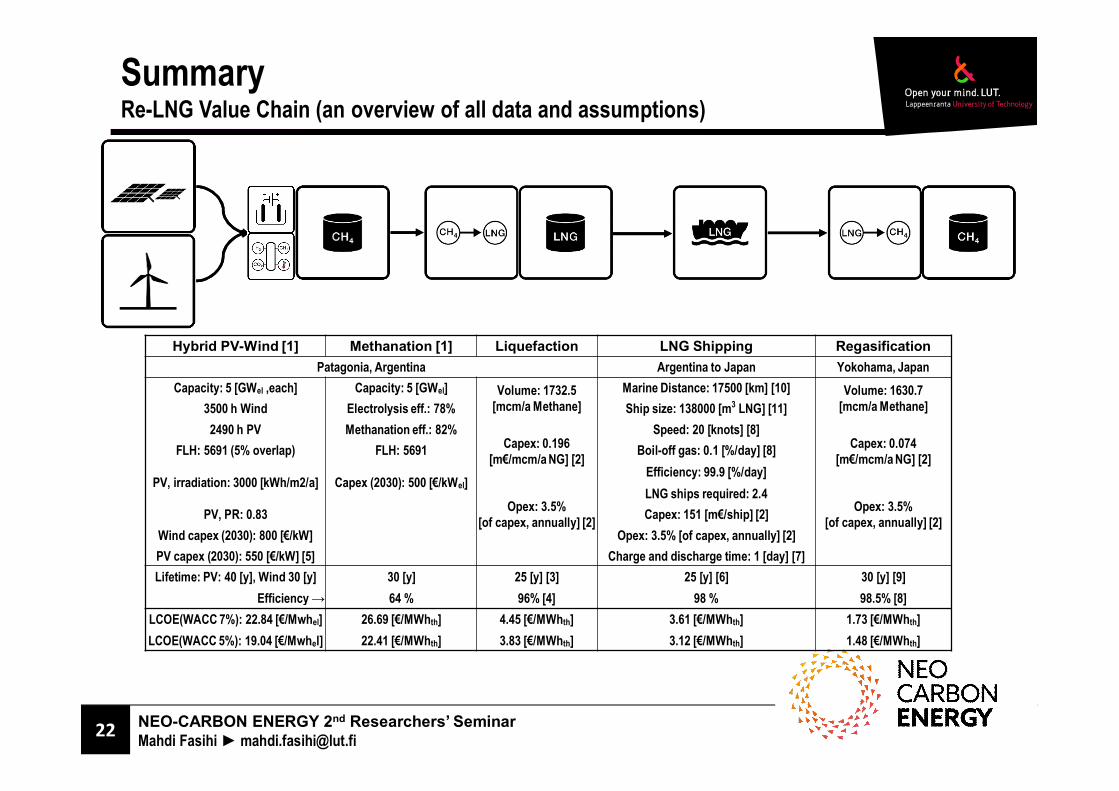
SummaryRe-LNG Value Chain (an overview of all data and assumptions)
Hybrid PV-Wind [1] Methanation [1] Liquefaction LNG Shipping RegasificationPatagonia, Argentina Argentina to Japan Yokohama, Japan
Capacity: 5 [GWel ,each] Capacity: 5 [GWel] Volume: 1732.5[mcm/a Methane]
Marine Distance: 17500 [km] [10] Volume: 1630.7[mcm/a Methane]3500 h Wind Electrolysis eff.: 78% Ship size: 138000 [m3 LNG] [11]
2490 h PV Methanation eff.: 82%Capex: 0.196
[m€/mcm/a NG] [2]
Speed: 20 [knots] [8]Capex: 0.074
[m€/mcm/a NG] [2]FLH: 5691 (5% overlap) FLH: 5691 Boil-off gas: 0.1 [%/day] [8]
PV, irradiation: 3000 [kWh/m2/a] Capex (2030): 500 [€/kWel]Efficiency: 99.9 [%/day]
Opex: 3.5%[of capex, annually] [2]
LNG ships required: 2.4Opex: 3.5%
[of capex, annually] [2]PV, PR: 0.83 Capex: 151 [m€/ship] [2]Wind capex (2030): 800 [€/kW] Opex: 3.5% [of capex, annually] [2]PV capex (2030): 550 [€/kW] [5] Charge and discharge time: 1 [day] [7]Lifetime: PV: 40 [y], Wind 30 [y] 30 [y] 25 [y] [3] 25 [y] [6] 30 [y] [9]
Efficiency 64 % 96% [4] 98 % 98.5% [8]LCOE(WACC 7%): 22.84 [€/Mwhel] 26.69 [€/MWhth] 4.45 [€/MWhth] 3.61 [€/MWhth] 1.73 [€/MWhth]LCOE(WACC 5%): 19.04 [€/Mwhel] 22.41 [€/MWhth] 3.83 [€/MWhth] 3.12 [€/MWhth] 1.48 [€/MWhth]
NEO-CARBON Energy project is one of the Tekes strategy research openingsand the project is carried out in cooperation with Technical Research Centre of Finland VTT Ltd, Lappeenranta University of Technology (LUT) and University
of Turku, Finland Futures Research Centre.
NEO-CARBON ENERGY 2nd Researchers’ SeminarMahdi Fasihi [email protected]
References
[1] Breyer Ch., Rieke S., Sterner M., Schmid J., 2011. Hybrid PV-Wind-Renewable Power Methane Plants – An EconomicOutlook, 6th IRES, Berlin, Nov. 28-30[2] Lochner S. and Bothe D., 2009. The development of natural gas supply costs to Europe, the United States and Japanin a globalizing gas market—Model-based analysis until 2030, Energy Policy, 37, 1518–1528[3] Castillo L., Dorao C.A., 2010. Influence of the plot area in an economical analysis for selecting small scale LNGtechnologies for remote gas production, Journal of Natural Gas Science and Engineering, 2, 302-309[4] Kotzot H., Durr Ch., Coyle D., Caswell, Ch. 2007. LNG liquefaction—not all plants are created equal, 15thInternational Conference & Exhibition on Liquefied Natural Gas (LNG 15), Barcelona, April 24-27[5] Breyer Ch., projections on current Tier1 PV industry cost, cost roadmaps and learning curve impact[6] Maxwell D. and Zhu Z., 2011. Natural gas prices, LNG transport costs, and the dynamics of LNG imports, EnergyEconomics, 33, 217–226[7] Bahadori A., 2014. Natural Gas Processing - Technology and Engineering Design, Gulf Professional Publishing,Oxford, pp. 591–632[8] Khalilpour R. and Karimi I.A., 2012. Evaluation of utilization alternatives for stranded natural gas, Energy, 40, 317-328[9] Neto C. and Sauer I., 2006. LNG as a strategy to establish developing countries’ gas markets: The Brazilian case,Energy Policy, 34, 4103–4114[10] www.sea-distances.org/[11] Vanem E., Antãob P., Ivan Østvikc I., Comas F., 2008. Analysing the risk of LNG carrier operations, ReliabilityEngineering and System Safety, 93, 1328-1344


