1 The Effect of Air Pollution Related Human Health Risks on Firm Financial Performance Dinah A. Koehler 1 Bernell Stone 2,3 Deborah H. Bennett 1 Gregory Norris 1, 4 John D. Spengler 1 1 Harvard School of Public Health, Boston, MA 2 Marriott School, Brigham Young University, Provo, Utah 3 Securities Exchange Commission, Washington, DC 4 Sylvatica, New Berwick, ME
Transcript
1
The Effect of Air Pollution Related Human Health Risks on Firm Financial
Performance
Dinah A. Koehler1
Bernell Stone2,3
Deborah H. Bennett1
Gregory Norris1, 4
John D. Spengler1
1Harvard School of Public Health, Boston, MA
2Marriott School, Brigham Young University, Provo, Utah
3Securities Exchange Commission, Washington, DC
4Sylvatica, New Berwick, ME
2
Abstract
Since the later half of the 1990’s there is a marked increase around the world in socially
responsible investment and regulatory action to stimulate disclosure on the environmental, social
and ethical performance of firms and pension fund managers. This study explores two keystones
of this movement: that investment directed toward social goods, such as environmental quality,
can offer financial rewards and improve the quality of life. Prior research finds that both goals
are difficult to attain given the limited market power of socially concerned investors and the lack
of clear information on the social impact of market externalities, such as the human health
consequences of hazardous air pollution. We assess whether there is an association between
public health impacts and financial returns, using estimates of toxic chemical cancer risk and
particulate matter premature mortality per $1 million value-added associated with 1998 air
emissions. Fifteen stock portfolios are constructed at varying levels of environmental
performance to assess differences in portfolio returns for stocks traded on U.S. exchanges from
1998-2002. We apply a multifactor model of asset returns and a response surface algorithm used
generally to evaluate company characteristics. We find that the level of air pollution related
public health risk has a statistically significant negative association with stock returns after
controlling for key variables that impact stock value.
3
Introduction Recent growth in Socially Responsible Investing (SRI) has been remarkable. Assets under
management in the U.S. are up 82 % from 1997 levels to $2.34 trillion.1 There are approximately
230 mutual funds in the U.S. incorporating criteria such as environmental performance, labor
policy and/or dangerous products (e.g. tobacco) into the investment process. In Europe the
number of SRI funds increased by 58% to 251 between January 2000 and June 2001 (Siri Group
2002). Important and controversial indices, such as the Dow-Jones Sustainability Index (DJSI)
and the FTSE4Good index series, were launched in 1999 and 2001 respectively. In 2001 both
the Vanguard Group and TIAA-CREF launched socially responsible index funds. While
impressive, the sector still represents a small fraction of US and European capital markets.
SRI growth has been bolstered by regulatory action that tends to fall into two categories.
First, pension fund managers are required to provide public accounts of their policies on social,
environmental and ethical practices in countries such as the UK, Australia, Germany and
Sweden. To comply fund managers are demanding that firms disclose this information. An
alternative to this type of demand side regulation, are supply side policies, such as the French
law, which require publicly quoted firms to provide information on environmental and social
impacts in their annual financial reports. This second approach is being emulated in the UK and
California, while the Massachusetts legislature is considering a version of the first approach. In
October 2002 United States Senators Jeffords, Lieberman and Corzine requested a General
Accounting Office (GAO) report on existing Stocks and Exchange Commission (SEC) corporate
environmental disclosure regulations, their implementation by the SEC, and companies'
compliance with such rules. 1 According to the non-profit Social Investment Forum , 2001 Nelson’s Directory of Investment Managers, HostedSurvey.com, an online survey firm, and the Hastings Group, a public relations firm. SIF website.
4
These developments pose a dual challenge: (i) determining socially important and
scientifically defensible SRI criteria in a transparent manner, and (ii) assessing whether they are
financially relevant. In this paper we tackle this challenge using a scientifically motivated
measure of aggregate human heath impacts of emissions of toxic chemicals and particulate
matter less than 2.5 micrometers in diameter (PM 2.5). We hypothesize that the level of air
pollution related public health risk has no statistically or economically significant impact on the
cross-section of stock returns after controlling for key variables that impact stock value.
The remainder of this chapter is organized as follows. Section 3.3 provides background
on current SRI practice and prior research in this area, followed by our hypothesis formulation.
We describe the asset-pricing model development, determination of test portfolios, matched on
key control variables, and the hypothesis tests in section 3.4. In section 3.5 we describe the
derivation of the measure of human health impact and the importance of normalizing by value
added for economic reasons. Several progressively more refined measures of public health
impact associated with pollution are assessed. These are (i) 1998 mass air emissions of toxic
chemicals (TRI), the current approach of social science researchers and the SRI community; (ii)
1998 mass TRI emissions per $1 million value-added (VA); (iii) the U.S. population cancer risk
per $1 million VA associated with these 1998 TRI air emissions; (iv) premature mortality
associated with 1998 emissions of particulate matter less than 2.5 micrometers in diameter (PM
2.5); and (v) combined TRI and PM2.5 risk per VA. We present our results and conclusions in
sections 3.6 and 3.7.
Background and Hypothesis Development SRI screens are implemented to fulfill (i) social goals and (ii) fiduciary responsibility by
investing for maximum financial return. The first objective is currently achieved with three
5
different screening strategies. Negative screens, employed by the industry leader Kinder,
Lydenberg & Domini (KLD), are designed to exclude firms involved in tobacco (96% of US SRI
funds), environmental damage (80%), gambling, weapons, alcohol, birth control (25% US
funds), and animal rights (20% funds) among others. Positive screening preferentially includes
industries perceived as less environmentally impacting, such as renewable energy. A concern
with an investing strategy based upon absolute exclusion of various industries is that this can
adversely affect the overall performance of a portfolio.
More recently, there is a concerted shift in the industry toward “best in class” screening
for financial and strategic reasons (e.g. Dow Jones Sustainable Index). This strategy includes all
major portions of the market and over- or under-weights stocks relative to an underlying index,
resulting in returns similar to that index. Key players, such as the California Public Employees'
Retirement System (CALPERS), argue that retaining stock ownership offers a strategic
opportunity to engage corporate management through active dialogue on areas of concern and
via the proxy voting mechanism. The complexity and subjective qualitative aspects of SRI is
reflected in the over 330 different criteria in 30 areas used by SRI funds to date
(MiljoekoAB/SustainAbility 2001).
To add to the complexity conundrum, critics claim that limited data availability, self-
reported data, which is difficult to audit, and lack of transparency tend to undermine the SRI
agenda (Ilinitch, Soderstrom et al. 1998; Deloitte&Touche 2000; Sturm and Badde 2001;
Taylor/Nelson/Sofres 2001). There is growing pressure to design SRI screens in a more
democratic, implicitly transparent, process combined with a certified standard in the UK and the
Netherlands. Where most stakeholder concerns are socially constructed, instead of being
scientifically evaluated (Mitchell, Agle et al. 1997), others argue that a scientific approach and
6
methodology is necessary to increase confidence in ethical screening, the assessment of its
impacts (Reich, Wolff et al. 2001) and whether the welfare of stakeholders is improved,
particularly with respect to “the environment”. Most US funds rely on publicly available
emissions databases; however they do not further screen these databases for those emissions with
maximum health impact. In fact, Koehler et al (Koehler, Bennett et al. 2003) find that industry
rankings based upon mass emissions of toxic chemicals are not representative of the public
health impacts associated with those emissions. We thus are wary of the environmental measures
used by SRI fund managers.
The vast majority of SRI funds are marketed based on their financial returns rather than
their social benefits. Most SRI analysts claim over-performance relative to traditional financial
indices, such as the S&P 500, and refer to academic research in the 1990s for additional support.
Early US research did find that portfolios selected on the basis of strong environmental
performance financially outperform and that more polluting firms were punished in stock
markets (Garber and Hammitt 1998; Karpoff, Lott et al. 1998). Several studies measure
environmental performance in terms of mass emissions from the toxic release inventory (TRI),
collected since 1987 by the US EPA from most US manufacturing facilities
(http://www.epa.gov/tri/). In each instance these studies find both a short term (Hamilton 1995;
Konar and Cohen 1997a; Khanna, Quimio et al. 1998) and long term (King and Lenox 2001)
negative market reaction to news of toxic chemical emissions.
There are, however, three important reasons for skepticism. First, omitted variable bias
tends to undermine much of the previous work. Secondly, since SRI investors hold a small
portion of all tradable assets, they tend to be price takers and thus cannot influence corporate
strategy with pricing signals on capital markets (Heinkel, Kraus et al. 2001; Koehler 2003).
7
Lastly, it is hard for funds managed by active frequent trading to outperform their benchmark
indices, because, after costs, the return on an average actively managed dollar will be less than
the return on an average passively managed dollar (Sharpe 1991).
Empirical evidence increasingly supports these concerns. Using more robust asset pricing
models researchers recently find no statistically significant financial effect of KLD screens for
the 1984-2001 period relative to their benchmark (Stone, Guerard et al. 2001), and that major US
SRI funds tended to under-perform an unscreened index between 1990 and 1993 (Bauer, Koedijk
et al. 2002). SRI fund performance is more likely to be determined by style issues (e.g. industry
and regional bias, value, growth and market capitalization) (Cerin and Dobers 2001), rather than
the social performance of its individual firms per say. Investment strategy is critical for portfolio
performance, because asset allocation accounts for a large part (over 98%) of the variability in
the financial return on a typical investor’s portfolio (Sharpe 1992). These return-impacting
variables need to be incorporated in empirical evaluation of firm characteristics, such as
pollution and its social impacts.
This research assesses whether several alternative measures of corporate environmental
performance impact the relative stock market performance of companies. In terms of a statistical
design framework, a generic null hypothesis can be stated for each alternative measure of
corporate environmental performance. Specifically, the level of air pollution related public health
risk has no statistically significant impact on the cross-section of stock returns after controlling
for key variables that impact stock value.
There are two complementary alternatives to the generic null hypothesis. First, the level
of air pollution related public health risk has no statistically significant positive association with
stock returns after controlling for key variables that impact stock value. The positive impact
8
alternative means that returns increase as pollution increases and implies a market and regulatory
failure. Companies emit pollution (impose a social cost) but earn a relatively greater return than
other companies identical in all other major return-impacting characteristics.
Secondly, the level of air pollution related public health risk has no statistically
significant negative association with stock returns after controlling for key variables that impact
stock value. The negative impact alternative means that returns decrease as pollution increases.
This has several possible interpretations and associated policy implications. One is simply that
the cost of conforming to existing pollution controls reduces the economic value of the polluting
companies so that they underperform otherwise identical companies. In this cash flow news
scenario, those pollutants that involve greater control costs relative to value created should
exhibit more negative cross-sectional return dependency, a distinction that we can explore since
we are examining two broad classes of pollutants and since we evaluate both mass emissions and
pollution relative to economic value added.
Another possible interpretation of the negative impact alternative is social responsibility,
corporate citizenship, and corporate image, due to the exclusion of certain firms from SRI funds.
However, this mechanism will be more likely once socially concerned investors control at least
20% of assets traded on capital markets (Heinkel, Kraus et al. 2001). Currently, U.S. SRI funds
control an estimated 10% or less of assets under management. Furthermore, the information used
by SRI funds is often not clearly indicative of social impacts. We believe this explanation less
likely.
A third interpretation is an “expectations effect,” e.g., the expectation that pollution will
be more regulated and/or will involve other costs such as litigation and health liability. This can
9
be determined with analysis of a time series of cross-sections over changing expectations relative
to changing regulations from 1998 to 2002.
Method The Study Design Problem In this research, we seek to determine whether varying levels of air pollution and related public
health risks impact financial returns across a sample of stocks, i.e. the cross-section of stock
returns. This generic design problem arises in analysis of any company characteristic that might
impact the stock market valuation of a set of companies. Past tests of characteristic hypotheses
generally use two approaches, (i) multivariate regression and (ii) matched-portfolio analysis of
portfolios ranked on the basis of the characteristic under study. The choice of study design is
particularly important, because matched portfolio analysis can yield different results from a
multivariate model of stock returns (Fama 1998). Both approaches have weaknesses related to (i)
measurement error, (ii) pervasive multi-collinearity and (iii) uncertainty with respect to the asset-
pricing model employed. We use a form of matched-portfolio analysis for reasons explained
below and summarize the steps in our methodology in Figure 3.1, discussed in this section.
---------------------------
INSERT FIGURE 3.1 ABOUT HERE
------------------------------
The prototypical test of a company characteristic assumes an asset pricing model, such as
the Capital Asset Pricing Model (CAPM) (Sharpe 1964; Lintner 1965) or the Fama-French three-
factor model (Fama and French 1993). A measure of the company characteristic is added, and
10
the significance of the estimated coefficient on said characteristic is tested (Campbell, Lo et al.
1997; Campbell 2000b). If R0 is the fair return and RM the return on the market index portfolio,
then the CAPM asserts that return on stock s should be reflected in its beta β:
Rs = R0 + βs (RM-R0)
Alternatively, under the Arbitrage Pricing Theory (APT) researchers propose a multifactor model
that allows for multiple priced risks. If F1, F2, … , FK represents the K priced factors, then a
multifactor model of expected return for stock s can be expressed as:
Rs = b0 + b1F1 + b2F2 + … + bkFk
Where bi is the sensitivity of stock s to factor prices Fi, i = 1, … , K. Ideally, multi-factor
analysis should build upon a well-defined univariate cross-section of stock returns, most
commonly the CAPM. Unfortunately, omitted variable bias often undermines a proposed asset-
pricing model. As a result this type of analysis is not a straightforward test of the characteristic,
but rather a joint hypothesis test of the characteristic under study and the assumed asset-pricing
model.
A common solution to model uncertainty is to include additional firm characteristics in a
multivariate regression. These characteristics can include: 1) corporate financial policy impacts,
such as financial structure, dividend policy, and growth rate; 2) corporate governance, corporate
citizenship and social responsibility; 3) management effectiveness (R & D effectiveness,
payments versus tax expense; 6) liquidity; and 7) regulatory costs. However, adding more
dependent variables uses degrees of freedom and thus erodes statistical power. Multivariate
regression approaches used to date also do not fully address concerns of pervasive multi-
collinearity and measurement error. Furthermore, the cross-sectional valuation impacts
11
associated with corporate financial policy and growth do not conform to the linear separable
model suggested by the APT. These concerns, in summary, lead us to consider stock-level
multivariate regression as inadequate for testing pollution-related public health impacts on the
cross-section of returns. Instead, we employ rank-based grouping of stocks into portfolios at
various levels of pollution-related public health impact and undertake matched-portfolio
analysis.
In this method stocks are (i) ranked on the basis of the characteristic under study, such as
a measure of pollution impact, and (ii) grouped into portfolios according to this ranking. This
initial cross-section of portfolios formed by rank-based partitioning is transformed into a cross-
section of rank-ordered portfolios that are matched on other critical return impacting variables,
such that each portfolio in the cross-section has the same value of a control (i.e. matched)
variable. Matching all the portfolios on control variables is done by shifting stocks between
portfolios. For instance, if the CAPM beta were a control and portfolio #5 had an above average
beta value and portfolio #6 had a below average beta, we could move some high beta stocks
from portfolio #5 into portfolio #6 and low beta stocks from portfolio #6 into portfolio #5.
Trial and error shifting of stocks could achieve this purpose, but can quickly become
inefficient given the innumerable possible combinations of stocks. The Mathematical
Assignment Program (MAP), using mathematical programming procedures set forth in Stone,
Adolphson and Miller (Stone, Adolphson et al. 1993) more efficiently optimizes a measure of
statistical power subject to the constraints that (i) the portfolio average value of each control
variable equal the mean over all stocks, (ii) the initial size (number of stocks) of each portfolio
be preserved, (iii) that each stock be fully assigned, and (iv) that there are no short sales (Stone
12
2003).2 The implicit assumption is that the power benefits of suppressing multi-collinearity, a
concern in rank-based grouping (Stone, Adolphson et al. 1993; Stone 2003a), offset modest
power losses from having reduced both range and within-portfolio variable homogeneity, due to
shifting of stocks across portfolios.
The benefits of grouping stocks in this manner include (i) averaging out dependent
variable measurement error to the extent that the errors within portfolios are uncorrelated, (ii)
diversifying away company-specific return variability, and (iii) possibly reducing distortion from
omitted or miss-specified dependencies on other return impacting variables if these other
variable dependencies are not correlated with the ranking variable.3
Ranking Variable: Public Health Impacts
Portfolios are formed based on rank-ordering by five different continuous measures of pollution:
(i) 1998 mass air emissions of toxic chemicals (TRI), the current approach of social science
researchers and the SRI community; (ii) 1998 mass TRI air emissions per $1 million value-added
(VA); (iii) the U.S. population cancer risk per $1 million VA associated with these 1998 TRI air
emissions; (iv) premature mortality associated with 1998 emissions of particulate matter less
than 2.5 micrometers in diameter (PM 2.5); and (v) combined TRI and PM2.5 risk per VA. Prior
research on public health impacts of U.S. industry supply chains find that direct industry impacts
associated with emissions from a sector are not representative or indicative of that sector’s total
supply chain impacts (direct + upstream) (Koehler, Bennett et al. 2003; Nishioka, Levy et al.
2 Preserving initial portfolio size and full use of each security are technical constraints that go with full use of the sample. Prohibiting short sales prevents one return observation from canceling out other return observations, which can distort the sample. 3 The phrase “possibly reducing distortion” is an important part of the possible benefits. As is well-known in the econometrics of measurement error reduction (see for example Grundfelt (1984), grouping may magnify multi-collinearity and other specification problems.
13
2003). Therefore, we prefer to use total supply chain public health impacts to more
comprehensively represent the social impact of an industry’s economic activity.
As suggested by Freeman (1984), one way to determine social goods is to determine the
costs of social damage relative to the benefits of industry production. Koehler et al (Koehler,
Bennett et al. 2003) use value-added (VA) as a measure of economic benefit to normalize public
health damage. The aggregate of all VA in the U.S. is gross domestic product (GDP). Other
researchers have used revenue or market capitalization to control for differences in firm
economic scale (Banz 1981; Fama and French 1992; Fama and French 1993; Konar and Cohen
1997c). To compare between firms and industries, value-added is clearly more pertinent than
traditional financial measures based on market capitalization, the balance sheet and income
statement, which can be distorted by use of debt financing (i.e. financial structure) and are
subject to market sentiment.
Human exposure to TRI emissions and to PM2.5 can be estimated with the intake
fraction, defined as the total potential human dose as a function of total exposure relative to the
source term (Bennett, McKone et al. 2001). The intake fraction is multiplied by linear dose
response and concentration-response functions of human health hazard for TRI and PM2.5
respectively to estimate excess cancer cases and premature mortality (Koehler, Bennett et al.
2003; Nishioka, Levy et al. 2003). The concentration-response function underlying PM2.5
premature mortality predicts annual adverse outcomes due to respiratory ailments and lung
cancer that are specific to an emissions year. Thus, 1998 emissions are associated with 1998
premature deaths. To estimate cancer risk associated with TRI emissions, on the other hand,
human exposure to pollutants is averaged over a 70-year biological lifetime to which a dose-
response function is applied. It is impossible to say with certainty (i) when that cancer case will
14
occur over the 70-year exposure duration, and (ii) whether the cancer type is fatal or not. The
simplest approach would be to assume a uniform distribution of excess cancer cases for the US
population over 70 years and 100% mortality. Assuming a uniform distribution Koehler et al
(Koehler, Bennett et al. 2003) estimate that 1998 emissions of a subset of carcinogenic TRI
compounds yield 260 excess cancer cases.
Assuming 100% mortality for excess cancer cases is one possible manner to calculate an
aggregate public health index that combines cancer risk of TRI air emissions and premature
mortality associated with PM2.5 emissions. In so doing we combine outcomes (death), rather
than incidence of disease. This approach is plausible if premature mortality from PM2.5
emissions per unit of economic benefit is greater than TRI cancer risk per unit of economic
benefit. In fact, the average 1998 risk of premature mortality is 6 x 10⁻² per $1 million 1998
value added, which is greater than the average annual cancer risk, 1.4 x 10⁻⁴ per $1 million 1998
value added, as consistent with earlier analyses (Abt-Associates, ICF-Consulting et al. 2000;
Woodruff, Caldwell et al. 2000). Should estimated TRI cancer risk be greater than estimates of
PM2.5 premature mortality in a particular year in future analyses, additional refinement to reflect
the fact that many cancers are treatable and thus nonfatal is possible using 5-yr survival rates for
cancer (Rowe, Lang et al. 1995; Koehler, Bennett et al. 2003). This question of comparability
between cancer risk and PM2.5 mortality arises in only one of our cross-sectional dependency
assessments, namely where we use an aggregate measure of human health impact.
Return Impacting Variables
While the APT extends systematic risk modeling to multiple factors, i.e. return-impacting
variables, it is silent on what variables characterize the factors or even how many factors there
15
should be. For this reason, researchers concerned with going beyond the CAPM to a multi-factor
model of asset prices have moved to using “specified factors” of risk shown empirically to
impact stock returns. The Fama-French three-factor model is one such specified factor model
that has received wide acceptance in recent empirical research.
Research suggests that tax and corporate financial policy variables could be priced, e.g.
earnings yield, dividend yield, financial structure and effective taxes (Stone and Miller 2002;
Stone 2003b; Stone and Adams 2003d). Thus, to be sure that our control set is complete, we add
additional variables to the Fama-French set, listed in Table 3.1. This list of potential return-
impacting variables is a more comprehensive, but not exhaustive, set of explanatory variables
than those generally used in cross-sectional tests of firm characteristic hypotheses. Our concern
in this research is completeness of the set of return impacting variables to ensure that our health
impact measures are not indirect measures of other priced factors.
----------------------------
INSERT TABLE 3.1 ABOUT HERE
------------------------------
The primary return observation period is from 1998 to the end of 2002, a time period that
includes two up-market years (1998 and 1999), the end of the bull market (March 2000) and a
subsequent down market (including the roller coaster around September 11, 2001). Likewise, it
includes above average economic growth, a recession and below-average-growth post recession
recovery. Finally, this is a period of monetary tightening and rising interest rates, followed by
16
sustained rate reductions by the Federal Reserve Board. In summary, this sample period
encompasses a market cycle, interest rate cycle and business cycle and is well suited for
averaging out any market, macro or interest-rate effects that may be cross-sectionally related to
pollution measures. Indeed, analysis of this time period may be representative of long-run
impacts associated with measures of corporate pollution.
Stepwise Use of Mathematical Assignment Program In our approach we rank industries by a 1998 measure of pollution and assign stocks to each
industry using Standard Industry Classification (SIC) codes. Stock portfolios are formed based
on this pollution ranking. By using available 1998 pollution and public health impacts we
implicitly assume that pollution rates do not change significantly enough from 1998-2002 to
affect industry rankings.4 Ideally, this analysis should use annual 1998-2002 pollution data.
The MAP is applied in each sample year to reflect important changes in available
company financial data. In particular, control variables such as EY, DY, MV, FS and
profitability measures based on earnings exhibit high year-to-year volatility, which would effect
rankings. Using a single year of financial data or simply the average over all five study period
years would not guarantee that portfolio composition is representative of control variables.
Therefore, to optimize the financial data available, portfolio composition is adjusted to reflect
annual changes in these control variables, while maximally preserving the initial pollution-based
ranking. However, we adopt the Fama-Macbeth (Fama and MacBeth 1973) finance paradigm
and compute five-year average returns for each portfolio and for each of the five models
4 Regulation driven changes in reporting and pollution measurement techniques can induce differences in pollution levels that are not necessarily correlated with changes in production levels or technologies.
17
explained below. In this manner we mitigate statistical biases due to cross-temporal dependence
of firm financial data and measurement error in control variables.
The realized returns are regressed on the log-transformed pollution measures for each
model. The control variables listed in step 2 of Figure 3.1 are imposed in a step-wise fashion to
permit evaluation of how controlling for a particular variable or variable combination impacts
the five-year returns. We incrementally add control variables, starting with Model 1: no control
variable restrictions, the approach used by Clough (Clough 1997) to evaluate two portfolios
ranked by environmental performance measures and SRI funds claiming outperformance relative
to an index, such as the S&P500. Model 2 is the traditional CAPM model, a univariate model of
risk. Model 3 adds two risk controls (book-to-market and market capitalization) to the CAPM as
per the Fama-French three-factor model.
Model 4, a seven-factor model, includes corporate financial policy and tax-based
valuation effects (EY, DY, FS and ET). The combination of EY and DY controls for dividend
policy effects, which includes the differential taxation of gains and dividends and any risk
differences between gains and dividends. FS controls for financial structure (financial leverage)
valuation impacts. Adding EY and DY to the already imposed B2M variable tends to control for
future growth potential as measured by one-period sustainable growth (SUG) (Stone 2003a;
Stone 2003b). The effective tax rate (ET) has been shown by Stone and Adams (Stone and
Adams 2003d) to be an economically and statistically significant cross-sectional return variable
even after controlling for the both Fama-French risk factors and the corporate financial policy
characteristics (EY, DY, FS). This seven-factor model should adequately control for major
drivers of stock returns, such as those factors determine to underlie the DJSI performance (Cerin
and Dobers 2001).
18
Further to these control variables, in Model 5 we conduct sensitivity to additional
variables of firm profitability to check for completeness. The listed variables (ROI, SI, and AM)
are textbook accounting ratios, shown by Stone and Miller (Stone and Miller 2002) to have a
significant long run cross-sectional impact on stock returns. Our concern is not to assess the
economic mechanisms by which profitability is incorporated in stock returns. Rather our concern
is to use accounting profitability ratios as control variables to ensure that our ranking variable
(public health impacts) and other control variables are not instruments for cross-sectional
profitability. These firm level profitability variables should also control for variability in industry
value-added. To understand this, recall that profitability measures are a function of net income,
i.e. revenue minus labor and material costs and taxes. Value-added is the residual after all
material inputs to production are subtracted from industry level output, explained below.
Profitability measures and value-added are likely to be correlated, and thus normalizing public
health impacts by value-added may introduce a cross-sectional distortion in realized company
profitability. However, sales intensity (SI: the sales per dollar of total investment) and average
margin (AM: operating earnings per dollar of sales) tend to control for such industry-sector
effects.
Data
Estimated public health risks associated with 1998 TRI and PM2.5 emissions are drawn from
Koehler et al (Koehler, Bennett et al. 2003) and Nishioka et al (Nishioka, Levy et al. 2003)
respectively and are normalized by value-added. In this analysis value-added (VA) refers to the
non-industrial (i.e. non-commodity) inputs to production, such as labor and capital, that
comprise the U.S. GDP (Lawson 1997). VA is broken into three component parts: (i)
19
compensation of employees, (ii) indirect business tax and nontax liability and (iii) other value
added. The first two are estimated based on data from the National Institute of Pension
Administrators (NIPA), the Bureau of Labor Statistics, Bureau of Census, Office of Management
& Budget and the U.S. Dept. of Treasury. “Other value added” relates to additional non-material
inputs to production, such as corporate profits and consumption of fixed capital.
Financial data for 1998-2002 are from CRSP for financial returns and Compustat for
financial statement databases for a sample of 1748 firms for which financial data were available
over the entire five-year study period.5 By using firm level financial data to evaluate portfolios
based upon industry level health impacts, we assume that publicly traded firms are representative
of each industry group in terms of average pollution and average financial characteristics.
Analysis of data used by King and Lenox (King and Lenox 2001) shows that 50% of TRI
reporting facilities are owned by a publicly traded parent, and in 1997 these accounted for 67%
of all releases. The important assumption is that any differences between public and private firms
are not systematically related to pollution, and that they can sufficiently be diversified across
portfolios. In other words, by excluding privately owned firms from this analysis we do not
induce an effect of pollution on returns. 6
Results In Table 3.2 we list the top ten industries ranked by total supply chain public health risk to
illustrate the difference between current ranking approaches based on mass TRI emissions and
5 This sample results after eliminating all records that had missing observations for any of the control variables and financial companies sic codes 6000-6999 and those with incorrect shares. 623 were lost due to missing returns between 1998-2002. 6 We note that private firms may be less likely to submit to public pressures or concerns with image than publicly traded firms. This is possible in the aluminum industry, where one privately-owned firm, the Ormet Corporation, has until recently continued to emit high levels of a very toxic air pollutant despite regulator and community pressure.
20
health based rankings. These rankings are also the starting point for formation of stock portfolios
used in this analysis. An industry’s ranking is a combination of (i) high emissions of hazardous
air pollutants or (ii) low value-added. Thus industries with low value added, such as canned and
cured fish and seafoods rank high in terms of PM2.5 health impacts per VA. Alternatively, the
cement industry has a high value added, but ranks highly because it emits large amounts of
dioxin, a very toxic class of compounds. Several industries show no direct TRI air emissions,
because they are not required to report to the TRI or simply do not emit these air pollutants, but
still pose a public health risk over their entire supply chains.
We note that cancer risks are concentrated in two industries, cement and primary
aluminum, and that a large number of industries have very low emissions. Thus the distribution
is skewed. Log transforming the pollution measures to obtain a better distribution for partitioning
the sample and for cross-sectional regressions of realized returns is an important methodological
step. For similar reasons, we log transform the distribution of premature mortality risks
associated with PM2.5 emissions. For purposes of assessing impact on stock returns we use total
supply chain health impacts, which is a more complete measure of social impact. Additionally,
this has the statistical benefit that these distributions are less skewed.
------------------------
Insert Table 3.2 about here
21
-----------------------------
Finally, the supply chain health impacts associated with PM2.5 emissions are greater than
TRI emissions cancer risk in the aggregate human health index, which is reflected in the
consistency of rankings by total supply chain impacts in the last four columns of Table 3.2. We
find the same high correlation between total log PM2.5/VA and combined total log TRI and
PM2.5 risk/VA for the entire database (Spearman’s ρ =.99, p<.001). This result, however, should
not be over-interpreted. The cancer risk estimates used are based on 116 chemicals and
compounds, selected specifically on the basis of extent of available scientific information from a
possible set of over 650 listed in the TRI. In fact there are several 10,000s industrial chemicals in
commerce today. Furthermore, Koehler et al (Koehler, Bennett et al. 2003) omit non-cancer risks
associated with exposure to toxic chemicals in the TRI, such as developmental and reproductive
damage, which should be incorporated into a per industry sector aggregate health index.
Therefore, the cancer risk estimates used here underestimate potential levels of public health risk
associated with the use, production and emission of toxic chemicals.
Regression results of different measures of log-transformed pollution and different
models are shown in Table 3.3.7 We find that the dependence of portfolio returns on log direct
mass emissions is negative, but not statistically significant. This negative relationship is
consistent with prior analyses of the TRI effect on market returns (Hamilton 1995; Konar and
Cohen 1997a; Khanna, Quimio et al. 1998; King and Lenox 2001), but differs in that we find no
real significance in this time period for all models, shown in Table 3.3. Mass log TRI emissions
7 By applying a univariate regression model to log pollution measures we may affect regression results. A monotonic transformation, taking logs will increase the dispersion of pollution measures, magnifies low pollution industries and dampens high polluting industries. Thus log-transformation reduces the overall effect of our pollution measures. However, most importantly in rank-based portfolio analysis as used here, log transformation preserves industry and firm rankings by pollution measure and allows us to more easily create portfolios. Use of a log-transformed pollution measure is more a concern when combining several terms in multivariate regression; another reason we prefer rank-based portfolio analysis.
22
corrected for economic scale with value-added also has no significant statistical association with
average five-year returns for all models. However, for a measure of log total supply chain cancer
risk associated with these mass emissions per $1 million VA Models 4 and 5 show a strong
statistical association with average five-year returns in this time period. The same is true for a
measure of log total supply chain PM2.5 premature mortality per $1 million VA and the
combined log health risk of TRI and PM2.5 emissions per $1 million VA.
--------------------------
INSERT TABLE 3.3 ABOUT HERE
------------------------------
Secondly, the results in Table 3.3 demonstrate that model choice with respect to
multifactor asset pricing matters. Neither the conventional CAPM nor the Fama-French three-
factor model is sufficient to isolate public health impacts of pollution from other return
impacting variables. Generally, results indicate that the more comprehensive Models (4 & 5)
yield highly statistically significant coefficients for pollution measures that reflect their public
health risks. To illustrate, note that the measure of log total supply chain cancer risk associated
with TRI air emissions per VA with no constraints has a slope coefficient of –0.23 (t = -1.98, p =
.06). Matching the portfolios on beta in Model 2 reduces the estimated coefficient and t-value,
indicating a negative correlation between log total supply chain TRI risk/VA and beta. The
23
Fama-French three-factor Model 3 shows a similar impact, but is still not statistically significant.
One explanation for the small difference between Model 2 and Model 3 estimates could be that
normalizing our measures of pollution impact by value-added, an economic size measure, also
tends to control for market capitalization, a common measure of firm size.
Using the seven-factor model increases the magnitude of the slope coefficient at a
significant t-value, with R2 rising to .66. The profitability correction increases the magnitude of
the negative slope coefficient, but decreases the significance of the estimated dependence. There
is clearly a significant interaction between pollution impacts and the four variables that jointly
correct for tax and financial policy impacts, including sustainable growth. Both the seven-factor
and the full ten-factor Models show a significant negative return dependency on log total supply
chain TRI risk/VA. The slight improvement in model fit (R2) between Model 4 and 5 indicates
that our seven-factor model adequately controls for major return impacting variables.
The impact of log total PM2.5 premature mortality per VA and for the combination of log
total supply chain TRI and PM2.5 public health risks per VA are similar to the case just
described. However, in Model 5 the addition of four profitability controls increases both the
magnitude and the significance of the dependency in both cases. This is likely due to a positive
interaction between PM2.5 impacts and measures of profitability.8
The similarity in slope coefficient between log PM2.5 and the combined log TRI and
PM2.5 measure is not surprising, since PM2.5 impacts, as calculated, are numerically larger.
This is possibly an artifice of scientific uncertainty of the human health impact of many toxic
chemicals not included in this measure of TRI cancer risk. In addition to showing a similar
8 The fact that we do not find a similar increase in the coefficient and significance of the cancer risk associated with TRI emissions per VA is likely due the high concentration of these risks in a few industries, cement and primary aluminum. Though it is notable that these effects did not disappear after we excluded these industries in sensitivity analysis, indicating that the underlying trend is robust. Risks of PM2.5 are more dispersed across all industries, as this is a common hazardous pollutant. Therefore, PM2.5 portfolios are more mixed than TRI portfolios.
24
pattern in response to application of incrementally sophisticated models, the slope coefficients
for PM2.5 and the aggregate public health index are the same, namely –0.31. Our confidence in
these estimates is bolstered by an increasing F-value and R2 with each additional set of control
variables in the analysis.
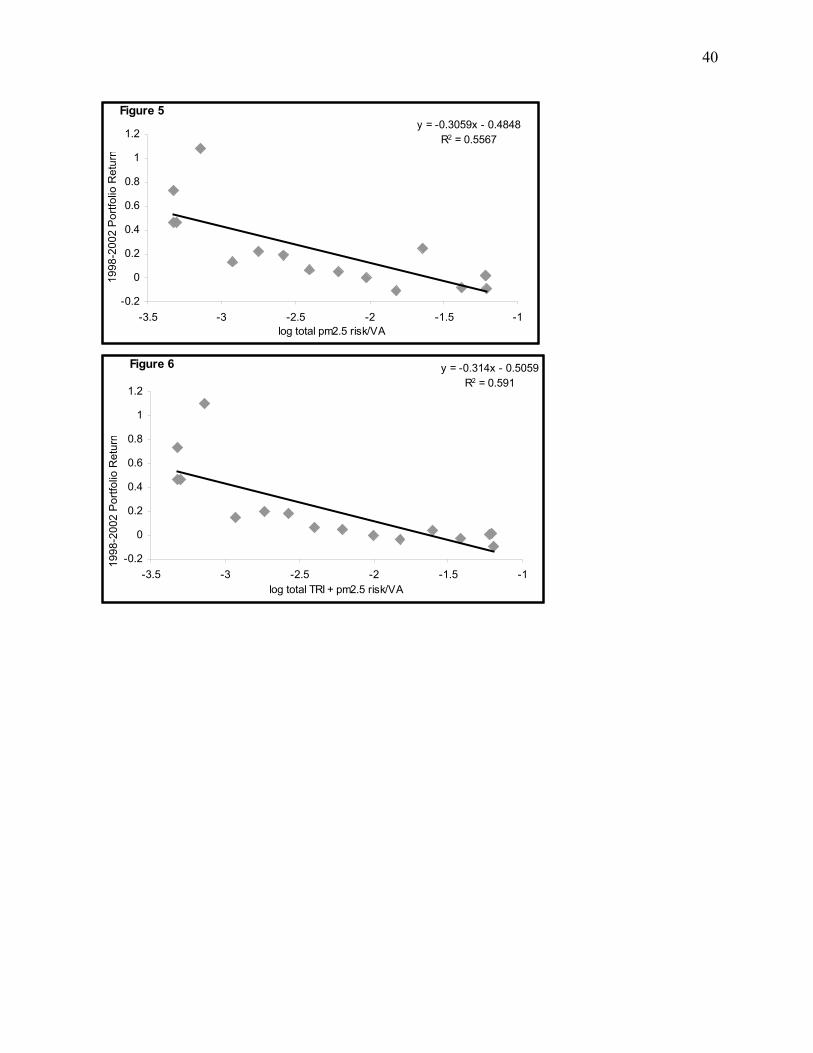
Figures 3.2 - 3.6 depict the five-year average return cross-section for each pollution
measure for the full set of controls in Model 5. Clearly, a measure of log mass TRI emissions has
no significant effect on average five-year portfolio returns from 1998-2002. The last three plots,
showing the return impact of log total supply chain TRI cancer risk per VA associated with the
same mass emissions presented in Figures 3.2 and 3.3, suggest that returns decrease as human
health risks associated with pollution levels increase. A similar negative trend can be seen for log
total supply chain PM2.5 premature mortality per VA and the aggregate log total supply chain
public health impact per VA. Three firms in the video rental industry, which experienced
between 400 and 800% returns in this time period, drive the extremely high return of the third
low polluting portfolio from the left in all three figures. Part of the multi-media communications
wave, big players such as Enron entered the industry expecting to profit from internet based
video distribution during the last leg of the internet bubble in 1999. The relatively higher return
of the most polluting portfolio in Figures 3.4-6 are likely to be driven by pharmaceutical and
specialty chemical firms that tended to experience higher returns in this time period.
---------------------------
INSERT FIGURES 3.2 – 3.6 ABOUT HERE
25
---------------------------
Sensitivity Analysis We test sensitivity with respect to (i) industry effects, (ii) extreme returns, (iii) omitted variable
effect: growth & R&D, and (iv) a shorter study time period. A reasonable question given the
high concentration of pollution in certain industries, especially old-line industries, is whether we
are observing an industry effect. We therefore exclude the cement and aluminum industries,
which reduces the effect of TRI risks on returns, induces a small change in t-values, but
preserves the general negative slope shown in Figure 3.4. Additionally, we exclude industries
with high concentration in the top and bottom 20% of TRI risk portfolios and find that results are
insensitive to these exclusions.
To reduce the effect of extreme return values we prune our firm sample at the extreme
5% of high and low returns and re-apply Model 5. Screening out extreme returns smoothes the
cross-section and increases both t-values and f-values and the R2 of Model 5. Finally, when just
the rental video industry in the third portfolio from the left of figures 3.4-3.6 is excluded, t-
values and R2 increase. One explanation for finding no significant industry effects is because the
measures of profitability, especially margin and sales intensity, tend to control for industry
differences. In summary, we do not believe our results are a function of an industry effect.
We also evaluate sensitivity of our results to measures of growth. Recall that the
combination B2M, EY and DY in Models 4 and 5 control for one-year sustainable growth;
defined as growth that can be financed from internally generated funds, such as retained
earnings, without issuing new stock. However, a one-year growth measure may not be good
26
measure for long run growth, especially for a cyclical company. Adding additional five-year
sales and three-year sustainable growth produces no significant change in either the Model 4 or
Model 5 cross-sections.
Prior research finds a significant negative correlation between research & development
(R&D) and measures of mass TRI emissions (King and Lenox 2001). We similarly find a
negative correlation between mass TRI emissions and R&D for our sample. However, including
R&D as an additional control to Model 5 reduces our firm sample by up to 700 firms, due to
missing R&D data in Compustat. Once all profitability measures are included, R&D does not
have a significant effect on the cross-section of returns in this scaled down sample. The finding
that pollution interacts with R&D in prior research may arise from R&D being an instrument for
profitability differences; an issue requiring further study. The key point here is that R&D is not
the source of the significant return effect related to pollution measures.
Finally, when three-year (1999-2001) average returns are used results are unchanged.
Analysis of individual years exhibit more noise, indicating the importance of considering market,
interest rate and business cycles.
27
Conclusions In this research we have examined a series of different measures of pollution, some inform on
the public health impact, some do not. For a pollution measure based on mass emissions there is
little impact on rank-based portfolio returns. We find the same result for a measure of mass
emissions per value-added. In contrast, converting mass emissions into a measure of public
health impact over industry supply chains scaled by value-added produces a strong negative
cross-sectional return dependency for impacts associated with TRI emissions, PM2.5 emissions
and the combination of both. With these measures, we reject the null hypothesis and accept the
negative alternative at high levels of statistical significance.
Using this measure of pollution impact per value-added differs substantially from current
SRI practice and most prior research. Exclusion of entire industry sectors, such as tobacco or
weapons manufacturers has yielded mixed results based upon the direction of the market. During
the up-market between 1992 and 1997 these indices and funds outperformed the average market
index, due to more investment in “less” polluting firms in the high technology or service
industries. While during the more recent market downturn, these indices and funds have
underperformed the average market index. Our results appear robust to market cycles, and
underlying interest rate or business cycles. However, additional study years would be necessary
to determine this more fully. This study shows that a scientifically motivated measure of
corporate environmental performance that represents both a societal and an economic impact of
industrial activity can be derived and is promising for socially responsible investing. We note
that this type of continuous variable is much better suited to cross-sectional return analysis than
SRI approaches which exclude entire industries from the possible investment set.
28
We furthermore find that methodology affects findings. Prior researchers have struggled
with multivariate regression, which as noted here, does not easily permit control of
multicollinearity of variables and measurement error. To address these concerns we introduce
more controls into our model, control multicollinearity with matched-portfolios, and diversify
measurement error by using portfolios. With this approach we have avoided many of the
weaknesses in methodologies used in the literature to date. Furthermore, our sensitivity results
show that results are robust to outliers along both the pollution spectrum and returns spectrum.
Given prior research and knowledge of competitive-efficient markets we expected that
public impacts of pollution would not be incorporated in the cross-section of returns. The
contrary result is a surprise, and an economic interpretation of the empirical results found here is
more difficult. The effect on financial returns may be measurement induced or a function of the
method employed. In fact, Fama points out that even slight changes in methodology may induce
a different effect on cross-sectional returns (Fama 1998). Ideally, we should expand the analysis
to incorporate more data years, and additional market cycles in particular, to ensure that this is
not an artifact of the study time period.
The negative market reaction to this information may be due to (i) investor’s interpreting
high hazardous air emissions to imply high future control costs due to regulation, (ii) a low
value-added relative to other industries, or (iii) a combination of both. We discuss the
environmental regulation scenario first. While we cannot expect investors to be aware of the
public health impacts associated with emissions of specific pollutants, it may still be possible
that investors are aware of regulation of industries that emit these specific pollutants. In fact, in
the late 1990’s the most hazardous TRI compounds included in this analysis, dioxins and
polycyclic aromatic hydrocarbons, have been the focus of industry specific regulation that
29
implies control costs. Industries, such as aluminum and cement, that emit these pollutants have
been regulated in 1997 and 1999 respectively, and need to comply with stringent Maximum
Achievable Control Technology (MACT) standards that limit emissions from both new and
existing facilities.
Similarly, ambient air PM2.5 concentrations are regulated under the National Ambient
Air Quality Standards (NAAQS) promulgated in 1997. PM2.5 regulation will have the greatest
impact on the east and west coasts of the U.S. which are plagued by a contiguous haze that has
significantly increased from 1960 to 1990. The impact of PM2.5 regulation is likely to be
greater, because secondary particles known to be hazardous to human health can be formed with
ammonium sulfate and ammonium nitrate. Reducing PM2.5 concentrations will thus also involve
regulation of sources of sulfur dioxide, nitrogen oxides and ammonia (USEPA 1998). These
regulations in combination are likely to have an effect on future firm cash flows related to
anticipation of pollutant related control costs. Such an expectations effect, measured over five
years, could be an event if it were clear when costs will occur, or an ongoing revision of
expectations with respect to pollution news should the cost impact be uncertain. The latter is
possible with implementation of the PM2.5 ambient air concentration standard, which while
promulgated in 1997, has been challenged in court and thus delayed its implementation.
Another plausible explanation is that investors are not attracted to industries with low
value-added and generally low expected cash flows, which may be more likely for firms using
old polluting technologies. Our measure of environmental impact may in fact be a proxy for age,
or “vintage.” It is possible that for this firm sample effective tax (ET), a cash flow measure of tax
impact, may be a control for “vintage.”9 ET may nevertheless be an insufficient control for a
9 A relatively higher ET during this time period would arise due to a relatively lower depreciation expense, which is related to the average age of facilities in that industry. With the use of accelerated depreciation a firm can write-off
30
vintage effect, and thus our pollution measure may be picking up some of this effect.
Alternatively, investors may be reacting to information embodied in the measure of value-added
used here to reflect differences in economic size. However, ROI will tend to control for cross-
sectional variation in value-added. Thus value-added should not be a primary source of cross-
sectional dependence on a measure of public health impact after Model 5 controls are imposed,
though this question merits further research.
In sensitivity analysis both the cement and aluminum industries were excluded, as major
contributors to public health risk associated with both TRI and PM2.5 emissions. Excluding
these industries did not affect the overall results. However if there are more troubled companies
at higher levels of pollution, there might be an economic explanation for this effect. For example,
Kaiser Aluminum Corporation, an integrated aluminum producer, and Lafarge North America
(LAF) one of North America's largest building materials manufacturers, which also produces
cement. Both companies have suffered financially during this study time period. Kaiser
Aluminum Corporation filed for reorganization under Chapter 11 of the United States
Bankruptcy Code on February 12, 2002. Similarly in the cement industry, Lafarge has also been
suffering under the weak economy, seasonal cycles and higher pension expenses
(biz.yahoo.com). Thus, the pollution related public health impacts studied here might be a proxy
for additional firm variables. If we find this to be the case for more firms emitting high levels of
the most toxic chemicals, then we might be able to conclude is that a measure of public health
impact will isolate firms with low financial performance.
It is conceivable given this analysis that a pollution measure based upon public health
impacts per $1 million value-added appears to isolate industries and firms that are unattractive to
more costs in the early years of a facility, versus a firm with older facilities, which cannot write-off as much and hence pays higher taxes.
31
the average investor. Thus pollution may be a proxy for other economic effects, besides pollution
control costs, such as declining old-line firms with low rates of capital investment and other firm
characteristics, which remain unexplained in this analysis. This may be true for cement and
aluminum firms, but not so for more attractive firms in the pharmaceuticals industry, which are
also well represented in the high polluting portfolios. While we do not believe that the
relationship can be attributed to the multiple firm characteristics included as controls in this
analysis, this finding merits deeper analysis of the underlying causes for the negative association
between financial returns and the measures proposed here. To synthesize, we have shown that a
pollution impact measure that reflects public health is significantly associated with negative
returns in this time period. However, additional research over longer time periods will determine
whether other performance attributes or changing expectations may explain this effect.
32
Acknowledgments This study would not have been possible without the financial analysis of Greg Adams at
Brigham Young University, and the work of Yurika Nishioka at Harvard School of Public Health
on industry level analysis of PM2.5 premature mortality. Jonathan Levy provided important
insight into creating an aggregate health index. Koehler was supported by the Yamaguchi
Endowment.
References Abt-Associates, ICF-Consulting, et al. (2000) The Particulate-Related Health Benefits of
Reducing Power Plant Emissions (Prepared for the Clean Air Task Force: http://www.cleantheair.org/fact/mortality/mortalityabt.pdf).
Banz, R. W. (1981) 'The Relationship between Return and Market Value of Common Stocks', Journal of Financial Economics 9(1): 3-18.
Bauer, R., K. Koedijk, et al. (2002) International Evidence on Ethical Mutual Fund Performance and Investment Style (Maastricht: Limburg Institute of Financial Economics, Maastricht University).
Bennett, D. H., T. E. McKone, et al. (2001) 'Defining Intake Fraction', Environmental Science and Technology 36: 206A-211A.
Campbell, J., A. Lo, et al. (1997) The Econometrics of Financial Markets. (Princeton: Princeton University Press).
Campbell, J. Y. (2000b) 'Asset Pricing at the Millennium', Journal of Finance 55(4): 1515-1567. Cerin, P. and P. Dobers (2001) 'What does the Performance of the Dow Jones Sustainability
Group Index tell us?', Eco-Management & Accounting 8: 123-133. Clough, R. R. (1997) Impact of an Environmental Screen on Portfolio Performance: A
Comparative Analysis of S&P 500 Stock Returns. Deloitte&Touche (2000) Socially Responsible Investment - Response of Fund Managers
(London, UK: Deloitte&Touche). Fama, E. (1998) 'Market Efficiency, long-term returns and behavioral finance', Journal of
Finance Economics 49: 283-306. Fama, E. and K. French (1992) 'The Cross-Section of Expected Stock Returns', Journal of
Finance 47: 427-465. Fama, E. and K. French (1993) 'Common Risk Factors in the Returns on Stocks and Bonds',
Journal of Financial Economics 33: 3-56.
33
Fama, E. F. and J. D. MacBeth (1973) 'Risk, Return and Equilibrium: Empirical Tests', Journal of Political Economy 81: 607-636.
Garber, S. and J. K. Hammitt (1998) 'Risk Premiums for Environmental Liability: Does Superfund Increase the Cost of Capital?', J. Environ. Econom. Management 36: 267-294.
Hamilton, J. T. (1995) 'Pollution as News: Media and Stock Market Reactions to the Toxics Release Inventory Data', J. Environ. Econom. Management 28: 98-113.
Heinkel, R., A. Kraus, et al. (2001) 'The Effect of Green Investment on Corporate Behavior', Journal of Finance and Quantitative Analysis 36(4): 431-449.
Ilinitch, A. Y., N. S. Soderstrom, et al. (1998) 'Measuring Corporate Environmental Performance', Journal of Accounting & Public Policy 17(4,5 (Winter)): 383-408.
Karpoff, J. M., J. R. Lott, et al. (1998) Environmental Violations, Legal Penalties, and Reputation Costs : John M. Olin Law & Economics Working Paper No. 71).
Khanna, M., W. R. H. Quimio, et al. (1998) 'Toxics Release Information: A Policy Tool for Environmental Protection', J. Environ. Econom. Management 36: 243-266.
King, A. and M. Lenox (2001) 'Does it Really Pay to be Green? Accounting for Strategy Selection in the Relationship between Environmental and Financial Performance', Journal of Industrial Ecology 4(4 Fall): 105-116.
Koehler, D. A. (2003) 'Capital Markets and Corporate Environmental Performance - Research in the United States'. in Sustainability Performance and Business Competitiveness, forthcoming. S. Schaltegger, M. Wagner and W. Wehrmeyer. (Sheffield, UK, Greenleaf Publishing.
Koehler, D. A., D. H. Bennett, et al. (2003) Rethinking Corporate Environmental Performance from a Public Health Perspective (Boston, MA: Harvard School of Public Health).
Konar, S. and M. A. Cohen (1997a) 'Information as Regulation: The Effect of Community Right to Know Laws on Toxic Emissions', J. Environ. Econom. Management 32: 109-124.
Konar, S. and M. A. Cohen (1997c) Does the Market Value Environmental Performance? Lawson, A. M. (1997) 'Benchmark Input-Output Accounts for the U.S. Economy, 1992; Make,
Use and Supplementary Tables', Survey of Current Business November 1997: 36-82. Lintner, J. (1965) 'The Valuation of Risky Assets and the Selection of Risky Investments in
Stock Portfolios and Capital Budgets', Review of Economics and Statistics 47: 13-37. MiljoekoAB/SustainAbility (2001) Screening of Screening Companies (Stockholm, Sweden:
MISTRA). Mitchell, R. K., B. R. Agle, et al. (1997) 'Toward a Theory of Stakeholder Identification and
Salience: Defining the Principle of Who and What Really Counts', Academy of Management 22(4): 853-886.
Nishioka, Y., J. Levy, et al. (2003) A Risk-Baed Approach to Human Health Impact Assessment for Input-Output Analysis (Boston, MA: Harvard School of Public Health).
Reich, M. C., R. Wolff, et al. (2001) Ethical Investments - Towards a Sound Theory and Screening Methodology (Stockholm, Sweden: IVL).
Rowe, R. D., C. M. Lang, et al. (1995) The New York Electricity Externality Study Volume 1: Introduction and Methods (new York: Empire State Energy Research Corporation).
Sharpe, W. (1964) 'Capital Asset Prices: A Theory of Market Equilibrium under Conditions of Risk', Journal of Finance 19: 425-442.
Sharpe, W. F. (1991) 'The Arithmatic of Active Management', The Financial Analysts' Journal 47(1): 7-9.
34
Sharpe, W. F. (1992) 'Asset Allocation: Management Style and Performance Measurement', Journal of Portfolio Management Winter: 7-19.
Stone, B. K. (2003a) Rank-Based Security Grouping, Multicollinearity, and the Assessment of Cross-Sectional Return Dependencies, Working Paper. (Provo, Utah: Marriott School, Brigham Young University).
Stone, B. K. (2003b) Fundamental Determinants of the Impact of the Book to Market Variable on the Cross-Section of Stock Returns, Working Paper (Provo, Utah: Marriott School, Brigham Young University).
Stone, B. K. and G. L. Adams (2003d) The Impact of Cross-Sectional Variation in the Effective Tax Payment Rate on the Cross-Section of Stock Returns, Working Paper (Provo Utah: Marriott School, Brigham Young University).
Stone, B. K., D. L. Adolphson, et al. (1993) 'Optimal Data Selection and Grouping: An Extension of Traditional Response Surface Metholodgy to Observational Studies Involving Noncontrolled Empirical Data Generation', Advances in Mathematical Programming and Financial Planning 3: 39-68.
Stone, B. K., J. B. Guerard, et al. (2001) Socially Responsible Investment Screening: Strong Empirical Evidence of No Significant Cost for Actively Managed Value-Focused Portfolios. Dept . of Finance. Provo, Brigham Young University.
Stone, B. K. and T. W. Miller (2002) The Impact of Accounting Profitability Measures on the Cross-Section of Stock Return, Working Paper. (Provo, Utah: Marriott School, Brigham Young University).
Sturm, A. and M. Badde (2001) Socially Responsible Investment by Pension Funds (Basel, Switzerland: Ellipson).
Taylor/Nelson/Sofres (2001) The European Survey on Socially Responsible Investment and the Financial Community (Paris, France: CSR Europe).
USEPA (1998) Stationary Source Contorl Techniques Document for Fine Particulate Matte (Research Triangle Park, NC: US EPA Air Quality Strategies and Standards Division).
Woodruff, T. J., J. Caldwell, et al. (2000) 'Estimating Cancer Risk from Outdoor Concentrations of Hazardous Air Pollutants in 1990', Environmental Research 82: 194-206.
35
Figure 3. 1 Basic Study Flow Diagram
1. Rank-Ordering into Fractile Portfolios
1. log transform industry level pollution measures 2. Rank 3. Range-based partitioning into portfolios 4. Equalize number of firms per portfolio
2. Step-Wise use of Mathematical Assignment Program
Model 1: No control restrictions Model 2: CAPM: β Model 3: Fama-French 3-Factors: beta, B2M, MV Model 4: 7-Factors: adding EY, DY, FS, ET Model 5: Adding ROI, ROE, SI, AM
3. Cross-Sectional Regressions
1. Compute 5-year average returns 2. Regress return on each pollution
measure
4. Hypothesis Tests
1. Use t-value (F-value) to test null hypothesis 2. Sensitivity analysis
Pollution measures COMPUSTAT CRSP
36
Table 3. 1 Summary of Return Impacting Variables
Name Symbol Definition
Beta β β = Cov(Rs-Ro, RM – Ro) / Var(RM – Ro) measured over 3 years of past monthly returns, where Ro is the riskless rate and RM is the market index.
Book-to-Market ratio B2M Ratio of BV/MV where BV is accounting book value (total common equity) and MV is market capitalization of the common stock
Market Cap (Market Value) MV The market value of common stock at a point in time Earnings Yield EY The ratio of Net Income to market value, the reciprocal of
the price-earnings ratio Dividend Yield DY The ratio of Annual Dividends to Market Value Financial Structure FS The fraction of Total Investment provided by debt and
preferred stock Effective Tax Rate ET The ratio of Tax Payments to Net Income Return on Investment ROI The ratio of Operating Income (before extraordinary
income and expenses) to Total Investment Return on Equity ROE The ratio of Net Income to Book Value Sales Intensity SI The ratio of Sales to Total Investment Sales Growth SAG Five-year average sales growth Average Margin AM The Ratio of Operating Income to Sales Sustainable Growth SUG The growth of common equity from retained earnings
Table 3. 2 Industry Ranking by Total Supply Chain Public Health Risk per $1 Million Value-Added