Page 1
The effect of anxiety on memory accuracy, response time, and confidence
by
Bethany R. Delleman
A thesis
presented to the University of Waterloo
in fulfillment of the
thesis requirement for the degree of
Master of Arts
in
Psychology
Waterloo, Ontario, Canada 2014
© Bethany R. Delleman 2014
Page 2
ii
Author’s Declaration
I hereby declare that I am the sole author of this thesis. This is a true copy of the thesis, including
any required final revisions, as accepted by my examiners.
I understand that my thesis may be made electronically available to the public.
Page 3
iii
Abstract
Anxiety is an emotional state that has been associated with negative outcomes on cognitive tasks,
as well as low confidence in responses, specifically in the domain of long-term memory. The
following series of experiments explored the effect of anxiety on long-term memory performance
as well as on memory confidence, the accuracy-confidence relation, and response times. The
purpose was to determine how realistic anxious participants are when making confidence
judgments compared to low anxious peers and to attempt to improve the memory accuracy and
confidence of highly anxious individuals. In Experiment 1, participants encoded words presented
visually, followed by an anxiety induction. Those with higher anxiety scores had poorer memory
accuracy for target words as well as less confidence in their memory overall, consistent with
much of the literature. Response time (RTs) was slower in the high- relative to low-anxious
group when making confidence assessments but not memory judgments, suggesting that rather
than slowing cognitive processing, high anxiety individuals may be doubting their memory
ability, resulting in more time spent appraising their performance. In Experiment 2, I tested my
hypothesis that high-anxious participants are particularly slowed only when asked to critically
examine and evaluate their memory decisions. The same procedure as in Experiment 1 was used
except that I allowed participants an opportunity to switch their memory responses immediately
after making an initial classification. Highly anxious participants made more switches in their
memory judgments and this decreased their overall memory accuracy. Interestingly, in this
experiment, highly anxious participants did not have lower memory confidence than their low-
anxious peers, nor longer RTs when making confidence judgments. They did however take
longer when deciding whether to switch an answer. Results are in line with the suggestion that
high-anxious individuals defer worry until after a memorial decision is made, and that it is in the
Page 4
iv
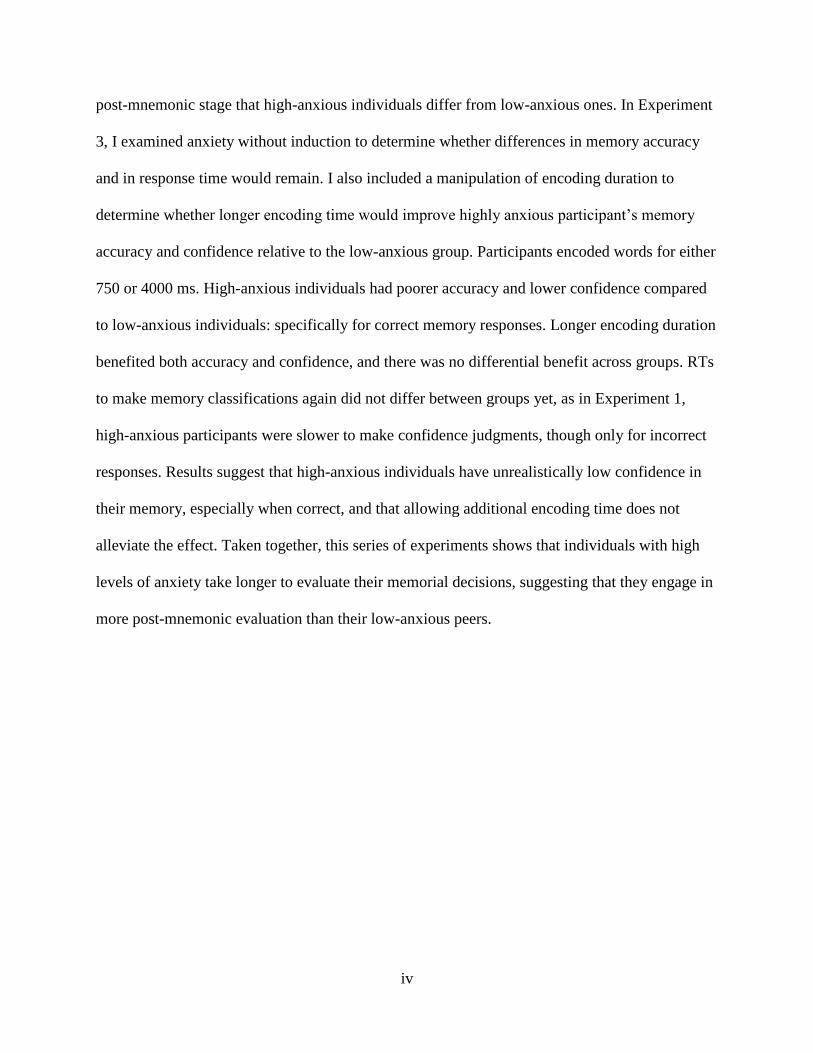
post-mnemonic stage that high-anxious individuals differ from low-anxious ones. In Experiment
3, I examined anxiety without induction to determine whether differences in memory accuracy
and in response time would remain. I also included a manipulation of encoding duration to
determine whether longer encoding time would improve highly anxious participant’s memory
accuracy and confidence relative to the low-anxious group. Participants encoded words for either
750 or 4000 ms. High-anxious individuals had poorer accuracy and lower confidence compared
to low-anxious individuals: specifically for correct memory responses. Longer encoding duration
benefited both accuracy and confidence, and there was no differential benefit across groups. RTs
to make memory classifications again did not differ between groups yet, as in Experiment 1,
high-anxious participants were slower to make confidence judgments, though only for incorrect
responses. Results suggest that high-anxious individuals have unrealistically low confidence in
their memory, especially when correct, and that allowing additional encoding time does not
alleviate the effect. Taken together, this series of experiments shows that individuals with high
levels of anxiety take longer to evaluate their memorial decisions, suggesting that they engage in
more post-mnemonic evaluation than their low-anxious peers.
Page 5
v
Acknowledgements
Thank you to Dr. Myra Fernandes for accepting me as a competent student and helping me
become a competent writer, researcher, and teacher. I would also like to thank Dr. Richard Ennis
for introducing me to psychology in my first year of university in such a way that I could not
help but enter the field. I would like to thank the readers of this thesis, Dr. Colin MacLeod and
Dr. David Moscovitch, for providing their input and feedback. I am also thankful to have been in
a wonderful lab that provided much needed feedback and constructive criticism. Thank you to
Dr. Shahnaz Koji, Dr. Lana Ozen, Dr. Jennifer Tomaszczyk, Jeff Wammes, Fahad Ahmad, and
Melissa Meade. Lastly, I would like to thank my research assistants, Daniel Yan and Harpreet
Grewal, for their time and commitment in making this thesis possible.
Page 6
vi
Table of Contents
Author’s Declaration ....................................................................................................................... ii
Abstract .......................................................................................................................................... iii
Acknowledgements ......................................................................................................................... v
Table of Contents ........................................................................................................................... vi
List of Figures ............................................................................................................................... vii
List of Tables ............................................................................................................................... viii
1. General Introduction ................................................................................................................ 1
The Effect of Anxiety on Memory .............................................................................................. 2
Processing Efficiency Theory ..................................................................................................... 5
Factors Influencing Memory Confidence ................................................................................... 6
The Relation between Memory Accuracy and Confidence ........................................................ 8
2. Experiment 1: Effect of Anxiety Induction on Long Term Memory ................................. 12
2.1 Method ................................................................................................................................ 13
2.2 Results ................................................................................................................................. 18
2.3 Discussion ........................................................................................................................... 22
3. Experiment 2: Anxiety and Response Switching ................................................................. 25
3.1 Method ................................................................................................................................ 26
3.2 Results ................................................................................................................................. 28
3.3 Discussion ........................................................................................................................... 36
4. Experiment 3: Role of encoding duration (Delleman & Fernandes, under revision). ...... 39
4.1 Method ................................................................................................................................ 41
4.2 Results ................................................................................................................................. 44
4.3 Discussion ........................................................................................................................... 50
5. General Discussion .................................................................................................................. 53
Anxiety and Memory ................................................................................................................ 53
Processing Efficiency Theory and Long-term Memory ............................................................ 54
Memory Confidence and Anxiety ............................................................................................. 55
The Accuracy and Confidence Relation.................................................................................... 56
Limitations and Conclusions ..................................................................................................... 57
Page 7
vii
List of Figures
Figure 1: Mean memory accuracy by group; error bars displaying
standard error of the mean Experiment 2 ……………………29
Figure 2. Mean reported confidence before and after change response by
item accuracy; error bars show standard error of the mean.
Experiment 2 ……………………33
Figure 3. Mean confidence response time in milliseconds before and after
making the change response by accuracy; error bars show standard error
of the mean. Experiment 2. ……...…………….34
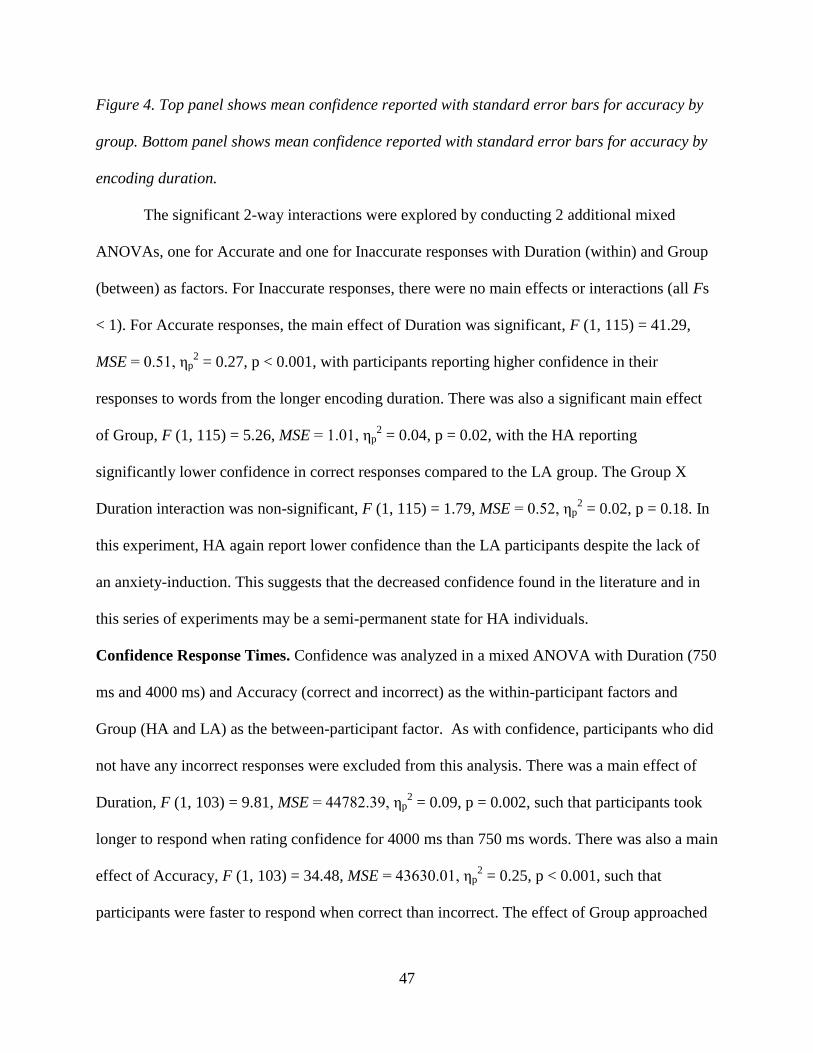
Figure 4. Top panel shows mean confidence reported with standard error
bars for accuracy by group. Bottom panel shows mean confidence
reported with standard error bars for accuracy by encoding duration
Experiment 3. ....…………………46
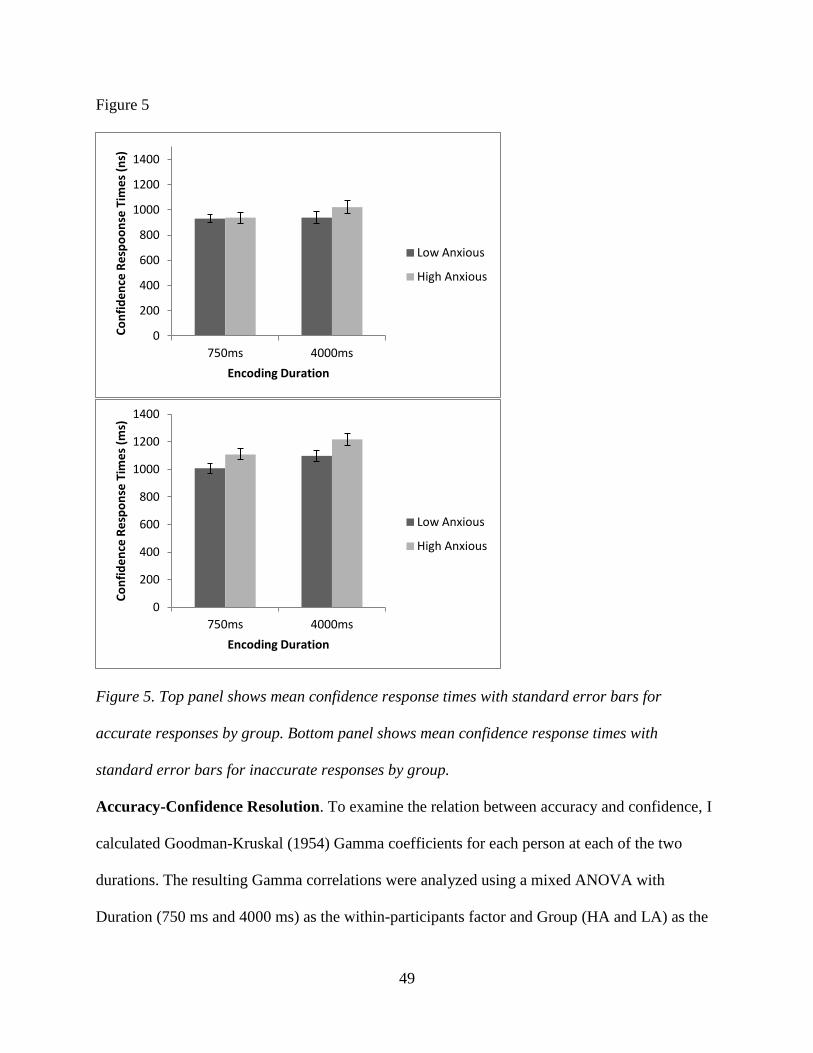
Figure 5. Top panel shows mean confidence response times with standard
error bars for accurate responses by group. Bottom panel shows mean
confidence response times with standard error bars for inaccurate
responses by group. Experiment 3. …...………………49
Page 8
viii
List of Tables
Table 1: Mean (and standard deviation) state and trait anxiety scores for
the HA and LA groups with t-statistics included. Experiment 1. ……………………14
Table 2: Mean (and standard deviation in parentheses) confidence
ratings in HA and LA participants for correct and incorrect
responses. Experiment 1. ……………………19
Table 3: Median (and standard deviation in parentheses) RTs
(in milliseconds) to make confidence ratings in HA and LA
participants. Experiment 1 ……………………20
Table 4: Mean (and standard deviation) state and trait anxiety scores
for the HA and LA groups with t-statistics included.
Experiment 2 ……………………27
Table 5: Number and percentage of participants in each group who
improved, decreased, or maintained their original memory
accuracy level after changing responses (participants who
did not make any switches were excluded). Experiment 2. ……………………30
Table 6: Median (and standard deviation in parentheses) RTs
(in milliseconds) for memory decisions in HA and
LA participants. Experiment 2. ……………………31
Table 7: Mean (and standard deviation in parentheses) Gamma
coefficients in HA and LA Participants ……………………36
Table 8: Mean (and standard deviation in parenthesese) state and trait
anxiety scores for the HA and LA groups. Experiment 3. ……………………42
Table 9: Mean recognition memory performance measured as d’ (standard
deviations in parentheses) following short and long
encoding durations in HA and LA groups. Experiment 3. ……………………45
Table 10: Mean Gamma coefficients (with standard deviations in
parentheses) following short and long encoding durations in HA
and LA groups. Experiment 3. ……………………50
Page 9
1
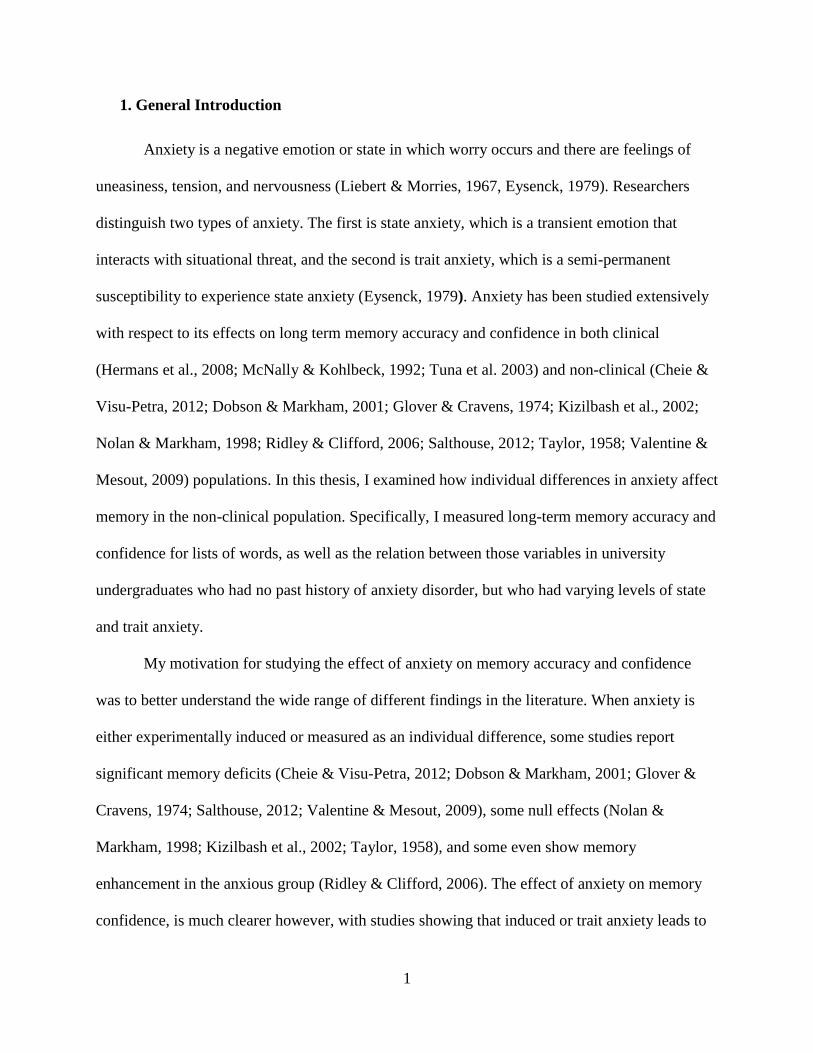
1. General Introduction
Anxiety is a negative emotion or state in which worry occurs and there are feelings of
uneasiness, tension, and nervousness (Liebert & Morries, 1967, Eysenck, 1979). Researchers
distinguish two types of anxiety. The first is state anxiety, which is a transient emotion that
interacts with situational threat, and the second is trait anxiety, which is a semi-permanent
susceptibility to experience state anxiety (Eysenck, 1979). Anxiety has been studied extensively
with respect to its effects on long term memory accuracy and confidence in both clinical
(Hermans et al., 2008; McNally & Kohlbeck, 1992; Tuna et al. 2003) and non-clinical (Cheie &
Visu-Petra, 2012; Dobson & Markham, 2001; Glover & Cravens, 1974; Kizilbash et al., 2002;
Nolan & Markham, 1998; Ridley & Clifford, 2006; Salthouse, 2012; Taylor, 1958; Valentine &
Mesout, 2009) populations. In this thesis, I examined how individual differences in anxiety affect
memory in the non-clinical population. Specifically, I measured long-term memory accuracy and
confidence for lists of words, as well as the relation between those variables in university
undergraduates who had no past history of anxiety disorder, but who had varying levels of state
and trait anxiety.
My motivation for studying the effect of anxiety on memory accuracy and confidence
was to better understand the wide range of different findings in the literature. When anxiety is
either experimentally induced or measured as an individual difference, some studies report
significant memory deficits (Cheie & Visu-Petra, 2012; Dobson & Markham, 2001; Glover &
Cravens, 1974; Salthouse, 2012; Valentine & Mesout, 2009), some null effects (Nolan &
Markham, 1998; Kizilbash et al., 2002; Taylor, 1958), and some even show memory
enhancement in the anxious group (Ridley & Clifford, 2006). The effect of anxiety on memory
confidence, is much clearer however, with studies showing that induced or trait anxiety leads to
Page 10
2
lower confidence in memorial responses (Nolan & Markham, 1998; Ridley & Clifford, 2006;
Valentine & Mesout 2009).
The relation between these variables is also poorly understood. There is disagreement in
the literature as to whether the low confidence observed in highly anxious (HA) participants is a
more realistic appraisal of their memory than is the high confidence usually found in low-anxiety
(LA) groups. Given that lower confidence has been found in all studies that examined both
memory accuracy and confidence together, researchers have speculated about whether HA
participants are actually displaying greater insight into their performance and therefore are more
realistically appraising their responses compared to the LA participants (Nolan & Markham,
1998). In the normal population, overconfidence is very common (Adams & Adams, 1960; Chua
et al., 2012, Fichhoff et al., 1977) so lower confidence overall might be a more realistic
evaluation of one’s memory. This view is opposed by Ridley and Clifford (2006) who found
near-ceiling performance in their HA group but very low confidence. Instead of seeming more
self-aware, they argued that the HA participants were unrealistically under-confident.
The Effect of Anxiety on Memory
Whether researchers induced anxiety in their studies seems to have influenced the pattern
of memory performance. For example, Dobson and Markham (2001) found a decrease in
memory for a sequence of events depicting a crime in an HA relative to LA group of
participants, but only when anxiety was manipulated (by way of ego threat) at both encoding and
retrieval. Notably, however, the difference in memory performance was not due to decreased
performance in the HA group, but instead to an increase in the LA group. Such a finding
suggests that the researcher’s manipulation had a selective motivating effect on the LA group
rather than a detrimental effect in the HA group. Another study by Nolan and Markham (1998)
Page 11
3
found no differences in memory performance following anxiety induction at retrieval. Similarly,
Taylor (1958) found that under low stress, without induction, HA participants recalled more
nonsense syllables than LA. However, after an anxiety induction of ego threat however, the HA
and LA groups showed a similar rate of decrease in performance. This suggests that some
anxiety manipulations may be motivating rather than detrimental to both HA and LA groups.
While these studies did not find significant memory deficits in HA participants following
anxiety induction, others (Deffenbacher et al., 2004, Valentine & Mesout, 2009) have reported a
negative association between heightened anxiety and memory. Deffenbacher and colleagues’
(2004) meta-analysis of eyewitness studies showed that induced anxiety led to poorer memory
performance, especially when anxiety was accompanied by high levels of physiological arousal.
However, the experiments that they reviewed did not separate participants based on individual
differences in trait anxiety, and even the authors state that since HA and LA participants may
respond differentially to stress, they should be assessed separately (Deffenbacher et al., 2004).
While this meta-analysis emphasized the importance of arousal, Eysenck and Calvo (1992)
found that impaired performance can be found in a HA group even without supporting arousal
data. Not all experiments collect physiological data, though one that did (Valentine & Mesout,
2009) sorted their participants into HA and LA groups based on self-reported state anxiety.
Physiological data were collected as a manipulation check and were found to account for a
significant portion of variance in state anxiety scores. The researchers found that the HA group
was significantly worse at identifying a confederate that had frightened them while walking
through an environment designed to elevate anxiety by the presentation of frightening stimuli.
Overall, these experiments showed that an induction that is designed to elevate anxiety may also
be motivating for LA participants, complicating conclusions about the effect of anxiety on
Page 12
4
memory. In addition, anxiety inductions appear to produce more anxiety in those who are high in
trait anxiety than those who are not, suggesting that it is critical to consider individual
differences in susceptibility to anxiety when examining how this manipulation affects memory.
There have also been studies that focused more exclusively on individual differences in
anxiety without induction. It can be argued that the experiments that manipulated anxiety were
merely exaggerating underlying differences in trait anxiety, effects which may remain without
induction. Two such studies were carried out. One was by Salthouse (2012) with volunteers
recruited from the community and another was by Kizilbash and colleagues (2002) with
Vietnam-era veterans. Salthouse found that trait anxiety was negatively associated with memory
performance on a variety of tasks including word recall and paired associates in his regression
analysis. Depression symptoms, age, gender, and health were all controlled for and there was a
highly varied sample of people tested (e.g., age range of 18-97, various careers, levels of
education, etc.). In contrast, Kizilbash and colleagues (2002) did not find an effect of trait
anxiety levels in a large sample of Vietnam-era veterans on memory. However, they did find that
those with co-morbid anxiety and depression had significantly reduced performance.
Unfortunately, this study had relatively few participants who were only trait anxious (n = 47) and
far more participants with comorbid anxiety and depression (n = 416) which means that there
may not have been enough participants to make the effect of trait anxiety alone significant. Thus,
overall, the literature is divided as to whether elevated state or trait anxiety produces deficits or
null effects on memory performance.
In the three experiments that form this Master’s thesis, sub-clinically anxious individuals
were classified by their self-reported state and trait anxiety which was collected using the State-
Trait Anxiety Inventory (STAI) (Exp. 1 and 2) and the State-Trait Inventory of Cognitive and
Page 13
5
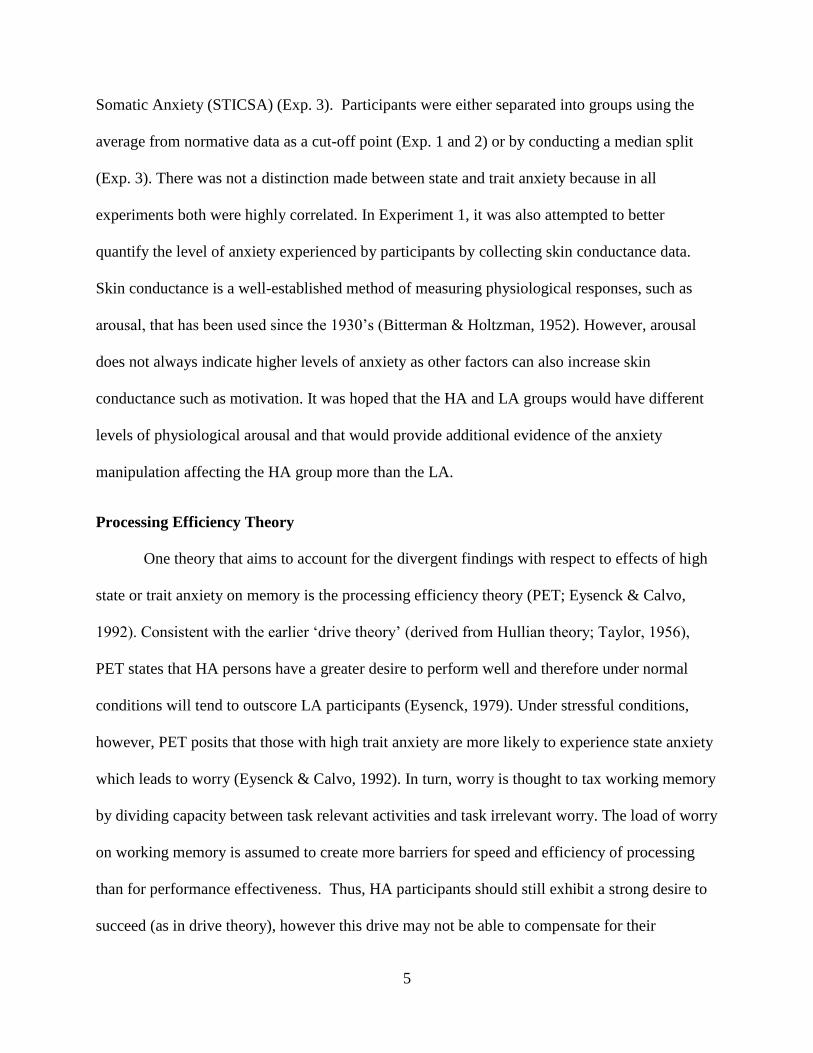
Somatic Anxiety (STICSA) (Exp. 3). Participants were either separated into groups using the
average from normative data as a cut-off point (Exp. 1 and 2) or by conducting a median split
(Exp. 3). There was not a distinction made between state and trait anxiety because in all
experiments both were highly correlated. In Experiment 1, it was also attempted to better
quantify the level of anxiety experienced by participants by collecting skin conductance data.
Skin conductance is a well-established method of measuring physiological responses, such as
arousal, that has been used since the 1930’s (Bitterman & Holtzman, 1952). However, arousal
does not always indicate higher levels of anxiety as other factors can also increase skin
conductance such as motivation. It was hoped that the HA and LA groups would have different
levels of physiological arousal and that would provide additional evidence of the anxiety
manipulation affecting the HA group more than the LA.
Processing Efficiency Theory
One theory that aims to account for the divergent findings with respect to effects of high
state or trait anxiety on memory is the processing efficiency theory (PET; Eysenck & Calvo,
1992). Consistent with the earlier ‘drive theory’ (derived from Hullian theory; Taylor, 1956),
PET states that HA persons have a greater desire to perform well and therefore under normal
conditions will tend to outscore LA participants (Eysenck, 1979). Under stressful conditions,
however, PET posits that those with high trait anxiety are more likely to experience state anxiety
which leads to worry (Eysenck & Calvo, 1992). In turn, worry is thought to tax working memory
by dividing capacity between task relevant activities and task irrelevant worry. The load of worry
on working memory is assumed to create more barriers for speed and efficiency of processing
than for performance effectiveness. Thus, HA participants should still exhibit a strong desire to
succeed (as in drive theory), however this drive may not be able to compensate for their
Page 14
6
increased working memory load. As such, PET predicts that under low stress conditions, HA
participants should either outperform or perform at the same level as LA participants. However,
when stress in introduced, HA participants should experience a decrease in performance and
slowed processing speed (Eysenck & Calvo, 1992).
Unfortunately, PET has not been extensively examined or tested using long term memory
paradigms. Researchers have primarily focused on working memory and various other cognitive
tasks. Previous research (Cheie & Visu-Petra, 2012; Dobson & Markham, 2001; Glover &
Cravens, 1974; Kizilbash et al., 2002; Nolan and Markham, 1998; Ridley & Clifford, 2006;
Salthouse, 2012; Taylor, 1958; Valentine & Mesout, 2009) did not analyze response time which
is vital to test predictions from PET, given that the main distinguishing feature is slowed
processing before a decrease in performance is observed. If PET is an accurate representation of
the effect of anxiety on memory, it would be expected that every experiment that showed a
deficit in memory accuracy would have an accompanying response time difference between the
LA and HA groups. As well, in experiments that did not find an accuracy deficit, a response time
slowing would be predicted in the HA group.
Factors Influencing Memory Confidence
Memory confidence is another way of assessing the quality of one’s memory. Many
factors affect memory and confidence in different ways which is why in this thesis both accuracy
and confidence were examined. As discussed in the previous section, anxiety occasionally affects
memory confidence and accuracy in the same way but this is not always true. Other factors such
as familiarity (Chua et al., 2012; Fischhoff et al., 1977) and repeated questioning (Shaw &
McClure, 1996) have divergent effects on memory and confidence in the literature. Familiarity
can increase confidence but not accuracy for general knowledge (Fischhoff et al. 1977) if a well-
Page 15
7
known association is misleading. For example, participants in Fischhoff and colleagues’ (1977)
experiment were quite certain that potatoes originated from Ireland as that association is very
common in our culture, despite potatoes actually originating from Peru. Researchers stated that
this experiment shows the reconstructive and deceptive nature of memory for facts as
participants recalled hearing or learning the incorrect information. Such research shows
divergent influences on memory confidence and accuracy. As for repeated questioning, a
manipulation used in this thesis, Shaw and McClure (1996) had participants view a staged event
in class and then questioned them about it five times over five consecutive weeks. The memory
test began with a few questions and each week it increased in size while maintaining the earlier
questions. It was found that by the last test, confidence had increased significantly for the items
that had been tested five times; importantly, however, accuracy remained constant.
In contrast, other studies have shown that experimental manipulations can affect memory
accuracy and confidence in very similar ways. For example, when testing memory in a forced-
choice paradigm, deliberate reasoning will either increase or decrease both confidence and
accuracy together (Chua et al., 2012). Deliberate reasoning is described as the ability of a
participant to make a memory decision based on logic rather than a strong memory. For example,
if the participants had to pick out memorized words from two options, if the original list had only
contained words related to furniture and the lures were all bird names, the participants would
have very high accuracy and confidence. Response fluency, how quickly a person brings a
memory to mind and responds, also increases accuracy and confidence concurrently (Robinson
et al., 1997, Shaw et al., 2001).
As discussed above, some manipulations can affect memory and confidence in divergent
ways and anxiety occasionally has divergent effects on these variables. Some researchers have
Page 16
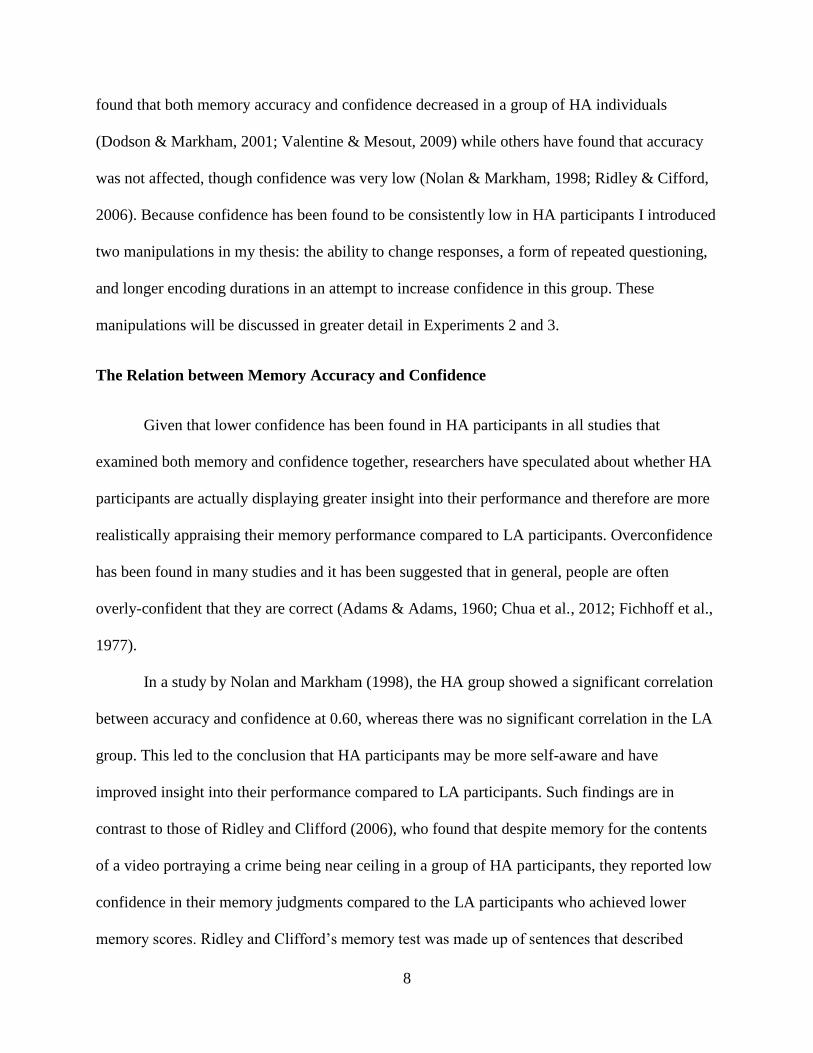
8
found that both memory accuracy and confidence decreased in a group of HA individuals
(Dodson & Markham, 2001; Valentine & Mesout, 2009) while others have found that accuracy
was not affected, though confidence was very low (Nolan & Markham, 1998; Ridley & Cifford,
2006). Because confidence has been found to be consistently low in HA participants I introduced
two manipulations in my thesis: the ability to change responses, a form of repeated questioning,
and longer encoding durations in an attempt to increase confidence in this group. These
manipulations will be discussed in greater detail in Experiments 2 and 3.
The Relation between Memory Accuracy and Confidence
Given that lower confidence has been found in HA participants in all studies that
examined both memory and confidence together, researchers have speculated about whether HA
participants are actually displaying greater insight into their performance and therefore are more
realistically appraising their memory performance compared to LA participants. Overconfidence
has been found in many studies and it has been suggested that in general, people are often
overly-confident that they are correct (Adams & Adams, 1960; Chua et al., 2012; Fichhoff et al.,
1977).
In a study by Nolan and Markham (1998), the HA group showed a significant correlation
between accuracy and confidence at 0.60, whereas there was no significant correlation in the LA
group. This led to the conclusion that HA participants may be more self-aware and have
improved insight into their performance compared to LA participants. Such findings are in
contrast to those of Ridley and Clifford (2006), who found that despite memory for the contents
of a video portraying a crime being near ceiling in a group of HA participants, they reported low
confidence in their memory judgments compared to the LA participants who achieved lower
memory scores. Ridley and Clifford’s memory test was made up of sentences that described
Page 17
9
either veridical details or false information from the video participants had just watched. While
the accuracy-confidence correlation was not tested statistically in that study, the authors argued
that since the HA group had highly accurate memories, their low confidence was unrealistic.
The difference in the strength of the association between accuracy and confidence, across
these two studies, may be methodological. Nolan and Markham (1998) induced anxiety prior to
encoding; Ridley and Clifford (2006), on the other hand, simply assessed levels of state and trait
anxiety in their participants without manipulation. According to PET, high state anxiety produces
excessive worry or thoughts of task evaluation (Eysenck & Calvo, 1992). The anxiety
manipulation in Nolan and Markham’s study likely further increased focus on appraisals of
performance, leading to more realistic confidence judgments. Yet, given that worry is also
thought to slow processing (Eysenck & Calvo, 1992), it is possible that HA individuals perceived
tasks as more difficult than LA participants and therefore reported lower confidence overall, as
in the Ridley and Clifford (2006) study.
In my thesis, I sought to clarify the accuracy-confidence relation by computing Gamma
correlations for HA versus LA individuals, instead a Pearson correlation coefficient (Bornstein &
Zickafoose, 1999). A Gamma correlation is derived from the chi squared statistic and is a
nonparametric correlation measure. It is considered best measure of resolution, how effectively
confidence corresponds to correct and incorrect recognitions, as it takes into account all
responses and not overall performance (Krug, 2007). Confidence is correlated positively with
accuracy if confidence is greater for correct than incorrect responses (Nelson, 1984). In this way,
higher Gamma correlations are taken as evidence of better meta-memory insight. This statistic is
particularly suited for examining differences between HA and LA participants as it distinguishes
individual item performance (unlike point biserial correlations), and not a person’s overall
Page 18
10
confidence level (Nelson, 1984). Since it has been shown that HA individuals have lower
confidence in general (Nolan & Markham, 1998; Ridley & Clifford, 2006; Valentine & Mesout,
2009) it is beneficial in this group to look at the relative difference between accurate and
inaccurate responses instead of overall confidence. Other measures of the accuracy-confidence
relation, such as calibration, do not consider confidence separately for correct and incorrect
classifications, but simply plot confidence and percentage accuracy on a given memory test
(Krug, 2007). Gamma correlations are also suggested when using a scale to measure confidence
(1 to 6 in my experiments) rather than a percentage score (0%-100% confident) (Krug, 2007).
The literature is divided as to what the effect of anxiety is on long-term memory
accuracy, confidence, and the relation between them. Therefore in this thesis, I sought to
elucidate findings such as the possibility of a processing speed deficit in HA individuals and
expand on others, specifically the relation between confidence and accuracy in HA compared to
LA participants. I also endeavoured to produce conditions in which HA participants would not
have deficits in memory or confidence, by allowing participants to change their memory
classification (Experiment 2), and by allowing a longer encoding time (Experiment 3). In each
experiment, memory confidence, accuracy, response time, and the accuracy-confidence relation
were examined to provide a clear picture of how memory is affected by anxiety. By collecting
data for each of these variables simultaneously, predictions from PET were tested directly. It was
also explored whether the lower level of confidence found in HA participants, represents a more
realistic judgment of one’s memory accuracy. This question is important to clarify as it has not
yet been established if lower confidence in HA individuals is actually a realistic or unrealistic
evaluation of their memory. Overall, this thesis endevoured to provide a wealth of data
Page 19
11
demonstrating the differences between HA and LA participants and to determine whether there
exist any conditions which could make the HA group appear more similar to their LA peers.
Page 20
12
2. Experiment 1: Effect of Anxiety Induction on Long Term Memory
The purpose of the first experiment was to establish whether deficits to memory accuracy
and confidence could be demonstrated in an HA group in my paradigm given that findings are
not consistent in the literature. The methods used that were close to those of Dodson and
Markham (2001) in that anxiety was manipulated specifically after encoding and also used a
recognition test to assess memory. Because memory performance has been varied in HA
participants in the literature, as discussed in the general introduction, in order to determine
whether memory accuracy as well as confidence would be impaired when using these methods.
In this experiment, memory performance and confidence were assessed in HA and LA
participants following an anxiety induction. In addition, the relation between memory accuracy
and confidence was also examined. Response time was also recorded and analyzed to determine
whether memory and confidence decisions take longer in HA than LA participants to test the
assumptions of PET. That is, if HA participants would experience a processing efficiency deficit
(increased RTs) before or simultaneously with a decrement in processes effectiveness (memory
accuracy). In Experiment 1 (as well as Experiment 2), an anxiety manipulation was administered
to all participants and groups were formed based on each participant’s self-reported level of state
anxiety during the experiment. (While state anxiety was used in Experiments 1 and 2 to group
participants, group membership would have remained the same even if they were created based
on trait anxiety scores due to the high degree of correlation between state and trait anxiety). In
Experiment 1, physiological data was collected using skin conductance which measured arousal.
It was hoped that skin conductance would provide further evidence of differences in anxiety
between the HA and LA group as anxiety is often associated with heightened arousal (Bitterman
& Holtzman, 1952). It was thought that skin conductance would be higher overall in the HA
Page 21
13
group based on the findings of Valentine and Mesout (2009), but be particularly elevated during
the anxiety induction.
In Experiment 1, anxiety was manipulated by having participants engage in one of two
challenging cognitive tasks to be completed under time pressure, which has been found to be
stressful for anxious participants (Mattarella-Micke et al. 2011). The Raven’s Progressive
Matrices (Raven et al., 1983) was used which is a standardized IQ test and a mathematics test
that was composed of questions involving carrying, which math anxious individuals in particular
find specifically anxiety-inducing (Mattarella-Micke et al. 2011). Two different inductions were
used because it was thought that there would be a different level of anxiety induced by each one.
It was hypothesized that the math test might be more anxiety-inducing in the population tested,
which had a high level of math anxiety as well as general trait anxiety, than the Raven’s
Matrices, which are pattern- rather than number-based.
To better characterize the influence of anxiety on memory and confidence ratings, a
recognition test was administered in which different types of memory responses could be
examined: correct (hits and correct rejections) and incorrect (false alarms and misses). In so
doing, I hoped to provide converging evidence that anxiety is linked to decreased memory
confidence and accuracy, and to test PET (Eysenck & Calvo, 1992) by comparing response times
between HA and LA participants.
2.1 Method
Participants. 60 undergraduate participants from the University of Waterloo took part in the
experiment. The participants were separated into groups based on their scores of state anxiety on
the STAI (Speilberger et al., 1983). Participants were split into high (n = 30) and low (n = 30)
anxiety groups based on normative data (Speilberger et al., 1983) for each gender of college
Page 22
14
students. Females scoring 39 and higher and males scoring 37 and higher were included in the
HA group (6 male, mean Age = 19.73, sd = 2.28, mean Years of Education = 14.17, sd = 1.05)
and all participants scoring below were included in the LA group (10 male, mean Age = 20.83,
sd = 3.48, mean Years of Education = 14.87, sd = 1.11). Data from 11 other participants were
excluded from analyses: 4 participants scored zero on the memory test, suggesting they did not
follow instructions, and 7 participants were excluded due to experimental equipment failure. All
participants had never been diagnosed, been treated for, or currently had depression or clinical
anxiety disorders.
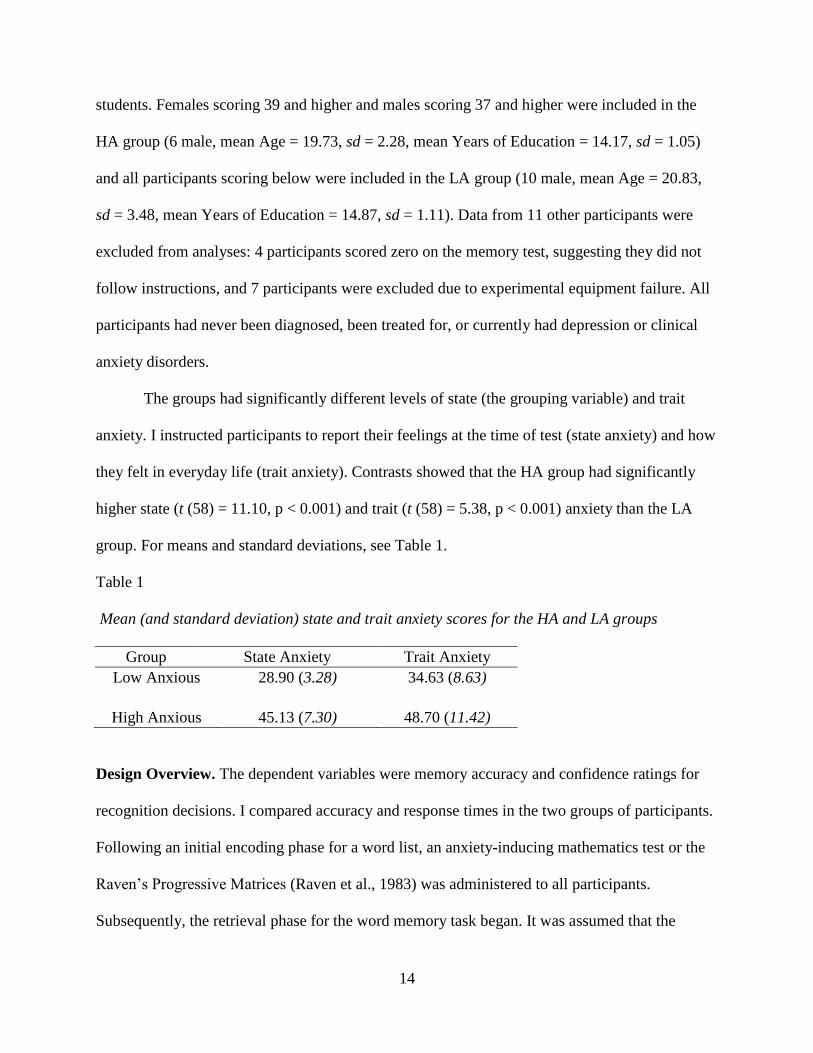
The groups had significantly different levels of state (the grouping variable) and trait
anxiety. I instructed participants to report their feelings at the time of test (state anxiety) and how
they felt in everyday life (trait anxiety). Contrasts showed that the HA group had significantly
higher state (t (58) = 11.10, p < 0.001) and trait (t (58) = 5.38, p < 0.001) anxiety than the LA
group. For means and standard deviations, see Table 1.
Table 1
Mean (and standard deviation) state and trait anxiety scores for the HA and LA groups
Group State Anxiety Trait Anxiety
Low Anxious 28.90 (3.28) 34.63 (8.63)
High Anxious 45.13 (7.30) 48.70 (11.42)
Design Overview. The dependent variables were memory accuracy and confidence ratings for
recognition decisions. I compared accuracy and response times in the two groups of participants.
Following an initial encoding phase for a word list, an anxiety-inducing mathematics test or the
Raven’s Progressive Matrices (Raven et al., 1983) was administered to all participants.
Subsequently, the retrieval phase for the word memory task began. It was assumed that the
Page 23
15
influence of the anxiety manipulation would last for at least 2-3 minutes (Ononaiye et al., 2007).
The success of the manipulation in increasing arousal was assessed skin conductance and a self-
report questionnaire.
Memory Task. Two word lists were created for visual presentation on the computer. These
were selected from the ‘Affective Norms of English’ (ANEW) database containing normative
ratings of English words for valence, arousal, and dominance (the perceived degree of control
expressed by the stimulus) rated on a 1-9 scale (Bradley & Lang, 1999), as well as word
frequencies (Kucera & Francis, 1967). Two 30-word lists were created, equated based on
ANEW ratings of valence, arousal, word frequency, letter length, and dominance. All words
were concrete nouns of medium frequency and between four and seven letters in length. An
additional 5-word list was created for study use in a practice phase, and another 5 words to be
used as lures in practice, using the same criteria as in the experimental phase. All words were
presented in a random order in 20-point Arial font in black on a white background, centered on a
computer screen.
Skin Conductance . Skin conductance was measured using the Affectiva Q 1.0 sensor
(Affectiva Inc., Santa Clara, CA). This device is similar in appearance and weight to a wrist
watch and was placed snugly on the participant’s non-dominate wrist. Two sensors sent a small
electric current between each other measured conductance while in contact with the participants’
skin. The skin conductance device was mounted on the participant’s wrist following their
informed consent.
Anxiety Induction. The anxiety-inducing tasks were both completed using a pencil and paper. I
used two different tasks: a mathematics test and Raven’s Progressive Matrices. The mathematics
test consisted of 4 pages of basic mathematical problems that could all be solved without the use
Page 24
16
of a calculator. All questions involved either addition, subtraction, division, or multiplication, or
combinations of these. The questions all involved carrying, multiple steps, or long division
which have been shown to arouse mathematics anxiety (Mattarella-Micke et al. 2011). The four
basic math operations were used in an effort to reduce boredom in those who did not find the
task difficult. It was explained to participants before the test that if they forget how to perform a
certain operation, for example long division that they should move on to the next section in an
effort to reduce the possibility of participants giving up. Given the length of this task,
participants were not expected to be able to complete it in the time given.
The Raven’s Progressive Matrices (Raven et al. 1983) was also used as an anxiety
induction. The Raven’s involves viewing a 3 x 3 matrix with a specific pattern and choosing the
piece out of 8 available options to complete the pattern. The pattern is different for each new
matrix. Usually participants have a total of 40 minutes to complete as much of the two booklets
as they can. IQ is calculated by subtracting incorrect and incomplete answers from correct ones.
Unlike the mathematics test, questions in the Raven’s do not require prerequisite knowledge;
therefore participants were instructed not to skip any questions. The children’s version of the RP
was also included in case a participant finished the adult test and also made the task appear
longer.
Procedure. Participants were tested individually in a quiet room. SC, used to measure
physiological arousal, was averaged at four different 2-minute time intervals. The first interval
was called ‘Baseline SC’ and occurred while the participant was resting comfortably awaiting
task instructions. The second was called “Encoding SC” and occurred during the memory
encoding phase of the experiment, starting concurrently with presentation of the first word on the
study list. The third was called ‘Arousal Induction SC’ and occurred 2 minutes after the
Page 25
17
participant began the arousal induction test. The forth was called ‘Retrieval SC’ and began at the
start of the recognition memory task.
Prior to commencing the experimental phase, participants completed a practice memory
test consisting of 5 study words and 10 words on the recognition test (half old), to familiarize
participants with stimulus presentation and timing. For the memory task, stimulus presentation
and response recording was controlled using E-prime v.1.1 software (Psychology Software Tools
Inc., Pittsburg, PA). A 17” computer monitor was used to present participants with word stimuli.
Participants were required to make responses with their dominant hand using a standard
keyboard. During encoding, words from list 1 were presented in a random order in 20 point Arial
font, centered on the computer screen. Each was shown for 4 seconds in black lettering against a
white background display, followed by a fixation cross for 1 second. List 2 words were used as
lures on the recognition test. Word lists were counterbalanced across participants such that each
list served as “study” for half of the participants in each anxiety group.
The participant then moved to a second desk where the anxiety induction took place. Half
of the participants in each group were given the mathematics test and half the Raven’s
Progressive Matricies. The participant had 10 minutes to work on the anxiety-inducing task,
starting from the moment they acknowledged understanding the task. When the 10 minutes
ended, the participant returned to the computer desk.
For the retrieval phase, participants were shown a list of words, half of which were from
the study list. For each recognition memory trial, a word was presented on the screen for 3
seconds. Participants were asked to make an ‘old’ or ‘new’ decision about the word by pressing
the appropriate key, the “n” key had a sticker labelled “Y” affixed to it, to indicate “yes had seen
before/old”, and the “m” key had a sticker labelled “N”, to indicate “no had not seen
Page 26
18
before/new”. These keys were chosen as they are easy to reach with one hand. Next, a screen
was presented for 3 seconds, asking participants to make a rating to indicate their confidence in
their memory judgment. Confidence ratings were to be made on a 6 point scale: 1-2 indicating
not very confident, 3-4 indicating moderately confident, and 5-6 indicating very confident. A
fixation cross appeared for 500 milliseconds in between word recognition trials. After the
memory test was completed, participants were asked to complete the STAI both state and trait.
2.2 Results
Memory Accuracy. A univariate ANOVA was conducted using d’ memory accuracy
(Snodgrass & Corwin, 1988) as the dependent measure, with Anxiety Induction (mathematics
test or Raven’s Progressive Matrices), List (1 and 2), and State Anxiety Group (HA and LA)) as
between-participant factors. The effect of Group was approaching significance, F (1, 52) = 3.52,
MSE = 0.85, ηp2 = 0.06, p = 0.07 with the HA group scoring lower on the memory test (mean =
1.69, sd = 0.91) than the LA group (mean = 2.18, sd = 0.94). There was no effect of List (F < 1)
or Anxiety Induction (F (1, 52) = 1.83, MSE = 0.85, ηp2 = 0.03, p = 0.18) and no significant
interactions.
Pearson correlations were also computed for memory performance and RTs. Memory
performance was negatively correlated with state anxiety, r (58) = -0.39, p < 0.01. State anxiety
and RT to make hits, false alarms, misses and correct rejections were uncorrelated. Therefore, it
was demonstrated that with this paradigm, HA participants had worse performance on the
memory task and higher anxiety was associated with poorer performance.
Memory Response Times. RTs to make memorial decisions were analyzed with a mixed
ANOVA with Group (HA and LA) as a between participant factor and Response Type (hits,
false alarms, misses, and correct rejections) as a within participants factor. There was a main
Page 27
19
effect of Response Type F (3, 156) = 26.08, MSE = 59371.07, ηp2 = 0.33, p < 0.001, with hits
having the fastest RTs, followed by correct rejections, misses, and then false alarms. There was
no effect of Group (F < 1) and the interaction was not significant (F < 1). Therefore, HA
participants did not have a processing speed deficit as predicted by PET but were able to make
recognition decisions as quickly as their LA peers.
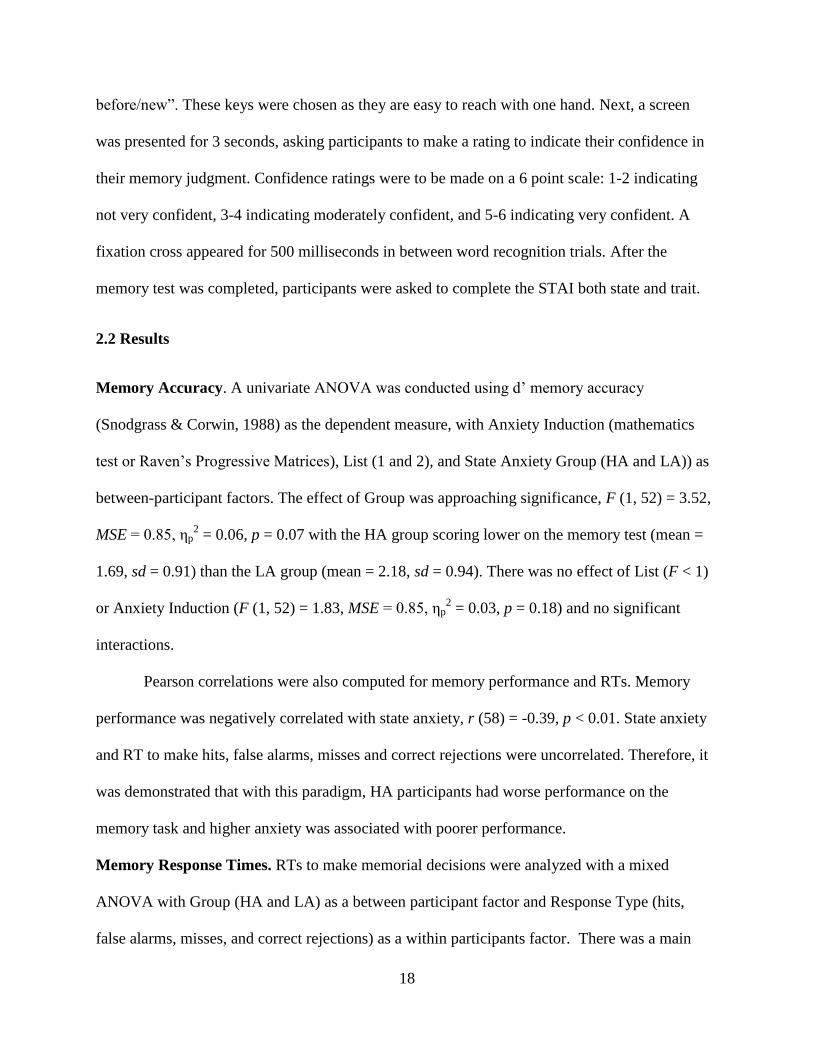
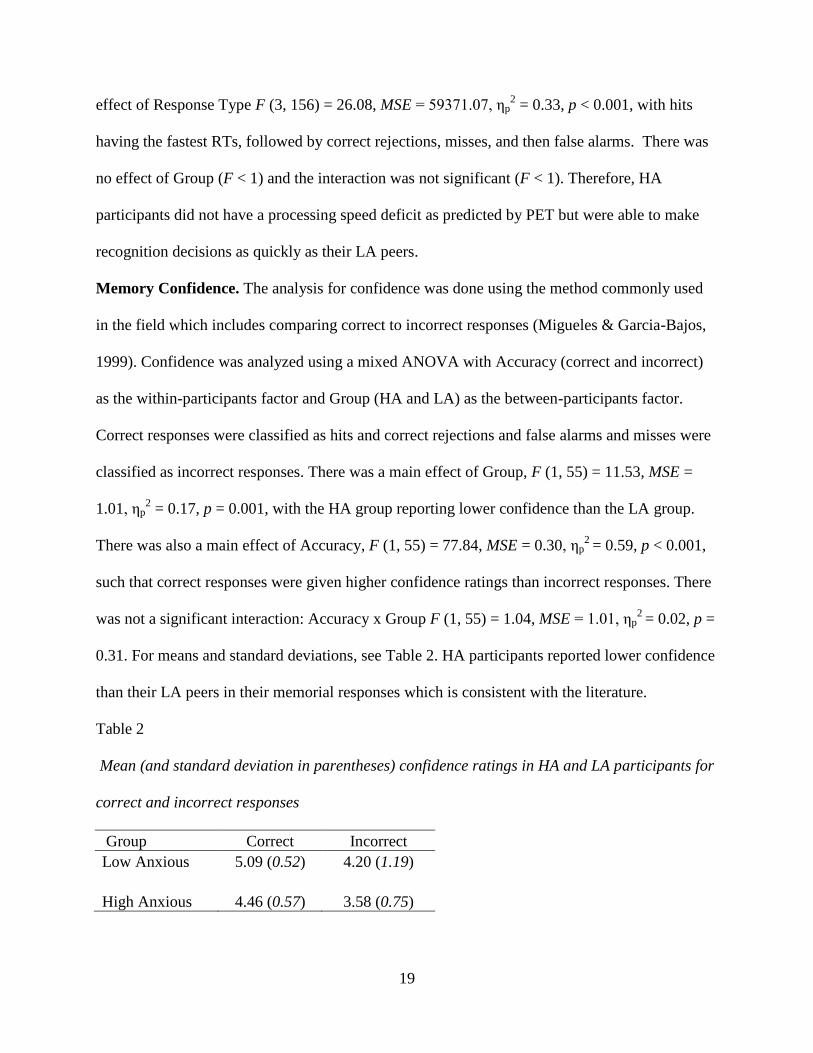
Memory Confidence. The analysis for confidence was done using the method commonly used
in the field which includes comparing correct to incorrect responses (Migueles & Garcia-Bajos,
1999). Confidence was analyzed using a mixed ANOVA with Accuracy (correct and incorrect)
as the within-participants factor and Group (HA and LA) as the between-participants factor.
Correct responses were classified as hits and correct rejections and false alarms and misses were
classified as incorrect responses. There was a main effect of Group, F (1, 55) = 11.53, MSE =
1.01, ηp2 = 0.17, p = 0.001, with the HA group reporting lower confidence than the LA group.
There was also a main effect of Accuracy, F (1, 55) = 77.84, MSE = 0.30, ηp2
= 0.59, p < 0.001,
such that correct responses were given higher confidence ratings than incorrect responses. There
was not a significant interaction: Accuracy x Group F (1, 55) = 1.04, MSE = 1.01, ηp2
= 0.02, p =
0.31. For means and standard deviations, see Table 2. HA participants reported lower confidence
than their LA peers in their memorial responses which is consistent with the literature.
Table 2
Mean (and standard deviation in parentheses) confidence ratings in HA and LA participants for
correct and incorrect responses
Group Correct Incorrect
Low Anxious 5.09 (0.52) 4.20 (1.19)
High Anxious 4.46 (0.57) 3.58 (0.75)
Page 28
20
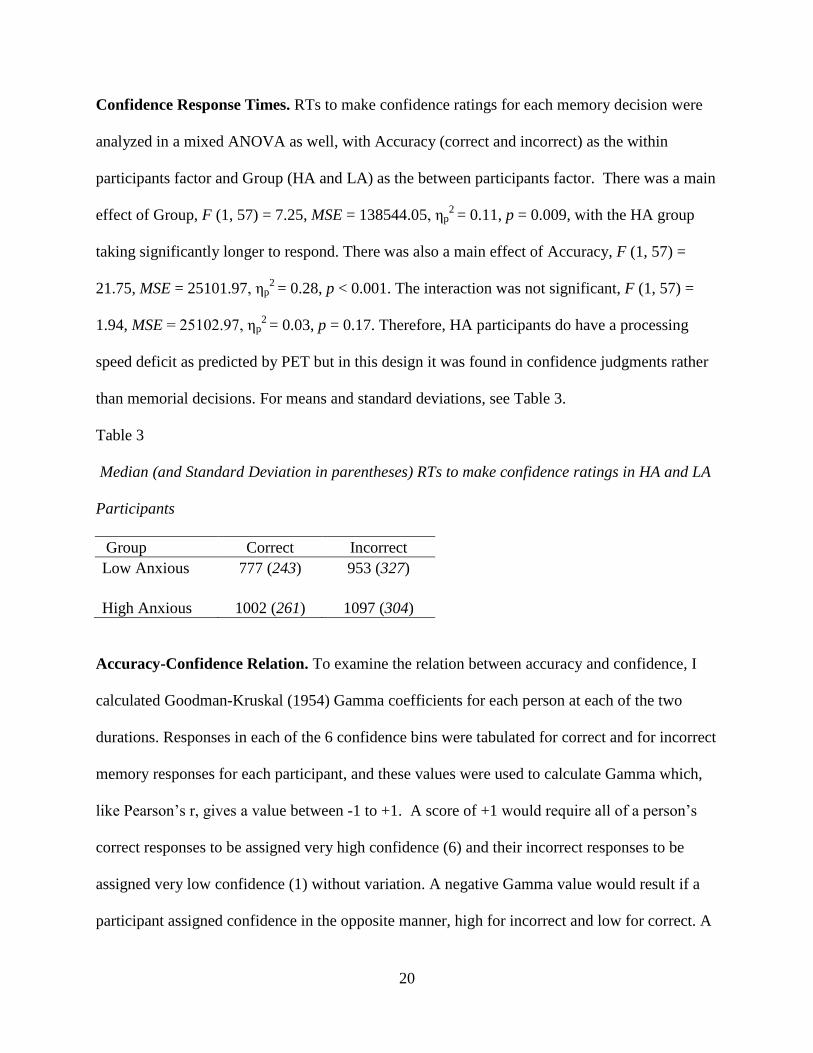
Confidence Response Times. RTs to make confidence ratings for each memory decision were
analyzed in a mixed ANOVA as well, with Accuracy (correct and incorrect) as the within
participants factor and Group (HA and LA) as the between participants factor. There was a main
effect of Group, F (1, 57) = 7.25, MSE = 138544.05, ηp2
= 0.11, p = 0.009, with the HA group
taking significantly longer to respond. There was also a main effect of Accuracy, F (1, 57) =
21.75, MSE = 25101.97, ηp2
= 0.28, p < 0.001. The interaction was not significant, F (1, 57) =
1.94, MSE = 25102.97, ηp2 = 0.03, p = 0.17. Therefore, HA participants do have a processing
speed deficit as predicted by PET but in this design it was found in confidence judgments rather
than memorial decisions. For means and standard deviations, see Table 3.
Table 3
Median (and Standard Deviation in parentheses) RTs to make confidence ratings in HA and LA
Participants
Group Correct Incorrect
Low Anxious 777 (243) 953 (327)
High Anxious 1002 (261) 1097 (304)
Accuracy-Confidence Relation. To examine the relation between accuracy and confidence, I
calculated Goodman-Kruskal (1954) Gamma coefficients for each person at each of the two
durations. Responses in each of the 6 confidence bins were tabulated for correct and for incorrect
memory responses for each participant, and these values were used to calculate Gamma which,
like Pearson’s r, gives a value between -1 to +1. A score of +1 would require all of a person’s
correct responses to be assigned very high confidence (6) and their incorrect responses to be
assigned very low confidence (1) without variation. A negative Gamma value would result if a
participant assigned confidence in the opposite manner, high for incorrect and low for correct. A
Page 29
21
Gamma value close to 0 would result if one assigned the same confidence to all response types
or assigned values randomly. The resulting Gamma correlations were analyzed using an
independent t-test. There was no significant effect of Group, t(58) = 0.54, p = 0.59. The HA
group had a mean gamma score of 0.44 (0.26) and the LA a mean of 0.49 (0.38). This means that
both groups confidence is equally predictive of memory accuracy; neither group is more realistic
than the other in their confidence ratings. Therefore, the HA groups is not more realistic in their
confidence judgements despite reporting less confidence than the LA group.
Skin Conductance. I measured skin conductance in microSiemens (μS) during 4 recording
blocks. Before any comparisons could be made between groups on skin conductance, data were
converted to account for individual differences in baseline reactivity. The Rose’s Range
correction was used (Lykken et al. 1966):
Converted value = SCix - SCmin__
SCmax - SCmin
where SCix is the value under examination, SCmin is the lowest value recorded by the participant
being analyzed and SCmax is the highest recorded value.
A mixed ANOVA was also conducted to examine the results of skin conductance, with
Group (HA and LA) and Anxiety Induction (mathamatics test and Raven’s Progressive Matrices)
as between-participants factors, and Recording Block (baseline, encoding, arousal induction, and
recognition) as the within-participants factor. Mauchly’s test of sphericity was significant for all
of the following ANOVAs so the Greenhouse-Geisser correction was used for all F statistics.
There was a main effect of Recording Block, F (1.40, 100.35) = 9.83, MSE = 0.14, ηp2
= 0.15, p
< 0.001, but no main effect of either Group (F < 1) or Anxiety Induction, F (1, 56) = 1.57, MSE
= 0.07, ηp2
= 0.03, p = 0.21. There were two significant interactions, Recording Block x Anxiety
Induction, F (1.79, 100.35) = 3.16, MSE = 0.14, ηp2 = 0.05, p = 0.03, and Group x Anxiety
Page 30
22
Induction, F (1, 56) = 6.01, MSE = 0.07, ηp2
= 0.02, p = 0.02. All other interactions were non-
significant (Fs < 1).
To explore the Anxiety Induction interactions, I ran 2 separate repeated measures
ANOVAs, one for each Anxiety Induction (mathematics test and Raven’s Progressive Matrices)
with Recording Block (baseline, encoding, arousal induction, and recognition) as the within
participants factor and Group (HA and LA) as the between participants factor. For the
mathematics test there was only a main effect of Block F (2.27, 63.50) = 13.03, MSE = 0.10, ηp2
= 0.32, p < 0.001 but no main effect of Group or interaction. For Raven’s Progressive Matrices
there was no effect of Block or interaction but there was a main effect of Group F (1, 28) = 4.79,
MSE = 0.07, ηp2
= 0.04, p < 0.05. In Raven’s, the LA Group had higher levels of arousal than the
HA group. These results do not support the prediction that skin conductance would be higher in
the HA than the LA group. There is also not a clear pattern across anxiety inductions.
2.3 Discussion
In the current study I considered the effect of anxiety on recognition memory and also
examined the participants’ confidence in their recognition judgments. My results provide
converging evidence with past studies suggesting that confidence ratings of memories are
reduced following anxiety-induction in anxious participants (Dobson & Markham, 2001; Nolan
& Markham, 1998; Ridley & Clifford, 2006; Valentine & Mesout 2009). I provided converging
evidence that anxiety can reduce memory performance (Cheie & Visu-Petra, 2012; Deffenbacher
et al., 2004; Dobson & Markham, 2001; Glover & Cravens, 1974; Salthouse, 2012; Valentine &
Mesout, 2009). Response times were found to be longer in the HA group, consistent with PET,
but only for confidence judgments and not memorial classifications. I also found that the
confidence and accuracy relation was not differentially predictive across the two groups.
Page 31
23
Several of my results map well on to Eysenck and Calvo’s (1992) PET, such as the
decrease in memory confidence and accuracy, but the RT predictions found less support. The
theory predicts that HA individuals experience more worry than their LA counterparts which in
turn leads to slowing of their cognitive processes. I did not find that RTs were longer for the HA
group on a binary memory decision, but I did find a nearly 200 ms delay in the HA group when
making confidence judgments. At first glance, such a pattern may seem out of line with PET, but
it could be that the HA group was deferring their task performance worry until the confidence
rating stage. PET states that the worry experienced in HA participants is related to task concerns.
Post-decisional processes, in this experiment confidence ratings, were more affected than the
initial memorial decisions. This finding suggests an amendment to PET such that worry slows
only post-decisional processes but not recognition decisions. Studies in the past that examined
anxiety, confidence, and memory, did not report RTs (Dobson & Markham, 2001, Nolan &
Markham, 1998, Ridley & Clifford, 2006) precluding comparison of my findings to others.
The correlations and comparisons between anxiety and memory accuracy, as well as
confidence, are more in line with PET. Poorer memory was associated with higher levels of state
anxiety. Unlike in the study by Dobson and Markham (2001), which instead of showing a
detriment in the HA group showed improvement in the LA group, I can be reasonably certain
that my manipulation decreased the performance of the HA group. Support comes from the
significant negative correlation between state anxiety and memory accuracy. My results are in
line with those of Valentine and Mesout (2009) who also found that state anxiety was associated
with decreased memory, perhaps because I, like Valentine and Mesout (2009), had long-lasting
anxiety manipulations that may have significantly elevated state anxiety in the HA group.
Page 32
24
My results also support PET and replicate past findings showing lower memory
confidence in HA compared to LA groups. Interestingly, even though the HA group was less
confident in their memorial ability, their confidence was equally as predictive of accuracy as the
LA group. Practically, this could be detrimental to HA individuals in everyday life as those who
are less confident are seen as less reliable when reporting their memories (Deffencbacher et al.,
2004). Indeed, Nolan and Markham (1998) found that the HA group was perceived by observers
to be less confident, in line with what the group members report themselves. Also, given that HA
participants took longer to make confidence decisions, HA individuals may require more time to
complete school tests because they do not have enough confidence that their responses are
correct.
Skin conductance was not found to be higher in the HA than the LA group and it also was
not correlated with either measures of memory accuracy or confidence. While this may seem
counter-intuitive, previous studies have reported similar findings to mine: the HA reporting high
levels of anxiety while having similar physiological responses to those in the LA group (Holroyd
et al., 1978). Eysenck and Calvo (1992) noted that physiological arousal appears to have a very
minor role in mediating the relation between anxiety and performance. I was optimistic that the
extended length of the anxiety manipulation would increase skin conductance but this was not
found; given this, skin conductance was not recorded in Experiments 2 and 3.
As I found that the HA group took more time to make confidence judgments, I was
interested in exploring what HA participants were doing with this extra time. In Experiment 2,
participants were given an opportunity to change their responses as a way of determining
whether anxious participants were critically analysing or “second-guessing” their responses prior
to making confidence judgments, thereby accounting for those longer RTs.
Page 33
25
3. Experiment 2: Anxiety and Response Switching
In Experiment 1, I found that HA participants were taking longer to make confidence
decisions, but not memory decisions, relative to their LA peers. This led me to question what the
HA participants were doing during that time. It is possible that they were critically analyzing
their responses as Eysenck and Calvo (1992) suggest that anxious participant spend time
engaged in worry which in the context of an experimental task could be task-focused. Given this
assumption, I hypothesized that HA participants might benefit from a chance to alter their
responses if they were indeed focused on the accuracy of their decisions.
Answer switching has been studied in the literature but mainly in the context of multiple
choice tests. It has been consistently found that when participants make response changes they
overwhelmingly improve test scores despite prevailing myths that answer switches are
inadvisable (Welch & Leichner, 1988; Geiger, 1991; Kruger et al., 2005). Most studies in this
area use data from real tests in university classes. One of these studies also examined confidence
and found that though 70% of participants had in fact increased scores though switches, they felt
confident that they had done worse on the test because of it (Geiger, 1991). Green (1981)
examined individual differences in test anxiety among graduate students taking a first year
statistics course. The researcher found that high test-anxious participants made more switches
overall and also had slightly lower net test scores as they switched more often to incorrect
responses. In the current experiment, I gave participants a chance to change their responses on
the memory task.
I decided to discontinue use of the skin conductance recording device as my recordings
did not detect a difference between the HA and LA group. To determine if the anxiety
manipulation was indeed effective and to ensure that participants did not have elevated levels of
Page 34
26
anxiety before the anxiety induction, I administered the STAI for most of my participants, both
before the experiment began and after it ended. I then examined these self-reported scores (for
state only) to ensure that the HA group was increasing in anxiety after the manipulation rather
than simply having a high baseline level.
I expected to replicate findings that the HA would make more answer switches than the
LA group for two reasons. It had been found in the literature previously (Green, 1981) and
because the HA spent more time making confidence judgments in Experiment 1 than the LA
group, which may indicate a greater propensity to consider responses critically. As for
confidence, two outcomes seemed reasonably possible. One was that, after switching, confidence
would decrease as participants have been found previously to believe they would do worse after
making change responses (Geiger, 1991; Kruger et al., 2005). The other possibility was that
confidence would increase as one study observed that, in an eyewitness context, repeated
questioning led to higher confidence over time (Shaw & McClure, 1996). I also expected that
confidence would be lower in the HA group as it was in Experiment 1 and longer response times
specifically for responses after the first memorial response. I predicted that the HA would have
lower memory accuracy than the LA group before answer switching, as in the first experiment,
but higher afterward based on the idea that they were realistically assessing their performance.
3.1 Method
Participants. Overall, 65 participants took part in this experiment and 59 were included in the
final analysis. The 6 participants who were excluded scored below chance on the memory test
suggesting that they were not following instructions. Participants were divided into HA (n = 24)
and LA (n = 35) groups based on their STAI score from when it was administered after the
experiment was completed (Speilberger et al., 1983) by the same criteria as Experiment 1. There
Page 35
27
were no significant differences in age (HA mean = 19.54 (1.35), LA mean = 19.57 (1.53)) or
years of education (HA mean = 14.46 (1.35), LA mean = 14.37 (1.45) between groups.
There were significant differences in state anxiety between groups, which was recorded
before and after the task for most participants (23 or ~1/3 participants did not complete the pre-
test state anxiety scale), and trait anxiety recorded at the end of the experiment. State anxiety was
recorded twice in two thirds of participants as I realized after starting data collection that without
the skin confuctance recording, a manipulation check was required. The HA group reported
higher state anxiety before test, t(34) = 9.59, p = 0.001, and after test, t(57) = 17.82, p < 0.0001,
and higher trait anxiety, t(57) = 13.17, p < 0.001, than the LA group (see Table 4 for means and
standard deviations), indicating that my manipulation was successful in elevating anxiety.
Importantly, state anxiety increased after the task only for the HA (t (15) = 2.34, p = 0.04) and
not for the LA (t (21) = 0.48, p = 0.64) group.
Table 4
Mean (and standard deviation) state and trait anxiety scores for the HA and LA groups
Group State Anxiety Before State Anxiety After Trait Anxiety
Low Anxious 29.48 (6.89) 30.26 (5.92) 34.82 (8.10)
High Anxious 39.07 (8.62) 48.08 (7.50) 48.00 (10.19)
Design. This experiment measured memory accuracy, confidence, response time, and the
relation between the accuracy-confidence as dependent variables for the two groups (HA and
LA) but I also examined trials where participants switched responses. All switched responses
were examined for accuracy, confidence, and response time.
Procedure and Materials. All materials were identical to those used in Experiment 1, the
exception being that for the anxiety induction I only used the RP as there was not a significant
Page 36
28
difference in results depending on which of the two inductions was employed in Experiment 1. I
also did not use the SC recording device as the results had not been significant in Experiment 1.
The procedure was identical to Experiment 1 except for the addition of an opportunity to
change one’s memory response, and a re-evaluation of one’s confidence. Participants completed
the STAI (state only) right before engaging in the memory task and then again after completing
the entire experiment. I did not use the standard instructions. The first time they completed the
state scale they were asked to report how they felt at the moment and the second time they were
instructed to report how they felt during the experiment. Trait anxiety was collected at the same
time as the second state anxiety and participants were asked to report how they felt in their
everyday lives. Specifically, after making the initial recognition decision and confidence
judgment as in Experiment 1, participants were given five seconds to change their response, to
which they could reply “yes” or “no” using the “y” and “n” keys. Participants were then asked to
rate their confidence for a second time, whether they had changed their response or not.
Participants were given 3s to make these responses, the same amount of time as their initial
recognition decision.
3.2 Results
Memory Accuracy. A 2 x 2 x 2 mixed ANOVA was conducted using d’ memory accuracy as
the dependent measure, with List (1 and 2) and State Anxiety Group (high anxiety (HA) and low
anxiety (LA)) as between-participant factors. Time (before switch and after switch) was the
within participants factor. There was no significant effect of List therefore it was excluded from
further analysis F (1, 55) = 2.45, MSE = 1.41, ηp2 = 0.04, p = 0.12. There was no significant
effect of Group F (1, 55) = 0.62, MSE = 1.41, ηp2 = 0.01, p = 0.44 or Time F (1, 55) = 0.50, MSE
Page 37
29
= 0.06, ηp2 = 0.01, p = 0.48 but there was a significant Group by Time Interaction F (1, 55) =
5.75, MSE = 0.06, ηp2 = 0.09, p = 0.02 (see Figure 1).
The interaction was explored using 2 paired t-tests, one for each group. For the LA group,
there was no significant difference in accuracy before (Time 1) to after having the opportunity to
switch memory responses (Time 2), t (34) = 1.39, p = 0.17. However, the HA group had a
trending effect of lower Accuracy after being given the option to change responses t (23) = 1.89,
p = 0.07 (see Figure 1). The groups started with similar levels of memory accuracy but after
making switch responses, the HA had worse memory performance than the LA group. Therefore
the answer-switching manipulation was not beneficial to the HA group in that it did not increase
memory performance.
Figure 1
Figure 1. Mean memory accuracy by group with error bars displaying standard error of the
mean
Memory Switch Responses. Overall, out of 3449 responses (~60 responses per participant as
some participants missed button presses), participants changed their answers 128 times. While
that seems very low (3.71% of responses overall), it is similar to other studies in this area (Welch
0
0.5
1
1.5
2
2.5
3
Before Change After Change
Mem
ory
Acc
ura
cy (
d')
Time
Low-anxious
High-anxious
Page 38
30
& Leichner, 1988). Ten participants did not make a change in any of their memory responses (n
HA = 2, n LA = 8). The HA group made 47 incorrect switches and 18 correct while the LA
group made 30 switches to incorrect and 33 to correct. This difference was tested using chi-
square and was found to be significant across Groups (HA and LA), χ2(1, N = 128) = 8.14, p =
0.004 (see Table 5 for means). Therefore, answer switching did not affect the LA group but was
a detriment to the HA group meaning that this manipulation was not beneficial to HA
participants.
Table 5
Number and percentage of participants in each group who increased, decreased, or maintained
their original memory accuracy level after changing responses (participants who did not make
any switches were excluded)
Group Increased Decreased Maintained
Low Anxious (n = 27) 12 (44%) 10 (37%) 5 (19%)
High Anxious (n = 22) 6 (27%) 14 (63%) 2 (9%)
Memory Response Times. RTs to make memory decisions were analyzed using two
independent t-tests, one for the first memory response and a second for the possible switch
response. The results were analyzed using a mixed ANOVA with Response (response 1 and
switch response) as the within-participants factor and Group (HA and LA) as the between-
participants factor. There was a main effect of Response F (1, 57) = 171.16, MSE = 63474.62,
ηp2 = 0.75, p < 0.001 such that the initial memory response took longer than the switch response.
There was no main effect of Group (F = 1) but there was a significant Response x Group
interaction F (1, 57) = 5.37, MSE = 63474.62, ηp2 = 0.09, p = 0.02.
Page 39
31
I followed up with two independent t-tests, one for each response type (response 1 and
switch response). In the t-test for the first memory response, there was not a significant effect of
Group (t <1). The second t-test of RT to make switch response revealed a significant effect of
Group t (1, 57) = 2.44, p = 0.02 such that the HA took longer to make their decision than the LA
group. This shows evidence of a processing speed deficit in the HA group. See Table 6 for
means and standard deviations. Therefore, in this experiment, the finding that the HA group
takes longer to make post-memorial decisions than the LA group has been upheld as the option
to switch is, similar to the confidence decisions in the previous experiment, an opportunity for
the participant to critically evaluate their performance.
Table 6
Median (and Standard Deviation in parentheses) response times (in milliseconds) for memory
decisions in HA and LA Participants
Group
RT for Hits Before
Change
RT for Hits After
Change
Low Anxious 1340 (310) 613 (233)
High Anxious 1285 (228) 777 (280)
Response Time Switch Responses. To determine whether participants took longer when
switching an answer, a 2 x 2 mixed ANOVA was conducted with RT as the dependent measure
and Group (HA and LA) as the between participants factor and Response Type (change or no
change) as the within-participants factor. There was a significant effect of Response Type, F (1,
47) = 7.23, MSE = 65597.88, ηp2 = 0.13, p = 0.01, such that participants took longer to make a
response when they changed their answer compared to when it remained the same. There was not
a main effect of Group, F (1, 47) = 1.86, MSE = 129504.03, ηp2 = 0.04, p = 0.18, or an
interaction (F < 1).
Page 40
32
Confidence. A 2 x 2 x 2 mixed ANOVA was conducted with confidence as the dependant
measure and Group (HA and LA) as the between participants factor. Time (before switch and
after switch) and Accuracy (correct and incorrect) were the within participants factors. There
was a main effect of Time, F (1, 57) = 13.81, MSE = 0.09, ηp2 = 0.20, p < 0.001, such that
participants were more confident after than before they were asked if they wanted to modify their
responses. There was also a main effect of Accuracy, F (1, 57) = 161.82, MSE = 0.32, ηp2 = 0.74,
p < 0.001, such that correct responses were rated higher in confidence than incorrect responses.
There was also a Time x Accuracy interaction, F (1, 57) = 2.45, MSE = 0.08, ηp2 = 0.12, p =
0.007. The effect of Group and all other interactions were not significant (all Fs < 1) (see Figure
2).
To explore the source of the Time x Accuracy interaction 2 follow-up mixed ANOVAs
were conducted, one for each Accuracy (correct and incorrect). For Correct responses, there was
a main effect of Time, F (1, 57) = 6.26, MSE = 0.01, ηp2 = 0.10, p = 0.02. For Incorrect
responses, the effect size of Time was significant and larger, F (1, 57) = 11.25, MSE = 0.15, ηp2
= 0.17, p = 0.001, than for correct responses (see Figure 2), accounting for the interaction. There
was no significant effect of Group nor an interaction with Time (all Fs < 1). Therefore, in
Experiment 2, the HA was not found to be less confident than the LA group, suggesting that the
ability to switch answers increased confidence in HA participants. However, while increasing
confidence was a goal of this manipulation, it was not accompanied by an increase in memory
accuracy.
Page 41
33
Figure 2
Figure 2. Mean reported confidence before and after change response by item accuracy; error
bars show standard error of the mean
Confidence Switch Responses. The 128 switch responses were analyzed separately with a
mixed 2 x 2 ANOVA with Time (before switch and after switch) as the within and Group (HA
and LA) as the between participants factor. There was a main effect of Time, F (1, 126) = 27.34,
MSE = 1.56, ηp2 = 0.18, p < 0.001, such that confidence increased after switching a response.
There was a trending Time X Group interaction F (1, 126) = 3.18, MSE = 1.56, ηp2 = 0.03, p =
0.08 and no main effect of Group, F (1, 126) = 2.48, MSE = 4.57, ηp2 = 0.02, p = 0.12.
Confidence Response Times. RTs to make Confidence ratings were analyzed in the same
manner as confidence scores: a 2 x 2 x 2 mixed ANOVA was conducted with confidence as the
dependent measure and Group (HA and LA) as the between-participants factor. Time (before
switch and after switch) and Accuracy (correct and incorrect) were the within-participants
factors. There was a main effect of Time, F (1, 57) = 11.92, MSE = 94024.52, ηp2 = 0.17, p =
0.001, with participants making confidence judgments more quickly after being given the option
to switch responses. There was also a main effect of Accuracy, F (1, 57) = 52.24, MSE =
0
1
2
3
4
5
6
Before Change After Change
Co
nfi
den
ce
Time
Inaccurate
Accurate
Page 42
34
28054.69, ηp2 = 0.48, p < 0.001, such that participants were quicker to respond when correct.
There was also a Time x Accuracy interaction, F (1, 57) = 14.07, MSE = 25518.14, ηp2 = 0.20, p
< 0.001 (see Figure 4). There was no significant effect of Group, F (1, 57) = 1.51, MSE =
210790.17, ηp2 = 0.03, p = 0.22, and all other interactions were not significant (Fs < 1) (see
Figure 3).
The interaction between Time and Accuracy was explored in 2 follow-up ANOVAs, one
for each Accuracy. For Correct responses, the effect of Time was non-significant, F (1, 57) =
2.85, MSE = 36988.34, ηp2 = 0.05, p = 0.10. There was no significant effect of Group, F (1, 57) =
2.25, MSE = 110275.45, ηp2 = 0.04, p = 0.14 and the interaction was also not significant (F < 1).
For Incorrect responses, there was a main effect of Time, F (1, 57) = 16.64, MSE = 82554.32, ηp2
= 0.23, p < 0.001, with participants responding more quickly after the opportunity to switch.
There was no main effect of Group or interaction (Fs < 1). Therefore, in the current experiment,
a processing speed deficit was not found for confidence but rather for switch responses in the HA
group. As deciding to switch responses is also a post-memorial decision this evidence does not
conflict with the Experiment 1.
Figure 3
0
200
400
600
800
1000
1200
1400
Before Change After Change
Res
po
nse
Tim
e (m
s)
Time
Inaccurate
Accurate
Page 43
35
Figure 3. Mean confidence response time in milliseconds before and after making the change
response by accuracy; error bars show standard error of the mean
Confidence Response Time for Switch Responses. To determine whether participants took
longer to report confidence when switching an answer, a 2 x 2 mixed ANOVA was conducted
with RT as the dependent measure and Group (HA and LA) as the between participants factor
and Response Type (change or no change) as the within participants factor. There was a
significant effect of Response Type, F (1, 47) = 25.99, MSE = 109761.08, ηp2 = 0.36, p < 0.0001,
such that participants took longer to make a confidence response when they changed their answer
compared to when it remained the same. There was not a main effect of Group, F (1, 47) = 1.57,
MSE = 187342.18, ηp2 = 0.03, p = 0.22, or an interaction (F < 1). Therefore, in this experiment,
the only time that HA participants took longer than their LA peers was when making the decision
to switch their answer or not. Neither confidence judgment was slower.
Confidence-Accuracy Relation. The accuracy-confidence relation was examined by calculating
Gamma coefficients for each individual participant. I compared Gamma using a 2 x 2 ANOVA
with Group (HA and LA) as the between-participants factor and Time (before switch and after
switch) as the within-participants factor. There was a main effect of Time, F (1, 57) = 8.15, MSE
= 0.17, ηp2 = 0.13, p = 0.006, such that participants’ resolution became lower after the change.
This means that participants’ confidence became a poorer predictor of their accuracy over time.
There was no significant effect of Group nor an interaction (Fs < 1). See Table 7 for means and
standard deviations. Therefore, neither group was more realistic in their confidence ratings,
though with repeated questioning, confidence became a poorer indicator of accuracy. This
means that once again, it was not found that HA participants more realistically appraise their
performance.
Page 44
36
Table 7
Mean (and standard deviation in parentheses) Gamma coefficients in HA and LA Participants
Group Gamma Before Change Gamma After Change
Low Anxious 0.56 (0.28) 0.42 (0.38)
High Anxious 0.59 (0.21) 0.48 (0.22)
3.3 Discussion
In the current experiment I examined the memory accuracy, response time, and
confidence of HA and LA participants when they were able to modify responses. I examined
whether having the opportunity to modify responses would increase memory accuracy or
confidence in the HA group as it was possible that they were re-evaluating their responses during
confidence rating in Experiment 1. As in Experiment 1, I found reduced memory accuracy in the
HA compared to the LA group, though this time it was only after they modified their responses. I
also found that the post-decision response took longer to make in the HA group, though in this
experiment (unlike in Exp. 1) it was the switch response rather than confidence judgments that
showed the Group effect on slowing. In the current experiment, I found that the HA was just as
confident as the LA group which is different from others’ findings (Nolan & Markham, 1998;
Dobson & Markham, 2001; Ridley & Clifford, 2006; Valentine & Mesout 2009) as well as from
my findings from Experiment 1. However, it could be that knowing they would have the
opportunity to switch responses helped the HA group to feel more confident in their responses.
As for the switched responses themselves, I found that the HA group made more switches
overall and that they were more often wrong when they switched. This is in line with the findings
of Green (1981), who also reported higher rates of switching and lower test scores in a HA
group. For the LA participants, switching was not beneficial to them as a group but left the
Page 45
37
average score unchanged. As for individual participants, outcomes were split between those who
increased, decreased, and maintained their original scores. Usually an improvement in scores is
reported in the literature (Welch & Leichner, 1988; Geiger, 1991; Kruger et al., 2005), though
this may be related to how accuracy was scored. In multi-alternative choice examinations, which
were used in all the experiments that found a facilitation of response switching, it was possible to
have a wrong to wrong switch that did not change accuracy.
As for memory confidence, I found that confidence increased by the second response,
regardless of whether participants changed their responses. The reason that I did not observe the
drop in confidence after switching normally found in other experiments that examined multiple
choice tests is most likely because I did not use the multi-alternative choice format (Geiger,
1991; Kruger et al., 2005). As cited by Welch and Leichner (1988), students are often advised
orally or even in written instructions that they should “go with their first impression” in multiple
choice examinations. Therefore researchers have found that participants become less confident
when they switch answers on a multiple choice test (Geiger, 1991; Kruger et al., 2005).
Participants may not have extended this idea to my task as they only were able to make two
responses: yes and no. I did find support though, for the evidence provided by Shaw and
McClure (1996) that repeated questioning can lead to higher confidence over time without
influencing accuracy. In their experiment, memory tests were administered over several weeks or
several days and confidence was shown to increase over the course of five examinations. In the
current experiment, I was able to show a rapid increase of confidence, as participants reported
higher confidence the second time, regardless of whether they had made a switch response. The
act of confirming their decision increased confidence in both groups.
Page 46
38
I did not uncover group differences in resolution of the accuracy-confidence relation.
Yet, there was an increased level of confidence without accuracy increases after the option to
switch responses, which led to lower overall gamma correlations. This result is similar to that of
Shaw and McClure (1996), who also observed an increase of confidence but not memory
accuracy in their experiment resulting in a loss of statistical correlation between accuracy and
confidence. In my experiment, the accuracy-confidence relation was maintained though it did
decrease significantly from before to after the change response. It is possible that if I had
provided additional chances to confirm or change response the data would have more closely
resembled those of Shaw and McClure (1996).
As in Experiment 1, I did not find that the HA took longer to make memory decisions
than the LA group, despite the decrease in task effectiveness found in the HA group. This
suggests that an amendment is needed to PET such that anxious participants can defer worry
until after a recognition decision has been made. In my next experiment, I was interested in
exploring whether these results would hold even without the presence of an anxiety
manipulation.
Page 47
39
4. Experiment 3: Role of encoding duration (Delleman & Fernandes, under revision).
In the final experiment of my master’s thesis, I explored the effects of anxiety without having
an induction manipulation. I also added a manipulation of encoding duration in hopes that
increased time to memorize items would ameliorate the memory accuracy and confidence in HA
individuals. In addition, I again explored RTs and the accuracy-confidence relation between HA
and LA participants.
Encoding duration has been known to influence both memory accuracy and confidence as
well as the relation between them. It is known that longer encoding time increases memory
accuracy for studied words (Craik & Rabinowitz, 1985; Eisdorfer et al., 1963; Grenfell-Essam et
al., 2013; Smith and Kimball, 2012) and that memory confidence increases as well (,
Deffenbacher, 1980; Memon et al., 2003). The relation between accuracy and confidence,
however, is less established. Bothwell and colleagues (1987) found in their meta-analysis that
longer exposure to faces resulted in better predictability of accuracy from confidence judgments.
Research by Memon and colleagues (2003), however, showed that the accuracy-confidence
relation may be influenced negatively by increased encoding time. They manipulated exposure
time during a simulated crime in which a culprit’s face was shown either for 12s or 45s. While
overall accuracy was greatly improved in the longer exposure condition, participants who made
inaccurate identifications were just as confident as those who made accurate ones. In the short
exposure condition, there was a significant difference in confidence levels based on accuracy.
The authors suggested that longer exposure times unrealistically inflated witness confidence
rather than making participants more realistic in their confidence ratings.
In the current experiment, I was interested in determining the effect of encoding time on
the accuracy-confidence relation on long-term memory, as well as determining if this would be
Page 48
40
different in HA and LA participants. Previous research has found that time limits are particularly
anxiety-provoking in those with test anxiety (Mattarella-Micke et al. 2011). I hypothesized that
longer encoding times might specifically help the HA group become more confident in their
responses, bringing their overall confidence closer to that of the LA group. To test the effect of
encoding time in the current experiment I presented words for either 750 ms or 4000 ms. These
encoding durations were chosen because previous research in memory and perception estimate
that 1000 ms is sufficient time to encode a verbatim memory, while shorter durations lead to
more gist-based memories (Smith & Magee, 1980). Participants were subsequently asked to
make a recognition decision about each word and to rate their confidence in their responses. I, in
accordance with the work of Bothwell and colleagues (1987), hypothesized that the longer
relative to shorter encoding time would lead to superior memory accuracy and higher confidence
in correct responses as well as higher resolution in the accuracy-confidence relation.
In the current experiment, anxiety was not manipulated in an effort to explore the role of
trait anxiety rather than reaction to an anxiety induction. In addition, there is a chance that
anxiety manipulations may have a motivating effect especially on the LA group (Nolan &
Markham, 1998). I assessed anxiety using the State–Trait Inventory for Cognitive and Somatic
Anxiety (STICSA; Ree, MacLeod, French, & Locke, 2000), which is designed to assess
cognitive and somatic symptoms of anxiety as they pertain to one’s mood in the moment (state)
and in general (trait). I used this scale because it has been shown that the resulting scores are less
confounded with depression and therefore thought to be a purer measure of anxiety (Gr s et al.,
2007). I conducted a median split of the sample to create HA and LA groups instead of using a
normative score for this experiment because the STICSA ( Gr s et al., 2007) does not have the
same wealth of normative data as the STAI (Speilberger et al., 1983). I used trait anxiety rather
Page 49
41
than state anxiety because without a direct manipulation of anxiety I expected state anxiety to be
quite low and therefore have small variance in scores between participants. I compared HA and
LA groups on memory performance, confidence ratings, and the accuracy-confidence relation. I
predicted that those with HA would have lower confidence overall compared to the LA group. I
also predicted that encoding time would enhance accuracy and confidence in both groups. I was
interested in determining whether a longer encoding duration would be more beneficial for HA
than LA participants, and would help them to become more confident in their responses, bringing
their overall confidence closer to that of the LA group.
4.1 Method
Participants. There were 137 undergraduate students from the University of Waterloo who took
part in the experiment. Twenty participants were excluded: 2 for computer errors that
inadvertently terminated the experiment, 11 for having response times on memory decisions 3
SD above or below the mean, and 7 because their memory accuracy as indexed by d’ was zero or
below in the 4000ms encoding duration memory test, indicating that they were not following
instructions or paying sufficient attention to the task. None of the participants had ever been
diagnosed, been treated for, or currently had depression or clinical anxiety disorders.
The remaining 117 participants were separated into HA and LA groups based on a
median split of trait anxiety scores from STICSA. The STICSA is a 21-item questionnaire in
which participants rate, on a 4-point Likert scale, the frequency of somatic and cognitive
components of anxiety. Test instructions are designed to assess ‘state anxiety’ by asking
participants to respond based on how they felt during the experiment and to assess ‘trait anxiety’
by asking participants to respond based on frequency of occurrence of each symptom in their
everyday lives. Participants were divided into HA and LA groups based on a median split of the
Page 50
42
trait anxiety score. Fifty-seven participants scored 32 and above making up the HA group (33
male, Age = 20.02, sd = 1.72, Years of Education = 14.48, sd = 1.50). Fifty-nine participants
scored 31 and lower, making up the LA Group (29 male, Age = 20.24, sd = 1.72, Years of
Education = 14.69, sd = 1.29). Neither age nor years of education differed significantly across
groups (t (115) = 0.87, p = 0.39, t (115) = 0.47, p = 0.64).
Both state and trait anxiety scores differed significantly across groups. State t (115 =
6.78, p < 0.001 and trait anxiety t (115) = 15.89, p < 0.001 were higher in the HA than LA group
(for means and standard deviations, see Table 8). The HA group reported higher trait anxiety
than that reported in a normative study of control participants from Grös and colleagues (2007),
but lower than that reported by clinical samples within that study. State and trait anxiety scores,
collapsed across groups, were positively correlated, r (115) = 0.60, p < 0.001. Scores were
positively correlated in the LA group (r (58) = 0.50, p < 0.001), and trended towards significance
in the HA group, r (57) = 0.23, p = 0.08. This difference is most likely due to the HA group
reporting relatively low rates of state anxiety but high trait anxiety whereas the LA group
reported low anxiety on both measures.
Table 8
Mean (and standard deviation) state and trait anxiety scores for the HA and LA groups
Group State Anxiety Trait Anxiety
Low Anxious 26.46 (5.19) 25.68 (3.17)
High Anxious 34.60 (7.60) 40.78 (6.56)
Design and Materials. I compared memory accuracy, confidence, as well as the accuracy-
confidence resolution in the two groups. This was both a within- (long vs. short encoding
duration) and between- (HA vs. LA) participant design.
Page 51
43
Memory task materials. The same word lists from Experiment 1 and 2 were used in this
experiment. For the purposes of this experiment, each list was divided randomly into 2 lists, one
for each encoding block of 750 or 4000 ms.
Procedure. A computer task was designed using E-prime (v.2.2 software, Psychology Software
Tools Inc., Pittsburg, PA) to control stimulus presentation on a 17” computer monitor and
response recording for the memory task. Participants were tested individually in a quiet room.
Encoding was separated into two blocks of 15 words which were both presented before
the recognition test. Words were presented one at a time, for either a short (750 ms) or long
(4000 ms) duration depending on the block, counterbalanced across participants. Prior to each
block, participants were instructed that the list would be presented either quickly or slowly and
were told to remember all of the words as best they could. After completing both blocks of
encoding, they were asked to count backwards by threes from 200 for 30 s, during which time
the computer screen was blank, to reduce recency effects.
Following encoding of words from both encoding durations, the recognition phase began.
Participants completed two different 30-item recognition test blocks, one for each encoding
block, with order counterbalanced across participants. Participants were informed prior to each
test block that they would be presented with a list of words, half of which came from the short
(or long) encoding block, and half of which were brand new, unstudied, words. Each recognition
block contained 15 ‘old’ words and 15 lures. It was emphasized to participants that the
recognition blocks were not mixed (e.g., no words would appear from the ‘short duration’ list
during the ‘long duration’ recognition block). In each recognition block, words were presented
sequentially on the screen for 6000 ms followed by a fixation cross for 500 ms. During
presentation of each word, participants were asked to make an ‘old’ or ‘new’ recognition
Page 52
44
decision by pressing the ‘n’ or ‘m’ key respectively, on a QWERTY keyboard. Following that
decision, they made a rating indicating their confidence in their decision on a 6-point scale using
the number keys on the top row of the keyboard: 1-2 indicating not very confident, 3-4 indicating
moderately confident, and 5-6 indicating very confident.
After recognition was completed, participants were asked to complete the STICSA. Prior
to commencing the experimental phase, participants completed an encoding phase consisting of a
5-word list at 2000 ms duration followed by a practice 10-word recognition memory test with the
same presentation rate as the experimental test, consisting of the 5 studied words and 5 lures, to
familiarize participants with stimulus presentation and timing.
4.2 Results
Memory1. Memory accuracy was computed using d’ (Snodgrass & Corwin, 1988), which was
calculated as z hits minus z false alarms, and analyzed using a mixed ANOVA with Duration
(750 ms and 4000 ms) as the within-participant factor and Group (HA and LA), as well as Order
of experimental conditions (1-8), as between-participant factors. As expected, there was a main
effect of Duration, F (1, 113) = 53.13, MSE = 0.49, ηp2 = 0.32, p < 0.001, with all participants
achieving higher d’ scores for words presented in the long compared to short duration block at
encoding. The main effect of Group was significant, F (1, 113) = 3.74, MSE = 0.80, ηp2 = 0.04, p
= 0.03, with the LA group having higher d’ scores than the HA group. All interactions and other
effects were not significant. As Order was not significant, it was not included in further analysis.
Means and standard deviations for both groups are presented in Table 9. In the current
1 Regardless of whether groups were formed using a median split based on trait or state scores from
STICSA, the direction of results was the same.
Page 53
45
experiment therefore, I again replicated previous results of reduced memory performance in the
HA compared to the LA group despite the lack of anxiety-induction.
Table 9
Mean recognition memory performance measured as d’ (with standard deviations in
parentheses) following short and long encoding durations in HA and LA Groups
Group Duration 750 ms Duration 4000 ms
Low Anxious 1.60 (0.77) 2.23 (0.94)
High Anxious 1.30 (0.65) 2.01 (0.83)
Memory Response Times. Memory RTs were analyzed using a mixed ANOVA with Duration
(750 ms and 4000 ms) as the within-participants factor and Group (HA and LA) as the between-
participants factor. There was a main effect of Duration, F (1, 115) = 6.07, MSE = 25589.97, ηp2
= 0.05, p = 0.02, such that participants took longer to respond for the words presented for 750 ms
than those presented for 4000 ms. There was no main effect of Group, F (1, 115) = 1.11, MSE =
110116.72, ηp2 = 0.01, p = 0.30, or interaction, F (1, 115) = 1.78, MSE = 25589.97, ηp
2 = 0.02, p
= 0.18. Therefore, I have shown for the third time that there is not a processing speed deficit in
recognition decisions in the HA group.
Confidence. Confidence was analyzed in a mixed ANOVA with Duration (750 ms and 4000 ms)
and Accuracy (correct and incorrect) as the within-participant factors and Group (HA and LA) as
the between-participant factor. Participants who did not have any incorrect responses (i.e., no
false alarms or misses; n = 8, 4 HA and 4 LA) were excluded from this analysis. Overall, the LA
group made 669 incorrect (or 19%) and the HA group made 773 incorrect (or 23%) responses.
There was a main effect of Duration, F (1, 103) = 13.30, MSE = 0.51, ηp2 = 0.12, p < 0.001, with
words encoded in the longer duration block having higher reported confidence. There was also a
main effect of Accuracy, F (1, 103) = 105.20, MSE = 0.58, ηp2 = 0.51, p < 0.001, with
Page 54
46
participants reporting higher confidence for correct answers. The main effect of Group was non-
significant (F < 1). There was a significant Accuracy x Group interaction, F (1, 103) = 4.55,
MSE = 0.58, ηp2 = 0.04, p = 0.04, and a significant Accuracy x Duration interaction, F (1, 103) =
27.19, MSE = 0.35, ηp2 = 0.21, p < 0.001 (see Figure 4). The Group X Duration and the three-
way interaction were non-significant (F < 1).
Figure 4
0.00
1.00
2.00
3.00
4.00
5.00
6.00
Correct Incorrect
Co
nfi
den
ce
Accuracy
LA
HA
0.00
1.00
2.00
3.00
4.00
5.00
6.00
Correct Incorrect
Co
nfi
den
ce
Accuracy
750ms
4000ms
Page 55
47
Figure 4. Top panel shows mean confidence reported with standard error bars for accuracy by
group. Bottom panel shows mean confidence reported with standard error bars for accuracy by
encoding duration.
The significant 2-way interactions were explored by conducting 2 additional mixed
ANOVAs, one for Accurate and one for Inaccurate responses with Duration (within) and Group
(between) as factors. For Inaccurate responses, there were no main effects or interactions (all Fs
< 1). For Accurate responses, the main effect of Duration was significant, F (1, 115) = 41.29,
MSE = 0.51, ηp2 = 0.27, p < 0.001, with participants reporting higher confidence in their
responses to words from the longer encoding duration. There was also a significant main effect
of Group, F (1, 115) = 5.26, MSE = 1.01, ηp2 = 0.04, p = 0.02, with the HA reporting
significantly lower confidence in correct responses compared to the LA group. The Group X
Duration interaction was non-significant, F (1, 115) = 1.79, MSE = 0.52, ηp2 = 0.02, p = 0.18. In
this experiment, HA again report lower confidence than the LA participants despite the lack of
an anxiety-induction. This suggests that the decreased confidence found in the literature and in
this series of experiments may be a semi-permanent state for HA individuals.
Confidence Response Times. Confidence was analyzed in a mixed ANOVA with Duration (750
ms and 4000 ms) and Accuracy (correct and incorrect) as the within-participant factors and
Group (HA and LA) as the between-participant factor. As with confidence, participants who did
not have any incorrect responses were excluded from this analysis. There was a main effect of
Duration, F (1, 103) = 9.81, MSE = 44782.39, ηp2 = 0.09, p = 0.002, such that participants took
longer to respond when rating confidence for 4000 ms than 750 ms words. There was also a main
effect of Accuracy, F (1, 103) = 34.48, MSE = 43630.01, ηp2 = 0.25, p < 0.001, such that
participants were faster to respond when correct than incorrect. The effect of Group approached
Page 56
48
significance, F (1, 103) = 2.62, MSE = 288052.31, ηp2 = 0.03, p = 0.109, with the HA responding
more slowly than the LA group. There was also a Duration x Accuracy interaction, F (1, 103) =
5.32, MSE = 24028.01, ηp2 = 0.05, p = 0.02 (see Figure 5). No other interactions were significant
(Fs < 1).
The significant 2-way interactions were explored by conducting 2 additional mixed
ANOVAs, one for Accurate and one for Inaccurate responses with Duration (within) and Group
(between) as factors. For Accurate responses, there was no longer a main effect of Duration (F <
1) or Group, F (1, 115) = 2.15, MSE = 336132.70, ηp2 = 0.02, p = 0.15, and the interaction was
also non-significant (F < 1). For Inaccurate responses, there effect of Duration remained, F (1,
103) = 9.50, MSE = 54776.86, ηp2 = 0.08, p = 0.003, in the same direction as before and there
was also a trending effect of Group, F (1, 103) = 3.62, MSE = 177163.84, ηp2 = 0.03, p = 0.060,
such that the HA was responding more slowly than the LA group. This finding again confirms
what was found in Experiments 1 and 2, that the HA group takes more time than the LA group to
make post-memorial decisions but not the initial recognition judgment.
Page 57
49
Figure 5
Figure 5. Top panel shows mean confidence response times with standard error bars for
accurate responses by group. Bottom panel shows mean confidence response times with
standard error bars for inaccurate responses by group.
Accuracy-Confidence Resolution. To examine the relation between accuracy and confidence, I
calculated Goodman-Kruskal (1954) Gamma coefficients for each person at each of the two
durations. The resulting Gamma correlations were analyzed using a mixed ANOVA with
Duration (750 ms and 4000 ms) as the within-participants factor and Group (HA and LA) as the
0
200
400
600
800
1000
1200
1400
750ms 4000ms
Co
nfi
de
nce
Re
spo
on
se T
ime
s (n
s)
Encoding Duration
Low Anxious
High Anxious
0
200
400
600
800
1000
1200
1400
750ms 4000ms
Co
nfi
de
nce
Re
spo
nse
Tim
es
(ms)
Encoding Duration
Low Anxious
High Anxious
Page 58
50
between-participants factor. There was a main effect of Duration, F (1, 115) = 16.21, MSE =
0.08, ηp2 = 0.12, p < 0.001, with higher Gamma correlations for the longer encoding duration
block. There was also a significant effect of Group, F (1, 115) = 5.12, MSE = 0.21, ηp2 = 0.04, p
= 0.04, such that the LA group had higher Gamma correlations than the HA group. The Group x
Duration interaction was non-significant, F (1, 115) = 1.07, MSE = 0.08, ηp2 = 0.01, p = 0.30.
Means and standard deviations are shown in Table 10. Therefore, in this experiment a difference
in resolution was found between the HA and LA groups, however, the HA group was not found
to be more realistic, instead under-confidence led to a poorer predictive association between
confidence and memory accuracy.
Table 10
Mean Gamma coefficients (with standard deviations in parentheses) following short and long
encoding durations in HA and LA Groups
4.3 Discussion
I examined memory accuracy and confidence, as well as the relation between these
measures, for words presented at two different encoding durations in participants with high and
low self-reported levels of anxiety. I aimed to determine whether HA individuals had more or
less realistic appraisals of confidence than LA participants and to explore whether a longer
encoding duration would increase confidence in the HA group. While encoding duration did not
lead to a differential benefit in HA and LA participants, I demonstrated the expected finding that
longer encoding time improves memory and increases confidence. I also showed that differences
in self-reported anxiety led to significant deficits in memory accuracy, consistent with some
Group Duration 750ms Duration 4000ms
Low Anxious 0.46 (0.34) 0.57 (0.44)
High Anxious 0.29 (0.35) 0.47 (0.38)
Page 59
51
studies (Cheie & Visu-Petra, 2012; Dodson & Markham, 2001; Glover & Cravens, 1974;
Salthouse, 2012; Valentine & Mesout, 2009) and Experiment 1 and 2. In line with other research,
my HA group showed lower confidence judgments than those in the LA group (Nolan &
Markham, 1998; Ridley & Clifford, 2006; Valentine & Mesout, 2009). I additionally showed
that longer encoding duration improves the accuracy-confidence resolution, suggesting that
longer encoding times lead to a more realistic appraisal of confidence instead of over-confidence
as suggested by Memon and colleagues (2003) since overconfidence would have led to less
positive accuracy-confidence Gamma correlations.
I did not find that encoding duration led to any differential effects for HA and LA
participants, although I did replicate past findings of higher memory accuracy with longer
encoding duration (Craik & Rabinowitz, 1985; Eisdorfer et al., 1963; Grenfell-Essam et al.,
2013; Smith & Kimball, 2012). I also supported Bothwell and colleagues’ (1987) assertion that
longer encoding durations results in a higher accuracy-confidence resolution. I acknowledge,
however, that the low number of incorrect trials in my study may limit the strength of my
conclusion. Yet, the ratio of difference between correct and incorrect trails that went into the
Gamma correlation is similar to that reported in other studies using this statistic (Bornstien &
Zickafoose, 1999, Brewer & Sampaio, 2006). My findings run counter to Memon and
colleagues’ (2003) findings that longer encoding leads to overconfidence in false alarms. Memon
and colleagues (2003) used much longer encoding durations, of 12 s and 45 s, than in my
experiment, which may also be the reason for the disparity in results as the researchers argued
that the participants felt that after such a long encoding duration they “ought” to know the
answer. Their experiment also had a simultaneous line-up presentation during recognition, and it
has been demonstrated previously (Deffenbacher, 1980) that forced choice tasks of this nature
Page 60
52
result in higher confidence judgments overall, compared to single response presentation, as was
used in my experiment.
The accuracy-confidence relation in this experiment was analyzed using Gamma
correlations and it was shown that high levels of self-reported anxiety reduced the accuracy-
confidence correlation, regardless of encoding duration. Gamma correlations are driven by the
difference in participant’s confidence between correct and incorrect responses. The HA group
had low levels of confidence specifically for correct responses which meant that the difference
between correct and incorrect responses was smaller than in the LA group, accounting for the
low correlation between accuracy and confidence in the HA group. My findings support the
suggestion by Ridley and Clifford (2006) that HA participants have unrealistically low reports of
confidence in their accurate responses. I was unable to determine whether this effect was driven
by state or trait anxiety as both were significantly higher in the HA group and they were also
correlated.
My results show that increasing encoding time is beneficial to memory accuracy,
confidence, and the relation between them. Moreover, I demonstrated that HA have poorer
accuracy-confidence resolution than LA individuals. My results suggest that anxious individuals
have less realistic confidence ratings than their low-anxious peers, and increasing encoding
duration did not alleviate this deficit.
Page 61
53
5. General Discussion
Across three experiments, I examined how individual differences in anxiety in a non-
clinical population influenced memory, confidence, and the relation between them. It was
consistently found that the anxious group had poorer memory, lower confidence and/or greater
hesitation when evaluating memory decisions. Experiments 1 and 3 found both of these while in
Experiment 2 confidence was not different between anxious and low-anxious participants. In
addition, I did not find any evidence that anxious participants are more realistic in their
assessments of confidence; instead, the anxious group was either equal to the low-anxious group
or less realistic. Two manipulations were introduced in an attempt to increase confidence and
accuracy in the anxious group: the ability to modify responses and longer encoding durations.
Longer encoding time did not differentially improve the anxious group while the ability to
modify responses increased confidence but actually decreased accuracy. Overall, this series of
experiments shows that even non-clinical levels of anxiety can impair memory performance even
without any overt manipulation or induction of anxiety.
Anxiety and Memory
Not all studies have found that high levels of anxiety reduce memory, especially when
anxiety is induced experimentally. One of the studies that did not find an effect of anxiety on
memory (Taylor, 1958) used ego threat (that is telling participants that they are performing
worse than others) as an anxiety manipulation. Given that persons with high anxiety have been
found to be especially sensitive to negative appraisal (Eysenck & Calvo, 1992), they may have
increased task effort to avoid additional negative evaluation, thereby inadvertently enhancing
memory performance. Similarly, Nolan and Markham (1998) induced anxiety by showing
participants video recordings of their responses while they were recalling details of a crime, and
Page 62
54
informed participants that their responses would be watched by raters afterwards. It is resonable
to assume that in that situation anxious participants would have again been aware of possible
negative evaluation by others and increased task effort to avoid embarrassment, again enhancing
memory in this group.
For this reason, I tested memory accuracy in HA and LA participants both when anxiety
was induced and when it was not. When inducing anxiety in Experiment 1 and 2, I did not use
ego threat, which could increase on-task effort, but instead introduced an unrelated but anxiety-
provoking task. In the second experiment, I did not induce anxiety at all, though there is some
concern that the memory test and experimental setting would induce some anxiety on its own,
and memory deficits in the HA group still emerged. These effects were more subtle and I
required a much larger sample size than in Experiments 1 and 2. By not including a direct
manipulation of anxiety in Experiment 3, I was able to suggest that there are individual
differences that extend beyond particularly anxiety-provoking settings.
Processing Efficiency Theory and Long-term Memory
I have shown consistently throughout these three experiments that processing efficiency
on a word recognition task, as indexed by RT, was not affected by anxiety. Instead, I saw a
decrease in effectiveness, memory accuracy, without corresponding RT differences. Differences
in RTs emerged in every experiment but they were all in post-decision processes, rating
confidence or deciding whether to change a response. This suggests that, in a design where a
response can be evaluated after it is made, highly anxious individuals are able to defer task-
performance worry until that time. Clearly, in all experiments, HA participants were able to
identify or reject a word as quickly as their LA peers. This finding suggests an amendment to
processing efficiency theory (PET) such that worry slows only post-decisional processes and not
Page 63
55
recognition decisions themselves. Studies in the past that examined anxiety, confidence, and
memory did not report RTs (Dodson & Marksham, 2001; Nolan & Markham, 1998; Ridley &
Clifford, 2006) making it difficult to compare my findings to others.
Interestingly, and in line with my findings, a study in clinical participants by MacDonald
and colleagues (1997) also failed to find support for PET on a long-term memory test. The
experiment compared patients with checking subtype obsessive-compulsive disorder (OCD),
other subtypes of OCD, and healthy controls. Participants were asked to remember a list of
words and response times and confidence were also recorded. There was a marginal difference in
RTs between the checking group and the other two collapsed but no other contrasts were
significant. Unfortunately, confidence response times were not reported. The researchers argued
that the results may not have been significant because participants were given unlimited time to
respond and were also not given instructions about responding as quickly as possible. In my
experiments both of those elements were present and an RT difference was still not observed. In
addition, the non-checker OCD group had an average RT that was virtually identical to the
controls despite having very high levels of state anxiety. This provides converging evidence from
a clinical sample that in long-term memory task, processing efficiency is not affected before
effectiveness.
Memory Confidence and Anxiety
I replicated past findings of reduced memory confidence in Experiments 1 and 3 but not
in Experiment 2, where HA and LA participants had similar levels of confidence. Lower
confidence has been found in most examinations of sub-clinical anxious participants (Nolan &
Markham, 1998; Ridley & Clifford, 2006; Valentine & Mesout, 2009), yet one examination of
clinical participants that also included a sub-clinical anxious group found that confidence in that
Page 64
56
group did not differ from controls (Tuna et al., 2005). As the answer-switching paradigm from
Experiment 2 had not been used in previous studies and as the effect of anxiety on confidence
has been reasonably consistent in the literature, my results suggest that knowing there would be
an opportunity to switch answers increased the confidence of the HA group. In addition, there
was not a large difference in overall confidence between experiments (average overall
confidence was consistently about 5.00 on a 1-6 point scale).
Experiment 3 also showed that the lack of confidence in HA individuals, reported in the
literature, is present even in the absence of a specific anxiety induction. This suggests that
individuals with high levels of trait anxiety may experience low levels of confidence often,
especially when engaged in tasks that test their memories. This effect was alleviated when
participants were given time to change their responses but not when encoding time was
lengthened. More investigation would be required to determine whether this apparently persistent
lack of confidence interferes with everyday functioning and whether there would be performance
improvements in this population if their confidence deficits were ameliorated.
The Accuracy and Confidence Relation
Across the 3 experiments, I only discovered a difference in the accuracy-confidence
relation once, when I did not directly induce anxiety. When anxiety was induced, highly anxious
participants had similar resolution to the low anxiety group. My findings overall suggest that
Ridley and Clifford (2004) were correct in their assertion that highly anxious participants are less
realistic than their low-anxious peers. Despite low-anxious participants often being found to be
overconfident (Adams & Adams, 1960; Chua et al., 2012; Fichhoff et al., 1977), the HA group
has been shown to be under-confident, though not always to a level that affects their accuracy-
confidence relation.
Page 65
57
Since there was not an experiment in the sub-clinical literature that performed similar
analysis to mine, I examined the clinical literature. An experiment that examined both OCD
patient checkers and sub-clinical checkers on memory for words found that OCD patients had
gamma correlations that were not significantly different from zero (Tuna et al., 2005). The sub-
clinical participants were not different from the control group and both scored within the normal
range found in similar experiments. This experiment included both a paired-recall test and a
forced-choice recognition test. However, the control sample had higher levels of state and trait
anxiety than my sample since inclusion in that group was dependent on checking symptoms and
not anxiety. There was also no anxiety induction included in this experiment. Despite above
average levels of anxiety in the sub-clinical group in this experiment, no memory deficits and no
deficit in confidence were found relative to the controls. Again, this may be because of the
grouping criteria. This experiment again provides converging evidence with mine as the most
highly anxious group did not have a reliable accuracy-confidence relation.
Limitations and Conclusions
There are several limitations to this thesis that will be discussed here. Firstly, the
distinction between anxious and low-anxious participants was varied across experiments as I
used two different standardized tests, the STAI and the STICSA. STICSA was used in
Experiment 3 because it has been reported to be less confounded with depression and has also
been found to be well correlated with STAI results (Grös et al., 2007). I also separated the groups
in Experiments 1 and 2 by the normative average on STAI, but in Experiment 3 performed a
median split. The reason for this difference was twofold. Firstly the STICSA does not have the a
wealth of normative data that the STAI does so I was not as certain of the average level of
anxiety found in undergraduate students, and second, anxiety levels were much lower overall in
Page 66
58
Experiment 3 as there was not a direct manipulation of anxiety so it would have been difficult to
use the same cut-off scores as Experiments 1 and 2.
In all the experiments, cut-off scores were used to divide participants into high and low
anxiety groups. There are two commonly used ways of dividing participants into anxiety groups:
experimenters can use the extreme ends of the scale to represent each group (e.g., the upper and
lower quartiles) or a single cut-off point (e.g., either a median split or a point derived from
normative data). However, in this study we wanted to use data from all participants and therefore
opted to use a single cut-off score for grouping. Because of this participants were included who
fell only 1 point apart from each other on the STIA or STICSA scale and yet were in different
groups. There is not a theoretical difference in 1 point on either of those scales. However, as this
experiment was concerned with healthy undergraduate students without clinical anxiety, there
was restriction in the range of scores provided because a high enough score would denote
clinical anxiety. Methods of dividing participants into high versus low-anxious groups in past
literature have been varied as well, with some experiments using different scales such as the Test
Anxiety Scale (Dobson & Markham, 2001, Nolan & Markham, 1998) and those who used the
STAI using median splits (Valentine & Mesout, 2011), or analyzing results using anxiety as a
continuous variable (Salthouse, 2012). A higher level of standardization in the classification of
participants in this area of research might help to produce more consistent results in cognitive
performance in anxious persons.
In addition, I was unable to establish a difference is arousal levels through SC to confirm
self-report levels of anxiety. Eysenck and Calvo (1992) noted that it is extremely difficult to
match physiological arousal with self-reported anxiety. The researchers suggested that part of the
reason for this may be that even with similar levels of arousal, anxious participants report higher
Page 67
59
self-perceived arousal than low-anxious individuals. Valentine and Mesout (2011) measured
arousal using heart rate in a manipulation check during their London Dungeon experiment and
found that changes in heart rate accounted for fifty-eight percent of the variance in state anxiety.
However, their experiment had a much higher level of state anxiety reported (average of 49
overall) and a much longer anxiety induction (~ 45 minutes). In Experiment 1, I was unable to
show an association between SC and state anxiety, even during my ten-minute anxiety induction.
Unfortunately, the transient nature of the association between self-reported anxiety and
physiological arousal can make results less convincing as self-report measures can be flawed.
However, even with these limitations, this series of experiments has uncovered some
interesting new evidence. First, I discovered and then confirmed that when participants are given
time to evaluate responses through confidence ratings or deciding to change an answer, there is
not a processing speed deficit in anxious participants for the recognition response. Anxious
participants are able to make recognition decisions from long-term memory as quickly as their
low-anxious peers. I also showed that when reviewing responses, either with a confidence
judgment or a decision to modify an answer, anxious participants had longer response times,
indicating greater hesitation or worry. This finding does not support processing efficiency theory
which predicts that processing speed deficits should be present in recognition judgments in
anxious individuals. The increased hesitation seen in post-memorial evaluation may have
practical implications. Anxious individuals may require greater amounts of time when
completing tests as they need more time to reflect on their memory classifications. Despite
normal processing speed for memory responses, from my evidence it seems likely that on a test
an anxious person would take longer moving from one question to another because they would
be evaluating the accuracy of their previous response.
Page 68
60
Second, I introduced two manipulations in an attempt to alleviate the effect of anxiety on
both memory accuracy and confidence, both of which were lower in the anxious group in
Experiment 1. Neither of these manipulations resulted in the anxious group reaching parity with
the low-anxious except in the case of Experiment 2, where anxious participants were no longer
significantly different in confidence from the low-anxious group. However, an increase in
confidence is not helpful to the anxious group without an accompanying increase in memory
accuracy. The two manipulations had different effects: increased encoding time, while not
beneficial to a greater amount in the anxious than low-anxious group, did improve memory
accuracy scores for the anxious group, while the ability to change responses decreased accuracy.
Therefore, in a practical sense, anxious individuals should be encouraged, with the rest of the
population, to study information longer if they wish to recognize it with greater accuracy, but
unlike low-anxious individuals, anxious persons might not want to change their memorial
responses on examinations.
Further work is required for the response switching paradigm, though, as I did not test
anxious individuals using a multiple-choice paradigm. Multiple-choice questions and answer
switching have been studied more extensively because multiple choice is a common testing
method in both high school, university, and on standardized tests such as the SAT and GRE.
Lastly, I have replicated past findings that anxious participants report lower levels of
confidence on tests of long-term memory, and I have expanded this finding by examining how
realistic or predictive of accuracy this level of confidence is in anxious and low-anxious
participants. Overall, anxious participants had either the same predictive resolution or had lower
predictive resolution when compared to their low-anxious peers. This relation has not been tested
extensively in the literature. This finding is important, because given the frequency of
Page 69
61
overconfidence reported in the literature, it was possible that anxious individuals were reporting
lower confidence because they were better able to assess their own performance. This view was
not supported. As such, results indicate that anxious participants are under-confident; this lack of
confidence could be affecting their everyday functioning. It is possible that anxious persons are
less likely to speak up in discussions because they doubt their responses, are less likely to be
selected as witnesses in court (Dobson & Markham, 2001), and are perceived by others as less
reliable (Nolan & Markam, 1998). For these reasons, I would encourage future research to
explore ways of alleviating the effects of anxiety on long-term memory to help anxious
individuals to respond more accurately and to feel more confident in their abilities.
Page 70
62
References
Adams, P. A., & Adams, J. K. (1960). Confidence in the recognition and reproduction of words
difficult to spell. The American Journal of Psychology,73(4), 544-552.
Bitterman, E., & Holtzman, H. (1952). Conditioning and extinction of the galvanic skin response
as a function of anxiety. The Journal of Abnormal and Social Psychology, 47, 615-623.
Bornstein, B. H., & Zickafoose, D. J. (1999). " I know I know it, I know I saw it": The stability
of the confidence–accuracy relationship across domains. Journal of Experimental
Psychology: Applied, 5(1), 76-88.
Bothwell, R. K., Deffenbacher, K. A., & Brigham, J. C. (1987). Correlation of eyewitness
accuracy and confidence: Optimality hypothesis revisited. Journal of Applied
Psychology, 72(4), 691-695.
Bradley M. M., & Lang J. (1999). Affective norms for English words (ANEW). Gainesville, FL.
NIMH Centre for the Study of Emotion and Attention, University of Florida.
Brewer, W. F., & Sampaio, C. (2006). Processes leading to confidence and accuracy in sentence
recognition: A metamemory approach. Memory, 14(5), 540-552.
Cheie, L., & Visu-Petra, L. (2012). Relating individual differences in trait-anxiety to memory
functioning in young children: An investigation with task-irrelevant emotional
stimuli. Journal of Individual Differences, 33(2), 109-118.
Craik, F. I., & Rabinowitz, J. C. (1985). The effects of presentation rate and encoding task on
age-related memory deficits. Journal of Gerontology, 40(3), 309-315.
Chua, E. F., Hannula, D. E., & Ranganath, C. (2012). Distinguishing highly confident accurate
and inaccurate memory: Insights about relevant and irrelevant influences on memory
confidence. Memory, 20(1), 48-62.
Page 71
63
Dobson, M. & Markham, R. (2001). Individual differences in anxiety level and eyewitness
memory. The Journal of General Psychology, 199, 343-350.
Deffenbacher, K. A. (1980). Eyewitness accuracy and confidence. Law and Human
Behavior, 4(4), 243-260.
Deffenbacher, K., Bornstein, B., Penrod, S., & McGorty, K. (2004). A meta-analytic review of
the effects of high stress on eyewitness memory. Law and Human Behavior, 6, 687-
706.
Eisdorfer, C., Axelrod, S., & Wilkie, F. L. (1963). Stimulus exposure time as a factor in serial
learning in an aged sample. Journal of Abnormal and Social Psychology, 67(6), 594.
Eysenck, M. W. (1979). Anxiety, learning, and memory: A reconceptualization. Journal of
Research in Personality, 13(4), 363-385.
Eysenck, M. W., & Calvo, M. G. (1992). Anxiety and performance: The processing efficiency
theory. Cognition & Emotion, 6(6), 409-434.
Eysenck, M. W., Derakshan, N., Santos, R., & Calvo, M. G. (2007). Anxiety and cognitive
performance: Attentional control theory. Emotion, 7(2), 336-353.
Fischhoff, B., Slovic, P., & Lichtenstein, S. (1977). Knowing with certainty: The appropriateness
of extreme confidence. Journal of Experimental Psychology: Human Perception and
Performance, 3(4), 552-564.
Fitzgerald, R. J., Oriet, C. & Price, H. L. (2011). Change detection inflates confidence on a
subsequent recognition task. Memory, 19, 879-890.
Page 72
64
Gabbert, F., Memon, A., & Wright, D. B. (2007). I saw it for longer than you: The relationship
between perceived encoding duration and memory conformity. Acta
Psychologica, 124(3), 319-331.
Geiger, M. A. (1991). Changing multiple-choice answers: Do students accurately perceive their
performance? Journal of Experimental Education. 59(3), 250-257.
Glover, C. B., & Cravens, R. W. (1974). Trait anxiety, stress, and learning: A test of Saltz's
hypothesis. Journal of Research in Personality, 8(3), 243-253.
Goodman, L. A. & Kruskal, W. H. (1954). Measures of association for cross
classifications. Journal of the American Statistical Association, 49, 732–764.
Green, K. (1981). Item-response changes on multiple-choice tests as a function of test
anxiety. Journal of Experimental Education, 49(4), 225-28.
Grenfell-Essam, R., Ward, G., & Tan, L. (2013). The role of rehearsal on the output order of
immediate free recall of short and long lists. Journal of Experimental Psychology:
Learning, Memory, and Cognition, 39(2), 317-347.
Grös, D. F., Antony, M. M., Simms, L. J., & McCabe, R. E. (2007). Psychometric properties of
the State-Trait Inventory for Cognitive and Somatic Anxiety (STICSA): Comparison to
the State-Trait Anxiety Inventory (STAI).Psychological Assessment, 19(4), 369-381.
Hermans, D., Engelen, U., Grouwels, L., Joos, E., Lemmens, J., & Pietersa, G. (2008)
Cognitive confidence in obsessive-compulsive disorder: Distrusting perception, attention
and memory. Behavior Research and Therapy, 46, 98–113.
Hyman, T., & Gale, N. (1973). Galvanic skin response and reported anxiety during systematic
desensitization. Journal of Consulting and Clinical Psychology, 40, 108-114.
Page 73
65
Kizilbash, A. H., Vanderploeg, R. D., & Curtiss, G. (2002). The effects of depression and
anxiety on memory performance. Archives of Clinical Neuropsychology, 17(1), 57-67.
Krug, K. (2007). The relationship between confidence and accuracy: Current thoughts of the
literature and a new area of research. Applied Psychology in Criminal Justice, 3(1), 7-41.
Kruger, J., Wirtz, D., & Miller, D. T. (2005). Counterfactual thinking and the first instinct
fallacy. Journal of Personality and Social Psychology, 88(5), 725-735.
Kucera, H., & Francis, W. N. (1967) Computational analysis of present-day American English,
1967. Providence, RI: Brown University Press.
Liebert, R. M., & Morris, L. W. (1967). Cognitive and emotional components of test anxiety: A
distinction and some initial data. Psychological Reports, 20(3), 975-978.
Lykken, D.T., Rose, R., Luther, B., & Maley, M. (1966). Correcting psychophysiological
measures for individual differences in range. Psychological Bulletin, 66, 481-484.
Maloney, E., Risko, E., Ansari, D., & Fugelsang, J. (2010). Mathematics anxiety affects counting
but not subitizing during visual enumeration. Cognition, 114, 293-297.
Macdonald, P. A., Antony, M. M., Macleod, C. M., & Richter, M. A. (1997). Memory and
confidence in memory judgments among individuals with obsessive compulsive disorder
and non-clinical controls. Behaviour Research and Therapy,35(6), 497-505.
Mattarella, A., Mateo, J., Kozak, M., Foster, K., & Beilock, S. (2011). Choke or thrive? The
relation between salivary costisol and math performance depends on individual
differences in working memory and math anxiety. Emotion, 11, 1000-1005.
McNally, R. J., & Kohlbeck, P. A. (1993). Reality monitoring in obsessive–compulsive
disorder. Behavior Research and Therapy, 31, 249–253.
Page 74
66
Memon, A., Hope, L., & Bull, R. (2003). Exposure duration: Effects on eyewitness accuracy and
confidence. British Journal of Psychology. 94, 339-354.
Migueles, M., & Garcia-Bajos, E. (1999) Recall, recognition, and confidence patterns in
eyewitness testimony. Applied Cognitive Psychology, 13, 257-268.
Nelson, T. O. (1984). A comparison of current measures of the accuracy of feeling-of-knowing
predictions. Psychological Bulletin, 95(1), 109-133.
Nolan, J. & Markham R. (1998) The accuracy-confidence relationship in eyewitness task:
Anxiety as a modifier. Applied Cognitive Psychology, 12, 43-54.
Ononaiye, M., Turpin, G., & Reidy J. (2007) Attentional bias in social anxiety: manipulation of
stimulus duration and social-evaluative anxiety. Cognitive Therapy and Research. 31,
727-740.
Raven, J.C., Court, J.H., & Raven, J. (1983). Advanced Progressive Matrices. London, England.
J. C. Raven Ltd.
Ree, M. J., MacLeod, C., French, D., & Locke, V. (2000, November). The State–Trait Inventory
for Cognitive and Somatic Anxiety: Development and validation. Poster session
presented at the annual meeting of the Association for the Advancement of Behavior
Therapy, New Orleans, LA.
Ridley, A., & Clifford, B. (2006). Suggestibility and state anxiety: How the two concepts relate
in a source identification paradigm. Memory, 14(1), 37-45.
Salthouse, T. A. (2012). How general are the effects of trait anxiety and depressive symptoms on
cognitive functioning? Emotion, 12(5), 1075-1084.
Smith, T. A., & Kimball, D. R. (2012). Revisiting the rise and fall of false recall: Presentation
rate effects depend on retention interval. Memory, 20(6), 535-553.
Page 75
67
Smith, M. C., & Magee, L. E. (1980). Tracing the time course of picture–word
processing. Journal of Experimental Psychology: General, 109(4), 373-392.
Snodgrass, J. G., & Corwin, J. (1988). Pragmatics of measuring recognition memory:
Applications to dementia and amnesia. Journal of Experimental Psychology:
General, 117, 34 –50.
Speilberger, C. (1983) State-trait anxiety inventory (form Y). Palo Alto: Mind Garden.
Sporer, S. L., Penrod, S., Read, D., & Cutler, B. (1995). Choosing, confidence, and accuracy: A
meta-analysis of the confidence-accuracy relation in eyewitness identification
studies. Psychological Bulletin, 118(3), 315-327.
Taylor, J. A. (1958). The effects of anxiety level and psychological stress on verbal
learning. Journal of Abnormal Psychology, 57(1), 55.-60.
Tuna, S., Tekcan, A. I., & Topcuoglu, V. (2003). Memory and metamemory in obsessive–
compulsive disorder. Behaviour Research and Therapy, 43, 15–27.
Vetrugno, R., Liguori, R., Cortelli, P., & Montagna, P. (2003) Sympathetic skin response: Basic
mechanisms and clinical applications. Clinical Autonomic Research. 13, 256-270.
Valentine, T., & Mesout J., (2009) Eyewitness identification under stress in the London
Dungeon. Applied Cognitive Psychology, 23, 151-161.
Watts, F. N., Dalgleish, T., Bourke, P., & Healy, D. (1990). Memory deficit in clinical
depression: Processing resources and the structure of materials. Psychological Medicine:
A Journal of Research in Psychiatry and the Allied Sciences, 20, 345-349.
Wechsler, D. (1997). Wechsler Adult Intelligence Scale-III. San Antonio, TX: The Psychological
Corporation.
Page 76
68
Welch, J., & Leichner, P. (1988). Analysis of changing answers on multiple-choice examination
for nationwide sample of Canadian psychiatry residents. Academic Medicine, 63(2), 133-
135.