Page 1
University of New MexicoUNM Digital Repository
Speech and Hearing Sciences ETDs Electronic Theses and Dissertations
Summer 7-11-2018
The Effect of Breathy and Strained Vocal Quality onVowel PerceptionSarah NiemanUniversity of New Mexico
Follow this and additional works at: https://digitalrepository.unm.edu/shs_etds
Part of the Speech and Hearing Science Commons
This Thesis is brought to you for free and open access by the Electronic Theses and Dissertations at UNM Digital Repository. It has been accepted forinclusion in Speech and Hearing Sciences ETDs by an authorized administrator of UNM Digital Repository. For more information, please [email protected] .
Recommended CitationNieman, Sarah. "The Effect of Breathy and Strained Vocal Quality on Vowel Perception." (2018). https://digitalrepository.unm.edu/shs_etds/22
Page 2
Running head: VOCAL QUALITY DEFICITS AND VOWEL PERCEPTION
i
Sarah Rose Nieman, B.A. Candidate
Department of Speech and Hearing Sciences
Department
This thesis is approved, and it is acceptable in quality and form for publication:
Approved by the Thesis Committee:
Amy T. Neel, Ph.D., CCC-SLP , Chairperson
Phyllis Palmer, Ph.D., CCC-SLP
Rick Arenas, Ph.D.
Page 3
Running head: VOCAL QUALITY DEFICITS AND VOWEL PERCEPTION
ii
THE EFFECT OF BREATHY AND STRAINED VOCAL
QUALITIES ON VOWEL PERCEPTION
by
SARAH R. NIEMAN
B.A. SPEECH AND HEARING SCIENCES, SPANISH
THESIS
Submitted in Partial Fulfillment of the
Requirements for the Degree of
MASTER OF SCIENCE
SPEECH-LANGUAGE PATHOLOGY
The University of New Mexico
Albuquerque, New Mexico
JULY, 2018
Page 4
VOCAL QUALITY DEFICITS AND VOWEL PERCEPTION
iii
ACKNOWLEDGEMENTS
I am extremely grateful to Dr. Neel for her time, expertise, and
support throughout this process. I’d like to thank her for welcoming me into
her lab as an undergraduate, for allowing me to be her graduate assistant,
and for asking me to do a thesis. I never would have thought I could do it.
Our ability to hold full conversations without content words is one of my
favorite memories of graduate school.
Thank you to the listeners in this study for their time. Thank you to
members of my thesis committee, Dr. Arenas and Dr. Palmer, for their
technological know-how and research savvy. Thank you to Sofiya
Krasilshchikova for her tenacious data-crunching.
Page 5
VOCAL QUALITY DEFICITS AND VOWEL PERCEPTION
iv
The Effect of Breathy and Strained Vocal Quality on Vowel Perception
Sarah R. Nieman
B.A., Speech and Hearing Sciences, Spanish, University of New Mexico,
2016
M.S., Speech-Language Pathology, University of New Mexico, 2018
ABSTRACT
INTRODUCTION: Research into speech intelligibility in dysarthria historically focuses
on articulation deficits. However, voice quality deficits associated with motor speech
disorders may also impact speech perception. This study investigates how breathy and
strained vocal quality affects vowel identification and ratings of vowel goodness.
METHODS: A healthy speaker recorded vowels with normal, simulated breathy and
simulated strained voice quality. Acoustic, physiologic, and perceptual measures
confirmed the presence of the desired voice deficits. 16 volunteer listeners participated in
three perceptual tasks: vowel identification, vowel goodness ratings, and voice quality
ratings.
RESULTS: In the voice quality rating task, listeners detected voice quality deficits with
ease. Breathy and strained stimuli were rated as significantly poorer in voice quality
than normal stimuli. The voice quality deficits did not appear to impact vowel
identification: identification accuracy for all three sets was high (95% and above) and
scores did not differ significantly across the three sets of vowels. Listener judgments of
vowel goodness, however, were affected by voice quality. Breathy and strained vowels
were rated as significantly poorer than normal vowels. In addition, listeners needed more
Page 6
VOCAL QUALITY DEFICITS AND VOWEL PERCEPTION
v
time to rate the articulatory goodness of the disordered stimuli and replayed them more
often while making their goodness judgments.
CONCLUSION: Simulation of voice quality deficits appears to be a valid way of
assessing the impact of speech factors beyond articulation on the perception of disordered
speech. Stimuli with simulated breathiness and strain were rated as poorer in voice
quality than normally voiced vowels, indicating that voice quality is salient to
listeners. Although identification accuracy was not affected by voice quality deficits,
breathy and strained vowels were judged as poorer in articulatory goodness than normally
voiced vowels. Abnormal voice quality appeared to interfere with listener judgments of
the articulatory goodness of vowels. Voice quality deficits associated with dysarthria
may affect speech perception by causing increased listener effort even if speech
intelligibility is not directly affected. Further study of the effect of voice quality in more
realistic listening conditions (e.g., in noise) with more complex speech stimuli (e.g.,
sentences or conversation) will help determine the need for phonatory treatment of
dysarthric speech.
Page 7
VOCAL QUALITY DEFICITS AND VOWEL PERCEPTION
vi
TABLE OF CONTENTS
AKNOWLEDGEMENTS ...........................................................................iii
ABSTRACT ..................................................................................................iv
LIST OF FIGURES .....................................................................................viii
LIST OF TABLES .......................................................................................ix
INTRODUCTION/LITERATURE REVIEW ..........................................1
Speech Production .........................................................................................1
Speech Intelligibility ......................................................................................2
Dysarthria in Neurogenic Disorders ..............................................................4
Vowels in Dysarthria .....................................................................................6
Vowels in Parkinson Disease .........................................................................7
LSVT and Loud Speech .................................................................................8
Aims ...............................................................................................................9
METHOD .....................................................................................................12
Participants .....................................................................................................12
Stimuli ............................................................................................................12
Objective Measures .............................................................................13
Subjective Measures ...........................................................................14
Procedure .......................................................................................................15
Training ...............................................................................................15
Tasks ...................................................................................................15
Vowel Identification .............................................................15
Vowel Goodness ...................................................................16
Quality Goodness .................................................................17
Page 8
VOCAL QUALITY DEFICITS AND VOWEL PERCEPTION
vii
Time/Replays .................................................................................................17
Analysis..........................................................................................................17
RESULTS .....................................................................................................19
Vowel Quality Acoustic Measures ................................................................19
Voice Quality Measures .................................................................................23
Objective Measures .............................................................................23
Subjective Measures ...........................................................................25
Vowel Identification ......................................................................................26
Vowel Goodness Ratings ...............................................................................27
Voice Quality Ratings ....................................................................................29
Reliability Ratings .........................................................................................30
Intra-rater Reliability .............................................................................30
Inter-rater Reliability .............................................................................31
DISCUSSION ...............................................................................................34
Did Vowel Sets Differ in Quality?.................................................................34
Were Vowels Similar in Other Aspects of Production? ................................36
Did Listeners Notice Quality Differences? ....................................................37
Did Voice Quality Affect Vowel Goodness Judgements? .............................37
Did Voice Quality Affect Vowel Identification? ...........................................38
Limitations .....................................................................................................39
Clinical Implications ......................................................................................40
Directions of Future Research .......................................................................41
LIST OF APPENDICES .............................................................................43
Page 9
VOCAL QUALITY DEFICITS AND VOWEL PERCEPTION
viii
REFERENCES .............................................................................................48
LIST OF FIGURES
Figure 1 Alvin 3 screenshot of identification task .........................................16
Figure 2 Alvin 3 screenshot of vowel goodness task .....................................17
Figure 3 Means and SD for F1 .......................................................................19
Figure 4 Means and SD for F2 .......................................................................20
Figure 5 Dynamic vowel chart .......................................................................21
Figure 6 Means and SD for F2 .......................................................................22
Figure 7 Means and SD for Duration .............................................................23
Figure 8 Cape-V Perceptual Scale .................................................................26
Figure 9 Means and SD for vowel goodness ratings .....................................28
Figure 10 Means and SD for voice quality ratings ........................................29
Page 10
VOCAL QUALITY DEFICITS AND VOWEL PERCEPTION
ix
LIST OF TABLES
Table 1 Acoustic measures ............................................................................21
Table 2 Repeated Measures ANOVA for acoustic measures ........................24
Table 3 CAPE-V Perceptual Scale ................................................................26
Table 4 Repeated Measures ANOVA for experimental tasks .......................27
Table 5 ICC Comparisons: Intra-rater ...........................................................30
Table 6 ICC Comparisons: Inter-rater ...........................................................32
Page 11
VOCAL QUALITY DEFICITS AND VOWEL PERCEPTION
1
Literature Review
Hypothetical Case Study. Mr. Montoya is a 65-year-old man living with Parkinson
disease (PD). His chief complaint is that his wife and grandchildren can’t understand
him. Like 90% of individuals with PD, Mr. Montoya has a concomitant motor speech
disorder called hypokinetic dysarthria (Tylakova et al., 2017; Duffy, 2013). Due to the
dysarthria, Mr. Montoya has deficits in all four subsystems required for functional
speech: respiration, phonation, resonance and articulation. At the moment, there is
insufficient scientific evidence to determine which aspect of speech production should be
targeted to attain optimal intelligibility gains in the shortest amount of time. The present
study examines phonatory effects on intelligibility to support future clinical decisions for
patients like Mr. Montoya, beginning with an overview of current literature on speech
intelligibility and brief analysis of the gaps in the research.
Speech Production. The production of intelligible speech requires the interaction of two
components, the glottal source and the vocal tract filter (Fant, 1960). For vowel sounds,
the glottal source consists of the complex tone produced by the vibrating vocal folds. The
filter consists of the vocal tract above the level of the vocal folds and the articulators
(e.g., lips, tongue, jaw). Acting as an acoustic resonator, the filter allows specific bands
of frequencies, called resonances or formants, to pass into the air with higher energy than
other frequencies. Speakers change formant frequencies by modifying the shape of the
vocal tract filter. Moving the tongue, jaw, and lips changes the frequencies that are best
resonated by the vocal tract (Behrman, 2018). Listeners use formant frequency patterns to
perceive vowel sounds. The first formant frequency, or F1, is associated with tongue
height. Vowels with a high tongue position, such as / i/ and /u/, have low F1 frequencies,
Page 12
VOCAL QUALITY DEFICITS AND VOWEL PERCEPTION
2
whereas low vowels, such as /ɑ/, have high F1 frequencies. F2, or the second formant
frequency, is associated with tongue advancement. Front vowels, such as / i/ and / ɪ/, have
high F2 frequencies, and back vowels, such as /u/ and / ʊ/ have low F2 values (Stemple et
al., 2014).
Speech intelligibility. Most studies of speech intelligibility focus on the articulation of
speech sounds associated with the vocal tract filter (Skodda, Visser & Schlegel, 2011;
Kim, Hasegawa-Johnson, & Perlman, 2011; Platt, Andrews, Young, & Quinn, 1980).
Although both consonants and vowels are important for speech intelligibility, the focus of
this paper is on vowels. In neurogenic disorders such as PD, weak or uncoordinated
articulators are unable to shape the vocal tract correctly, resulting in speech sound
distortions, substitutions of one phoneme for another, or omissions of phonemes.
Impaired shaping of the vocal tract can affect production of vowels, leading to reduced
speech intelligibility (Monsen, 1983;Whitehead & Wirz, 1979).
Characteristics of the glottal source may also influence the ability of listeners to
understand speech (Dyle, Danhauer & Reed, 1988; Eadie et al., 2013; DeBodt, 2002;
Ramig, 1992). Vocal source characteristics include fundamental frequency, vocal
intensity, and vocal quality. Fundamental frequency (f 0), is the source characteristic
perceived as vocal pitch. The rate of vibration of the vocal folds is directly related to the f
0 (Stemple et al., 2014). For example, when the vocal folds vibrate at a rate of 200 times
per second, the fundamental frequency is 200 Hz. Pitch changes are used to impart
suprasegmental information to listeners. Per Kent (1988), prosody is informed by voice
quality, intensity variation, pitch level and pitch variation. Pitch contours are necessary
for listeners to interpret meaning, and monopitch, or lack of pitch contours, negatively
Page 13
VOCAL QUALITY DEFICITS AND VOWEL PERCEPTION
3
affects intelligibility (Haycock, 1933; Greene, 1956; Hood, 1966; Monsen, 1979;
DeBodt, 2002). Restricted fundamental frequency ranges have been well-documented in
PD and other neurogenic disorders (Canter, 1963; 1965; Kent & Rosenbek, 1982).
Reduced fundamental frequency range has been shown to decrease intelligibility in both
healthy speakers and in dysarthric speakers (Laures & Weismer, 1999). Though Bunton
(2006) found fundamental frequency to typically be a redundant cue in healthy speakers,
listeners in the study used it to identify vowels when listening to dysarthric speech.
Vocal intensity, perceived as loudness by listeners, is a measure of the sound
pressure level of the voice. Vocal intensity is a function of subglottal pressure and the
degree of laryngeal adduction. The duration of vocal fold closure, degree of closure and
closure speed are specific factors that affect intensity. An increased closed duration will
increase subglottal pressure, resulting in greater intensity. Similarly, a tight laryngeal
adduction will increase subglottal pressure, while an incomplete closure reduces pressure
build-up. The faster the closure speed of the vocal folds, the more energy passes into the
air at the mouth (Behrman, 2018). Intensity is important for speech intelligibility for two
reasons: for the audibility of the speech signal to listeners and for its prosodic functions.
Intensity is affected in neurogenic disorders such as PD due to disordered laryngeal and
respiratory function. Vocal fold bowing or other glottal incompetence prevents complete
glottal closure, which inhibits build-up of subglottal pressure (Ramig, 1992). Reduced
vocal intensity is a well-known characteristic of PD (Canter, 1963; Kent & Rosenbek,
1982; Ludlow & Bassich, 1983), as is vocal fold bowing (Hansen et al., 1984; Smith et
al., 1995). Several recent therapeutic techniques (LSVT, SpeakOut, Clear Speech) focus
Page 14
VOCAL QUALITY DEFICITS AND VOWEL PERCEPTION
4
on increasing loudness in speakers with PD by facilitating improved vocal fold adduction
(Watts, 2016; Cleveland, et al., 2015; Ramig, Fox & Sapir, 2011; Lam & Tjaden, 2016)
Another parameter associated with glottal tone is voice quality. Voice quality
refers to the auditory perception of multi-dimensional factors including laryngeal
adduction, respiration, muscle tension, fundamental frequency, and others. These factors
come together in varying ratios, leading to different signal perception and descriptive
interpretation (Kreiman, 2008). This makes research on vocal quality difficult because
listeners will perceive vocal quality differently. For the purposes of this paper, Laver’s
(1980) method of distinguishing physiological differences at the laryngeal and
supralaryngeal levels will be used to define voice qualities. Glottic leakage due to
hypoadduction of the vocal folds, a space-occupying lesion, or bowed vocal folds leads to
perception of breathy vocal quality (Stemple et al., 2014; Barsties von Latoszek et al.,
2017), due to the increased obstruence. Strained vocal quality is perceived when the
vocal folds are hyperadducted or “pressed” tightly (Stemple et al., 2014; Barsties von
Latoszek et al., 2017). Voice quality has been shown to affect intelligibility in alaryngeal
speakers (Doyle, Danhauer, & Reed, 1988) and in deaf and hard of hearing speakers
(Whitehead & Wirz, 1979; Monsen, 1983). To date, there is limited documented research
on the effect of voice quality and intelligibility in individuals with motor speech
disorders, though it has been noted clinically (Ramig, 1992).
Dysarthria in Neurogenic Disorders. Motor speech disorders caused by damage at
some point along the motor pathway are classified as dysarthrias (Duffy, 2013).
Compromised laryngeal and/or supralaryngeal neural integrity leads to the development
of characteristic voice quality, articulatory, and respiratory patterns signaling the location
Page 15
VOCAL QUALITY DEFICITS AND VOWEL PERCEPTION
5
of the damage (Stemple et al., 2014). Dysarthria may result in both source and filter
deficits depending on the specific etiology and affected motor pathways (ASHA, 2017).
Individuals with hypokinetic dysarthria and flaccid dysarthria have low-intensity,
excessively breathy phonation and insufficient prosody due to source deficits.
Hypokinetic dysarthria, typically associated with PD, may be further characterized by
imprecise consonants and a variable rate due to filter deficits (Gazewood, Richards, &
Clebak 2013; Duffy, 2013). Flaccid dysarthria, typically associated with amyotrophic
lateral sclerosis (ALS) and brainstem strokes, may also be characterized by short phrases,
reduced speaking rate and mild consonant imprecision (Duffy, 2013). Hyperkinetic
dysarthria and spastic dysarthria lead to strained-strangled voice quality, inappropriate
loudness, and monopitch. Hyperkinetic dysarthria, typical of Huntington’s chorea and
spasmodic dysphonia, is further characterized by voice stoppages, distorted vowels and
imprecise consonants (Duffy, 2013).
The present study is primarily interested in research concerning PD since
approximately 90% of individuals with the disease will develop dysarthria, which may
affect respiration, phonation, resonance and/or articulation (Tylakova et al., 2017; Duffy,
2013). With multiple subsystems degenerating simultaneously and a limited timeline, it is
important to identify the most important intervention target. The most common form of
dysarthria in PD is hypokinetic dysarthria, though hyperkinetic dysarthria and mixed
dysarthria are possible (Tjaden, 2008; Duffy, 2013).
Research has examined both source and filter deficits in PD. In a study of 31
hypokinetic dysarthric subjects Zwirner & Barnes (1992) found a higher ratio of source
deficits to filter deficits. Similarly, in a study of 200 subjects Logeman & Fisher (1981)
Page 16
VOCAL QUALITY DEFICITS AND VOWEL PERCEPTION
6
found all subjects with articulation deficits had voice quality deficits and 45% of the 200
subjects had voice quality deficits only. Overall, 89% of subjects in Logeman & Fisher’s
study experienced voice quality deficits. Ho et al. (1999) supported Logeman & Fisher’s
findings with a descriptive study of 200 individuals with PD. They found voice deficits
were the prominent deficits experienced by their subjects, at 65.5%. Extensive research
supports the presence monopitch, reduced fundamental frequency, and reduced vocal
intensity in PD (Hanson, Gerrat & Ward, 1984; Logeman & Fisher, 1978; Darley, 1996;
Boshes, 1996), though intensity may be influenced by both source and filter.
Filter deficits have been associated with lower rates of speech intelligibility in PD
(Skodda, Visser & Schlegel, 2011; Kim, Hasegawa-Johnson, & Perlman, 2011; Platt,
Andrews, Young, & Quinn, 1980). Logeman & Fisher (1978) found imprecise
articulation patterns led to stops and affricates being produced as fricatives, repetitions of
syllables (i.e., fluency deficits), and inappropriate rushes of speech referred to as
festinated speech (Duffy, 2013). Kim, Hasegawa-Johnson, & Perlman (2011) contrasted
with Logeman & Fisher, finding voicing and place errors to be more frequent than
manner errors. They found non-uniform error patterns overall. Lower intelligibility was
associated with voicing and place errors over manner errors. Reduced jaw movement,
velopharyngeal movement and voice onset time (VOT) have also been documented in the
research (Weismer, 1984; Canter, 1965; Logeman & Fisher, 1978; Caligiuiri, 1987;
Conner et al., 1989)
Vowels in Dysarthria Vowels are frequently the focus of dysarthria research. Vowels
are targeted because they are relatively long time periods of voiced speech with limited
filter effects from vocal tract shaping, allowing for controlled perceptual assessment of
Page 17
VOCAL QUALITY DEFICITS AND VOWEL PERCEPTION
7
source characteristics (Kreiman, 2008). Vowels are distinguished by producing them with
varying tongue heights and tongue advancement. These variations correspond to well-
documented, distinct vowel formant frequency patterns, F1 and F2 (Peterson & Barney,
1952). Vowel perception is important to overall speech intelligibility. As distinctiveness
of a given vowel compared to other vowels is reduced, intelligibility is also reduced (Kim
et al., 2011; Savageau et al., 2015; Monsen, 1983).
Vowels in Parkinson Disease There has been extensive research on vowels in PD.
Vowel Space Area (VSA) is a common research metric to determine the distinctiveness
of an individual’s vowel productions. VSA measures the distance between vowels in a
vowel quadrilateral plot. Reduced vowel space area reflects reduced tongue movement
and correspondingly-altered measures of F1 and F2. Results have been inconsistent, with
some studies finding VSA could differentiate between normal and dysarthric speakers
and others finding it could not (Sapir et al., 2011). Skodda and colleagues (2011, 2012)
found vowel space scores deteriorated with progression of PD. Other studies support
vowel movement to the center of the vowel quadrilateral (vowel centralization) and
reduced vowel space in PD, even early on in the disease (Bang et al., 2013; Rusz, et al.,
2013). VSA correlates with filter deficits.
Teasing apart source and filter effects in speakers with PD is important in
understanding what causes deficits in speech intelligibility. When a clinician is faced
with abnormal phonation, articulation, resonance, and prosody simultaneously, it is
difficult to know what to treat first to obtain the best functional gains, especially in a
limited time frame. Comprehending the effect of voice quality deficits on vowel
perception begins the process of learning how vocal quality impacts speech intelligibility.
Page 18
VOCAL QUALITY DEFICITS AND VOWEL PERCEPTION
8
LSVT and Loud Speech One well-supported treatment for individuals with speech
deficits due to PD is the Lee-Silverman Voice treatment (LSVT LOUD), described in one
study as the “most effective treatment for PD in reducing the impact of hypokinetic
dysarthria on functional communication” (Constantinescu, Theodoros, et al., 2011).
LSVT LOUD targets the development of high-intensity, effortful speech production in an
effort to “recalibrate” self-perception of intensity and motor recruitment (Ramig, Fox &
Sapir, 2011). Per Ramig and colleagues, increased intensity improves laryngeal deficits,
respiratory deficits and orofacial movement, leading to improved vocal quality and
improved vowel and consonant articulation (Ramig, 1992; Schulman, 1985; Dromey &
Ramig, 1998; Dromey, Ramig & Johnson, 1995; Sapir et al., 2007).
Research shows LSVT LOUD and other loud speech techniques, like Speak Out,
affect both the source and filter including vocal intensity, vocal quality and articulatory
accuracy (Watts, 2016; Cleveland, et al., 2015; Ramig, Fox & Sapir, 2011) . LSVT
LOUD is the most studied loud speech technique and is correlated with both source and
filter changes. Stroboscopy indicates tighter, more symmetrical vocal fold adduction
following LSVT LOUD (Smith et al., 1995). Increased vowel space in many speakers
(Bunton, 2006; Neel & Beveridge, 2006) also supports source change. Greater tongue
strength (Ward et al., 2000;) and greater articulator movement (Schulman, 1989; Dromey
& Ramig, 1998; Sapir & Ramig et al., 2002) support filter changes.
The study that inspired this thesis was conducted by Shimon Sapir and colleagues
in 2007. The randomized control trial included a treatment group of individuals with PD,
a control group with PD, and a control group of age-matched, neurotypical peers.
Subjects in the treatment group attended hour-long, individual therapy sessions four times
Page 19
VOCAL QUALITY DEFICITS AND VOWEL PERCEPTION
9
a week for four weeks (16 sessions). Subjects also performed a daily home exercise
regimen consisting of loud phonation for as long as possible, high-amplitude speech
exercises, and phonation at both maximum high- and low-pitch. Sapir and colleagues
concluded changes in vowel articulation, a by-product of high-intensity speech as noted
above, were responsible for better vowel goodness ratings in the treatment group
compared to the no-treatment group. Sapir’s study did not control for the improved vocal
quality that is an expected byproduct of forceful vocal fold adduction, however. It is
possible listeners were not able to distinguish between voice quality improvement and
vowel articulation improvement when rating vowel “goodness,” leading to confounded
results.
We do not currently have a full understanding of how source characteristics and
articulatory dimensions impact speech intelligibility (Kent et al., 2003) . Ramig (1992)
points to research on speech of deaf individuals and alaryngeal speakers to support the
theory that vocal quality affects speech intelligibility ratings. Voice quality deficits and
articulation deficits both contribute to reduced speech intelligibility in deaf children
(Monsen, 1983). Similarly, in laryngectomees voice quality deficits have been coupled
with lower speech intelligibility (Dyle, Danhauer & Reed, 1988; Eadie et al., 2013). With
dysarthric speech, DeBodt et al., (2002) found functional intelligibility is improved
linearly by combining speech dimensions. While prosody and articulation were found to
be the most influential speech dimensions correlated with intelligibility estimations, voice
quality and prosody were also implicated in improved intelligibility.
Aims. This current study aims to identify the impact of disordered vocal quality on vowel
perception in listeners. In order to ascertain the effects of breathy and strained voice
Page 20
VOCAL QUALITY DEFICITS AND VOWEL PERCEPTION
10
quality on vowel perception, researchers must use vowel stimuli that differ from one
another only in voice quality. The vowel stimuli must not differ in the other source
characteristics, pitch and intensity, nor should they differ in filter characteristics such as
F1 (tongue height), F2 (tongue advancement) and duration. It would be useful to employ
computer-created synthetic or resynthesized vowels to carefully control all elements of
vowel production. However, it is difficult to produce a set of several realistic synthetic or
resynthesized breathy and strained vowels. Therefore, this study employs simulated
breathy and strained vowel stimuli as well as vowels produced with normal voice quality
spoken by a healthy speaker who attempted to hold other source and filter characteristics
constant while producing the three voice qualities. In contrast to Sapir et al., (2007), this
study will clearly demonstrate if vowel goodness changes are due to voice quality apart
from articulation. Results will guide further research as we determine if voice quality can
affect speech intelligibility. Clinicians will then be better able to assess client need and
select appropriate intervention targets in order to support function in a timely, efficient
manner. To this end, the specific aims of this project are to:
Specific Aim #1: To determine the effect of each simulated deficit on vowel
identifiability, identification scores, time needed to identify tokens and the number of
replays needed.
Specific Aim #2: To determine the effect of each simulated deficit on vowel “goodness”
rating, average ratings, time needed to rate “goodness” and the number of replays needed.
Page 21
VOCAL QUALITY DEFICITS AND VOWEL PERCEPTION
11
Specific Aim # 3: To determine the effect of each simulated deficit on voice quality
rating, average ratings, time needed to rate voice quality and the number of replays
needed.
Page 22
VOCAL QUALITY DEFICITS AND VOWEL PERCEPTION
12
Methods
This research project was approved by the Institutional Review Board (IRB) of the
University of New Mexico.
Participants
Sixteen volunteer undergraduate and graduate students in the Speech and Hearing
Sciences Department at the University of New Mexico were recruited via email list.
Participants were self-reported native English speakers with no history of speech,
language, or hearing problems. Each participant passed a pure-tone audiometry test ( 500
Hz, 1,000 Hz, 2,000 Hz, and 4, 000 Hz at 20 decibels) prior to beginning the tasks.
Stimuli
One healthy female speaker, this study’s principal investigator, produced three sets of 10
vowels (/i ɪ ɛ æ ʊ u ʌ oʊ ɑ eɪ/) within the carrier phrase, “say hood again”, for a total of
30 phrases. Breathy vocal quality was produced by reducing vocal fold contact, therefore
increasing turbulent airflow during phonation. Strained vocal quality was produced by
hyperadducting the vocal folds. Stimuli were recorded via Audacity (Mazonni, 1999)
using an EG2-PCX model electroglottograph (EGG) with 35-mm dual channel electrodes
and accompanying Glottal Enterprises M80 omnidirectional headset microphone in a
sound-treated booth. A harmless electrical current passed through the speaker’s vocal
folds to record vocal fold movement to find the Contact Quotient (i.e., CQ: contact time
of the vocal folds divided by cycle length) measures. Cycle length is determined based on
a preset threshold (e.g., contact begins at 25% of maximum amplitude and ends at 25%
amplitude). CQ50% is a physiological measure with a threshold at 50% of the amplitude.
Page 23
VOCAL QUALITY DEFICITS AND VOWEL PERCEPTION
13
CQ50% has been shown to distinguish breathy, strained, and normal phonation (Liu et
al., 2017).
Objective Measures. PRAAT software (Boersima & Weenik, 2015) was used to
annotate stimuli in order to isolate vowels. Average intensity for each vowel in each
condition was extracted via PRAAT software. A script customized by Dr. Richard Arenas
extracted f 0, F1, F2, duration, and Cepstral Peak Prominence-Smoothed (CPPs) measures
for each marked vowel. Standard PRAAT settings track 5 formants up to 55k Hz, but
settings needed to be adjusted for some stimuli (i.e., up to 5k Hz). Formant measures
were double-checked by hand and changed as needed to ensure accurate formant tracking
(<10). Several acoustic measures were used to determine that vowel productions were
similar in articulation and differed only in voice quality. F1 and F2 measures informed
tongue height and advancement across conditions. Fundamental frequency measures
confirmed similar pitch across all conditions. To prepare the stimuli for the perceptual
tests, a second PRAAT script extracted each vowel as a separate wav file. Vowels were
equated for loudness (mean RMS intensity) using Adobe Audition
(Audacity.sourceforge.net, 2015) software to ensure that intensity differences did not
influence perceptual judgments.
Two measures were used to determine that the three types of stimuli did differ in
voice quality as desired: CPPs and CQ50%. A Fourier transformation converts waveform
frequency into a time domain leading to a “spectral representation of the spectrum”
(Heman-Ackah et al., 2003), called a cepstrum. Smoothed cepstral peak prominence
(CPPs) is the highest amplitude in a given cepstrum and is the acoustic measure most
strongly associated with breathy voice quality (Latozek et al., 2016). Breathy voices have
Page 24
VOCAL QUALITY DEFICITS AND VOWEL PERCEPTION
14
a flatter cepstrum overall, meaning CPPs measurements are smaller than for non-breathy
voice quality (Hillenbrand & Houde, 1996). Small CPPs have been correlated with
strained vocal quality (Lowell et al., 2012). CPPs measures were obtained using Praat.
The physiologic measure CQ50% was used to determine differences in vocal fold closure
patterns across the three voice quality types. Vocal fold closure patterns differ across
voice quality. In typical phonation, the vocal folds oscillate fluidly horizontally,
vertically, and longitudinally. Electroglottograph measures pass an electrical current
through the vocal folds to record when vocal folds are open vs. closed. Software
translates these readings into a contact quotient (CQ) by dividing cycle length by total
time the vocal folds were closed. For this study, cycle is defined by 50% peak to 50%
peak in the EGG signal. CQ50% for typical phonation shows about a 2:3 ratio of contact
time to open time (Liu et al., 2012). Strained phonation occurs due to hyperadduction of
the vocal folds, limiting the fluid motion of the vocal fold edge (Stemple et al., 2014).
CQ50% for strained phonation is expected to be the largest of the three vocal qualities,
with a higher proportion of contact time to open time (Liu et al., 2012). In breathy
phonation the vocal folds do not fully approximate, meaning EGG measures for breathy
phonation are limited. Although anterior vocal fold contact may be sufficient for contact
readings, a posterior vocal fold gap is likely in this condition and may not be sensed by
the EGG.
Subjective Measures. To further confirm that the desired voice quality deficits
were achieved, two experienced clinical speech-language pathologists assessed four
vowels and four sentence-level experimental stimuli using the CAPE-V perceptual scale,
Page 25
VOCAL QUALITY DEFICITS AND VOWEL PERCEPTION
15
a reliable subjective measure of voice quality (Zraick et al., 2010). CAPE-V scores
confirmed moderate deficits in breathiness and strain present in respective stimuli
Procedure
Training. Participants received a short training session from the investigator to
ensure understanding of goodness concepts, voice quality concepts and the international
phonetic alphabet (IPA) (Appendix B). During the training, participants were presented
with examples of normal, breathy, and strained stimuli in /hVd/ contexts. They practiced
Visual Analog Scale (VAS) rating tasks and vowel identification tasks using speech
samples from non-experimental stimuli. Research has found no significant difference in
perceptual judgements of dysarthric speech between expert and naïve listeners (Sussman
& Tjaden, 2012), so undergraduate and graduate students were selected as the research
participants.
Tasks
Vowel Identification. Participants performed 10-alternative forced choice tasks
for vowel identification. For each trial, one of ten vowels was presented via headphones
at a comfortable listening level. Participants identified which of the ten possible vowels
was presented via a mouse click on the perceived vowel (Figure 1). Vowel choices were
presented orthographically (e.g., had) and phonetically (e.g., /hæd/). There was a total of
30 stimuli (10 vowels X 3 conditions X 1 speaker) presented in random order 3 times for
interrater reliability. Each participant therefore completed 90 vowel identification trials.
Delivery and response collection was managed by Alvin 3 experiment software (J.M.
Hillenbrand & Gayvert, 2005). Percent correct vowel identification was calculated for
each voice type.
Page 26
VOCAL QUALITY DEFICITS AND VOWEL PERCEPTION
16
Figure 1. Screenshot of Alvin 3 experiment software display for identification task
Vowel Goodness. Participants completed vowel “goodness” ratings of the same
stimuli sets in /hVd/ contexts using a visual analog scale (VAS) ranging from “poor
example” to “good example” of each vowel under each condition (Figure 2). Each
stimulus was presented 3 times in random order to determine interrater reliability. There
were a total of 90 vowel goodness trials per participant. The Alvin 3 program translated
mouse clicks on the analog scale into a number between 0 (good example) and 100 (poor
example). Vowel goodness measurements will provide more fine-tuned data on how
close a given vowel is to the listener’s concept of an excellent exemplar. Measuring both
intelligibility and vowel goodness may result in observable trends not visible with only
one measure (Franklin & Stoel-Gammon, 2014).
Page 27
VOCAL QUALITY DEFICITS AND VOWEL PERCEPTION
17
Figure 2. Screenshot of Alvin 3 experiment software display for vowel goodness task
Quality Goodness. Participants completed voice quality “goodness” ratings of the
same stimuli sets in /hVd/ contexts using a visual analog scale (VAS) ranging from “poor
example” to “good example” of each vowel under each condition. The intended vowel
was displayed orthographically so participants were able to compare. Each stimulus was
presented in 3 times randomly to determine interrater reliability. There were a total of 90
quality goodness trials per participant. The Alvin 3 program translated mouse clicks on
the analog scale into a number between 0 (good example) and 100 (poor example).
Time/Replays. The Alvin 3 program recorded time needed to respond in milliseconds
and recorded number of replays for each stimuli. Time and number of replays were
compared for breathy, normal and strained tokens in each task (identification, goodness
rating and quality rating).
Analysis
1. To determine the effect of each simulated deficit on vowel identifiability,
identification scores, time needed to identify tokens and the number of replays were
averaged across the listeners , transformed into RAU, and submitted to a mixed ANOVA
Page 28
VOCAL QUALITY DEFICITS AND VOWEL PERCEPTION
18
using IBM SPSS Statistics 25 (SPSS Inc., Chicago, IL) with within-subjects factor of
condition, which includes the normal voice quality and the two simulated deficits.
2. To determine the effect of each simulated deficit on vowel “goodness” rating,
average ratings, time needed to rate “goodness” and the number of replays were
submitted to repeated-measures ANOVA with the within-subjects factor of condition
(breathy, normal, or strained). Ratings were also subjected to Bonferroni-adjusted
pairwise comparison.
3. To determine the effect of each simulated deficit on voice quality rating,
average ratings, time needed to rate voice quality and the number of replays were
submitted to repeated-measures ANOVA with the within-subjects factor of condition
(breathy, normal, or strained). Ratings were also subjected to Bonferroni-adjusted
pairwise comparison.
Page 29
VOCAL QUALITY DEFICITS AND VOWEL PERCEPTION
19
Results
Vowel quality acoustic measures. To confirm that vowels were similar for parameters
other than vocal quality, measures were taken of F1, F2, and fundamental frequency at
20%, 50% and 80% of the vowel. F1, F2, fundamental frequency, and vowel duration
were submitted to repeated-measures analysis of variance (ANOVA) using IBM SPSS
Statistics 25 (SPSS, Inc., Chicago, IL) with a within-subject factor of voice type (breathy,
normal, or strained). There was a significant effect of voice type for F1, F(1,2)=6.57,
p=.005,2=.422 (Table 2, Figure 3). Pairwise Bonferroni adjusted comparisons indicate a
significant difference of 99 Hz between the breathy and strained conditions, p=0.016.
There was no significant difference among the three voice quality types for F2,
F(1,2)=2.681, p=.096 (Table 2, Figure 4).
Figure 3. Means and SDs for F1.
100
600
1100
1600
2100
Breathy Normal Strained
Fre
qu
ency
(H
z)
Page 30
VOCAL QUALITY DEFICITS AND VOWEL PERCEPTION
20
Figure 4. Means and SDs for F2.
Results of the dynamic vowel chart (Figure 5) shows F1 and F2 values for each
vowel at 20%, 50%, and 80% of vowel duration This F1 X F2 vowel scatterplot reveals
differences in production for a few vowels across the three voice quality types. The
strained voice quality version of /eɪ/ was produced with a lower tongue position and /ʊ/
was produced with a higher tongue position than for the breathy and normal versions. For
normal voice quality, /u/ was produced with a more backed tongue position than the /u/ in
breathy or strained voice quality. Table 1 shows formant frequencies by vowel and voice
type.
100
600
1100
1600
2100
Breathy Normal Strained
Fre
qu
ency
(H
z)
Page 31
VOCAL QUALITY DEFICITS AND VOWEL PERCEPTION
21
Figure 5. F1 (y-axis) and F2 (x-axis) formant frequencies at 20%, 50% and 80% of each vowel for every
vowel in each condition. Note: 20% of the vowel is indicated by the largest marker in a series. 80% of the
vowel is indicated by the smallest marker in the series.
Table 1 Measures of F1 (Hz), F2 (Hz), f 0 (Hz), and duration (sec) by vowel and voice type
Vowel F1 F2 f 0 Duration
B N S B N S B N S B N S i 306 268 423 2766 2827 2860 209 243 258 0.13 0.11 0.2 ɪ 399 509 494 2286 2137 2217 233 240 242 0.1 0.08 0.13 eɪ 439 455 706 2578 2631 2404 229 220 208 0.14 0.13 0.16 ɛ 726 802 729 2001 2052 1994 206 207 221 0.1 0.08 0.19 æ 941 993 909 1946 1680 1864 198 199 169 0.11 0.12 0.24 ʌ 664 783 828 1716 1595 1508 196 203 190 0.08 0.07 0.18 ɑ 943 948 974 1564 1404 1487 190 204 183 0.13 0.12 0.20 oʊ 416 424 548 971 1007 969 177 204 216 0.12 0.12 0.23 ʊ 427 515 511 1434 1446 1254 179 227 228 0.1 0.08 0.19 u 326 255 452 1276 925 1103 202 230 224 0.12 0.12 0.24
200
300
400
500
600
700
800
900
1000
50010001500200025003000
i_B ʌ_B ɪ_B ei_B ɛ_B æ_B u_B ʊ_B oa_B ɑ_Bi_N ʌ_N ɪ_N ei_n ɛ_N æ_N u_N ʊ_N oʊ_N ɑ_N
i_S ʌ_S ɪ_S ei_S ɛ_S æ_S u_S ʊ_S oʊ_S ɑ_S
Page 32
VOCAL QUALITY DEFICITS AND VOWEL PERCEPTION
22
For fundamental frequency, Greenhouse-Geisser-corrected measures of f 0 were
not significantly different, F=3.090, p=.100 (Table 1, Table 2, Figure 6). This indicates
fundamental frequency (vocal pitch) was held relatively constant across the three voice
quality types.
Figure 6. Means and SDs for f 0
Greenhouse-Geisser-corrected measures of vowel duration were significantly
different across the three voice quality types, F=79.024, p=.000. There was a large effect
size, η² = .898. Bonferroni-adjusted pairwise comparison indicated strained condition
100
600
1100
1600
2100
Breathy Normal Strained
Fre
quen
cy (
Hz)
Page 33
VOCAL QUALITY DEFICITS AND VOWEL PERCEPTION
23
was longer than both breathy and normal, p=.000. On average, strained vowels were
0.08 ms longer than the normal breathy vowels. Although breathy vowels were not
significantly different than normal vowels (p=.052) they were, on average, 0.01ms
longer than normal vowels (Tab. 1; Fig. 7). Vowel duration was not held constant across
the three conditions, but differences were relatively small (less than 82 ms).
Figure 7. Means and SDs for duration.
Voice quality measures
Objective measures. To determine that the speaker did in fact vary voice quality
across the three conditions, one acoustic measure and one physiologic measure were
compared. Cepstral peak prominence-smoothed (CPPs) measures were subjected to
repeated-measures analysis of variance (ANOVA) with the within-subjects factor of
0
0.1
0.2
0.3
0.4
0.5
0.6
0.7
0.8
0.9
1
Breathy Normal Strained
Tim
e (m
s)
Page 34
VOCAL QUALITY DEFICITS AND VOWEL PERCEPTION
24
voice type (breathy, normal, or strained). As expected, CPPs differed significantly with
voice condition, F=100.857, p=.000, η² =.918. Bonferroni-adjusted pairwise comparison
indicated CPPs for the strained voice vowels was larger than for normally voiced vowels,
which was larger than the breathy voiced vowels (S>N>B), with p=.000 for each
comparison (Table 2). This indicates that breathy and strained vocal quality conditions
were successfully simulated.
Table 2
Repeated Measures ANOVA with within-subjects factor of voice type (breathy, normal, or strained) statistics for acoustic and physiological measures.
Measure F (1,2) p η² p
Duration 79 .000* .9
F1 7 .005* .4
F2 3 0.961 N/A
F0 3 .100 N/A
CQ50% 17 .000* .6
CPPs 100 0.000* 0.9
Electroglottogram measures (EGG) of contact quotient with 50% criterion
(CQ50%) were subjected to repeated-measures analysis of variance (ANOVA) with
within-subject factor of voice type (breathy, normal, or strained). Statistics showed a
significant effect for voice type at the midpoint of the vowel, F(1,2)=16.777, p=.000 and
2=.617 (Table 2). Bonferroni-adjusted pairwise comparison indicated CQ50% at vowel
midpoint was significantly different between breathy and strained conditions (p=.002)
Page 35
VOCAL QUALITY DEFICITS AND VOWEL PERCEPTION
25
and between normal and strained conditions (p=.001), but not between breathy and
normal conditions (Table 2). Measuring CQ50% over the whole vowel, a significant
effect was again present for voice type F(1,2)= 5.278, p=.016, η² =.370. Bonferroni-
adjusted pairwise comparison indicated CQ50% across the whole vowel was significantly
different between normal and strained conditions (p=.006).
Pearson Product Moment correlations for CPPs and CQ50% of the whole vowel
(CQ_all) and CQ50% at the midpoint of the vowel (CQ_mid) were included to confirm
that acoustic and physiological measures were in agreement. The correlation between
CPPs and CQ_all was significant (.525), as was the correlation between CPPs and
CQ_mid (.760).
Subjective measure. To further confirm that the desired voice quality differences
were achieved, two licensed speech-language pathologists experienced in voice disorders
performed the Consensus Auditory-Perceptual Evaluation of Voice (CAPE-V) on four
vowels and four sentences under each condition. The speech-pathologists were blinded to
the condition, to each others’ ratings, and to the purpose of the present study. The average
scores for overall severity, breathiness and strain (Figure 8, Table 3) indicate a moderate
severity for the breathy condition, a moderate-to-severe rating for the strained condition
and no abnormal quality for the normal condition. For degree of breathiness, the breathy
condition was rated as moderately breathy, the strained condition as mildly breathy and
the normal condition was rated to be without breathiness. For degree of strain, the breathy
condition was rated mildly strained, the normal was rated without strain, and the strained
condition was rated moderate-to-severely strained. Therefore, to the trained ear, the
appropriate perceptual qualities were present in the stimuli.
Page 36
VOCAL QUALITY DEFICITS AND VOWEL PERCEPTION
26
Figure 8. Average CAPE-V ratings by experienced clinicians. Note Normal condition (orange) does not
show in the figure due to zero scores for all measures.
Table 3
Expert clinician judgements on the CAPE-V perceptual test out of 100 points each
Breathy Normal Strained
Overall Severity 31.5 0 60
Breathiness 55 0 14.5
Strain 7.5 0 66
Voice quality and vowel identification. There was no significant effect of voice type,
F(1,2,) =1.797, p=.183. The time taken to identify vowels was not significantly different
0
10
20
30
40
50
60
70
80
90
100
Overal Severity Breathiness Strain
Breathy Normal Strained
Page 37
VOCAL QUALITY DEFICITS AND VOWEL PERCEPTION
27
across the three voice quality types, F(1,2)=0.51 p=.52, nor were number of replays
F(1,2)=3.17, p=.081.
Comprehensive confusion matrices (Appendix B) show both vowel identification
accuracy for each vowel and the nature of confusions. In all conditions, /eɪ/ stimuli had
the largest number of errors (9 for breathy, 4 for normal, 6 for strained). This vowel was
confused for /ɪ/ and, more often, /ɛ/.
Table 4 Repeated Measures ANOVA with within-subjects factor of voice type (breathy, normal, or strained) for experimental tasks.
Task F(1,2) p ƞ²
Vowel ID 1.797 .183 .107
Vowel ID Time 0.51 0.52 N/A
Vowel ID Replays 3.17 0.081 N/A
Vowel Goodness 11.72 p<.001* .439
Vowel Goodness Time 15.57 .000* .509
Vowel Goodness
Replays
6.13 .006* .290
Voice Quality 61.645 .000* 0.804
Voice Quality Time 1.77 .198 N/A
Voice Quality Replays 3.33 .073 N/A
* Significant at the .05 level
Vowel goodness ratings. Vowel goodness ratings were collected to understand how
vocal quality affected listeners’ perception of phoneme production. Sphericity-assumed
results indicate a significant difference, F(1,2)=11.72, p < .001. Bonferroni-adjusted
pairwise comparison indicated goodness ratings for the breathy and strained conditions
Page 38
VOCAL QUALITY DEFICITS AND VOWEL PERCEPTION
28
were not significantly different from each other, but were significantly different from the
goodness ratings for the normal condition (Table 4, Figure 9). Time needed to rate
“goodness” was significantly different F(1,2)=15.57, p=.000, η² =.509 (Table 4). Pairwise
comparisons indicate that listeners took more time to respond to breathy stimuli than to
normal stimuli, with a mean difference of 1411 ms (p< .001). Listeners also took
significantly more time for strained stimuli compared to normal stimuli, with a mean
difference of 683 milliseconds (p=.018). Number of replays were significantly different
across voice type, F(1,2)=6.13, p=.006, η² =.290 (Table 6). Pairwise comparison indicate
that listeners used significantly more replays for breathy than for the normal stimuli, with
a mean difference of .229 replays (p=.008) There was no significant difference between
strained and normal vowel stimuli replays (Table 4).
Figure 9. Means and SDs for vowel goodness ratings (0=good, 100=poor).
0
10
20
30
40
50
60
70
80
90
100
Breathy Normal Strained
Vis
ual
An
alo
g S
cale
Sco
re
Page 39
VOCAL QUALITY DEFICITS AND VOWEL PERCEPTION
29
Voice quality ratings. Sphericity-assumed results indicate a significant difference across
voice type, F(1,2)=61.645, p=.000 (Table 4). Bonferroni-adjusted pairwise comparison
indicated goodness ratings for the breathy and strained conditions were not significantly
different from each other, but both breathy and strained vowels were rated significantly
more poorly in voice quality than the normal vowels (Figure 10).
Time needed to rate voice quality did not differ across the three voice quality
types, F(1,2)=1.77, p=.198. The number of replays was not significant, F(1,2)=3.33,
p=.073 (Table 6).
Figure 10. Means and SDs for voice quality ratings (0=good, 100=poor).
0
10
20
30
40
50
60
70
80
90
100
Breathy Normal Strained
Vis
ual
Anal
og S
cale
Sco
re
Page 40
VOCAL QUALITY DEFICITS AND VOWEL PERCEPTION
30
Reliability analysis
Intra-rater agreement. Each of the 16 listeners heard each of the 30 vowel tokens
three times in each experimental task. Therefore, voice quality and vowel goodness
ratings were compared across the three repetitions to assess intra-judge agreement for
each listener. Pearson correlations for the first and second set of stimuli, the first and
third set of stimuli, and the second and third set of stimuli for each listener (Table 5)
Mean intra-rater agreement for voice quality ratings was 85% and for vowel goodness
ratings was 56%. Rater 2 was excluded from calculations for vowel goodness because all
but one vowel token was rated as 0. For voice quality ratings, one hundred percent of
intra-rater correlations for voice quality ratings were statistically significant at the .05
level, and 66% percent for vowel quality ratings were significant (Table 5).
Table 5
Intraclass correlation coefficients by rater and two-way comparisons for vowel goodness
task. Speaker Breathy-Strained Strained-Normal Breathy-Normal Mean
1 0.35 0.620329* 0.669* 0.546443
2 N/A N/A N/A N/A
3 -0.06083 -0.05577 0.888608* 0.257338
4 0.064834 0.439371** 0.570384* 0.358197
5 0.421959** 0.267259 0.393916** 0.361044
6 0.608371* 0.508227* 0.776765* 0.631121
7 0.764553* 0.800996* 0.726545* 0.764031
8 0.584298* 0.256765 0.22831 0.356458
9 0.756957* 0.64932* 0.910892* 0.77239
Page 41
VOCAL QUALITY DEFICITS AND VOWEL PERCEPTION
31
10 0.796281* 0.948324* 0.79225* 0.845618
11 0.358954 0.269817 0.288486 0.305752
12 0.612807* 0.738722* 0.867579* 0.739703
13 0.283751 0.564258* 0.603566* 0.483858
14 0.675691* 0.841362* 0.777172* 0.764741
15 0.457366** 0.730945* 0.525493* 0.571268
16 0.734064* 0.666522* 0.892367* 0.764318
Mean 0.493937 0.549763 0.660756 0.568152
Range
Minimum
-0.06083 -0.05577 0.22831 0.257338
Range
Maximum
0.796281 0.948324 0.910892 0.845618
*indicates significance at .05
** indicates significance at .01
In addition, the percentage of tokens receiving scores of close agreement was
calculated. Close agreement was defined as a difference of less than 10 points on the 100
point rating scale for the two ratings. For vowel quality, close agreement for normal
vowels was 73%, but for breathy and strained vowels it was 16% and 14% respectively.
For vowel goodness, close agreement for normal vowels was 81%, breathy vowels was
51% and strained vowels were 64%.
Inter-rater reliability. To assess agreement across the 16 listeners, interclass
correlation coefficients (ICC) (two-way mixed model) were calculated for voice quality
and vowel goodness ratings. ICCs are the ratio of rating variance and variance sum and
error sum. This measure allows environmental variables and other error sources to be
considered leading to a highly generalizable measure of inter-rater reliability (Sheard,
Page 42
VOCAL QUALITY DEFICITS AND VOWEL PERCEPTION
32
Adams & Davis, 1991). Absolute agreement ICC for voice quality was .957 (p < .001),
indicating excellent reliability (Koo & Li, 2016). For vowel goodness ratings, absolute
agreement ICC was .726 (p < .001), indicating moderate agreement.
Table 6
Interclass correlation coefficients by rater and two-way comparisons for voice quality
ratings. Speaker Breathy-Strained Strained-Normal Breathy-Normal Mean
1 0.906* 0.921* 0.875* 0.900667
2 0.717* 0.467* 0.47* 0.551333
3 0.608* 0.635* 0.57* 0.604333
4 0.845* 0.896* 0.805* 0.848667
5 0.782* 0.826* 0.794* 0.800667
6 0.858* 0.885* 0.861* 0.868
7 0.977* 0.992* 0.975* 0.981333
8 0.712* 0.733* 0.72* 0.721667
9 0.923* 0.889* 0.879* 0.897
10 0.972* 0.988* 0.968* 0.976
11 0.973* 0.974* 0.98* 0.975667
12 0.758* 0.824* 0.883* 0.821667
13 0.926* 0.926* 1* 0.950667
14 0.985* 0.993* 0.987* 0.988333
15 0.757* 0.83* 0.751* 0.779333
16 0.931* 0.977* 0.967* 0.958333
Mean 0.851875 0.85975 0.842813 0.851479
Range
Minimum
0.608 0.467 0.47 0.551333
Page 43
VOCAL QUALITY DEFICITS AND VOWEL PERCEPTION
33
Range
Maximum
0.985 0.993 1 0.988333
*indicates significance at .05
** indicates significance at .01
Page 44
VOCAL QUALITY DEFICITS AND VOWEL PERCEPTION
34
Discussion Summary
The aim of this study was to identify the impact of disordered vocal quality on
vowel perception in listeners. In addition to the better-studied articulatory deficits,
breathy and strained vocal quality are also common in individuals with dysarthria. As
dysarthria is such a common symptom of degenerative neurogenic disorders, it is
important to understand exactly what factors affect intelligibility so clinicians can support
functional communication with timely, efficacious interventions. Vowel stimuli were
used in this pilot study to establish the feasibility of simulated voice quality deficits for
future research at word and sentence levels. By using voice quality deficits simulated by
a healthy speaker, natural speech tokens could be used in perception tasks.
Did the vowel sets differ in voice quality?
In order to carry out the study, we had to ensure that the three sets of vowels -
breathy normal, and strained - did differ in voice quality. Using the CAPE-V, a standard
assessment of voice quality, two experienced clinicians judged that the three sets of
vowel stimuli differed from one another. Breathy stimuli were judged as moderately
breathy and strained vowel stimuli were judged moderate-to-severely strained. Normal
stimuli were judged to be free of perceptual deficits.
Currently, no single measure, acoustic or physiologic, accounts for both breathy
and strained vocal quality. Therefore, both acoustic and physiological measures were
performed to confirm clinician judgements of perceptual deficits. The acoustic measure
CPPs confirmed the breathy and normal stimuli were representative of the vocal quality
conditions. As expected, breathy vowels had the lowest CPPs values, indicating lower
acoustic energy and periodicity (Heman-Ackah, et al., 2002; Barsties von Latoszek et al.,
Page 45
VOCAL QUALITY DEFICITS AND VOWEL PERCEPTION
35
2016). Strained vowels had the highest CPPs values in our study, indicating higher
amounts of acoustic energy, or periodicity, present in the stimuli. This contrasts with
Lowell and colleagues (2012), who found strained-pressed phonation had lower CPPs
peaks than normal phonation in a sentence-level task and in a sustained vowel task. We
are unsure why our measures differed. The efficacy of CPPs measurements for strained
vocal quality is limited due to scarcity of research correlating strained phonation and
CPPs.
Physiologically, electroglottograph measures were taken by passing an electrical
current through the speaker’s vocal folds to record when vocal folds are open vs. closed.
The included software translated these readings into a contact quotient (CQ) by dividing
cycle length by total time the vocal folds were closed. In keeping with prior research, we
set the cycle length threshold at 50% (e.g., cycle defined by 50% peak to 50% peak in the
EGG signal). CQ50% has been shown to distinguish breathy, strained, and normal
phonation (Liu et al., 2017). In women for sustained vowel tasks, vocal folds were found
to be closed 35% of the cycle for breathy phonation, 40% of the cycle for normal
phonation and 53% of the time for strained phonation (Liu et al., 2017). In our study,
vocal folds were found to be closed 40% of the cycle for breathy phonation, 42% of the
cycle for normal phonation and 60% of the time for strained phonation. EGG measures
showed significant effects of voice type on CQ50%. Strained vowels were significantly
different from both normal and breathy vowels at the midpoint of the vowel. Breathy and
normal CQ50% were not significantly different from one another, though breathy
phonation had a slightly lower CQ50% when looking at the middle three pitch pulses of
the EGG signal. It was difficult to measure CQ50% reliably using vowels produced in
Page 46
VOCAL QUALITY DEFICITS AND VOWEL PERCEPTION
36
words with normal duration compared to sustained vowels, like in Liu et al., which may
be why our results differ somewhat. Similar to CPPs for strained phonation, CQ50% is
not well-suited to measure breathy vocal quality due to the possibility of recording
contact due to anterior vocal fold adduction even with a posterior vocal fold gap.
With the exception of the acoustic measure (CPPs) for the strained voice vowels
and CQ50% for breathy phonation, the three sets of stimuli differed as expected in expert
perceptual judgements, acoustic measures and physiologic measures of voice quality.
Were vowels similar in other aspects of production?
In order to control for confounding variables, it was necessary to hold all factors
other than voice quality constant if possible. Several acoustic measures were used to
confirm consistency of vowel production. F1 and F2 measures were used to compare
tongue height and tongue advancement over time across conditions. F2 at 50% of the
vowel duration did not differ significantly, indicating similar tongue advancement for
three groups of stimuli. However, there was a significant difference for F1: strained
stimuli were about 100 Hz lower than breathy stimuli on average, indicating the tongue
and jaw were positioned higher for strained stimuli. Higher positioning may be due to
overall increased muscle tension required to produce strained voice, limiting the
speaker’s ability to lower the jaw. The dynamic vowel formant plot in which F1 and F2
values are shown at 20%, 50%, and 80% of vowel duration for each vowel revealed
lowering of /eI/ and raising of /ʊ/ in the strained condition compared to the other two
conditions. In addition, /u/ was produced with greater tongue backing in the normal
condition compared to the fronted /u/ vowels for the breathy and strained conditions. This
varied vowel production may have affected accurate identification of /eI/, which was the
Page 47
VOCAL QUALITY DEFICITS AND VOWEL PERCEPTION
37
most commonly misidentified vowel in the strained condition, though it was also
misidentified relatively frequently in breathy and normal conditions. The vowels /ʊ/ and
/u/ did not have a high incidence of misidentification in the normal condition, so the
formant differences were not large enough to affect their identifiability.
Measures of fundamental frequency (f 0) were used to determine whether vocal
pitch was held constant across conditions. There was no significant difference for f 0
across quality types, indicating vocal pitch was similar across all three groups of stimuli.
Vowel duration was measured to determine vowel length was relatively constant.
Strained vowels were an average of 0.08ms longer than normal and breathy vowels.
While duration differences were relatively small (about 90 ms longer at most), the large
effect size suggested a consistent effect occurring on all ten vowels.
Did listeners notice voice quality differences?
Voice quality was highly salient to listeners. Ratings for strained and breathy
conditions were significantly higher (poorer) than for the normally voiced vowels. On
average, breathy vowels were rated as poorer than normal vowels by 58 points on a 100
point scale. Strained vowels were rated as poorer than normal stimuli by 68 points and
poorer than breathy vowels by 10 points. Listeners had excellent inter-rater and intra-
rater reliability for this task. The presence of many "0" ratings for normal stimuli,
however, may have inflated the ICC score, however. Time and number of replays needed
were not significantly different across the three types of vowels, supporting the idea that
listeners made voice quality determinations with ease.
Did voice quality affect vowel goodness judgements?
Page 48
VOCAL QUALITY DEFICITS AND VOWEL PERCEPTION
38
Voice quality affected vowel goodness judgements. Both breathy and strained
vowels were rated significantly higher (poorer) than vowels in the normal voice quality
condition. On average, breathy vowels were rated poorer than normal vowels by 18
points on a 100 point scale and poorer than strained by 2 points. Strained vowels were
rated poorer than normal stimuli by 16 points. Inter-rater and intra-rater reliability for this
task was worse than for the voice quality rating task. Time to make decision and number
of replays needed were significantly different across the three types of vowels. Vowels
with breathy vocal quality provoked more replays and listeners took longer to enter
ratings than for the normal stimuli. Vowels with strained vocal quality also took longer
for listeners to rate, but the number of replays was not significantly greater than for the
normal stimuli. Listeners also reported vowel goodness rating task was more difficult
than the voice quality rating task. These results suggest that voice quality deficits
interfered with judgments of vowel goodness.
Did voice quality affect vowel identification?
Simulated voice quality deficits did not appear to affect vowel identification
accuracy, which was above 95% for all conditions. Neither time needed to identify
vowels nor number of stimuli replays were significantly different across the three voice
quality types. However, the high rates of accuracy (above 95% for all three types of
vowel stimuli) suggest that a ceiling effect may have occurred - the task may simply have
been too easy to reveal subtle effects of voice quality on vowel identification. Playing the
vowel stimuli in noise may reduce accuracy and eliminate the ceiling effect, providing a
more accurate understanding of the potential impact of vocal quality deficits on vowel
identification (Nabelek, 1988).
Page 49
VOCAL QUALITY DEFICITS AND VOWEL PERCEPTION
39
Limitations
One of the biggest issues with this study is the use of a single speaker to provide
stimuli. Having vowels produced by more speakers would support better generalization
of results. Several speakers attempted to perform the stimuli recording, but they were
unable to hold vowel production relatively constant while simulating breathy and strained
voice quality. Female voices have higher intelligibility overall (Kwon, 2010) and
intelligibility in dysarthria may be vulnerable to sex effects, so it will be important to
expand to male speakers (Kent et al.,1994). Secondly, the inconsistencies in vowel
production with regards to F1 and duration (Table 2) reduces the level of variable control.
It is possible that differences in tongue position, duration, or fundamental frequency in
addition to the desired voice quality differences contributed to poorer goodness ratings
for breathy or strained vowels. Thirdly, the vowel identification task may have been
vulnerable to the ceiling effect. Because identification accuracy was so high for all three
conditions, a ceiling effect may have masked difficulties in perceiving breathy and
strained vowels. Fourthly, our CPP values for strained voice did not match those for
Lowell and colleagues (2012) for an unknown reason that needs to be further explored.
Current literature on acoustic correlations of strained voice is limited, but using spectral
tilt measures like long-term average spectrum (LTAS) may be useful in guiding research.
Finally, the focus of this study on vowel perception at the phoneme level limits its
applicability to speech intelligibility in clinical practice. The results of this study should
be regarded as an early step in understanding the effect of voice quality deficits on real-
world communication skills.
Page 50
VOCAL QUALITY DEFICITS AND VOWEL PERCEPTION
40
Clinical Implications
The results of this study indicate that voice quality deficits are both readily
apparent to listeners and difficult to separate from judgments of vowel goodness. We
know that vowel perception is important to overall speech intelligibility (Kim et al.,
2011; Savageau et al., 2015; Monsen, 1983) and we know listeners need multiple
acoustic cues to judge vocal effort (Tasko, 2008), but the effects of disordered vocal
quality on vowel perception at the word or sentence level are still largely unknown.
Listeners in the present study did require more time and replays during the
relatively simple vowel goodness task for breathy and strained stimuli, suggesting they
may have exerted more effort on tokens with disordered voice quality. Sapir and
colleagues’ (2007) study on vowel goodness comparisons of loud speech and habitual
speech in PD may have been confounded by vocal quality changes. The loud speech
stimuli likely had better vocal quality than the habitual speech stimuli because the strong
vocal fold adduction required to produce high-intensity phonation also reduces
breathiness. The findings of the present study support that improved vocal quality may
have affected vowel goodness ratings in that study and, therefore, the authors’
conclusions reporting improved intelligibility due to louder speech and articulation
changes may be incomplete.
If vowel goodness rating is affected by voice quality deficits, it is logical to
assume that speech intelligibility will also be impeded by quality deficits due to
distraction or possibly increased effort required to understand speech with disordered
vocal quality. Research on tracheosphageal speech (Nagle & Eadie, 2012), and dysarthria
(Landa, Pennington et al., 2014; Cote-Reschny & Hodge, 2010) have found increased
Page 51
VOCAL QUALITY DEFICITS AND VOWEL PERCEPTION
41
listener effort associated with vocal quality deficits. Listener burden is a particular
concern with older populations. As part of the typical, healthy aging process older adults
have a higher chance of attention deficits, including both selective attention and sustained
attention (Zanto & Gazzaley, 2014). These subtle deficits have been shown to reduce the
ability to perform effortful listening tasks, particularly in “suboptimal” conditions
(Philips, 2016), which presumably may extend to disordered vocal quality. Considering
individual with some dysarthria etiologies are typically older adults and therefore, their
communication partners are more likely to be older adults, voice quality could have a
larger effect on these populations than expected. These findings support continued
research into the effects of voice quality deficits on intelligibility.
Directions of Future Research
Future research should increase task difficulty to eliminate the potential ceiling
effects for the vowel identification task. For example, vowel stimuli could be played in
noise that more closely replicates real-life conversational settings, improving the external
validity of results. Future research may expand tasks to sentence and conversation level
stimuli. Utilizing more “real-world” tasks like transcription of sentences produced with
simulated breathy and strained voice quality and intelligibility or effort judgments of
connected speech with voice quality deficits rather than vowel tasks will further elucidate
the impact of voice quality on functional communication. Increasing the number of
speakers simulating voice deficits and recruiting a larger sample size of listeners would
also improve the generalizability of the results.
In conclusion, this study found some data supporting the hypothesis that voice
quality deficits affect vowel perception in listeners. While data did not find increased
Page 52
VOCAL QUALITY DEFICITS AND VOWEL PERCEPTION
42
difficulty with vowel identification in the presence of disordered vocal quality, voice
quality was salient to listeners and goodness ratings were more difficult to make quickly
when stimuli had quality deficits. Functionally, these findings suggest listeners expend
more effort when listening to disordered vocal quality. This may affect overall
intelligibility, but study limitations require cautious interpretation until research is
expanded.
Page 53
VOCAL QUALITY DEFICITS AND VOWEL PERCEPTION
43
List of Appendices
Appendix A Training Script .............................................................................46
Appendix B Communication Matrices ...........................................................47
Page 54
VOCAL QUALITY DEFICITS AND VOWEL PERCEPTION
44
Appendix A. Study Script for training
Vowel Goodness
1. Double-click on Alvin3 icon to open program
2. File>Open Experiment
3. Click on appropriate .luax file
4. Enter subject code
5. Click on “start” button
6. Move slider
7. Click on “okay”
8. At end, click “Main menu”
Instructions
VIDtest-Practice for vowel identification task
• You are about to hear some single-syllable words spoken by a person using different
speech techniques. When you hear a word, you will also see ten words on the screen
written in standard English and in the International Phonetic Alphabet (IPA). Click on the
word that you heard.
VGtest-Practice for goodness judgements on single vowel
• You are going to hear some vowels spoken by a person using different speech techniques.
You are going to judge the goodness of each vowel you hear. The intended word will
appear on the screen. If the vowel you hear is a good example of that vowel, click on the
left side of the scale towards “good example.” If the vowel you hear is not a good
example of the vowel, click on the right-hand side of the line towards “poor example.”
Only pay attention to vowel quality, ignore any elements of nasality, resonance, or vocal
quality.
QualTest-Practice for goodness judgements on vocal quality
• You are going to hear some words spoken by a person using different speech techniques.
You are going to judge the goodness of the vocal quality you hear. If the voice sample
you hear is a good example of healthy voice quality, click on the left side of the scale
towards “good example.” If the vowel you hear is not a good example of healthy vocal
quality, click on the right-hand side of the line towards “poor example.” Only pay
attention to vocal quality, ignore any elements of nasality, resonance, or vowel quality.
Page 55
VOCAL QUALITY DEFICITS AND VOWEL PERCEPTION
45
Appendix B. Confusion matrix for breathy vowels, normal vowels, strained vowels
i ɪ eɪ ɛ æ ʌ ɑ oʊ ʊ u
i 46 0 2 0 0 0 0 0 0 0
ɪ 0 48 0 0 0 0 0 0 0 0
eɪ 0 4 39 5 0 0 0 0 0 0
ɛ 0 0 0 45 3 0 0 0 0 0
æ 0 0 0 0 48 0 0 0 0 0
ʌ 0 0 0 0 0 47 0 0 1 0
ɑ 0 0 0 0 1 1 46 0 0 0
oʊ 1 0 0 0 0 0 0 47 0 0
ʊ 0 0 0 0 0 1 0 0 47 0
u 0 0 0 0 0 1 0 2 1 44
Page 56
VOCAL QUALITY DEFICITS AND VOWEL PERCEPTION
46
Normal i ɪ eɪ ɛ æ ʌ ɑ oʊ ʊ u
i 45 2 1 0 0 0 0 0 0 0
ɪ 0 48 0 0 0 0 0 0 0 0
eɪ 0 1 44 3 0 0 0 0 0 0
ɛ 0 0 0 45 3 0 0 0 0 0
æ 0 0 0 0 48 0 0 0 0 0
ʌ 0 0 0 0 0 48 0 0 0 0
ɑ 0 0 0 0 1 0 47 0 0 0
oʊ 0 0 0 0 0 0 0 47 1 0
ʊ 0 0 0 0 0 1 0 0 47 0
u 0 0 0 0 0 0 0 1 1 46
Page 57
VOCAL QUALITY DEFICITS AND VOWEL PERCEPTION
47
Strained i ɪ eɪ ɛ æ ʌ ɑ oʊ ʊ u
i 47 0 1 0 0 0 0 0 0 0
ɪ 0 48 0 0 0 0 0 0 0 0
eɪ 0 2 42 4 0 0 0 0 0 0
ɛ 0 0 0 48 0 0 0 0 0 0
æ 0 0 0 0 48 0 0 0 0 0
ʌ 0 0 0 0 0 48 0 0 0 0
ɑ 0 0 0 0 2 0 46 0 0 0
oʊ 0 0 0 0 0 0 0 47 1 0
ʊ 0 0 0 0 0 1 0 0 47 0
u 0 0 0 0 0 0 0 1 2 45
Page 58
VOCAL QUALITY DEFICITS AND VOWEL PERCEPTION
48
References
American Speech and Hearing Association. Dysarthria. Retrieved from
http://www.asha.org/public/speech/disorders/dysarthria/
Bang Y., Min K., Sohn Y., Cho S. (2013). Acoustic characteristics of vowel sounds in
patients with Parkinson disease. NeuroRehabilitation, 32, 649–654.
Barsties v. Latoszek, B., Maryn, Y, Gerrits, E., & De Bodt, M. (2017). The acoustic
breathiness index (ABI): A multivariate acoustic model for breathiness. Journal
of Voice. doi: 10.1016/j.jvoice.2016.11.017.
Behrman, A. (2018). Speech and voice science. 3. San Diego: Plural Publishing.
Boersma, P., & Weenink, D. (2004). Praat: Doing phonetics by computer (Version 4.3)
[Computer software]. Retrieved from http://www.praat.org.
Boshes, B. (1996).Voice changes in Parkinsonism. Journal of Neurosurgery, 24, 286-
288.
Bunton, K. (2006). Fundamental frequency as a perceptual cue for vowel identification in
speakers with Parkinson's disease. Folia Phoniatrica et Logopaedica, 58(5), 323-
339. DOI: 10.1159/000094567
Caligiuri, M. (1989). The influence of speaking rate on articulatory hypokinesia in
parkinsonian dysarthria. Brain and Language, 36(3).
Canter, G. J. (1963). Speech characteristics of patients with parkinson’s disease: I
Intensity, pitch, and duration. J Speech Hear Disord, 28(3), 221-229. doi:
10.1044/jshd.2803.221.
Canter, G. J. (1965). Speech characteristics of patients with parkinson’s disease: III.
Articulation, diadochokinesis, and over-all speech adequacy. J Speech Hear
Disord, 30(3), 217-224. doi: 10.1044/jshd.3003.217.
Cleveland, L., Pimentel, J., Talarico, M. & Solomon, J. (2015). Vocal intensity and
speech intelligibility pre- and post-SPEAK OUT!® treatment. Poster presented at
the annual American Speech-Language-Hearing Association Convention, Denver,
CO.
Connor, N.P., Abbs, J., Cole, K., Gracco, V. (1989). Parkinsonian deficits in serial
multiarticulate movements for speech. Brain, 112, 997-1009.
Constantinescu, G., Theodoros, D., Russell, T., Ward, E., Wilson, S., & Wootton, R.
(2011). Treating disordered speech and voice in parkinson's disease online: A
Page 59
VOCAL QUALITY DEFICITS AND VOWEL PERCEPTION
49
randomized controlled non-inferiority trial. International Journal of Language &
Communication Disorders,46(1), 1-16. doi:10.3109/13682822.2010.484848
Cote-Reschny, K. J., & Hodge, M. M. (2010). Listener effort and response time when
transcribing words spoken by children with dysarthria. Journal of Medical
Speech-Language Pathology, 18(4), 24-35.
Darley, F. L., Aronson, A. E., & Brown, J. R. (1969). Clusters of deviant speech
dimensions in the dysarthrias. J Speech Hear Res, 12(3), 462-496. doi:
10.1044/jshr.1203.462.
De Bodt, M., Hernández-Dıaz, M., Van De Heyning, P. (2002). Intelligibility as a linear
combination of dimensions in dysarthric speech. Journal of Communication
Disorders, 35(3). 283-292.
Doyle, P. C., Danhauer, J. L., & Reed, C. G. (1988). Listeners' perceptions of consonants
produced by esophageal and tracheoesophageal talkers. J Speech Hear Disord,
53(4), 400-407. doi: 10.1044/jshd.5304.400.
Duffy, J. (2013). Motor speech disorders : Substrates, differential diagnosis, and
management. St. Louis, Mo.: Elsevier Mosby.
Dromey, C., & Ramig, L. (1998). Intentional changes in sound pressure level and rate:
Their impact on measures of respiration, phonation, and articulation. Journal
Speech and Hearing Research, 41, 1003–1018.
Dromey, C., Ramig, L. O., & Johnson, A. B. (1995). Phonatory and articulatory changes
associated with increased vocal intensity in Parkinson disease: A case study.
Journal of Speech, Language, and Hearing Research, 38, 751–764.
https://doi.org/10.1044/jshr.3804.751
Doyle, P., Danhauer, J. L., & Reed, C. G. (1988). Listeners' perceptions of consonants
produced by esophageal and tracheoesophageal talkers. Journal of Speech &
Hearing Disorders, 53(4), 400-407. http://dx.doi.org/10.1044/jshd.5304.400
Eadie, T., Day, A., Swain D., Lamvik, K., & Doyle, P. (2013). Auditory-perceptual
speech outcomes and quality of life after total laryngectomy. Otolaryngology –
Head and Neck Surgery.
Evitts, P., Starmer, H., Teets, K., Montgomery, C., Calhoun, L., Schulze, A., MacKenzie,
A., & Adams, L. (2016). The impact of dysphonic voices on healthy listeners:
Listener reaction times, speech intelligibility and listener comprehension.
American Journal of Speech-Language Pathology, 25, 561-575.
Fant, G (1960). Acoustic theory of speech production. The Hague: Mouton.
Page 60
VOCAL QUALITY DEFICITS AND VOWEL PERCEPTION
50
Franklin, A. D. & Stoel-Gammon, C. (2014). Using multiple measures to document
change in English vowels produced by Japanese, Korean, and Spanish speakers:
The case for goodness and intelligibility. Am J Speech Lang Pathology, 23(4),
625-640. doi: 10.1044/2014_AJSLP-13-0144.
Ferrand, C. T. (2018). Speech science: an integrated approach to theory and clinical
practice. NY, NY: Pearson.
Gayvert, R., & Hillenbrand, J. (2003). Open source software for speech perception
research. The Journal of the Acoustical Society of America, 113, 2260.
Gazewood, J., Richards, R., & Clebak, K. (2013). Parkinson disease: An update.
American Family Physician, 87(4), 267-73.
Greene, D.S. (1956). Fundamental frequency of the speech of the profoundly deaf
individuals: Unpublished doctoral dissertation. Purdue University, West
Lafayette, IN
Hansen, D., Gerrat B., & Ward. P. (1984). Cinegraphic observations of laryngeal function
in Parkinson’s disease. Laryngoscope 94, 348-353.
Haycock, G. (1933). The teaching of speech. Stoke-on-Trent: Hill & Ainsworth.
Heman-Ackah, Y., Michael, D., & Goding, G. (2002). The relationship between cepstral
peak prominence and selected parameters of dysphonia. Journal of Voice, 16(1),
20-27. doi:10.1016/S0892-1997(02)00067-X
Henton, C. G., & Bladon, R. A. W. (1985). Breathiness in normal female speech:
Insufficiency versus desirability. Language and Communication: An
Interdisciplinary Journal 5(3), 221-227.
Hillenbrand, J., Cleveland, R. A., & Erickson, R. L. (1994). Acoustic correlates of
breathy vocal quality. Journal of Speech Language and Hearing Research, 37(4),
769.
Hillenbrand, J. M., & Gayvert, R. T. (2005). Open source software for experiment design
and control. Journal of Speech, Language and Hearing Research, 48(1), 45–60.
Hillenbrand, J. & Houde, R. (1997). Acoustic correlates of breathy vocal quality:
dysphonic voices and continuous speech. Journal of Speech Language and
Page 61
VOCAL QUALITY DEFICITS AND VOWEL PERCEPTION
51
Hearing Research, 39, 311– 321.
Ho, A., Bradshaw, J., Iansek, R., & Alfredson, R. (1999). Speech volume regulation in
Parkinson’s disease: Effects of implicit cues and explicit instructions.
Neuropsychologia,37(13).
Hood, R.B. (1966). Some physical concomitants of the perception of speech rhythm of
the deaf: Unpublished doctoral dissertation. Stanford University: Stanford, CA.
Hustad, K. (2008). The relationship between listener comprehension and intelligibility
scores for speakers with dysarthria. Journal of Speech, Language, and Hearing
Research, 51, 562–573.
IBM Corp. (2013). IBM SPSS Statistics for Windows (Version 22.0) [Computer
software]. Armonk, NY: IBM Corp.
Jacewicz, E., Fox, R., & Salmons, J. (2006). Prosodic prominence effects on vowels in
chain shifts. Language Variation and Change, 18(3), 285-316.
Kent, R. D., & Read, C. (1992). The acoustic analysis of speech. San Diego, CA:
Singular Publishing Group.
Kent, R., & Rosenbek, J. (1982). Prosodic disturbance and neurologic lesion. Brain and
Language, 15, 259-291. 10.1016/0093-934X(82)90060-8.
Kim, H., Hasegawa-Johnson, M., & Perlman, A. (2011). Vowel contrast and speech
intelligibility in dysarthria. Folia Phoniatrica et Logopaedica, 63, 187–194.
Kitzing, P. (1986). LTAS criteria pertinent to the measurement of voice quality. Journal
of Phonetics, 14, 477-482.
Koo, T. K., & Li, M. Y. (2016). A guideline of selecting and reporting intraclass
correlation coefficients for reliability research. Journal of Chiropractic Medicine,
15(2), 155–163. http://doi.org/10.1016/j.jcm.2016.02.012
Kreiman, J. , Vanlancker‐Sidtis, D. & Gerratt, B. R. (2008). Perception of voice quality.
The Handbook of Speech Perception. doi:10.1002/9780470757024.
Lam J., Tjaden K. (2016). Clear speech variants: An acoustic study in parkinson’s
disease. Journal of Speech, Language, and Hearing Research, 59(4), 631-646.
doi:10.1044/2015_JSLHR-S-15-0216.
Lambacher, S. G., Martens, W. L., Kakehi, K., Margasinghe, C. A., & Molholt, G.
(2005). The effects of identification training on the identification and production
Page 62
VOCAL QUALITY DEFICITS AND VOWEL PERCEPTION
52
of American English vowels by native speakers of Japanese. Applied
Psycholinguistics, 26, 227–247.
Landa, S., Pennington, L., Miller, N., Robson, S., Thompson, V., & Steen, N. (2014).
Association between objective measurement of the speech intelligibility of young
people with dysarthria and listener ratings of ease of understanding. International
Journal of Speech-Language Pathology, 16(4), 408-416.
Laures, J. S. & Weismer, G. (1999). The effects of a flattened fundamental frequency on
intelligibility at the sentence level. J Speech Lang Hear Research, 42(5), 1148-
1156. doi: 10.1044/jslhr.4205.1148.
Laver, J. (1980). The phonetic description of voice quality. Cambridge studies in
linguistics, 31. Cambridge England: Cambridge University Press.
Liu, D., Kankare, E., Laukkanen, A., & Alku, P. (2017). Comparison of parametrization
methods of electroglottographic and inverse filtered acoustic speech pressure
signals in distinguishing between phonation types. Biomedical Signal Processing
and Control, 36, 183-193. doi:10.1016/j.bspc.2017.04.001
Logemann, J., & Fisher, H. (1981). Vocal tract control in parkinson's disease. Journal of
Speech and Hearing Disorders, 46(4), 348-348. doi:10.1044/jshd.4604.348
Lowell, S. Y., Kelley, R. T., Awan, S. N., Colton, R. H., & Chan, N. H. (2012). Spectral-
and cepstral-based acoustic features of dysphonic, strained voice quality. Annals
of Otology, Rhinology and Laryngology, 121(8), 539-548.
Ludlow, C.L., & Bassich, C.J. (1983). The results of acoustic and perceptual assessment
of two types of dysarthria. Clinical dysarthria, 121-153. San Diego: College-Hill Press.
Mazonni, D. (1999). Audacity: Free audio editor and recorder. [Computer software].
Retrieved from http://audacity.sourceforge.net/.
Martel-Sauvageau, V., Roy, J. P., Langlois, M., & Macoir, J. (2015). Impact of the LSVT
on vowel articulation and coarticulation in Parkinson's disease. Clinical
Linguistics & Phonetics, 29(6), 424–440
Michaelis, D., Gramss, T., & Strube, H. (1997) Glottal-to-noise excitation ratio: A new
measure for describing pathological voices. Acustica/Acta Acustica, 83, 700–
706. Miller, N., Noble, E., Jones, D., & Burn, D. (2006). Life with communication changes in
Parkinson’s disease. Age and Ageing, 35(3), 235–239.
https://doi.org/10.1093/ageing/afj053
Monsen, R. (1979).Acoustic qualities of phonation in young hearing-impaired children.
Page 63
VOCAL QUALITY DEFICITS AND VOWEL PERCEPTION
53
Journal of Speech and Hearing Research 48. 270-288.
Monsen, R. (1983). Voice quality and speech intelligibility among deaf children.
American Annals of the Deaf, 12-19.
Nabelek, A.K., & Letowski, T.R. (1988). Similarities of vowels in nonreverberant and
reverberant fields. The Journal of the Acoustical Society of America, 83 5, 1891-9.
Nagle, K. F., & Eadie, T. L. (2012). Listener effort for highly intelligible
tracheoesophageal speech. Journal of Communication Disorders, 45(3), 235-245.
Neel, A.T. (2009). Intelligibility of loud, amplified, and habitual speech in Parkinson
Disease, Journal of Speech, Language, and Hearing Research, 52, 1021-1033.
Neel, A.T. & Beveridge, A.C. (2006, November). Identification of loud- and habitual-
level vowels in Parkinson disease. Poster presented at the American Speech-
Language-Hearing Convention, Miami, FL
Noll, A. (1967). Cepstrum pitch determination. The Journal of the Acoustical Society of
America, 41(2), 293-309. doi:10.1121/1.1910339
Peterson, G.E. & Barney, H. (1952). Control methods used in a study of the vowels.
Journal of the Acoustical Society of America 24. 175–184.
Phillips, N. (2016). The implications of cognitive aging for listening and the FUEL
model. Ear Hear 37, 44–51.
Platt, L. J., Andrews, G., & Howie, P. M. (1980). Dysarthria of adult cerebral palsy:
Phonemic analysis of articulation errors. Journal of Speech and Hearing
Research, 23, 41–55.
Ramig, L. (1992) The role of phonation in speech intelligibility: A review and
preliminary data from patients with Parkinson’s disease. Intell. Speech Disorders
Theory, Measurement, and Management. 119-155.
Rogers, C. L., & Dalby, J. (2005). Forced-choice analysis of segmental production by
Chinese-accented English speakers. Journal of Speech, Language, and Hearing
Research, 48, 306–322.
Rusz J., Cmejla R., Tykalova T., Ruzickova H., Klempir J., Majerova V., et al. (2013).
Imprecise vowel articulation as a potential early marker of Parkinson’s disease:
effect of speaking task. J. Acoust. Soc. Am.,134(3). 2171–81.
Salkind, N. (2010). Encyclopedia of research design. Thousand Oaks, Calif.: Sage.
Samlan, R., Story, B., & Bunton, K. (2013) Relation of perceived breathiness to laryngeal
Page 64
VOCAL QUALITY DEFICITS AND VOWEL PERCEPTION
54
kinematics and acoustic measures based on computational modeling. Journal of
Speech, Language, & Hearing Research, 56, 1209–1223. doi.org/10.1044/1092-
4388(2012/12-0194)
Sapir S., Ramig L. O., & Fox C. M. (2011). Intensive voice treatment in Parkinson's
disease: Lee Silverman Voice Treatment. Expert Review of Neurotherapeutics,
11(6), 815–830. https://doi.org/10.1586/ern.11.43.
Sapir, S., Spielman, J., Ramig, L., Story, B., & Fox, C. (2007). Effects of intensive voice
treatment (LSVT ® ) on vowel articulation in dysarthric individuals with
idiopathic Parkinson's disease: Acoustic and perceptual findings. Journal of
Speech Language and Hearing Research, 50, 899-912.
Schulman, R. (1989). Articulatory dynamics of loud and normal speech. Journal Acoustic
Society of America, 85, 295–312.
Sheard, C., Adams, R. D., & Davis, P. J. (1991). Reliability and agreement of ratings of
ataxic dysarthric speech samples with varying intelligibility. Journal of Speech
Language and Hearing Research, 34(2), 285.
Skodda, S., Flasskamp, A., & Schlegel, U. (2011a). Instability of syllable repetition in
parkinson's disease—Influence of levodopa and deep brain stimulation. Movement
Disorders, 26(4), 728-730. doi:10.1002/mds.23439
Skodda S, Visser W, Schlegel U. (201b). Vowel articulation in Parkinson’s Disease. J.
Voice, 25, 467–472.
Skodda S., Gronheit W., Schlegel U. (2012) Impairment of vowel articulation as a
possible marker of disease progression in parkinson's disease. PLoS ONE, 7(2).
Smith, M., & Ramig, L. (1995) Intensive voice treatment in Parkinson’s disease:
Laryngostroboscopic findings. J Voice, 9. 453-459.
Smith, S., & Shaffer, D. (1995). Speed of speech and persuasion: Evidence for multiple
effects. Personality and Social Psychology Bulletin, 21, 1051-1060.
doi:10.1177/01461672952110006.
Spector, P., Subtelney, J., Whitehead, R., & Wirz, S. (1979). Description and evaluation
of a training program to reduce vocal tension in adult deaf speakers. The Volta
Review, 81(2), 81-90.
Stemple, J. C., Roy, N., & Klaben, B. (2014). Clinical voice pathology: theory and
management. San Diego, CA: Plural Publishing.
Sussman, J. E., & Tjaden, K. (2012). Perceptual measures of speech from individuals
Page 65
VOCAL QUALITY DEFICITS AND VOWEL PERCEPTION
55
with Parkinson’s Disease and multiple sclerosis: Intelligibility and beyond.
Journal of Speech Language and Hearing Research, 55(4), 1208.
Tasko, S., Parker, M., & Hillenbrand, J. (2008). Acoustic correlates of vocal effort. The
Journal of the Acoustical Society of America, 124(4), 2496-2496.
Titze, I. (2000). Principles of voice production. Iowa City, Ia: National Center for Voice
and Speech.
Tjaden, K. (2008). Speech and swallowing in Parkinson’s Disease. Topics in Geriatric
Rehabilitation, 24(2), 115–126.
http://doi.org/10.1097/01.TGR.0000318899.87690.44
Tykalova, T., Rusz, J., Klempir, J., Cmejla, R., & Ruzicka, E. (2017). Distinct patterns of
imprecise consonant articulation among parkinson’s disease, progressive
supranuclear palsy and multiple system atrophy. Brain and Language, 165, 1-9.
doi:10.1016/j.bandl.2016.11.005
Ward, E. C., Theodoros, D. G., & Murdoch, B. (2000). Changes in articulatory pressures
following the Lee Silverman Voice Treatment Program. Paper presented at the
Conference on Motor Speech, San Antonio, TX.
Watts, C. R. (2016). A retrospective study of long-term treatment outcomes for reduced
vocal intensity in hypokinetic dysarthria. BMC Ear, Nose, and Throat Disorders,
16, 2. http://doi.org/10.1186/s12901-016-0022-8.
Watts, C.R. & Awan, S.N. (2011). Use of spectral/cepstral analyses for differentiating
normal from hypofunctional voices in sustained vowel and continuous speech
contexts. Journal of Speech, Language, and Hearing Research, 54(6), 1525-37.
doi:10.1044/1092-4388.
Weismer G., Kent R., Hodge M., & Martin R (1988). The acoustic signature for
intelligibility test words. The Journal of the Acoustical Society of America. 84.
1281-91.
Zanto T. P., Gazzaley A. A. C. Nobre, S. Kastner. (2014). Attention and ageing: The
Oxford handbook of attention. Oxford, United Kingdom: Oxford University Press.
927–971.
Zraick, R. I., Kempster, G. B., Connor, N. P., Thibeault, S., Klaben, B. K., Bursac, Z., &
Glaze, L. E. (2011). Establishing validity of the consensus auditory-perceptual
evaluation of voice (CAPE-V). American Journal of Speech-Language
Pathology, 20(1), 14-22. doi: 10.1044/1058-0360(2010/09-0105).
Zwirner, P., & Barnes, G. (1992). Vocal tract steadiness: A measure of phonatory and
Page 66
VOCAL QUALITY DEFICITS AND VOWEL PERCEPTION
56
upper airway motor control during phonation in dysarthria. Journal of Speech and
Hearing Research, 35(4), 761-


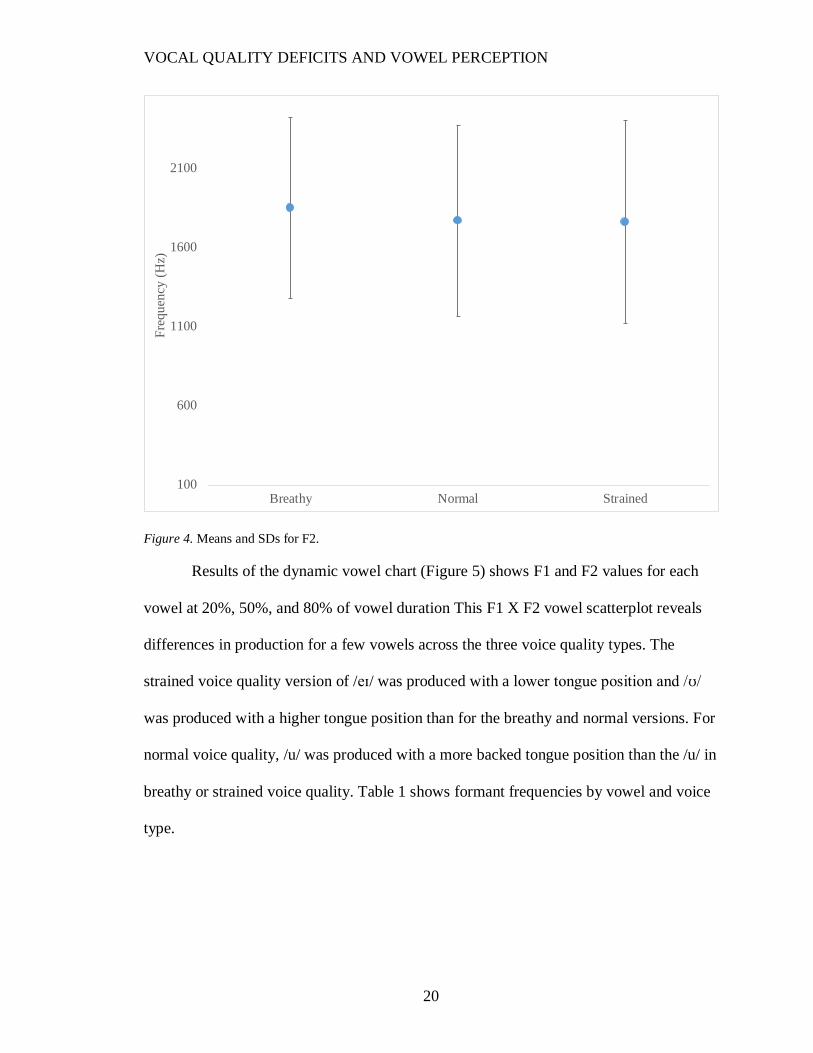

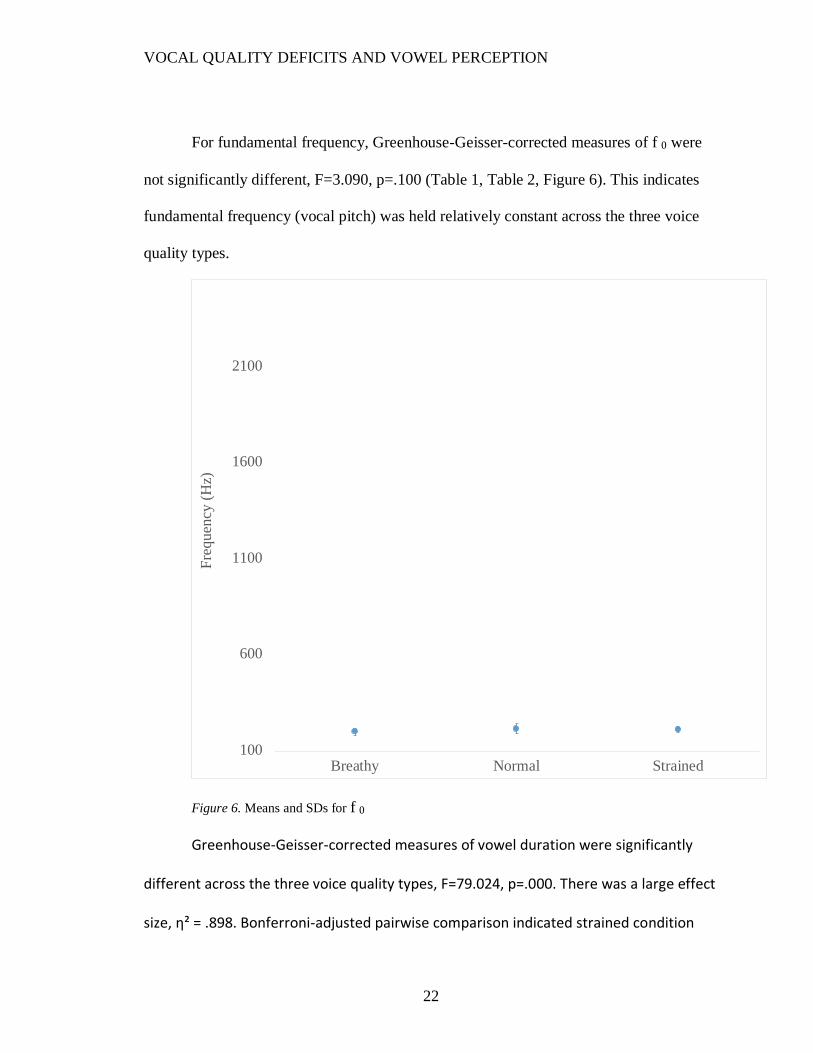

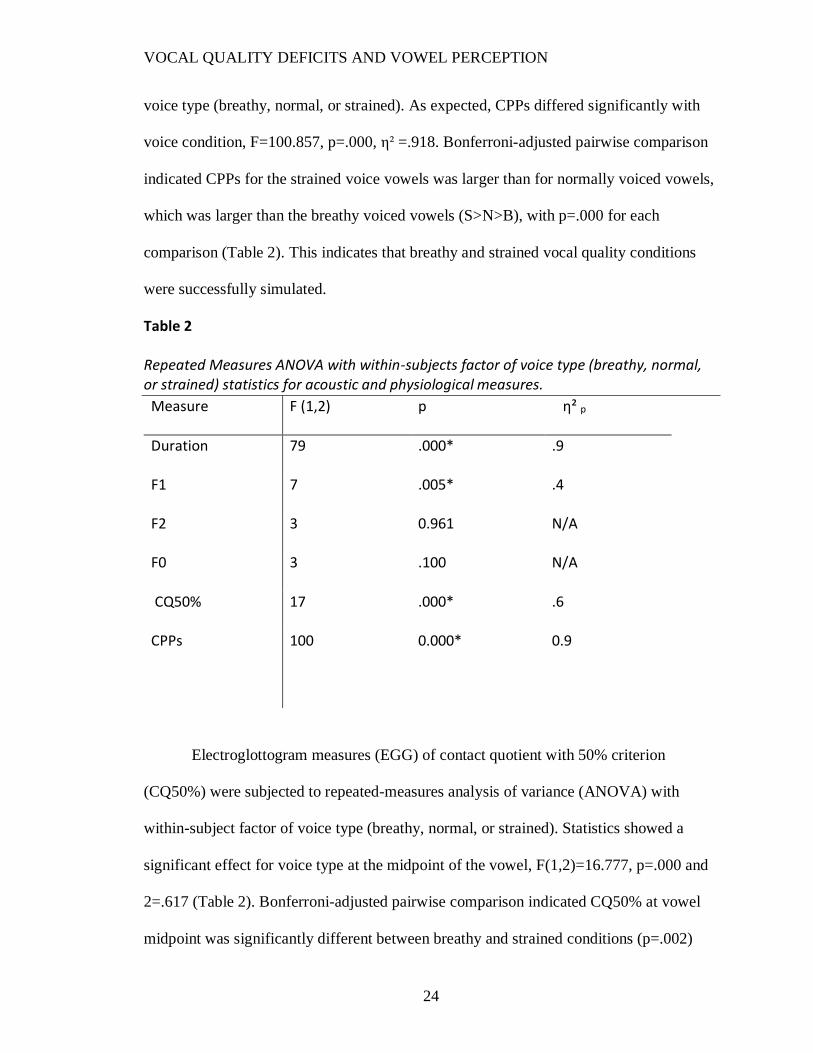
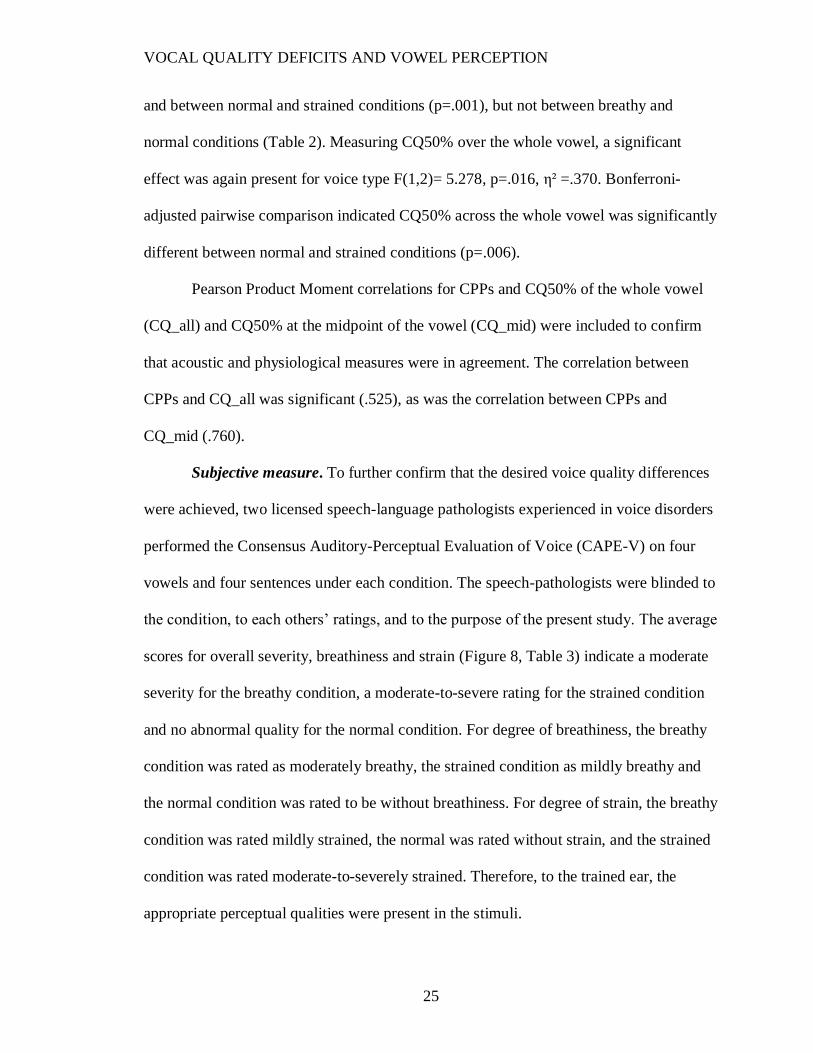
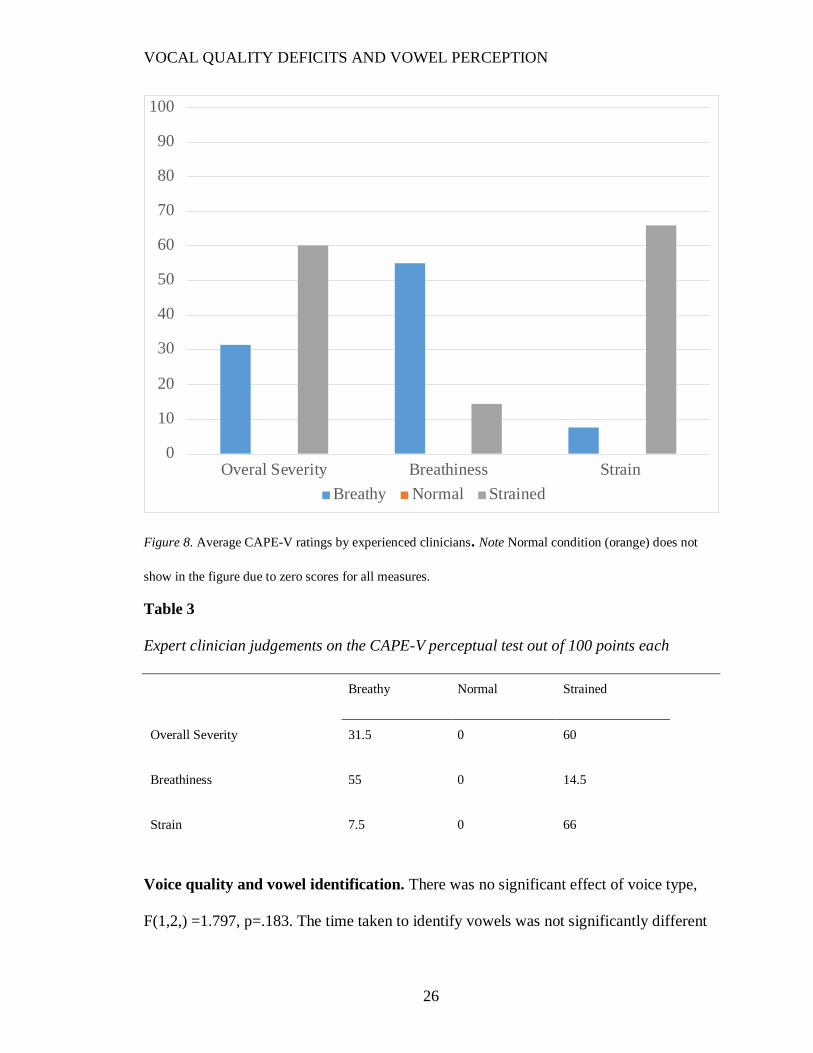


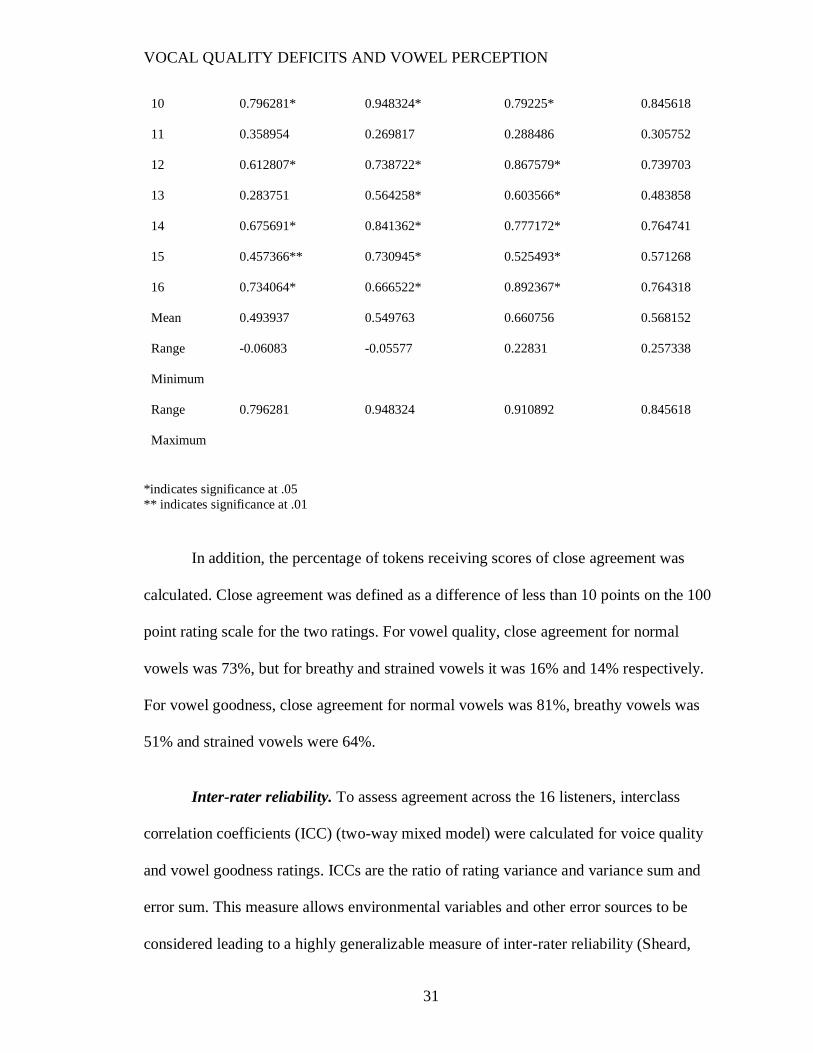


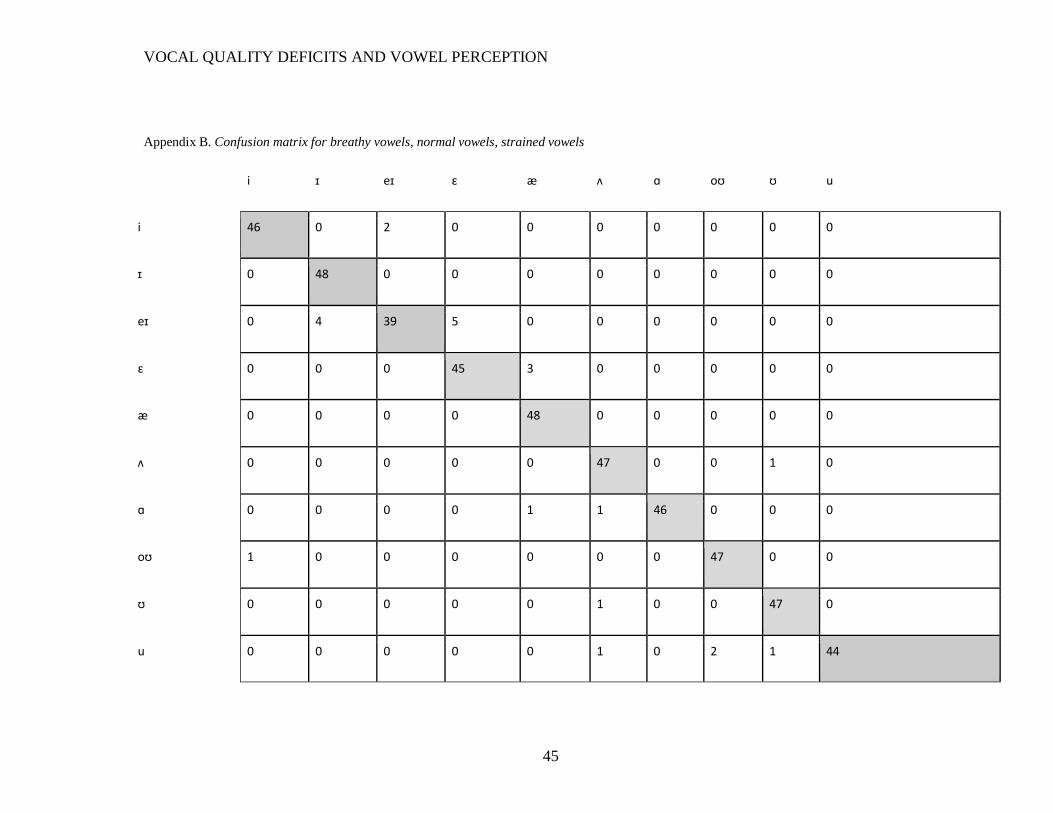
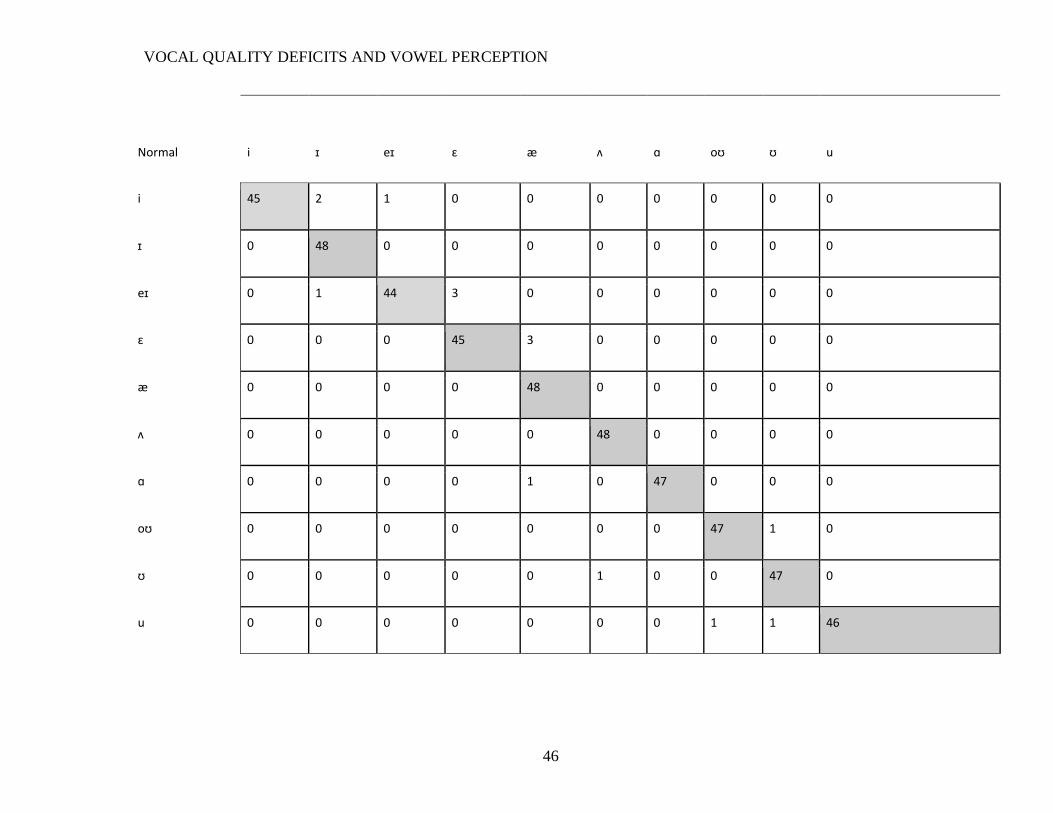


![SSC - prepadda.comprepadda.com/wp-content/uploads/english/ARTICLE IMPORTANT NOTES[].pdf Means to say ( ) Vowel Consonant Consonant Vowel Vowel = Vowel Consonant = Consonant ... I had](https://static.documents.pub/doc/80x56/5e4437036ae6ba6d743ded6b/ssc-prepaddacomprepaddacomwp-contentuploadsenglisharticle-important-notes.jpg)

