The Effect of ENSO on Tibetan Plateau Snow Depth: A Stationary WaveTeleconnection Mechanism and Implications for the South Asian Monsoons
JEFFREY SHAMAN
Department of Earth and Planetary Sciences, Harvard University, Cambridge, Massachusetts
ELI TZIPERMAN
Department of Earth and Planetary Sciences, and Division of Engineering and Applied Sciences, Harvard University,Cambridge, Massachusetts
(Manuscript received 30 January 2004, in final form 17 July 2004)
ABSTRACT
An atmospheric stationary wave teleconnection mechanism is proposed to explain how ENSO may affectthe Tibetan Plateau snow depth and thereby the south Asian monsoons. Using statistical analysis, the shortavailable record of satellite estimates of snow depth, and ray tracing, it is shown that wintertime ENSOconditions in the central Pacific may produce stationary barotropic Rossby waves in the troposphere witha northeastward group velocity. These waves reflect off the North American jet, turning equatorward, andenter the North African–Asian jet over the eastern Atlantic Ocean. Once there, the waves move with thejet across North Africa, South Asia, the Himalayas, and China. Anomalous increases in upper-troposphericpotential vorticity and increased wintertime snowfall over the Tibetan Plateau are speculated to be asso-ciated with these Rossby waves. The increased snowfall produces a larger Tibetan Plateau snowpack, whichpersists through the spring and summer, and weakens the intensity of the south Asian summer monsoons.
1. Introduction
Many facets of the global climate system have beenexamined for their connections with the monsoons ofAsia. In particular, the effects of two large-scale phe-nomena, Eurasian snowpack levels and the El Niño–Southern Oscillation (ENSO), have long been exploredfor their interaction with Asian monsoon rainfall. Thecovariability of the Indian monsoons and ENSO hasbeen examined in numerous studies (Walker 1924; Ras-musson and Carpenter 1983; Ropelewski and Halpert1987; Webster and Yang 1992; Mehta and Lau 1997;Webster et al. 1999). During El Niño events, the Indianmonsoon is generally weaker; however, recent evidenceindicates this relationship may have broken down(Kumar et al. 1999).
Blanford (1884) first hypothesized that climate con-ditions over India could be affected by the size of the
Himalayan snowpack. Changes in the size of this snow-pack alter the heating of the land surface and overlyingatmosphere, which in turn affects the land–sea thermalgradient and monsoon rainfall rates. Recent studieshave explored the effects of both Eurasian snow coverand snow volume (depth) on the Indian monsoons. Ob-servational investigations have demonstrated inverserelationships between Eurasian snow cover and subse-quent summer rainfall over India (Hahn and Shukla1976; Sankar-Rao et al. 1996). Kripalani et al. (1996)used satellite estimates of snow depth and found aninverse relationship between snow depth over areas ofthe former Soviet Union and Indian monsoon rainfall(IMR). Similarly, Bamzai and Shukla (1999) found evi-dence for a relationship between snow depth over cen-tral Eurasia and June–September IMR. Others havenoted a dipole effect, with less western European/Russia snow depth and more central Siberia snowdepth associated with greater Indian rainfall in the fol-lowing season (Kripalani and Kulkarni 1999; Ye andBao 2001). Model simulations of the global climate sys-tem have also indicated that an inverse relationship ex-ists between snow on the Eurasian continent and Indian
Corresponding author address: Dr. Jeffrey Shaman, Depart-ment of Earth and Planetary Sciences, Harvard University, 207Hoffman Laboratories, 20 Oxford St., Cambridge, MA 02138.E-mail: [email protected]
15 JUNE 2005 S H A M A N A N D T Z I P E R M A N 2067
monsoon rainfall (Barnett et al. 1989; Meehl 1994;Bamzai and Marx 2000).
Snowpack levels on the Tibetan Plateau region areparticularly critical to the south Asian monsoons; up-per-tropospheric air temperatures above elevated landsurfaces (3000–5000 m) have been demonstrated to besignificantly warmer than corresponding air tempera-tures above surfaces at lower elevations (Molnar andEmanuel 1999). The Tibetan Plateau region (with el-evations above 3000 m) supports a summertime highpressure ridge and the warmest summertime upper-tropospheric temperatures on the planet (Li and Yanai1996). This heating of the Tibetan Plateau is integrallyconnected with the south Asian monsoons. Both theupper-tropospheric temperature gradient between theHimalayas and the Indian Ocean and the summertimeheating of the Tibetan Plateau have been shown to beassociated with the onset of the south Asian monsoons(Luo and Yanai 1984; He et al. 1987; Yanai et al. 1992;Yanai and Li 1994; Li and Yanai 1996). Furthermore,the temperature gradient between the Tibetan Plateauand equatorial Pacific has been demonstrated to be as-sociated with Indian monsoon rainfall (Fu and Fletcher1985), and spring snow depth on the Tibetan Plateauhas been shown to be inversely associated with mon-soon rainfall over Bangladesh (Shaman et al. 2005,manuscript submitted to Int. J. Remote Sens., hereafterSCK).
An increased Tibetan Plateau snowpack not only in-creases land surface albedo, absorbed solar radiationthat would otherwise have heated the land surface in-stead melts and sublimates the snowpack. The meltingsnow in turn increases land surface wetness, so thatsubsequent evaporation further cools the land surface.In addition, more energy is required to evaporate sur-face wetness; the specific heat of ice and land are aboutthe same, but the specific heat of water is double thatamount. Consequently, an increased Tibetan Plateausnowpack reduces the land–sea summer thermal gradi-ent between the Himalayas and the Indian Ocean, con-sistent with the observed inverse relationship betweenEurasian snowpack and the south Asian monsoons(Hahn and Shukla 1976; Dickson 1984; Ropelewski andHalpert 1989; Bamzai and Shukla 1999; SCK).
Many studies have explored the effects of snow onthe monsoons, but the processes affecting Eurasiansnowpack size are not fully understood. Yang (1996)found Eurasian winter snow cover to be associated withENSO conditions such that snow cover increased dur-ing El Niño winters. Using a global atmospheric generalcirculation model (GCM), Meehl (1997) developed thehypothesis that the south Asian monsoons were an ac-tive component of the tropospheric biennial oscillation
(TBO), and that midlatitude (Eurasian) snow coverwas affected by TBO variability. This work postulateddecreased Eurasian snow during an El Niño event. Inanother, contrasting, modeling study, Dong and Valdes(1998) found evidence that El Niño conditions lead toincreased snow mass on Eurasia.
Given these conflicting findings, the processes con-trolling the interannual variability of the Eurasiansnowpack and its relation to ENSO warrant further in-vestigation. In this study, we focus on the relationshipbetween Tibetan Plateau snow depth and ENSO. Weexamine a number of observed and reanalysis fields forconnections between interannual snow depth variabil-ity over the Tibetan Plateau and ENSO. We provideevidence that spring and summer Tibetan Plateau snowdepth anomalies may be the result of increased winter-time storminess over the Himalayas, and that thisstorminess may be modulated by ENSO. The mecha-nism responsible for this modulation is proposed: sta-tionary barotropic Rossby waves with an eastwardgroup velocity propagate from the central Pacific, overthe Atlantic Ocean, and toward the Himalayas. Similarstationary barotropic Rossby waves teleconnectionshave been studied at length using linearized barotropicmodels (e.g., Sardeshmukh and Hoskins 1988), ray trac-ing calculations (e.g., Hoskins and Karoly 1981), anddata analysis in the context of ENSO teleconnectionswithin the Pacific (Chen 2002). We speculate here thatthe stationary barotropic Rossby waves excited in theatmosphere by El Niño convection reach the North Af-rican–Asian jet and cause an increase in storminessover the Himalayas, affecting snow accumulation there.The enhanced snow cover then persists to the next sum-mer and affects the contrast in temperature betweenthe warm air above the Tibetan Plateau and the coolerair above the Indian Ocean, which in turn affects thestrength of the Indian monsoons.
Some of the logical links in the above proposed tele-connection mechanism are based on an available short(9 yr) satellite record of snow depth on the TibetanPlateau, and are necessarily speculative for this reason.We still feel that the proposed teleconnection mecha-nism, supported by the other statistical analysis and raytracing calculations in this paper, is potentially a viableexplanation for some of the observed ENSO–monsoonregion correlations.
In section 2 we present the data used for this study.Section 3 presents some statistical analysis of TibetanPlateau snow depth and ENSO variability. Section 4presents composite analyses of potential vorticity diag-nostics using the National Centers for EnvironmentalPrediction–National Center for Atmospheric Research
2068 J O U R N A L O F C L I M A T E VOLUME 18
(NCEP–NCAR) reanalysis. Section 5 explores the pro-posed mechanism by which ENSO forcing may affectsnowfall over the Tibetan Plateau. Section 6 providesdiscussion.
2. Data and methodology
a. Snow depth data
In this study we work with snow depth rather thansnow cover, because both model and observationalstudies have shown that snow volume, or depth, is abetter predictor of monsoon intensity than snow coverarea (Barnett et al. 1989; Kripalani and Kulkarni 1999;Ye and Bao 2001). This finding follows from the simplethermodynamic considerations discussed in the intro-duction. We used the Nimbus-7 Scanning MultichannelMicrowave Radiometer (SMMR) satellite estimates ofsnow depth. This satellite sensor was in good operationfrom November 1978 to August 1987. Its passive mi-crowave data can be used to measure snow extent andcalculate snow depth on an areal basis using the differ-ence between brightness temperatures in the 18- and37-GHz channels (Chang et al. 1987). Monthly snowdepth anomalies for the area 25°–35°N, 75°–100°E (theHimalayas and Tibetan Plateau) were determined andused.
b. ENSO and SST data
The Niño-3 region (5°N–5°S, 150°–90°W) was the in-dex of ENSO used for this study (Kaplan et al. 1998).The global distributed SST anomaly data (5° � 5° reso-lution), from which the Niño-3 index is derived (Kaplanet al. 1998), were also employed.
c. NCEP–NCAR reanalysis
NCEP–NCAR reanalysis project monthly globalfields for January–February–March (JFM) 1949–2002were used in this study (Kalnay et al. 1996). Variablesemployed included temperature, relative vorticity, geo-potential height, zonal and meridional wind speed, andstreamfunction. For analysis of storm activity, dailyNCEP–NCAR reanalysis project geopotential heightfields for JFM 1949–2002 were high-pass filtered (�4days) using a Butterworth filter.
d. Upper-tropospheric potential vorticity diagnosis
Maps of potential temperature at the tropopause (asidentified by a surface of constant potential vorticity)are commonly used as a diagnostic of cyclogenesis inthe troposphere (Hoskins et al. 1985; Davis and Eman-uel 1991). The tropopause acts as an upper boundary to
the troposphere; perturbations of potential tempera-ture at the tropopause are equivalent to potential vor-ticity anomalies in the upper troposphere (Bretherton1966). Thus, determination of potential temperatureanomalies at the tropopause provides a powerful diag-nostic tool of potential vorticity conditions within theupper troposphere.
Following the methods of Davis and Emanuel (1991),the location of the tropopause was determined usingErtel’s potential vorticity (EPV):
q � �g� f � ��d�
dp, �2.1�
where q is the estimate of EPV, g is the accelerationdue to gravity, f is the Coriolis parameter, � is relativevorticity, and is the potential temperature. EPV wascalculated globally across all pressure levels.
Per Davis and Emanuel (1991), the tropopause wasdefined as the isobar of q � 1.5 PVU (1 PVU �1e�6K*m2 s�1 kg�1) poleward of 10°N and 10°S. Thepotential temperature field was then interpolated ver-tically to ascertain its value at the tropopause (1.5PVU).
3. ENSO, snow depth accumulation, and thepersistence of seasonal snow depth anomalies
In this section we use lag–lead correlations to dem-onstrate two main results. First, we show that wintersnow depth anomalies over the Tibetan Plateau persistthrough the spring and summer, when snowpack sizecan affect the summer monsoons. Second, we providesome evidence that wintertime ENSO conditions areassociated with increased snow accumulation over theTibetan Plateau.
Table 1 presents lag autocorrelations of Nimbus-7Tibetan Plateau seasonal snow depth within a calendaryear. These correlations indicate that snow depthanomalies indeed persist from winter to summer; Ti-betan Plateau wintertime snowpack accumulation thusaffects spring and summer snow depth levels. A similartendency is found in the monthly data (data not shown).This seasonal persistence of the snow depth anomalies
TABLE 1. Seasonal lag correlations of Nimbus-7 Tibetan Plateausnow depth within a calendar year.
15 JUNE 2005 S H A M A N A N D T Z I P E R M A N 2069
is consistent with the expected thermodynamic conse-quences of increased snow accumulation, which furthercools the land surface, as detailed in the introduction.
The Nimbus-7 SMMR snow depth record is unfortu-nately very short, spanning only two complete ENSOcycles. This record length therefore does not allow rig-orous statistical calculation of the linear correlation be-tween Tibetan Plateau snow depth and the Niño-3 in-dex. However, for qualitative purposes we have calcu-lated the point-by-point correlation of winter (JFM)SSTs in the Pacific Ocean with summer [June–July–August (JAS)] Tibetan Plateau Nimbus-7 snow depth.These point-by-point correlations exhibit a spatially co-herent ENSO pattern (Fig. 1). That is, central and east-ern tropical Pacific SSTs are positively correlated withincreased Tibetan Plateau snow depth. A similar resultis obtained for point-by-point correlation of winterSSTs with spring [April–May–June (AMJ)] TibetanPlateau snow depth (not shown). This coherent spatialstructure suggests a possible link between snow depthand ENSO, although the correlations presented cannotbe taken as statistically significant.
While the satellite measurements suggest that North-ern Hemisphere spring and summer Tibetan Plateausnow depth may be associated with Northern Hemi-sphere winter El Niño events, the satellite record isshort and additionally provides no direct informationabout Northern Hemisphere winter storm activity overthe Tibetan Plateau. To explore the relationship be-tween ENSO and storm activity over the Tibetan Pla-teau we next correlated Northern Hemisphere winterseason high-pass (�4 days) eddy variance of 200-mbgeopotential height (1949–2002) with concurrentNiño-3 index values. This longer time record analysisshows that a statistically significant (r � 0.30; p �0.05) strong positive correlation of the Niño-3 indexwith high bandpass eddy geopotential variance existsover much of the Tibetan Plateau (Fig. 2). Above theTibetan Plateau, correlations are as high as r � 0.49.
This finding demonstrates that increased storm activityoccurs over the Tibetan Plateau during Northern Hemi-sphere winter El Niño events. The cumulative effect ofthis increased JFM storm activity is apparent in theassociated snow depth anomalies evident in the follow-ing seasons (Table 1; Fig. 1). In the following sectionswe will examine how ENSO conditions in the Pacificmay affect wintertime storminess over the Tibetan Pla-teau and therefore the size of the spring and summersnowpacks.
4. Potential vorticity anomalies associated withsnow depth and ENSO
a. Composite snow maps
We use composite maps to diagnose the wintertimeatmospheric conditions associated with increasedspring and summer snow depth on the Tibetan Plateau.Composite maps were constructed by plotting the av-eraged tropospheric winter (JFM) potential tempera-ture during years of heavy spring or summer snowdepth (based on the Nimbus-7 data) minus that duringyears of light snow depth (Fig. 3). [Note that for thiscalculation we only represent summer by JJA ratherthan July–August–September (JAS) so that we can in-clude 1987 in the composite analysis.] Heavy and lightseasons were defined as �1 and �1 standard deviation,respectively. The maps show that over the Tibetan Pla-teau and extending eastward there is a large negativepotential temperature anomaly at the tropopause dur-ing the winter season preceding both heavy spring andsummer snow on the Tibetan Plateau. Shaded areas arestatistically significant (see figure caption).
The region of anomalously cold potential tempera-ture extends zonally across Asia and Africa, linking theAtlantic and Pacific Oceans (Fig. 3). These anomaliesmatch the latitude and extent of the North African–Asian jet (Branstator 1983, 2002). This jet has been
FIG. 1. Correlations of JFM SSTs with JAS Tibetan Plateau Nimbus-7 satellite snow depth;negative correlations are dashed. The short satellite record (9 yr) most likely prevents thesecorrelations from being statistically significant, yet the large-scale coherent structure hints atsome link between Tibetan Plateau snow depth and ENSO.
2070 J O U R N A L O F C L I M A T E VOLUME 18
shown to act as a waveguide, capable of connectingatmospheric activity at disparate regions of the globe; itis also associated with shifts in storm tracks and pat-terns of precipitation (Branstator 2002). We will nowshow that the cold anomaly may be due to a stationarywave pattern forced from the central and east equato-rial Pacific by El Niño conditions.
b. Composite ENSO maps
In the preceding composite analyses, we observedthat increased spring and summer snow depth are as-sociated with colder winter tropopause potential tem-perature anomalies. We next looked to determinewhether similar anomalies are associated with El Niño
FIG. 2. Correlation of high bandpass eddy variance of JFM NCEP–NCAR reanalysis 200-mbgeopotential height with concurrent Niño-3 index values (1949–2002). Only correlations ofr � 0.3 or higher, which are significant at p � 0.05, are shown; the contour interval iscorrelation increments of 0.05.
FIG. 3. Composite maps of JFM potential temperature at the tropopause (defined as 1.5PVU) based on heavy minus light Nimbus-7 Tibetan Plateau snow depth in the followingspring and summer seasons. The height of the tropopause is determined using NCEP–NCARreanalysis as described in the text. (a) AMJ snow depth (heavy snow: 1983; light snow: 1984,1985); (b) JJA snow depth (heavy snow: 1982, 1983, 1987; light snow: 1984, 1985). The contourinterval is 5 K. Negative contours are dashed. Shaded areas are significant (p � 0.05) basedon bootstrap confidence intervals estimated by the generation of 5000 random compositemaps from the 1979–87 JFM NCEP–NCAR reanalysis record.
15 JUNE 2005 S H A M A N A N D T Z I P E R M A N 2071
events. We examined composite maps of tropopausepotential temperature during El Niño years minus LaNiña years. El Niño and La Niña years were definedusing the Niño-3 index (� 1 standard deviation). Figure4 presents this composite map; once again, a cold JFMpotential temperature anomaly is seen over the TibetanPlateau and across the Asian jet, this time associatedwith winter El Niño conditions. The correlation of theNorthern Hemisphere (0°–60°N) portion of this com-posite map with the heavy minus light snow year com-posite maps presented in Figs. 3a,b are quite high, atr � 0.74 and r � 0.60, respectively. In fashion similar tothe spring and summer snow depth composite maps,the JFM tropopause potential temperature anomaly isgreatest over the eastern Tibetan Plateau and extendseastward over China. The similarity between the snowcomposites (Fig. 3) and the ENSO composite (Fig. 4)indicates that some connection between ENSO and Ti-betan Plateau snow depth may exist.
Figure 5 presents composite plots of 200-mb JFMrelative vorticity for El Niño minus La Niña eventyears. In the central Pacific a wave train is evident ema-
nating due north. In addition, an alternating pattern ofhigh and low relative vorticity arcs northward and east-ward from the central equatorial Pacific Ocean (a nega-tive anomaly centered at 20°N, 145°W is followed by apositive anomaly centered over the southern UnitedStates, followed by a negative anomaly centered at24°N, 60°W, and then a positive anomaly again cen-tered at 15°N, 30°W); this wave train appears to turnequatorward over the United States at the latitude ofthe midlatitude jet stream and reaches the westerncoast of Africa just upstream of the North African–Asian jet. Increases in relative vorticity at 200 mb arealso seen extending zonally across Africa, the MiddleEast, Tibet, and China. Short wave trains such as theone identified here have been analyzed previously inthe context of ENSO teleconnections. Chen (2002) ana-lyzed 3 yr of winter NCEP–NCAR reanalysis data usingscale separation and identified a short wavenumber(zonal wavenumbers 4–15) wave train emanating fromthe subtropical West Pacific to North America, whichwas associated with the 1988 wintertime La Niña event.
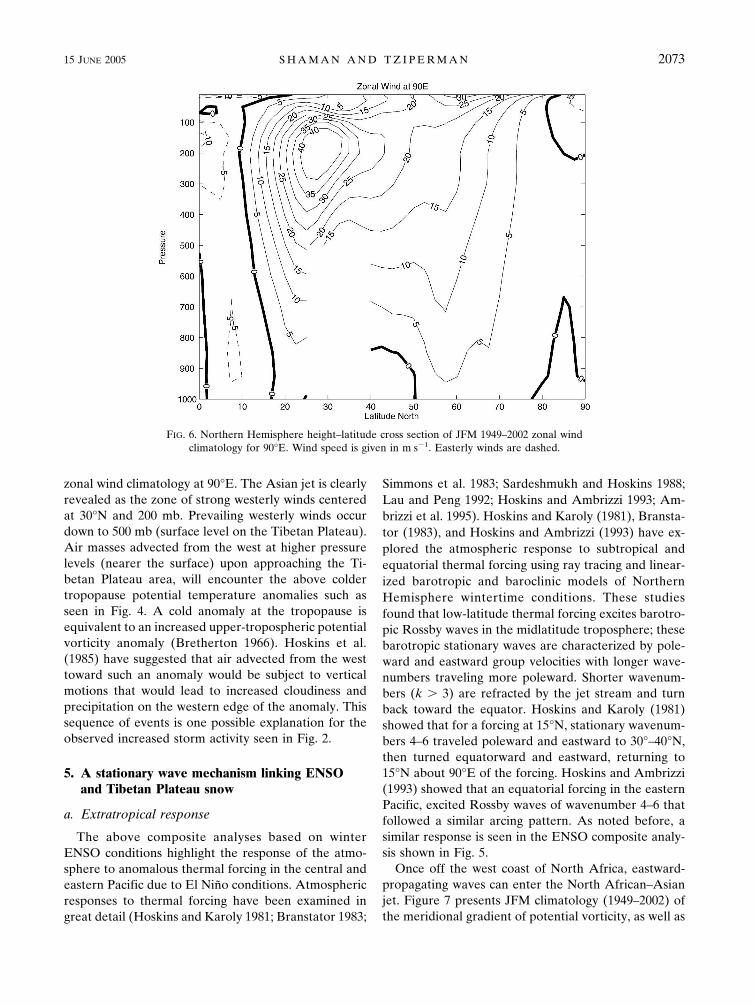
Figure 6 shows a height–latitude cross section of the
FIG. 4. Composite maps of JFM potential temperature at the tropopause (defined as 1.5PVU) based on JFM El Niño minus La Niña event years, using the Niño-3 record (�1standard deviation). El Niño years are 1958, 1966, 1973, 1983, 1987, 1992, and 1998; La Niñayears are 1950, 1956, 1968, 1971, 1974, 1976, 1985, 1989, and 2000. The contour interval is 5 K;negative contours are dashed. Shaded areas are significant (p � 0.05) based on bootstrapconfidence intervals estimated by generation of 5000 random composite maps from the 1949–2002 JFM NCEP–NCAR reanalysis record.
FIG. 5. The 200-mb relative vorticity composite maps based on El Niño minus La Niña eventyears, using the Niño-3 record (�1 standard deviation). El Niño years are 1958, 1966, 1973,1983, 1987, 1992, and 1998; La Niña years are 1950, 1956, 1968, 1971, 1974, 1976, 1985, 1989,and 2000. Contour intervals are 5 � 10�6 s�1. Negative contours are dashed.
2072 J O U R N A L O F C L I M A T E VOLUME 18
zonal wind climatology at 90°E. The Asian jet is clearlyrevealed as the zone of strong westerly winds centeredat 30°N and 200 mb. Prevailing westerly winds occurdown to 500 mb (surface level on the Tibetan Plateau).Air masses advected from the west at higher pressurelevels (nearer the surface) upon approaching the Ti-betan Plateau area, will encounter the above coldertropopause potential temperature anomalies such asseen in Fig. 4. A cold anomaly at the tropopause isequivalent to an increased upper-tropospheric potentialvorticity anomaly (Bretherton 1966). Hoskins et al.(1985) have suggested that air advected from the westtoward such an anomaly would be subject to verticalmotions that would lead to increased cloudiness andprecipitation on the western edge of the anomaly. Thissequence of events is one possible explanation for theobserved increased storm activity seen in Fig. 2.
5. A stationary wave mechanism linking ENSOand Tibetan Plateau snow
a. Extratropical response
The above composite analyses based on winterENSO conditions highlight the response of the atmo-sphere to anomalous thermal forcing in the central andeastern Pacific due to El Niño conditions. Atmosphericresponses to thermal forcing have been examined ingreat detail (Hoskins and Karoly 1981; Branstator 1983;
Simmons et al. 1983; Sardeshmukh and Hoskins 1988;Lau and Peng 1992; Hoskins and Ambrizzi 1993; Am-brizzi et al. 1995). Hoskins and Karoly (1981), Bransta-tor (1983), and Hoskins and Ambrizzi (1993) have ex-plored the atmospheric response to subtropical andequatorial thermal forcing using ray tracing and linear-ized barotropic and baroclinic models of NorthernHemisphere wintertime conditions. These studiesfound that low-latitude thermal forcing excites barotro-pic Rossby waves in the midlatitude troposphere; thesebarotropic stationary waves are characterized by pole-ward and eastward group velocities with longer wave-numbers traveling more poleward. Shorter wavenum-bers (k 3) are refracted by the jet stream and turnback toward the equator. Hoskins and Karoly (1981)showed that for a forcing at 15°N, stationary wavenum-bers 4–6 traveled poleward and eastward to 30°–40°N,then turned equatorward and eastward, returning to15°N about 90°E of the forcing. Hoskins and Ambrizzi(1993) showed that an equatorial forcing in the easternPacific, excited Rossby waves of wavenumber 4–6 thatfollowed a similar arcing pattern. As noted before, asimilar response is seen in the ENSO composite analy-sis shown in Fig. 5.
Once off the west coast of North Africa, eastward-propagating waves can enter the North African–Asianjet. Figure 7 presents JFM climatology (1949–2002) ofthe meridional gradient of potential vorticity, as well as
FIG. 6. Northern Hemisphere height–latitude cross section of JFM 1949–2002 zonal windclimatology for 90°E. Wind speed is given in m s�1. Easterly winds are dashed.
15 JUNE 2005 S H A M A N A N D T Z I P E R M A N 2073
the stationary wavenumbers as a function of location,calculated as (Hoskins and Ambrizzi 1993)
Ks � �� � �2u��y2
u �1�2
, �5.1�
where Ks is the local stationary wavenumber, u(y) is thetime mean zonal wind, � is the change in the Coriolisparameter with latitude, and y is latitude. There is alarge maximum in the meridional gradient of potentialvorticity that demarcates the North African–Asian jet.This jet is also apparent as a zonal band of maximumstationary wavenumbers flanked by lower stationarywavenumbers to the north and south (Fig. 7b). Asshown by Hoskins and Ambrizzi (1993), Rossby raysrefract toward latitudes with larger Ks. Thus, stationaryRossby waves within the jet will remain trapped andpropagate zonally across North Africa, the MiddleEast, the Tibetan Plateau and China, that is, the entirelength of the jet.
Conversely, stationary Rossby waves outside theNorth African–Asian jet cannot enter midway from thenorth or south, but must instead enter the jet at itsinception west of Africa. Thus, waves excited by con-vection in the central and eastern Pacific may propa-gate eastward into the entrance of the North African–Asian jet and alter wintertime snowpack accumulationon the Tibetan Plateau. We next show that this specu-lated wave propagation from the ENSO region to themonsoons region is supported by ray tracing calcula-tions.
b. Two-dimensional ray tracing
The preceding analysis of stationary wavenumbers(Fig. 7) provides a conceptual basis for understandingbarotropic Rossby wave propagation behavior in thereal atmosphere. Furthermore, it suggests that theENSO composite relative vorticity anomalies seen inFig. 5 may be the result of stationary barotropic Rossby
FIG. 7. (a) JFM 200-mb meridional gradient of potential vorticity; the contour interval is1 � 10�11 m�1 s�1; zero and negative contours are dashed. (b) Stationary wavenumbers [Eq.(5.1)]. Wavenumbers 4, 5, 6, and 7 are plotted. Wavenumber 7 is drawn thickened and dashedto highlight the North African–Asian jet. This contour is flanked closely by lower wavenumbercontours and thus illustrates how higher wavenumber Rossby waves refract toward the jetcenter. Both plots are derived from the 1949–2002 NCEP–NCAR reanalysis climatology.
2074 J O U R N A L O F C L I M A T E VOLUME 18
wave propagation. From 180° to 0° the relative vorticityanomalies evident in Fig. 5 are remarkably similar tothe forced solution of a linear vorticity equation modelemployed by Sardeshmukh and Hoskins (1988, hereaf-ter SH88). The forcing in the SH88 model was centeredat 5°S, 235°E, using a 150-mb wintertime (December1985–February 1986) mean flow as the basic state. Thestreamfunction response found in these forced linearsimulations (Fig. 7e of SH88) is quite similar to thatseen for the ENSO composite relative vorticityanomaly pattern presented here (Fig. 5). Both patternsresemble a wave train of zonal wavenumber 4 movingnortheastward from the forcing, reflecting off the NorthAmerican jet, and moving southeastward over the At-lantic to the entrance of the North African–Asian jet.
To further explore this possible wave train, we nextperformed Rossby wave ray tracing in the JFM 200-mbtime-mean atmosphere, accounting for both zonal andmeridional variations of flow. For this exercise, we fol-low the general theory of ray tracing in an anisotropicsystem (Whitham 1974; Lighthill 1978). FollowingKaroly (1983), we consider solutions to the nondiver-gent barotropic, quasigeostrophic vorticity equationlinearized about a time-mean basic state with stream-function (x, y). Within this framework the equationfor the perturbation streamfunction on a Mercator pro-jection of a sphere yields the following dispersion rela-tion:
� � uMk � �Ml ��l�q��x � k�q��y�
k2 � l2, �5.2�
where (uM, �M) � ((u, �)/cos�) is the Mercator projec-tion of the time-mean zonal and meridional winds; � islatitude; k and l are wavenumbers in the zonal andmeridional directions, respectively; and q � f0 � �y ��2 is the time-mean absolute vorticity. Using (5.2), thepath of a wave ray is found by integrating the fourequations for the path (x, y) and for the changing wave-numbers (k, l) (Karoly 1983). For time-mean fields, weused the 1949–2002 climatological NCEP–NCAR re-analysis JFM winds. This field was smoothed using alow-pass Butterworth filter.
The ray tracings were initiated with integer zonalwavenumbers k � 1–7 at forcing sites in the central andeastern equatorial Pacific. Initial meridional wavenum-bers, l, were determined using the dispersion relation(5.2) and values of uM, �M, �q/�x, and �q/�y at the initialpoint of the ray path (i.e., the forcing location for thewaves), assuming a zero frequency (stationary waves).The integrations for the ray paths were terminated after15 days. Figure 8 presents representative rays for sev-eral forcing sites and wavenumbers. Rossby wave rays
moving initially northward and eastward are reflectedoff the jet over North America and enter the NorthAfrican–Asian jet west of Africa. The ray path matchesthe arching pattern of anomalies in the 200-mb relativevorticity composite anomalies for El Niño minus LaNiña event years. Once in the North African–Asian jet,the rays remain confined and propagate eastward overSouth Asia and the Himalayas. The majority of forcinglocations between 0°–10°N and 150°–120°W with initialzonal wavenumbers 4 and 5 produced similar re-sponses. Many forcings with initial zonal wavenumbers1, 2, 3, and 6 also produced stationary Rossby wavesthat entered the North African–Asian jet.
While there is no clear stationary wave pattern ofpositive and negative vorticity anomalies within theNorth African–Asian jet (see Figs. 4 and 5) there doesappear a single-signed increase of relative vorticity su-perimposed on a wave pattern of wavenumber 4. Anumber of effects within the jet could be obscuring thedevelopment of a clearer stationary wave pattern andleading to this single-signed structure within the jet.These effects include wave–mean flow interaction andenergy conversion (Li and Nathan 1997) and the factthat different initial zonal wavenumber Rossby rays (1–6) enter the jet and become superpositioned.
The forced linear solution of SH88 (forcing centeredat 5°S, 235°E, using a 150-mb wintertime mean flow asthe basic state; Fig. 7e in SH88) provides evidence ofsimilar stationary Rossby wave propagation from thecentral and eastern Pacific to the entrance of the NorthAfrican–Asian jet. However, the SH88-forced solutiongives no clear delineation of a wave train in the NorthAfrican–Asian jet; rather, there are negative stream-function anomalies over Arabia and southeast China(analogous to the positive relative vorticity anomalieswe present in Figs. 5 and 8 here), while in betweenthese anomalies where the jet flows there is effectivelyzero streamfunction anomaly. This discrepancy in theNorth African–Asian jet region between the SH88-forced solution streamfunction anomalies and theENSO composite relative vorticity anomalies shownhere in Fig. 5 may be explained by the SH88 vorticitymodel formulations, which ignore vertical advectionand twisting terms in the vorticity balance. As SH88point out, these terms are “not insignificant in the jetstream regions.” The forced solution of the SH88 linearmodel therefore likely inadequately describes the re-sponse in the North African–Asian jet while better cap-turing the atmospheric response upstream of the jet.Thus, the SH88-forced solution appears to corroboratethe results and teleconnection we present here.
The ray tracing calculations hint at the possible
15 JUNE 2005 S H A M A N A N D T Z I P E R M A N 2075
means of signal propagation from the equatorial Pacificto the Tibetan Plateau, and a teleconnection mecha-nism from ENSO to the monsoons. Convection in thecentral and eastern equatorial Pacific, associated withEl Niño conditions, produces northward- and eastward-propagating stationary barotropic Rossby waves. Thesewaves reflect off the midlatitude jet over NorthAmerica, head equatorward over the Atlantic Ocean,and then enter the North African–Asian jet. Within thisjet, the wave energy moves across North Africa, southAsia, the Himalayas, and China, all the way to the Ti-betan Plateau.
We can now further speculate that anomalous upper-tropospheric conditions induced by these Rossby wavesover the Tibetan Plateau favor convection and winter-time snowfall, as hinted by the similarity of the com-posite maps for ENSO and snow depth (Figs. 3 and 4).
This increased snowfall over the Tibetan Plateau pro-duces a larger snowpack, which persists through thespring and summer and affects the south Asian mon-soons.
6. Discussion
We examined the effects of Northern Hemispherewintertime ENSO conditions on snow depth over theTibetan Plateau. Using the available short record ofNimbus-7 satellite seasonal snow depth estimates, high-pass eddy 200-mb geopotential variance, and theNiño-3 index we have shown that Northern Hemi-sphere winter storm activity and consequent spring andsummer snow depth on the Tibetan Plateau appear cor-related with JFM Pacific Ocean SSTs in that same year.
FIG. 8. Ray tracings of barotropic Rossby waves propagating eastward from the central Pacific to the Indian monsoon area. The1949–2002 NCEP–NCAR reanalysis JFM climatology is used as the basic state. Plots of the ray paths are superimposed on the 200-mbrelative vorticity composite maps based on El Niño minus La Niña event years also shown in Fig. 5. (a) The path of a Rossby ray,starting with an initial zonal wavenumber 4 at 5°N, 210°E, and following the wave for 15 days; (b) same as (a), starting with an initialzonal wavenumber 4 at 5°N, 222.5°E; (c) same as (a), starting with an initial zonal wavenumber 5 at 5°N, 210°E.
2076 J O U R N A L O F C L I M A T E VOLUME 18
Fig 8 live 4/C
A mechanism explaining this connection has been pro-posed. During an El Niño event, stationary barotropicRossby waves with an eastward group velocity escapenorthward and eastward from the central equatorial Pa-cific, but are then reflected equatorward from the mid-latitude jet and enter the North African–Asian jet,where they remain trapped in a narrow meridionalband. The anomalous stationary barotropic Rossbywaves entering the North African–Asian jet during ElNiño events seem to affect conditions within the jet,and may be associated with increased storminess overthe Tibetan Plateau. This wintertime storminess leadsto increased snow accumulation through the winter andincreased snow depth in the following spring and sum-mer seasons.
An increased spring and summer snowpack on theTibetan Plateau diminishes the meridional land–seathermal gradient that drives the south Asian monsoons.Thus, a strong wintertime El Niño would be associatedwith a weak south Asian monsoon during the followingsummer, which is generally the case for India (Walker1924; Rasmusson and Carpenter 1983; Ropelewski andHalpert 1987; Webster and Yang 1992; Mehta and Lau1997; Webster et al. 1999).
The vorticity anomalies observed within the NorthAfrican–Asian jet during El Niño events may increaseTibetan Plateau storminess and rates of wintertimesnow accumulation in a number of ways. The interac-tion of the westerly winds and the vorticity anomalies inthe upper troposphere above the Tibetan Plateau (Fig.5) is one possible explanation for the increased stormactivity (Hoskins et al. 1985). Alternatively, it has beendemonstrated that low-frequency barotropic alterationsof the atmosphere, such as shown here in the NorthAfrican–Asian jet during El Niño events, can create analtered steering effect sufficient to explain storm activ-ity anomalies (Branstator 1995). Local changes in baro-clinicity may also occur and affect storm frequency, andshifts in the jet, such as the southward shift of the NorthAfrican–Asian jet associated with El Niño events (datanot shown), could result in more disturbances reachingthe Tibetan Plateau. These effects may act individuallyor in consort, and no doubt are influenced by Himala-yan orography.
The present work was limited to the telecommunica-tion between ENSO and the Himalayas during theNorthern Hemisphere winter. We may further specu-late, however, that during the Northern Hemispheresummer, telecommunication between ENSO and themonsoons also occurs (Shaman and Tziperman 2005,manuscript submitted to J. Climate). Thus, the effect ofENSO on the monsoons may be twofold. Wintertimeconditions in the Pacific affect snowpack accumulation
on the Tibetan Plateau via eastward-propagatingRossby waves. In addition, during the Northern Hemi-sphere summer monsoons, the state of ENSO may in-fluence monsoon rainfall more directly via alteration ofcirculation, temperature, and subsidence patternswithin the Tropics. From this perspective both the timeof year and the strength of the ENSO event are impor-tant for determining the monsoon response.
The monsoons are the result of interactions amonglarge, persistent, regional components of the global cli-mate system (Tibetan Plateau snow, ENSO, IndianOcean SSTs) at different times of the year. The mecha-nism identified here shows how conditions in one sea-son (Northern Hemisphere wintertime ENSO) may af-fect those in another (spring and summer Tibetan Pla-teau snow depth and, by extension, south Asianmonsoon intensity). At present, GCM representationof the Asian monsoons is generally poor (Sperber et al.2001). Mean seasonal rainfall levels are not well repre-sented, nor are interannual and intraseasonal variabil-ity. Furthermore, the relationship between Indian rain-fall and ENSO in GCM simulations is often of thewrong sign. However, using mechanisms such as theone identified here, simpler dynamic predictive modelsmight be constructed. To build such models, and betterunderstand the monsoons, further research is needed toelucidate the interactions of regional components of themonsoon system.
Acknowledgments. This research was supported bythe NOAA Postdoctoral Program in Climate and Glob-al Change, administered by the University Corporationfor Atmospheric Research (for JS), by the McDonnellFoundation and by the NSF Climate Dynamics pro-gram Grant ATM 0351123. We thank M. Cane, K.Emanuel, L. Illari, and Y. Kushnir for helpful discus-sions.
REFERENCES
Ambrizzi, T., B. J. Hoskins, and H.-H. Hsu, 1995: Rossby wavepropagation and teleconnection patterns in the austral win-ter. J. Atmos. Sci., 52, 3661–3672.
Bamzai, A. S., and J. Shukla, 1999: Relation between Eurasiansnow cover, snow depth, and the Indian summer monsoon:An observational study. J. Climate, 12, 3117–3132.
——, and L. Marx, 2000: COLA AGCM simulation of the effectof anomalous spring snow over Eurasia on the Indian sum-mer monsoon. Quart. J. Roy. Meteor. Soc., 126, 2575–2584.
Barnett, T. P., L. Dumenil, U. Schlese, E. Roeckner, and M. Latif,1989: The effect of Eurasian snow cover on regional andglobal climate variations. J. Atmos. Sci., 46, 661–685.
Blanford, H. F., 1884: On the connexion of Himalayan snowfall
15 JUNE 2005 S H A M A N A N D T Z I P E R M A N 2077
and seasons of drought in India. Proc. Roy. Soc. London, 37,3–22.
Branstator, G., 1983: Horizontal energy propagation in a barotro-pic atmosphere with meridional and zonal structure. J. At-mos. Sci., 40, 1689–1708.
——, 1995: Organization of storm track anomalies by recurringlow-frequency circulation anomalies. J. Atmos. Sci., 52, 207–226.
——, 2002: Circumglobal teleconnections, the jet streamwaveguide, and the North Atlantic Oscillation. J. Climate, 15,1893–1910.
Bretherton, F. P., 1966: Critical layer instability in baroclinicflows. Quart. J. Roy. Meteor. Soc., 92, 325–334.
Chang, A., J. L. Foster, and D. K. Hall, 1987: Nimbus-7 derivedglobal snow cover parameters. Ann. Glaciol., 9, 39–45.
Chen, T.-C., 2002: A North Pacific short-wave train during theextreme phases of ENSO. J. Climate, 15, 2359–2376.
Davis, C. A., and K. A. Emanuel, 1991: Potential vorticity diag-nostics of cyclogensis. Mon. Wea. Rev., 119, 1929–1953.
Dickson, R. R., 1984: Eurasian snow cover versus Indian monsoonrainfall—An extension of the Hahn–Shukla results. J. Cli-mate Appl. Meteor., 23, 171–173.
Dong, B. W., and P. J. Valdes, 1998: Modelling the Asian summermonsoon rainfall and Eurasian winter/spring snow mass.Quart. J. Roy. Meteor. Soc., 124B, 2567–2596.
Fu, C., and J. O. Fletcher, 1985: The relationship between Tibet-tropical ocean thermal contrast and the interannual variabil-ity of Indian monsoon rainfall. J. Climate Appl. Meteor., 24,841–847.
Hahn, D. G., and J. Shukla, 1976: Apparent relationship betweenEurasian snow cover and Indian monsoon rainfall. J. Atmos.Sci., 33, 2461–2462.
He, H., J. W. McGinnis, Z. Song, and M. Yanai, 1987: Onset of theAsian summer monsoon in 1979 and the effect of the TibetanPlateau. Mon. Wea. Rev., 115, 1966–1995.
Hoskins, B. J., and D. J. Karoly, 1981: The steady linear responseof a spherical atmosphere to thermal and orographic forcing.J. Atmos. Sci., 38, 1179–1196.
——, and T. Ambrizzi, 1993: Rossby wave propagation on a re-alistic longitudinally varying flow. J. Atmos. Sci., 50, 1661–1671.
——, M. E. McIntyre, and A. W. Robertson, 1985: On the use andsignificance of isentropic potential vorticity maps. Quart. J.Roy. Meteor. Soc., 111, 877–947.
Kalnay, E., and Coauthors, 1996: The NCEP/NCAR 40-Year Re-analysis Project. Bull. Amer. Meteor. Soc., 77, 437–471.
Kaplan, A., M. Cane, Y. Kushnir, A. Clement, B. Blumenthal, andB. Rajagopolan, 1998: Analyses of global sea surface tem-perature 1856–1991. J. Geophys. Res., 103C, 18 567–18 589.
Karoly, D. J., 1983: Rossby-wave propagation in a barotropic at-mosphere. Dyn. Atmos. Oceans, 7, 111–125.
Kripalani, R. H., and A. Kulkarni, 1999: Climatology and vari-ability of historical Soviet snow depth data: Some new per-spectives in snow–Indian monsoon teleconnections. ClimateDyn., 15, 475–489.
——, S. V. Singh, A. D. Vernekar, and V. Thapliyal, 1996: Em-pirical study on Nimbus-7 snow mass and Indian summermonsoon rainfall. Int. J. Climatol., 16, 23–34.
Kumar, K., R. Kleeman, M. A. Cane, and B. Rajagopalan, 1999:Epochal changes in Indian monsoon–ENSO precursors. Geo-phys. Res. Lett., 26, 75–78.
Lau, K.-M., and L. Peng, 1992: Dynamics of atmospheric telecon-nections during the northern summer. J. Climate, 5, 140–158.
Li, C., and M. Yanai, 1996: The onset and interannual variabilityof the Asian summer monsoon in relation to land–sea ther-mal contrast. J. Climate, 9, 358–375.
Li, L., and T. R. Nathan, 1997: Effects of low-frequency tropicalforcing on intraseasonal tropical–extratropical interactions. J.Atmos. Sci., 54, 332–346.
Lighthill, J., 1978: Waves in Fluids. Cambridge University Press,504 pp.
Luo, H., and M. Yanai, 1984: The large-scale circulation and heatsources over the Tibetan Plateau and surrounding areas dur-ing the early summer of 1979. Part II: Heat and moisturebudgets. Mon. Wea. Rev., 112, 966–989.
Meehl, G. A., 1994: Coupled land–ocean–atmosphere processesand South Asian monsoon variability. Science, 266, 263–267.
——, 1997: The south Asian monsoon and the tropospheric bien-nial oscillation. J. Climate, 10, 1921–1943.
Mehta, V. M., and K.-M. Lau, 1997: Influence of solar irradianceon the Indian monsoon–ENSO relationship at decadal–multi-decadal time scales. Geophys. Res. Lett., 24, 159–162.
Molnar, P., and K. A. Emanuel, 1999: Temperature profiles inradiative–convective equilibrium above surfaces at differentheights. J. Geophys. Res., 104, 24 265–24 271.
Rasmusson, E. M., and T. H. Carpenter, 1983: The relationshipbetween eastern equatorial Pacific sea surface temperaturesand rainfall over India and Sri Lanka. Mon. Wea. Rev., 111,517–528.
Ropelewski, C. F., and M. S. Halpert, 1987: Global and regionalscale precipitation patterns associated with the El Niño/Southern Oscillation. Mon. Wea. Rev., 115, 1606–1626.
——, and ——, 1989: Precipitation patterns associated with thehigh index phase of the Southern Oscillation. J. Climate, 2,268–284.
SankarRao, M., K. M. Lau, and S. Yang, 1996: On the relationshipbetween Eurasian snow cover and the Asian summer mon-soon. Int. J. Climatol., 16, 605–616.
Sardeshmukh, P. D., and B. J. Hoskins, 1988: The generation ofglobal rotational flow by steady idealized tropical divergence.J. Atmos. Sci., 45, 1228–1251.
Simmons, A. J., J. M. Wallace, and G. W. Branstator, 1983: Baro-tropic wave propagation and instability, and atmosphericteleconnection patterns. J. Atmos. Sci., 40, 1363–1392.
Sperber, K. R., and Coauthors, 2001: Dynamical seasonal predict-ability of the Asian summer monsoon. Mon. Wea. Rev., 129,2226–2248.
Walker, G. T., 1924: Correlation in seasonal variations of weather.IV: A further study of world weather. Mem. Indian Meteor.Dept., 24, 275–332.
Webster, P. J., and S. Yang, 1992: Monsoon and ENSO—Selec-tively interactive systems. Quart. J. Roy. Meteor. Soc., 118,877–926.
2078 J O U R N A L O F C L I M A T E VOLUME 18
——, A. M. Moore, J. P. Loschnigg, and R. R. Leben, 1999:Coupled ocean–atmosphere dynamics in the Indian Oceanduring 1997–98. Nature, 401, 356–360.
Whitham, G. B., 1974: Linear and Nonlinear Waves. John Wileyand Sons, 636 pp.
Yanai, M., and C. Li, 1994: Mechanism of heating and the bound-ary layer over the Tibetan Plateau. Mon. Wea. Rev., 122,305–323.
——, ——, and Z. Song, 1992: Seasonal heating of the Tibetan
Plateau and its effects on the evolution of the Asian summermonsoon. J. Meteor. Soc. Japan, 70, 319–351.
Yang, S., 1996: ENSO–snow–monsoon associations and sea-sonal–interannual predictions. Int. J. Climatol., 16, 125–134.
Ye, H. C., and Z. H. Bao, 2001: Lagged teleconnections betweensnow depth in northern Eurasia, rainfall in Southeast Asiaand sea-surface temperatures over the tropical Pacific Ocean.Int. J. Climatol., 21, 1607–1621.
15 JUNE 2005 S H A M A N A N D T Z I P E R M A N 2079