Page 1
THE EFFECT OF HIV/AIDS DRIVEN LABOR ORGANIZATION ON AGROBIODIVERSITY: AN EMPIRICAL STUDY IN ETHIOPIA
Kidist Gebreselassiea*, Justus Wesselera and Ekko C. van Ierlanda
aEnvironmental Economics and Natural Resources Group, Wageningen University, The Netherlands
*Corresponding author contact e-mail: [email protected]
Paper prepared for presentation at the 106th seminar of the EAAE
Pro-poor development in low income countries: Food, agriculture, trade, and environment
25-27 October 2007 – Montpellier, France
Copyright 2007 by the authors. All rights reserved. Readers may make verbatim copies of this document for non-commercial purposes by any means, provided that this copyright notice appears on all such copies.
Page 2
THE EFFECT OF HIV/AIDS DRIVEN LABOR ORGANIZATION ON AGROBIODIVERSITY: AN EMPIRICAL STUDY IN ETHIOPIA
Abstract__Improved micronutrient intake contributes to delaying the progression of HIV into
AIDS and to reducing HIV infection rates. Higher agrobiodiversity in the homegarden
contributes to improving the nutritional status of farm households. Farm households with
HIV/AIDS affected members observe a decrease in labor supply and productivity causing
them to reallocate labor. The reallocation of labor may result in change in agrobiodiversity.
Sharecropping is often used to alleviate labor shortage in agricultural production. The purpose
of this paper is to analyze the implications of HIV/AIDS on agrobiodiversity through
sharecropping arrangements. The study is based on a survey among 205 farm households in
the Jimma zone of South Western Ethiopia. Results show that HIV/AIDS driven increase in
sharecropping has a positive effect on perennial and overall agrobiodiversity in the
homegarden. This offers additional intervention options to mitigate the impacts of HIV/AIDS
among farm households.
Key words: agrobiodiversity; Ethiopia; HIV/AIDS; labor organization; sharecropping
2
Page 3
I. Introduction
HIV/AIDS affects farm households in various ways. Two forces that explain the interplay
between HIV/AIDS, labor organization and nutrition make the rationale for the study. Firstly,
an increase in agrobiodiversity by improving nutrition (Johns, 2003; Gari, 2003 and Gari,
2004; Johns and Eyzaguirre, 2006) has a positive impact on HIV/AIDS mitigation (e.g.
Haddad and Gillespie, 2001; FAO/WHO, 2002; Castleman, Seumo-Fosso and Cogill, 2004;
Fawzi et al, 2004; Gillespie and Kadiyala, 2005; Stillwaggon, 2006). Secondly, HIV/AIDS
causes changes in labor organization (e.g. Loevinsohn and Gillespie, 2003; Bishop-Sambrook
et al. 2006) and crop choice towards less labor-intensive crops (e.g. Haddad and Gillespie,
2001). As increasing agrobiodiversity is labor intensive (Nair, 2001; Mendez, Lock and
Somarriba, 2001) and HIV/AIDS reduces labor supply (Barnett and Whiteside, 2002; Drimie,
2003; Loevinsohn and Gillespie, 2003; Gillespie and Kadiyala, 2005), HIV/AIDS may on the
one hand negatively affect agrobiodiversity but on the other hand as reallocation of labor may
increase time spent in homegardens, it may positively affect agrobiodiversity.
The purpose of our paper is to test the effect of HIV/AIDS driven changes in labor
organization on homegarden agrobiodiversity among farm households in Ethiopia in 2005.
Reduced form equations for the agrobiodiversity of perennial, annual, and overall crops are
estimated to test for the effect. Data for estimation is collected through a survey conducted on
205 farm households in Gomma and Kersa woredas in South West Ethiopia. Estimation
involves regression of agrobiodiversity indices on variables capturing labor organization and
variables controlling for other factors explaining agrobiodiversity.
Results show HIV/AIDS driven changes in labor organization, by employing sharecropping
arrangements, significantly increase homegarden agrobiodiversity, while employing hired
labor decreases homegarden agrobiodiversity.
3
Page 4
The paper is organized in such a way that the next section lays out the hypotheses for
testing in light of the research questions. A section describing the method of analysis follows
the section on the description of data and variables. The discussion of the results is followed
by the last section which presents the conclusions.
II. HIV/AIDS, Labor Organization and Agrobiodiversity: Hypotheses
A. Hypothesis 1: HIV/AIDS Affected Households Which Increase Sharecropping-out
Intensity of Their Fields Have Higher Agrobiodiversity in the Homegarden
We expect that HIV/AIDS affected households sharecrop-out a larger portion of their fields
and have a higher degree of agrobiodiversity in the homegarden. This is because increased
intensity of sharecropping-out fields is expected to release family labor from fields to increase
homegarden activities. This proposition has the underlying hypothesis that sharecropping-out
intensity increases among households which are affected by adult morbidity and mortality
which again needs to be tested for. We expect engagement in sharecropping is preferred over
employment of hired labor as it provides better incentives to increase productivity implying
less demand for supervision time (Ellis, 1993; Beckmann, 2000). Additionally, sharecropping
assists in easing cash constraint by deferring payment for labor and possibly other farm
inputs. Given that sharecropping-out eases some of the cash constraint, households which
sharecrop-out more are more likely to increase labor supply for the homegarden rather than
for off-farm activities.
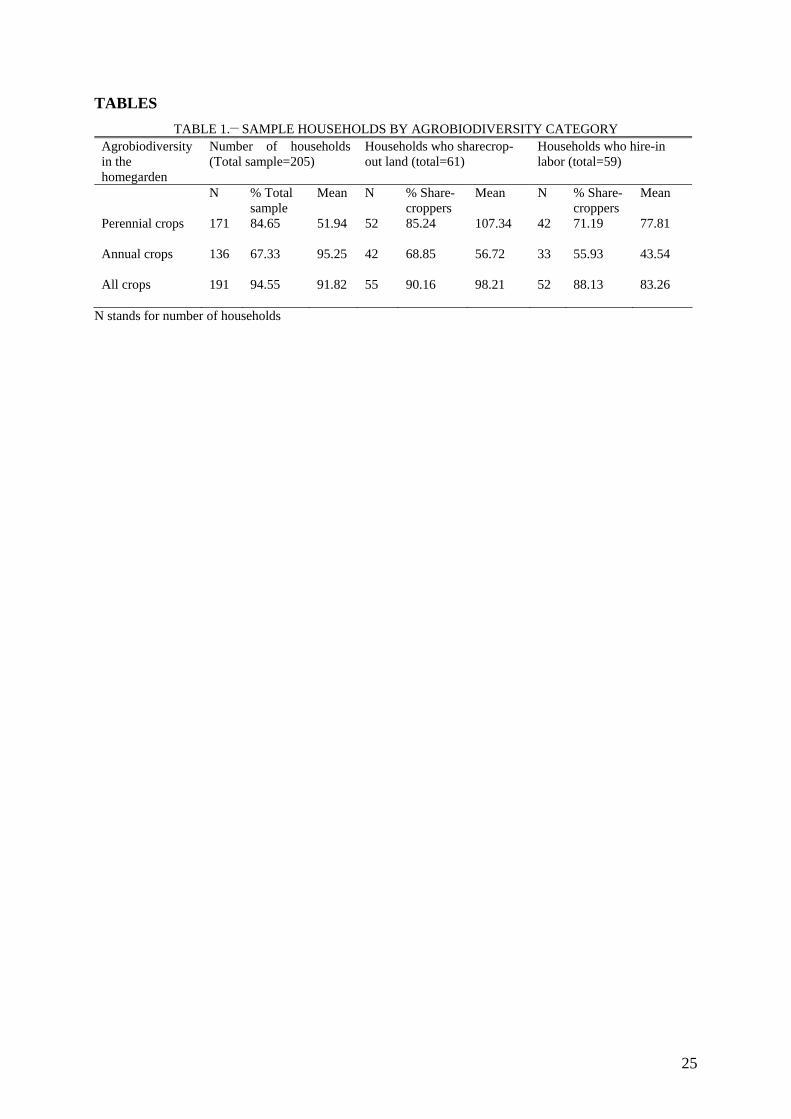
Table 1 shows the average perennial, annual and overall agrobiodiversity index among
households which are engaged in sharecropping and hiring-in labor. Among households
which sharecrop-out land, 85.2% grow perennial crops, 68.8% grow annual crops and 90.2%
grow either perennial or annual crops or both in the homegarden. About 30% of the sample
4
Page 5
households sharecrop-out land and average sharecropping-out intensity for the sample
households is 0.14 fechassa (see Tables 2 and 3). Of the households which sharecrop-out
land, 22.9% reported adult male illness (either single male (9.8%) or two-parent (13.1%)),
24.6% reported female illness (either single female (18.0%) or two-parent (6.6%)) and 6.6%
reported illness of both parents. 19.7% of the households which sharecrop-out land are single
male while 32.8% of them are single female headed. Overall, 54.1% of those who sharecrop-
out land reported illness of at least one parent and 26.2% of them reported death of at least
one parent and the remaining 19.7% reported neither illness nor death. This indicates that
80.3% of the sharecropping-practice is observed among households with adult illness, death
or both.
B. Hypothesis 2: HIV/AIDS Affected Households Which Increase Hired Labor
Intensity have Lower Agrobiodiversity in the Homegarden
As an additional or substitute option to sharecropping-in, HIV/AIDS affected farm
households can hire-in additional labor. We expect that HIV/AIDS affected households hiring
labor for field activities increase their household labor supply for gardening and off-farm
activities, but use the additional labor time for maintaining or increasing off-farm activities.
As a result, homegarden biodiversity remains the same or even decreases. If households
which have higher intensity of hire-in labor need to increase off-farm participation in order to
finance their hired labor, it increases the likelihood that agrobiodiversity in the homegarden
decreases due to the increase in hire-in labor intensity. Cash constraint is an important factor
in driving increased off-farm involvement among HIV/AIDS affected households (e.g.
Loevinsohn and Gillespie, 2003) Table 1 shows that among households who hire-in labor,
71.2% grow perennial crops, 55.9% annual crops and 88.1% grow one or the other or both in
the homegarden. Average perennial, annual and overall agrobiodiversity among households
5
Page 6
who hire-in labor is 77.8, 43.5 and 83.3 respectively and lower. About 29% of the sample
households hire-in casual labor and the average hired-in casual labor is 1.18 labor day per
fechassa per year (see Tables 2 and 3).
C. Hypothesis 3: Agricultural Education Contributes to Increasing Agrobiodiversity
The level of formal education of household members may affect agrobiodiversity either by
increasing a household member’s access to off-farm activities or preference towards
specialization. In both cases, it is likely that the effect of education on agrobiodiversity is
negative. On the other hand, it is expected that special agricultural education for adults is
target oriented and increases exchange of planting material and information among farmers
which enhances agrobiodiversity. Hence, increase in female and male participation in
agricultural education is expected to have a positive effect on agrobiodiversity. Table 2 shows
that 17% of female and 12% of male household members participated in agricultural training
during the years 2004/2005.
III. Data and Variables
The variables used in the analysis were constructed from data collected from a sample
survey conducted in two woredas namely, Gomma and Kersa of the Jimma zone in South
West Ethiopia. HIV prevalence rate in the rural parts of the zone is estimated at 8.9% as
compared to 7% in the urban areas (Belachew, Jira and Mammo, 2003). Because of higher
seasonal labor migration, the coffee growing Gomma woreda is characterized by high HIV
prevalence rate and, although official rates are unavailable, Gomma woreda is expected to
have a higher HIV/AIDS prevalence rate than the zonal average. A total of 205 farm
households were selected from Gomma and Kersa woredas of which 160 were randomly
selected from each woreda independently and 45 were included purposely because the
6
Page 7
respondents are known to be TB positive. A small sample of 28 households was taken from
Kersa woreda to capture possible location variations although the focus is on Gomma woreda.
This resulted in 86% of the sample households representing Gomma woreda. Quantitative and
qualitative data is generated for describing annual agricultural production practices, crop
diversity, labor and other resource allocations and household characteristics. Homegarden,
field, and coffee plots constitute the main plots of the households in the area. The main crops
grown in the homegarden include perennials such as enset (Ensete Ventricosum), coffee, fruit
trees (orange, mango, papaya, banana, avocado, guava, and pineapple), sugarcane, qat;
annuals such as maize, haricot beans, and roots and vegetables (taro, yam, kale, pepper, and
cabbage). Households may have several field plots which are mainly for growing cereals such
as maize, sorghum, beans and teff.
A standardized survey instrument is used to collect data representing the production period
2004/5. Pretest versions were modified to enhance the validity and reliability of responses.
Questions were peer reviewed for technical accuracy and face to face interviews were
employed in completing the questionnaire. Field visits to the area and informal discussion
with key informants helped to generate important qualitative information to complement the
survey data. Other information necessary in the course of primary data collection and analysis
was obtained from secondary sources.
The dependent variables are annual agrobiodiversity index ( )AD , perennial
agrobiodiversity index ( )PD , and total agrobiodiversity index ( )TD . Average annual and
perennial agrobiodiversity indices for the sample households are 51.9 and 95.3 respectively
(see Table 1).
The explanatory variable for empirical testing is the intensity of area sharecropped-out
(percsharearea) measured in proportion to total household land. The intensity of labor hire-in
(hireinintensity), measured as total hired labor days per unit area of land, is included to
7
Page 8
control for the effect of an alternative labor organization on agrobiodiversity. Other
continuous and dummy variables are included to control for the effect of household specific
characteristics. Continuous variables are average age of parents (averageage); formal
education level of adult male and female household members (edum, eduf); homegarden and
total land size (gardensz, totld); off-farm income (offfarminc); non-labor income of household
members (nonlabm, nonlabf); number of children 5 years old and below (nochildunder5); and
number of children 15 years old and above (nochildabove15). Dummy variables include being
single female (singlef); location (location); obtaining credit (credit); increase in livestock
holding over the past 5 years (TLUincrease); attending agricultural education by household
members over the past year (agredum, agreduf) and type of housing (houseironrf). Total land
holding and TLU variables are included because Benin, Smale and Pender (2006) found these
variables to have a significant effect on intercrop diversity of cereals in Northern Ethiopia.
IV. Method
A. The Model
The farm household is assumed to have the option of replacing own farm labor through
increasing hiring of casual labor or entering into sharecropping. In addition, it has access to
off-farm opportunities such that farm and off-farm labor market participation involves varying
transaction costs. In our analysis, individual utility is a function of individual consumption of
goods, leisure and common household goods which is aggregated into household utility.
Household utility maximization involves decisions on the allocation of each household
member’s labor and amount of external labor use. Due to lack of detailed data to estimate
utility functions and thus the structural model capturing both production and consumption
decisions, we employ a reduced form model given by:
);y),(,,(** hMjMcc zHpwDD α= , (1)
8
Page 9
where is the agrobiodiversity index, *cD TPAc ,,= for annual, perennial and overall crops
respectively; is the wage rate, w fmM ,= for male and female respectively; is the prices
for commodities ;
jp
Jj ,...,1= α is labor organization involving sharecropping which is a
function of household’s health status, H ; y is non-labor income and captures household
specific characteristics. The general equation for empirical estimation, constructed based on
(1) for annual, perennial and overall agrobiodiversity can be expressed in simple form as:
hz
iiiic ebD +++= βαbx0, ; (2)
where is the observed agrobiodiversity index for specific crop category, , and
household, i ;
icD , c
iα is an indicator for labor organization with a corresponding parameter β ; is
a vector of other (weakly) exogenous variables affecting agrobiodiversity with a
corresponding parameter vector b ; and is the error term.
ix
ie
B. Measurement and Estimation Issues
Measuring agrobiodiversity: which plots and crops?
In the study area, the household is less likely to change crop species and agrobiodiversity in
fields because of customary rules and availability of sharecropping options (Gebreselassie, et
al. 2007). In the event that the household needs to adjust crop choice and diversity,
homegardens provide more room for flexibility. We, therefore, focus on homegardens as the
relevant plots to analyze the implications of HIV/AIDS driven changes in labor organization
on crop choice and agrobiodiversity.
Two problems were encountered in applying equation (2), namely, (i) observing HIV/AIDS
and (ii) measuring agrobiodiversity. The problem of observing HIV/AIDS among the
households arises from either unawareness or reluctance to disclose one’s HIV/AIDS positive
status. The problem of measuring agrobiodiversity includes whether to focus on relative
9
Page 10
abundance or taxonomic distinctiveness, the variation of agrobiodiversity indices with the
degree of sensitivity of the measures to rare species (scale parameter), and measuring
agrobiodiversity for crops with different measures of relative abundance.
The problem of observing HIV/AIDS in the literature is addressed by using duration of
illness (e.g. Donovan et al, 2003; Stokes, 2003) and TB infection which is strongly associated
with AIDS (e.g. Corbett et al, 2003). We, therefore, opted for adult mortality and morbidity
(>30 successive days) as proxy indicators for HIV/AIDS. The question of whether to focus on
relative abundance or taxonomic distinctiveness of species is addressed by employing the
diversity index suggested by Weikard, Punt and Wesseler (2006) (WPW) which combines
both. To minimize the influence of variability of the diversity measure to the selected scale
parameter, a diversity profile is employed instead of a single parameter based index
(Tóthmérész, 1995). Accordingly, the diversity index is calculated for scale parameters
ranging from 1-15.
Based on WPW diversity index, , for a set of species, , in crop category, c , and
household, i ,and a scale parameter,
)(, SDric S
r , is given by2:
∑∈
−−=Sl
rilil
ric kdSD ))1(1()( ,,, , (3)
where is the relative abundance of species l withlk 1, =∑ ∈Sl ilk , and 1≥r is a parameter
determining the sensitivity of the measure to rare species. The weight is calculated as:
∑∈
=1
,,o
iloil dd (4)
where is the aggregate taxonomic distance defined for species l and household and is
the taxonomic distance between species, and , grown by the household, and
ild , i lod
l o 0=lld .
Following Ricotta (2004), a taxonomic distance of 1 is given if two species share the same
genus; 2 if they share only the same family; 3 if they share only the same order; 4 if they
share only the same class, and 5 if they share only the same kingdom. The taxonomic distance
10
Page 11
of the crops found in the homegarden is given in Table A1 of the annex. The index is
constructed in such a way that higher values indicate a higher degree of diversity. We
calculated relative abundance as follows:
∑∈
=
Slil
ilil L
Lk
,
,, (5)
where L measures area allocation or plant head count depending on the crop category. For
annual crops, k is constructed based on area allocation because data was available in terms of
area. For perennial crops, is constructed based on plant head counts because of the difficulty
of assigning areas to perennial plants some of which are spread out in the garden. In both
cases, average agrobiodiversity index is employed in econometric estimation. The overall
agrobiodiversity index is constructed as a weighted average of annual and perennial diversity
indices by assigning equal weights.
k
Estimation issues
We are interested in modeling the degree of agrobiodiversity for households who have
positive agrobiodiversity within a sample where agrobiodiversity is censored at zero. Possible
models include two-part models (e.g. probit and truncated) and sample selection models
(Cameron and Trivedi, 2005). Sample selection models are considered in order to correct for
potential sample selection bias towards over-sampling of participants in agrobiodiversity
practices. We considered two of the main sample selection models: namely, Simple Tobit and
the Heckman (1979) (two-step and one-step (Maximum Likelihood Estimator)).
Difference-in-Sargan and Smith and Blundell (1986) exogeneity tests are conducted to test
for the exogeneity of percsharearea and hireinintensity variables which are considered as
potential sources of endogeneity in the agrobiodiversity equations. An increase in duration of
male illness is expected to increase engagement in sharecropping-out fields. Similarly,
11
Page 12
households which do not own oxen are likely to be involved in sharecropping-out at least part
of their fields so as to access oxen. Hence, the variables capturing the proportion of male
duration of illness, percdurillm, and lack of oxen, nooxen, are used as instruments for
percsharearea variable in running the test. The variable capturing purchase of jewels during
the past years, boughtjewels, is used as an instrument for hireinintensity. This is because of
the expectation that households who are capable of paying cash for the purchase of jewels can
afford to hire-in labor if needed. Additionally, there is little reason to believe that duration of
illness, lack of oxen, or purchase of jewels directly affects agrobiodiversity in the homegarden
except through labor organization. The Sargan overidentification test shows that the extra
moment conditions created by the instruments are satisfied and the instruments can be said to
be exogenous at 10% level of significance for all the equations. Regressing the instruments
among other variables as explanators for sharecropping-out intensity, the instruments are
found to have significant coefficients with signs that support expectations (see Section V).
Accordingly, the instruments are considered as fairly valid (Murray, 2006).
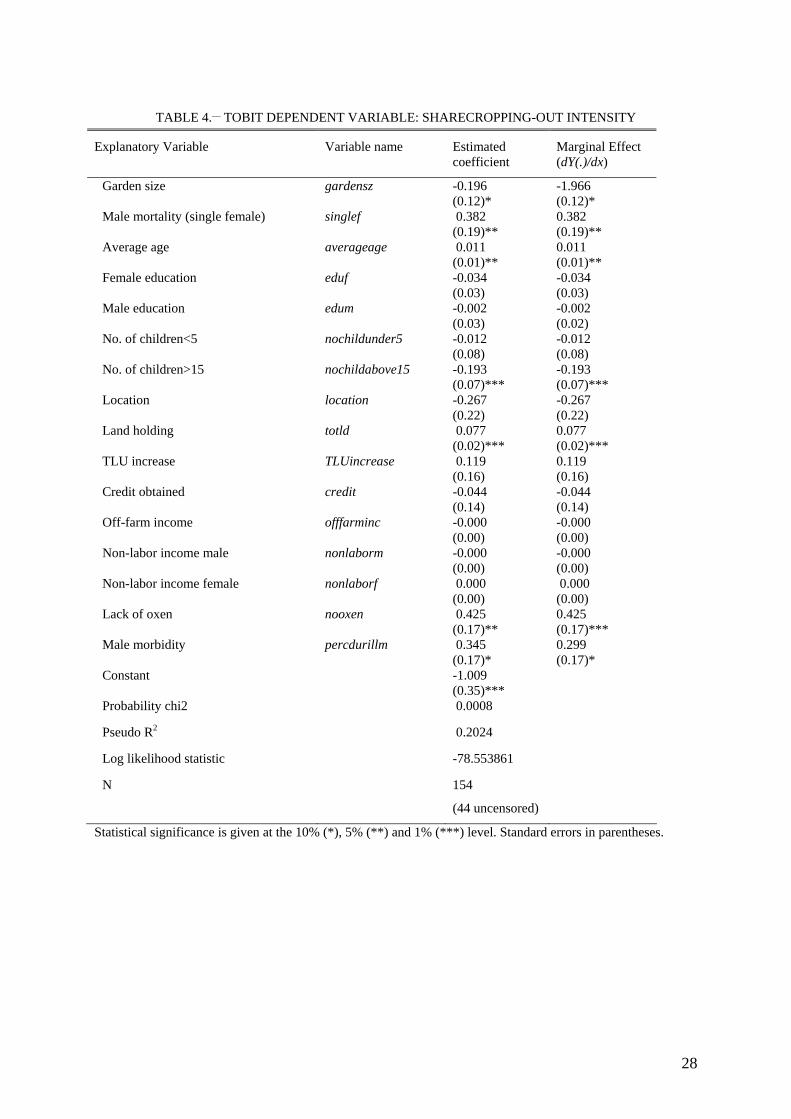
A simple Tobit estimation is conducted to see the effect of the two manifestations of
HIV/AIDS, namely adult male morbidity (percdurillm) and mortality (singlef) on the intensity
of sharecropping-out fields. As shown in Table 4, percdurillm variable positively affects
sharecropping-out intensity at 10% level of significance indicating that adult morbidity
influences sharecropping-out intensity. Similarly, singlef variable positively affects
sharecropping-out intensity at 5% level of significance indicating that single females increase
the proportion of sharecropped-out land. Nooxen variable positively affects sharecropping-out
intensity at 5% level of significance. The instruments, percdurillm and nooxen and all the
included explanatory variables have the expected signs and the signs of the instruments are
consistent with the intuitive expected signs of the instrumented variable. Based on this, the
instruments can be considered as fairly good and valid for percsharearea.
12
Page 13
Endogeneity of hireinintensity is detected by the Smith-Blundell test for the annual crop
diversity. Hence, the instrumental variable Tobit model is employed to estimate the annual
crop diversity equation by using boughtjewels variable as an instrument.
Both Difference-in-Sargan and Smith-Blundell tests could not reject the null hypothesis
that both percsharearea and hireinintensity variables are exogenous in the perennial and total
agrobiodiversity equations at 10% level of significance. This is also the case for independent
testing of the exogeneity of the variables. Exogeneity of percsharearea and hireinintensity in
the perennial and total agrobiodiversity equations allows for estimation options given by
simple Tobit, two-part probit and truncated, and Heckman (two-step and one-step). Additional
tests are conducted to decide on the more appropriate model. A likelihood ratio test of the
hypothesis of the same underlying latent variable equation explains the decision on whether
and how much agrobiodiversity in the homegarden is conducted. Test results differ for
perennial and overall agrobiodiversity equations.
Based on the Likelihood ratio test, the null hypothesis that the parameters are the same for
the selection and censored perennial crop diversity model is rejected at 5% level of
significance. Hence, a model which allows for variation in the parameters in the selection and
degree of perennial crop diversity equations is considered instead of a simple Tobit one. The
Heckman one-step post estimation test results suggest that the null hypothesis of no
correlation between disturbances across the selection and degree of diversity equations could
not be rejected at 1% level of significance. This implies that the Heckman two-step estimator
or two-part probit and truncated model can be used for estimating the perennial
agrobiodiversity equation. The difference is that the second step OLS regression for the
degree of perennial agrobiodiversity includes the fitted value of the Inverse Mills ratio term as
an additional regressor in the case of the Heckman two-step model (Cameron and Trivedi,
2005). Since the disturbances of the two equations are uncorrelated, the equation can be
13
Page 14
estimated by OLS (Verbeek, 2004). Because we found it interesting to compare the selection
equation with the other agrobiodiversity categories, we estimated the Heckman two-step
model for the perennial agrobiodiversity equation. We found that the additional term is
insignificant (p>0.784) and close to zero and as a result the Heckman two-step and the two-
part models (probit and truncated) lead to similar coefficient estimates for the degree of
perennial diversity.
The likelihood ratio test rejected the null hypothesis that the parameters are the same for the
selection and censored model for overall agrobiodiversity at the 1% level of significance. This
suggests the use of a model that allows for variation in the selection and degree of overall
agrobiodiversity. Heckman’s one-step post estimation test results indicate that the null
hypothesis of no correlation between disturbances across the selection and degree of overall
agrobiodiversity equation is rejected at 1% level of significance. This further suggests that the
disturbances affecting the two decisions are correlated and it is justifiable to simultaneously
estimate the two decisions and as a result the Heckman’s one-step model is employed in
estimation. Model probability Wald statistic of the perennial and overall agrobiodiversity
equations indicates that the included variables are important in explaining variation in
perennial and overall agrobiodiversity as compared to a model with only an intercept. This,
however, is not the case for the annual crop diversity.
V. Results and Discussion
In Table 5, estimated coefficients for the degree of agrobiodiversity are reported under Eq1
and those for the likelihood of practising the specific agrobiodiversity are reported under Eq2
for perennial and total agrobiodiversity equations. For annual crops, Eq2 reports the first stage
instrumental variable estimates.
A. Perennial Crop Diversity
14
Page 15
The percsharearea variable positively affects the degree of perennial crop diversity at the
1% level of significance. With an increase in the proportion of area sharecropped-out by a
household, the degree of perennial crop diversity in the garden increases significantly. This
confirms our main hypothesis. Hireinintensity negatively affects the likelihood of growing
perennial crops at 5% level of significance. It suggests that using hired labor does not lead to
higher agrobiodiversity in the homegarden whereas sharecropping does. Hence, the type of
labor organization affects agrobiodiversity and hired labor cannot be a substitute for
sharecropping labor with respect to agrobiodiversity. Eduf has a significant negative effect on
the degree of perennial crop diversity at 1% level of significance. On the other hand, agreduf
positively affects the degree of perennial crop diversity at 10% level of significance and
confirms our hypothesis about the effect of agricultural education.
B. Annual Crop Diversity
Only agredum variable was found to have a positive effect on the degree of annual crop
diversity at 10% level of significance indicating the importance of male participation in
agricultural education for annual agrobiodiversity. Other variables are not found significant
which may be partly explained by larger size of non-growers of annual crops (33%) as
compared to non-growers of perennial crops (15%) and that gardens are dominated by
perennial crops (see Section III).
C. Total agrobiodiversity
Table 5 shows that percsharearea positively affects the degree of total agrobiodiversity at
the 1% level of significance indicating that total agrobiodiversity increases with the increase
in the proportion of area sharecropped-out. Hireinintensity was not found significant although
it has the expected sign. The effects of eduf (negative at 5% level of significance) and agreduf
(positive at 10% level of significance) are also important for total agrobiodiversity with the
same explanation as given for perennial crop diversity. It is found that all variables that
15
Page 16
significantly affect perennial crop diversity also affect total agrobiodiversity in the same
direction. This may be because there are more producers of perennial than annual crops and
average perennial crop diversity is higher than annual in the garden.
Finally, the evidence of significant effect of increase in sharecropping-out and labor hiring
(although weaker evidence) on perennial and total agrobiodiversity indicates that labor
organization influences agrobiodiversity practices in the area. This is also consistent with the
expectation that an increase in area sharecropped-out increases labor supply for gardening and
thereby agrobiodiversity. The evidenced positive effect of agricultural education on perennial
and total agrobiodiversity shows a room for improving the quality of agrobiodiversity in the
HIV/AIDS context through increasing female access to agricultural education.
The results of the paper combined with previous studies suggest that the HIV/AIDS driven
increase in agrobiodiversity in the homegarden, through increase in sharecropping, has a
positive economic benefits through improving the nutrition and thereby the health status of
the households. This assists in offsetting some of the negative impacts of HIV/AIDS. For
effective interventions, however, the actual change in the net economic benefits of the
increase in agrobiodiversity needs to be empirically established.
VI. Conclusions
The results show that the degree of agrobiodiversity in homegardens depends on household
labor organization. This indicates that efforts aimed at enhancing crop choice or
agrobiodiversity can be effective through addressing constraints in labor organization. The
study reveals three main findings in light of testing the hypotheses.
First, we find that increase in sharecropping-out intensity leads to increase in
agrobiodiversity in homegardens which has important implications for the effect of
HIV/AIDS on agrobiodiversity. Our finding is contrary to the indicated decline in
16
Page 17
agrobiodiversity due to HIV/AIDS (e.g. Barnett and Whiteside, 2002; Gillespie and Kadiyala,
2005). We suggest that access to more convenient labor market arrangements such as
sharecropping is significant for the effect of HIV/AIDS on agrobiodiversity. Note that
households affected by adult morbidity and mortality have the potential to increase
agrobiodiversity even more than can be achieved through sharecropping as they tend to
withdraw more labor from fields to homegarden activities. This, however, occurs at the
expense of income earned from field activities. Moreover, such households, if not involved in
sharecropping-out, are more likely to increase off-farm activities to ease some of their cash
constraints which may result in less agrobiodiversity in the homegarden. Availability of
sharecropping enables better income and as a result it is less likely to observe owner
cultivation of farms among morbidity and mortality affected households. As the majority of
the sharecropping practice is associated with adult morbidity and mortality, households who
sharecrop-out less are more likely to have higher productivity in the field and as a result lower
agrobiodiversity in the homegarden.
The findings indicate a potential local capacity to mitigate the possible negative effect of
HIV/AIDS on agrobiodiversity through the sharecropping option. It also suggests that
institutional support to increasing access to sharecropping opportunities could be a relevant
intervention.
Underlying the above finding is the evidence of the significant positive effect of adult
mortality and morbidity on sharecropping-out intensity. This is in line with Bishop-Sambrook
et al (2006) and Drimie (2003) who found that single female headed households in AIDS
impacted areas resort to sharecropping. Our result substantiates their findings and adds that
sharecropping-out intensity increases among households with single females and those with
longer duration of male illness. This is also in line with Agrawal (1999) that differences in
farming efficiency between the parties involved in a sharecropping contract are an important
17
Page 18
determinant of the contract offered to the sharecropping laborer. Hence, contrary to the claim
of sharecropping as an inefficient institution (e.g. Stiglitz, 1974; Chew, 1997; Federico,
2006), our results indicate that HIV/AIDS affected farm households find sharecropping a
more viable way of cultivating their farm in comparison to alternative forms of labor
organization. Our finding is consistent with the unfavorable productivity effect of poor health
(e.g. Shultz and Tansel, 1997) and the positive efficiency effect of specialization (justifying
increasing involvement in sharecropping-out among single females). In line with this,
sharecropping-out intensity could be used as an indicator for the degree of adult morbidity
and inability to work in combination with the other common indicators for HIV/AIDS (e.g.
days of illness).
Second, labor hiring intensity has a significant negative effect on the likelihood of growing
perennial crops in homegardens indicating that hired labor and sharecropping are not
substitutable with respect to agrobiodiversity. This indicates that where labor and cash are
highly constraining due to adult morbidity and mortality, agrobiodiversity as a strategy to
improve nutrition is more compatible with sharecropping than with hiring labor..
Third, a favorable agrobiodiversity effect of agricultural education to females and males is
supported. This indicates a potential area of intervention to integrating nutrition education to
the existing agricultural education so as to make crop choice and agrobiodiversity practices
responsive to HIV/AIDS demands. The decision to adopt such a policy entails exploring the
cost effectiveness of education on nutrition versus alternative strategies of HIV/AIDS
prevention and impact mitigation e.g. distribution of multivitamin supplements, antiretroviral
therapy, raising HIV/AIDS awareness, or a combination of some of them.
18
Page 19
Acknowledgements
Funding for this research has been provided by the Netherlands Ministry of Foreign Affairs
under the PhD program of Wageningen University in partnership with Winrock International
for African Women Leaders in Agriculture and the Environment (AWLAE). We express our
gratitude to Jimma University, a local institute in the study area to which the principal author
is affiliated, for rendering all the necessary assistance in facilitating local contacts and other
related support. Many people lent their hands to the accomplishment of this work. We thank
Prof. Shelby Gerkings and participants of the EAERE conference for their useful comments
on the earlier draft version of the paper. We are grateful to the Jimma zone and woreda level
rural development offices, the Jimma zone as well as Gomma and Kersa woreda HIV/AIDS
secretariats.
19
Page 20
REFERENCES
Agrawal, Pradeep, “Contractual Structure in Agriculture,” Journal of Economic Behavior
and Organization, 39 (1999): 293-325.
Barnett, Tony and Allan Whiteside, AIDS in the 21st Century: Disease and Globalization
(New York: Palgrave Press, 2002).
Beckmann, Volker, Transaktionskosten und Institutionelle Wahl in der Landwirtschaft:
Zwischen Markt, Hierarchie und Kooperation (Berlin: Edition Sigma, 2000).
Belachew, Tefera, Chali Jira, and Yoseph Mamo, “HIV Sero-prevalence among Urban and
Rural Communities in Jimma Town and its Surrounding, Jimma Zone, Southwest
Ethiopia,” Ethiopian Journal of Health Sciences 14 (July 2004), 55-64.
Benin, Samuel, Melinda Smale, and John Pender, “Explaining the Diversity of Cereal Crops
and Varieties Grown on Household Farms in the Highlands of Northern Ethiopia,” in
Melinda Smale (ed.), Valuing Crop Biodiversity: On-farm Genetic Resources and
Economic Change (Wallington: CAB International, 2006), 78-96.
Bishop-Sambrook, Clare, Nigatu Alemayehu, Yirgalem Assegid, Gebremedhin Woldewahid,
and Berhanu Gebremedhin, “The Rural HIV/AIDS Epidemic in Ethiopia and Its
Implications for Market-Led Agricultural Development,” in Stuart Gillespie (ed.),
AIDS, Poverty and Hunger: Challenges and Responses. Highlights of the
International Conference on HIV/AIDS and Food and Nutrition Security
(Washington, D.C.: International Food Policy Research Institute, 2006), 245-260.
Cameron, A. Colin and Pravin K. Trivedi, Microeconometrics: Methods and Applications
(New York: Cambridge University Press, 2005).
Castleman, Tony, Eleonor Seumo-Fosso and Bruce Cogill, “Food and Nutrition Implications
of Antiretroviral Therapy in Resource Limited Settings. Food and Nutrition Technical
Assistance,” Technical Note No. 7 (2004), Washington DC.
20
Page 21
Chew, Tek-Ann, “Transactional Framework of Sharecropping: Empirical Evidence.”
Agricultural Economics, 18 (1998): 47-52.
Corbett, L. Elizabeth, Catherine J. Watt, Neff Walker, Dermot Maher, Brian G. Williams,
Mario C. Raviglione, Christopher Dye, “The Growing Burden of Tuberculosis: Global
Trends and Interactions with the HIV Epidemic,” Archives of Internal Medicine 163(9)
(May 2003), 1009-1021.
Donovan, Cynthia, Linda Bailey, Edson Mpyisi, and Michael Weber, “Prime-Age Adult
Morbidity and Mortality in Rural Rwanda: Which Households are Affected and What
are their Strategies for Adjustment?” Contributed Paper selected for presentation at the
25th International Conference of Agricultural Economists, Durban, South Africa, August
16-22, 2003.
Drimie, Scott, “HIV/AIDS and Land: Case Studies from Kenya, Lesotho and South Africa,”
Development Southern Africa 20 (5) (2003), 647-658.
Ellis, Frank, Peasant Economics: Farm Households and Agrarian Development
(Cambridge: Cambridge University Press, 1993).
Engels, M. M. Jan and E. Goettsch, “Konso Agriculture and its Plant Genetic Resources,” in
Engels, M. M. Jan, John G. Hawkes and Melaku Worede (Eds.), Plant Genetic
Resources of Ethiopia (Cambridge: Cambridge University Press, 1991), 169-186.
Stokes, C. Shannon, Measuring Impacts of HIV/AIDS on Rural Livelihoods and Food
Security (Rome: FAO, 2003).
FAO/WHO, Living Well with HIV/AIDS: A Manual on Nutritional Care and Support for
People Living with HIV/AIDS (Rome: FAO/WHO, 2002).
Fawzi, W. Waifaie and David J. Hunter, “Vitamins in HIV Disease Progression and Vertical
Transmission,” Epidemiology 9(4) (1998), 457-466.
21
Page 22
Fawzi, W. Waifaie, Gernard I. Msamanga, Donna Spiegelman, Ruilan Wei, Saidi Kapiga,
Edwardo Villamor, Davis Mwakagile, Ferdinand Mugusi, Ellen Hertzmark, Mark
Essex, and David J. Hunter, “A Randomized Trial of Multivitamin Supplements and
HIV Disease Progression and Mortality,” New England Journal of Medicine 351(1)
(2004), 23-32.
Federico, Giovani, “The ‘Real’ Puzzle of Sharecropping: Why Is It Disappearing?”
Continuity and Change 21(2) (2006): 261-285.
Gari, A. Joseph, Agrobiodiversity Strategies to Combat Food Insecurity and HIV/AIDS
Impact in Rural Africa: Advancing Grass Roots Responses for Nutrition, Health and
Sustainable Livelihoods (Rome: FAO Population and Development Service, 2003).
_______ Plant Diversity, Sustainable Rural Livelihoods and the HIV/AIDS Crisis,
(Bangkok: UNDP; Rome: FAO, 2004).
Gebreselassie, Kidist, Lisa L. Price, Justus Wesseler, and Ekko C. van Ierland, “Impacts of
HIV/AIDS on Labor Organization and Agrobiodiversity: Do Stages of the Disease
Matter?” Mansholt Graduate School Working Paper 32 (Wageningen University, 2007).
Gillespie, Stuart and Suneetha Kadiyala, HIV/AIDS and Food and Nutrition Security: From
Evidence to Action (Washington D.C.: IFPRI, 2005).
Haddad, Laurence and Stuart Gillespie, “Effective Food and Nutrition Policy Responses to
HIV/AIDS: What We Know and What We Need to Know,” Journal of International
Development 13 (2001), 487-511.
Heckman, J. James, “Sample selection Bias as a Specification Error,” Econometrica 47(1)
(January 1979), 153-161.
Johns, Timothy, “Plant Genetic Diversity and Malnutrition: Simple Solutions to Complex
Problems,” African Journal of Food, Agriculture, Nutrition and Development 3(1)
(2003), 45-52.
22
Page 23
Johns, Timothy and Pablo B. Eyzaguirre, “Linking Biodiversity, Diet and Health in Policy
and Practice,” Proceeding of the Nutrition Society 65 (2006), 182-189.
Loevinsohn, Michael and Stuart R. Gillespie, “HIV/AIDS, Food Security and Rural
Livelihoods: Understanding and Responding,” Food Consumption and Nutrition
Division Discussion Paper 157 (IFPRI, 2003).
Mendez, E. Victor, Regmi D. Lok, and Edwardo Somarriba, “Interdisciplinary Analysis of
Homegardens in Nicaragua: Microzonation, Plant Use and Socioeconomic Importance,”
Agroforestry Systems 51 (2001), 85-96.
Murray, P. Michael, “Avoiding Invalid Instruments and Coping with Weak Instruments,”
Journal of Economic Perspectives 20(4) (Fall 2006), 111-132.
Nair, P. K. Ramachandran, “Do Tropical Homegardens Elude Science or is It the Other Way
Around?” Agroforestry Systems 53 (2001), 239-245.
Palgrave, Keith Coates, Trees of Southern Africa. (Republic of South Africa: C. Struik
Publishers, 1984).
Ricotta, Carlo, “A Parametric Diversity Measure Combining the Relative abundances and
Taxonomic Distinctiveness of Species,” Diversity and Distributions 10(2) (March
2004), 143-146.
Schultz, T. Paul and Aysit Tansel, “Wage and Labor Effects of Illness in Cote d’Ivoire and
Ghana: Instrumental Variable Estimates for days Disabled,” Journal of Development
Economics 53(2) (August 1997), 251-286.
Smith, J. Richard and Richard W. Blundell, “An Exogeneity Test for a Simultaneous
Equation Tobit Model with an Application to Labor Supply,” Econometrica 54(3) (May
1986), 679-685.
Stiglitz, E. Joseph, “Incentives and Risk Sharing in Sharecropping,” The Review of Economic
Studies 41(2) (April 1974), 219-255.
23
Page 24
Stillwaggon, Eileen, “The Ecology of Poverty: Nutrition, Parasites and Vulnerability to
HIV/AIDS,” in Stuart Gillespie (ed.), AIDS, Poverty and Hunger: Challenges and
Responses. Highlights of the International Conference on HIV/AIDS and Food and
Nutrition Security (Washington, D.C.: International Food Policy Research Institute,
2005), 167-180.
Tóthmérész, Béla, “Comparison of Different Methods for Diversity Ordering,” Journal of
Vegetation Science 6(2) (April 1995), 283-290.
Verbeek, Marno, A Guide to Modern Econometrics. 2nd ed. (England: John Wiley and Sons
Ltd, 2004).
Weikard, Hans-Peter, Marteen Punt and Justus Wesseler, “Diversity Measurement Combining
Relative Abundances and Taxonomic Distinctiveness of Species,” Diversity and
Distributions 12(2) (March 2006), 215-217.
Weirsema, H. John and Blanca Leon, World Economic Plants: A Standard Reference (USA:
CRC Press LLC, 1999).
Wickens, E. Gerald, Economic Botany: Principles and Practices (The Netherlands: Kluwer
Academic Publishers, 2001).
Yamano, Takashi and Thomas S. Jayne, “Measuring the Impacts of Prime-age Adult Death on
Rural Households in Kenya,” Tegemo Working Paper 5 (Tegemeo Institute of
Agricultural Policy and Development, 2002).
Zomlefer, Wendy B., Guide to Flowering Plant Families. (United States: The University of
North Carolina Press, 1994).
24
Page 25
TABLES TABLE 1.__ SAMPLE HOUSEHOLDS BY AGROBIODIVERSITY CATEGORY
Agrobiodiversity in the homegarden
Number of households (Total sample=205)
Households who sharecrop-out land (total=61)
Households who hire-in labor (total=59)
N % Total sample
Mean N % Share-croppers
Mean N % Share-croppers
Mean
Perennial crops 171 84.65 51.94 52 85.24 107.34 42 71.19 77.81
Annual crops 136 67.33 95.25 42 68.85 56.72 33 55.93 43.54
All crops 191 94.55 91.82 55 90.16 98.21 52 88.13 83.26
N stands for number of households
25
Page 26
TABLE 2.__ DESCRIPTIVE FOR VARIABLES INCLUDED IN ESTIMATION Variable Variable name Unit/index n Mean Standard
deviation
I. Dependent Annual crop diversity DA Annual WPW index 136 51.94 43.14 Perennial crop diversity DP Perennial WPW index 171 95.25 56.86 Total crop diversity DT Aggregate WPW index 191 91.82 38.45
II. Explanatory Single female singlef 1=single female headed;
0=otherwise 43 0.21 0.41
Average age averageage Number of years 202 42.32 13.38 Female education eduf Years of formal schooling 71 1.35 2.28 Male education edum Years of formal schooling 77 2.09 3.18 No. of children<5 nochildunder5 No. children under 5 years 105 0.75 0.91 No. of children>15 nochildabove15 1=have; 0=otherwise 110 0.54 0.49 Percent area sharecrop-out percsharearea Area sharecropped-
out/fechassa holding 61 0.14 0.26
Hire-in labor intensity hireinintensity Labor days/fechassa 59 1.18 3.36 Off-farm income offfarminc Birr/year 84 583.01 1392.98 Non-labor income male nonlabor Birr/year 14 81.29 324.11 Non-labor income female nonlaborf Birr/year 10 25.21 137.11 Agricultural training
female over the past year agreduf 1=female had training;
0=otherwise 34 0.17 0.37
Agricultural training male over the past year
agredum 1=male had training; 0=otherwise
25 0.12 0.33
Garden size gardensz fechassa 205 0.61 0.66 Land holding totld fechassa 202 3.91 3.25 TLU increase past 5 years TLUincrease 1=increase; 0=otherwise 58 0.28 0.45 Credit obtained past year credit 1=obtained; 0=otherwise 58 0.28 0.45 Iron-roofed house houseironrf 1=have; 0=otherwise 92 0.45 0.49 Location location 1=Gomma; 0=Kersa 177 0.86 0.34
N stands for number of households. Exchange rate during the field period was Br1=USD8.6; 1 fechassa=0.25ha
26
Page 27
TABLE 3.__ SHARECROPPING-OUT AND HIRING-IN LABOR BY MARITAL STATUS, ILLNESS, OFF-FARM PARTICIPATION AND LOCATION
Sample households who sharecrop-out fields
Sample households who hire-in casual labor
Category N %
N % within group
% of total sample
% of share cropping-out
N % within group
% of total sample
% of hire-in
Marital status Single male 18 8.8 12 66.7 5.8 19.7 6 33.3 2.9 10.2 Single female 43 20.9 20 46.5 9.8 32.8 12 27.9 5.8 20.3 2-parent 141 68.8 28 19.8 13.6 45.9 40 28.4 19.5 67.8 No parent 3 1.5 1 33.3 0.5 1.6 1 33.3 0.5 1.7 Total 205 100.0 61 29.7 100.0 59 28.8 100.0
Health status of adults A. Illness (>30 days)
Single male 9 4.4 6 66.7 2.9 9.8 3 33.3 1.5 5.1 Single female 20 9.7 11 55.0 5.4 18.0 5 25.0 2.4 8.5 2-parent m 40 19.5 8 20.0 3.9 13.1 12 30.0 5.8 20.3 2-parent f 26 12.7 4 15.4 1.9 6.6 8 30.8 3.9 13.5 2-parent both 17 8.3 4 23.5 1.9 6.6 6 35.3 2.9 10.2 Total 112 54.6 33 29.5 16.0 54.1 34 30.3 16.6 57.6
B. No illness Singe male 9 4.4 6 66.7 2.9 9.8 3 33.3 1.5 5.1 Single female 23 11.2 9 39.1 4.4 14.7 7 30.4 3.4 11.9 2-parent 58 28.3 12 20.7 5.9 19.7 14 24.1 6.8 23.7 No parent 3 1.5 1 33.3 0.5 1.6 1 33.3 0.5 1.7 Total 93 45.4 28 30.1 13.7 45.9 25 26.9 12.2 42.4
Total 205 100.0 61 29.7 29.7 100.0 59 28.8 28.8 100.0 Total illness 112 54.6 33 29.5 16.0 54.1 34 30.3 16.6 57.6 Total death 35 17.1 16 45.7 7.8 26.2 11 31.4 5.4 18.6 Illness + death 147 71.7 49 33.3 23.9 80.3 45 30.6 21.9 76.3 No illness, no death
58 28.3 12 20.7 5.8 19.7 14 24.1 6.8 23.7
Off-farm participation No off-farm 121 59.0 39 32.2 19.0 63.9 33 28.2 16.1 55.9 Off-farm 84 41.0 22 26.2 10.6 36.1 26 29.5 12.7 44.1 Total 205 100.0 61 29.6 100.0 59 28.8 100
Location Gomma 177 86.3 52 29.4 25.3 85.2 56 31.6 27.3 94.9 Kersa 28 13.7 9 32.1 4.3 14.8 3 10.7 1.5 5.1 Total 205 100.0 61 29.6 100.0 59 28.8 100.0
N stands for number of households.
27
Page 28
Explanatory Variable Variable name Estimated coefficient
Marginal Effect (dY(.)/dx)
Garden size gardensz -0.196 (0.12)*
-1.966 (0.12)*
Male mortality (single female) singlef 0.382 (0.19)**
0.382 (0.19)**
Average age averageage 0.011 (0.01)**
0.011 (0.01)**
Female education eduf -0.034 (0.03)
-0.034 (0.03)
Male education edum -0.002 (0.03)
-0.002 (0.02)
No. of children<5 nochildunder5 -0.012 (0.08)
-0.012 (0.08)
No. of children>15 nochildabove15 -0.193 (0.07)***
-0.193 (0.07)***
Location location -0.267 (0.22)
-0.267 (0.22)
Land holding totld 0.077 (0.02)***
0.077 (0.02)***
TLU increase TLUincrease 0.119 (0.16)
0.119 (0.16)
Credit obtained credit -0.044 (0.14)
-0.044 (0.14)
Off-farm income offfarminc -0.000 (0.00)
-0.000 (0.00)
Non-labor income male nonlaborm -0.000 (0.00)
-0.000 (0.00)
Non-labor income female nonlaborf 0.000 (0.00)
0.000 (0.00)
Lack of oxen nooxen 0.425 (0.17)**
0.425 (0.17)***
Male morbidity percdurillm 0.345 (0.17)*
0.299 (0.17)*
Constant -1.009 (0.35)***
Probability chi2 0.0008
Pseudo R2 0.2024
Log likelihood statistic -78.553861
N 154
(44 uncensored)
Statistical significance is given at the 10% (*), 5% (**) and 1% (***) level. Standard errors in parentheses.
TABLE 4.__ TOBIT DEPENDENT VARIABLE: SHARECROPPING-OUT INTENSITY
28
Page 29
TABLE 5.__ ESTIMATED COEFFICIENTS AND TEST RESULTS BY AGROBIODIVERSITY EQUATION Agrobiodiversity for perennials (DP) Agrobiodiversity for annuals (DA)
Total agrobiodiversity (DT)
Heckman (two-step); N=202; censored=31
IVTobit (N = 202; censored = 66)
Heckman (one-step); N=202; censored=11
Eq1: degree
Eq2: participation
Eq1: degree
Eq2: stage 1
Eq1: degree
Eq2: participation
Parameter dY(.)/dx Parameter Parameter
dY(.)/dx
Parameter dY(.)/dx Parameter gardensz -0.019
(0.06) -0.021 (0.06)
-0.120 (0.22)
0.040 (0.09)
-0.217 (0.42)
0.040 (0.09)
-0.005 (0.04)
-0.005 (0.04)
0.641 (0.58)
singlef 0.045 (0.08)
0.046 (0.08)
0.069 (0.36)
0.044 (0.13)
0.018 (0.60)
0.044 (0.13)
0.041 (0.06)
0.041 (0.06)
6.762 (-)
averageage 0.003 (0.00)
0.002 (0.00)
-0.015 (0.01)
0.004 (0.00)
-0.002 (0.02)
0.004 (0.00)
-0.002 (0.00)
-0.002 (0.00)
-0.011 (0.02)
eduf -0.043 (0.01)***
-0.044 (0.01)***
-0.037 (0.06)
-0.019 (0.02)
0.027 (0.11)
-0.019 (0.02)
-0.026 (0.01)**
-0.026 (0.01)**
0.196 (0.15)
edum 0.001 (0.01)
-0.000 (0.01)
-0.066 (0.04)
-0.015 (0.02)
0.088 (0.08)
-0.015 (0.02)
-0.003 (0.01)
-0.003 (0.01)
-0.195 (0.07)***
nochildunder5 0.076 (0.04)**
0.081 (0.04)**
0.359 (0.19)*
-0.017 (0.06)
-0.006 (0.25)
-0.017 (0.06)
0.052 (0.02)**
0.052 (0.02)**
0.231 (0.31)
nochildabove15 -0.011 (0.03)
-0.011 (0.03)
-0.018 (0.10)
-0.028 (0.04)
0.030 (0.19)
-0.028 (0.04)
-0.006 (0.02)
-0.006 (0.02)
0.204 (0.17)
location -0.052 (0.11)
-0.056 (0.11)
-0.409 (0.66)
-0.049 (0.18)
-0.296 (0.82)
-0.049 (0.18)
0.044 (0.08)
0.044 (0.08)
1.802 (0.84)**
totld 0.020 (0.01)
0.019 (0.01)
-0.036 (0.05)
-0.009 (0.02)
-0.118 (0.09)
-0.009 (0.02)
0.009 (0.01)
0.009 (0.01)
-0.019 (0.06)
TLUincrease 0.119 (0.07)*
0.125 (0.07)*
0.622 (0.33)*
-0.036 (0.11)
-0.049 (0.49)
-0.036 (0.11)
0.095 (0.05)**
0.095 (0.05)**
-0.024 (0.40)
percsharearea 0.381 (0.13)***
0.385 (0.13)***
0.361 (0.59)
0.247 (0.22)
-0.437 (0.95)
0.247 (0.22)
0.289 (0.09)***
0.289 (0.09)***
-0.005 (0.75)
hireinintensity 0.009 (0.01)
0.008 (0.01)
-0.071 (0.03)**
0.085 (0.07)
0.085(0.07)
-0.007 (0.01)
-0.007 (0.01)
-0.053 (0.04)
credit 0.108 (0.07)
0.113 (0.07)
0.509 (0.35)
0.109 (0.12)
-0.474 (0.51)
0.109 (0.12)
0.049 (0.05)
0.049 (0.05)
7.677 (-)
offfarminc 0.000 0.000 -0.000 -0.000 0.000 -0.000 -0.000 -0.000 0.000
29
Page 30
(0.00)
(0.00) (0.00) (0.00) (0.00) (0.00) (0.00)* (0.00)* (0.00)nonlaborm 0.000
(0.00)** 0.000 (0.00)**
-0.001 (0.00)
0.000 (0.00)
0.001 (0.00)*
0.000 (0.00)
0.000 (0.00)*
0.000 (0.00)*
-0.000 (0.00)
nonlaborf -0.000 (0.00)
0.001 (0.00)*
0.058 (-)
0.000 (0.00)
-0.001 (0.00)
0.000 (0.00)
0.000 (0.00)
0.000 (0.00)
0.033 (-)
agreduf 0.184 (0.09)*
0.183 (0.09)*
-0.003 (0.44)
0.204 (0.19)
-1.026 (0.74)
0.204 (0.19)
0.126 (0.07)*
0.126 (0.07)*
-0.163 (0.66)
agredum 0.073 (0.11)
0.068 (0.11)
-0.259 (0.49)
0.338 (0.19)*
-0.303 (0.84)
0.338 (0.19)*
0.056 (0.08)
0.056 (0.08)
-0.116 (0.67)
houseironrf -0.094 (0.07)
-0.094 (0.07)
-0.075 (0.29)
0.019 (0.16)
1.650 (0.49)***
0.019 (0.16)
-0.015 (0.05)
-0.015 (0.05)
-0.960 (0.46)
boughtjewels NA NA NA NA 3.332(1.13)***
0 NA NA NA
Constant 0.852 (0.15)***
2.187 (0.79)***
0.142 (0.28)
1.201 (1.14)
0.859(0.11)***
0.277(0.74)
Pseudo R2 NA NA NA
Log likelihood ratio statistic NA -686.77177 -43.93395
Probability ch2 (Wald) 0.0000 0.6870 0.0004
Statistical significance is given at the 10% (*), 5% (**) and 1% (***) level. Standard errors in parenthesis. The variables singlef, credit and nonlaborf are dropped from
participation equations of perennial and total agrobiodiversity because of perfect predictions, for e.g., all single females grow perennial crops. Standard errors for the
variables which are not estimated by the specific technique are presented as (-). Coefficients (0.000) and standard errors (0.00) for some variables are given beyond 4 decimal
places. dY(.)/dx stands for marginal effects and is calculated for the degree equations in the case of perennial and total agrobiodiversity. NA means not applicable for the
specific model.
30
Page 31
ANNEX
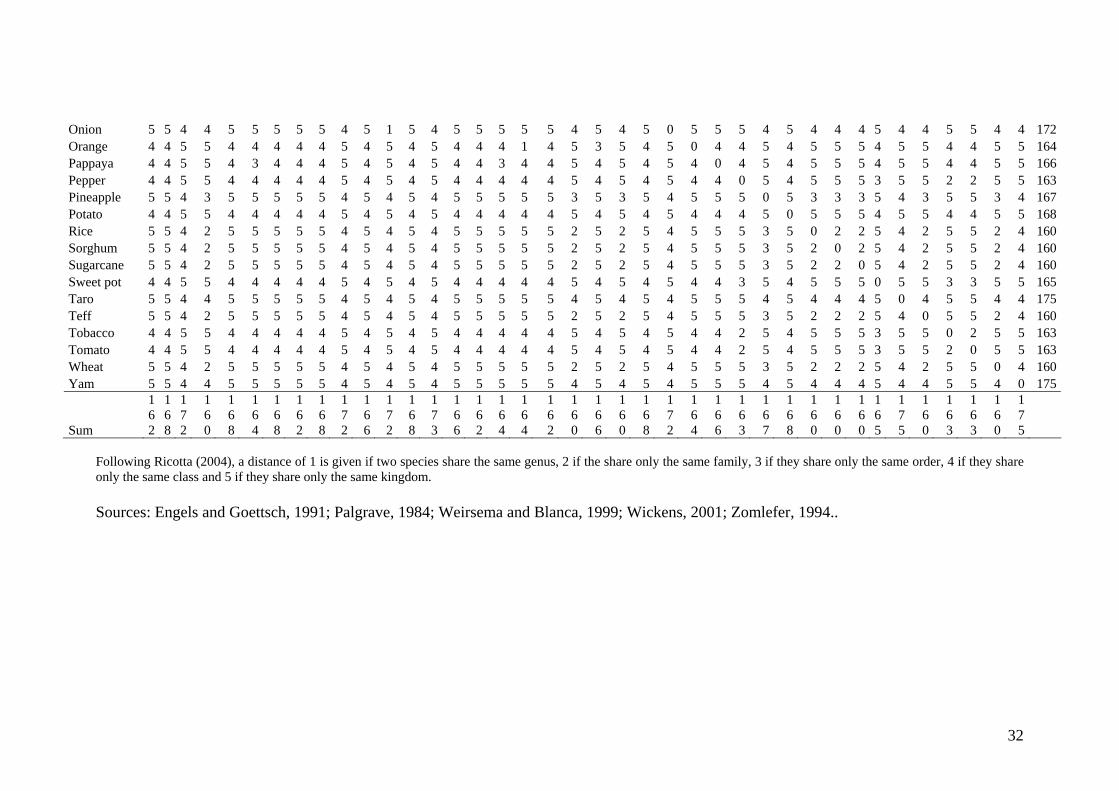
TABLE A1.__ TAXONOMIC DISTANCES BETWEEN THE SPECIES GROWN IN THE GARDEN
Ade
ngua
reA
voca
doB
anan
na
Bar
ley
Bul
lhea
r t
Cab
bage
Cha
t
Chi
ckpe
a
Cof
fee
Ense
t
Euca
lypt
us
Gar
lic
Ges
ho
Gin
ger
Gua
va
Har
i bea
n
Kal
e
Lem
on
Lent
il
Mai
ze
Man
go
Mill
e t
Nig
er se
ed
Oni
on
Ora
nge
Papp
aya
Pepp
er
Pine
appl
e
Pota
to
Ric
e
Sorg
hum
Suga
rcan
eSw
eet p
ot
Taro
Tef f
Toba
cco
Tom
ato
Whe
a t
Yam Sum
Adenguare /cowpea 0 4 5 5 4 5 4 5 2 4 4 2 5 4 5 4 4 5 4 5 5 4 5 5 4 4 4 4 4 2 4 5 4 5 4 4 5 5 5 162Avocado
a 0 5 5 4 5 4 5 4 4 4 4 4 5 4 5 4 4 4 5 4 5 5 5 4 5 5 4 4 5 0 4 2 5 4 5 3 5 5 5 5 5 4 5 4 5 5 5 4 5 4 4 4 5 4 4 5 5
5 4 0 4 5 4 5 4 5 5 5 5 5 2 5 4 5 5 5 3 5 2 2 2 5 4 2 5 5 4 5 5 5 4 5 4 5 4 4 4 4 4 5 4 5 4 4 4 5 4 5 5 5 4 5 5 4 4 4 5 5 5 4 5 4 5 4 4 1 4 4 5 4 5 4 3 4 5 4 5 5 5 4 5 5 4 4
4 5 5 5 4 5 4 5 4 4 4 4 4 5 4 5 4 4 4 5 4 5 5 5 4 5 5 4 4 4 5 5 5 4 5 4 5 4 2 4 4 2 5 4 5 4 4 4 5 4 5 5 5 4 5 5 4 4
4 5 5 5 4 5 4 5 4 4 4 4 4 5 4 5 4 4 4 5 4 5 5 5 4 5 5 4 4 5 2 4 0 5 4 5 3 5 5 5 5 5 4 5 4 5 5 5 4 5 4 4 4 5 4 4 5 5
4 5 5 5 0 5 4 5 2 4 4 4 4 5 4 5 4 4 4 5 4 5 5 5 4 5 5 4 4 5 4 4 4 5 0 5 4 5 5 5 5 5 4 5 1 5 5 5 4 5 4 4 4 5 4 4 5 5
4 5 5 5 4 5 0 5 4 4 4 4 4 5 4 5 4 4 4 5 4 5 5 5 4 5 5 4 4 r 5 3 4 3 5 4 5 0 5 5 5 5 5 4 5 4 5 5 5 4 5 4 4 4 5 4 4 5 5 4 5 5 5 2 5 4 5 0 4 4 4 4 5 4 5 4 4 4 5 4 5 5 5 4 5 5 4 4
4 5 5 5 4 5 4 5 4 0 4 4 2 5 4 5 4 4 4 5 4 5 5 5 4 5 5 4 4 4 5 5 5 4 5 4 5 4 4 0 4 4 5 4 5 4 3 4 5 4 5 5 5 4 5 5 4 4
4 5 5 5 4 5 4 5 4 4 4 0 4 5 3 5 1 4 4 5 4 5 5 5 4 5 5 4 4 5 4 4 4 5 4 5 5 5 4 5 5 4 4
5 4 2 4 5 4 5 4 5 5 5 5 5 0 5 4 5 5 5 3 5 2 2 2 5 4 2 5 5 4 5 5 5 4 5 4 5 4 4 4 3 4 5 0 5 3 4 4 5 4 5 5 5 4 5 5 4 4
4 5 5 5 3 5 2 2 2 5 4 2 5 5 4 5 5 5 4 5 4 5 4 4 4 4 4 5 4 5 4 4 4 5 4 5 5 5 4 5 5 4 4
4 4 4 4 4 4 5 5 4 5 5 168Banann
y 5 5 5 5 5 5 4 5 4 4 172
Barle 5 5 5 5 5 5 2 5 2 4 160Bullheart
e4 0 4 4 4 4 5 4 5 5 168
Cabbagt
4 4 0 4 4 4 5 4 5 5 164Cha 4 4 4 0 4 4 5 4 5 5 168Chickpea
e 2 4 4 4 0 4 5 4 5 5 162
Coffet
4 4 4 4 4 0 5 4 5 5 168Ense 5 5 5 5 5 5 4 5 4 4 172Eucalyptus
c 4 4 4 4 4 4 5 4 5 5 166
Garli 5 5 5 5 5 5 4 5 4 4 172Gesho 4 4 4 4 4 4 5 4 5 5 168Ginge
a5 5 5 5 5 5 4 5 4 4 173
Guav 4 4 4 4 4 4 5 4 5 5 166Hari. bean
e 2 4 4 4 2 4 5 4 5 5 162
Kal 4 4 1 4 4 4 5 4 5 5 164Lemon
4 4 4 4 4 4 5 4 5 5 164
Lentil 2 4 5 5 4 4 4 2 4 5 4 5 4 5 4 2 4 4 0 5 4 5 4 5 5 162Maize 5 5 5 5 5 5 2 5 2 4 160Mango
4 4 4 4 4 4 5 4 5 5 166
Millet 5 5 4 2 5 5 5 5 5 4 5 4 5 4 5 5 5 5 5 2 5 0 5 2 4 160Niger seed 4 4 4 4 4 4 5 0 5 5 168
31
Page 32
Onion 5 4 4 4 5 1 5 4 5 5 5 5 5 4 5 0 5 5 5 4 5 4 4 4 5 4 4 5 5 4 5 5 5 4 5 4 5 4 4 4 1 4 5 3 5 0 4 4 5 4 5 5 5 4 5 5 4 4 4 5 5 5 4 5 4 5 4 4 3 4 4 5 4 5 4 0 4 5 4 5 5 5 4 5 5 4 4
4 5 5 5 4 5 4 5 4 4 4 4 4 5 4 5 4 4 0 5 4 5 5 5 3 5 5 2 2 5 4 3 4 5 4 5 4 5 5 5 5 5 3 5 4 5 5 5 0 5 3 3 3 5 4 3 5 5
4 5 5 5 4 5 4 5 4 4 4 4 4 5 4 5 4 4 4 5 0 5 5 5 4 5 5 4 4 5 4 2 4 5 4 5 4 5 5 5 5 5 2 5 4 5 5 5 3 5 0 2 2 5 4 2 5 5
5 4 2 4 5 4 5 4 5 5 5 5 5 2 5 4 5 5 5 3 5 2 0 2 5 4 2 5 5 5 4 2 4 5 4 5 4 5 5 5 5 5 2 5 4 5 5 5 3 5 2 2 0 5 4 2 5 5
t 4 5 5 5 4 5 4 5 4 4 4 4 4 5 4 5 4 4 3 5 4 5 5 5 0 5 5 3 3 5 4 4 4 5 4 5 4 5 5 5 5 5 4 5 4 5 5 5 4 5 4 4 4 5 0 4 5 5
5 4 2 4 5 4 5 4 5 5 5 5 5 2 5 4 5 5 5 3 5 2 2 2 5 4 0 5 5 5 4 4 2 5 4 5 5 5 3 5 5 0 2
4 5 5 5 4 5 4 5 4 4 4 4 4 5 4 5 4 4 2 5 4 5 5 5 3 5 5 2 0 5 4 2 4 5 4 5 4 5 5 5 5 5 2 5 4 5 5 5 3 5 2 2 2 5 4 2 5 5 5 4 4 4 5 4 5 4 5 5 5 5 5 4 5 4 5 5 5 4 5 4 4 4 5 4 4 5 5
5 5 5 5 5 5 4 5 4 4 172Orange 4 4 4 4 4 4 5 4 5 5 164Pappaya
r 4 4 3 4 4 4 5 4 5 5 166
Peppe 4 4 4 4 4 4 5 4 5 5 163Pineapple
o 5 5 5 5 5 5 3 5 3 4 167
Potate
4 4 4 4 4 4 5 4 5 5 168Ric 5 5 5 5 5 5 2 5 2 4 160Sorghum 5 5 5 5 5 5 2 5 2 4 160Sugarcane 5 5 5 5 5 5 2 5 2 4 160Sweet po
o 4 4 4 4 4 4 5 4 5 5 165
Tarf
5 5 5 5 5 5 4 5 4 4 175Tef 5 5 5 5 5 5 2 5 2 4 160Tobacco
o4 4 5 5 4 4 4 4 4 5 4 5 4 5 4 4 4 4 4 5 4 5 4 5 5 163
Tomatt
4 4 4 4 4 4 5 4 5 5 163Whea
5 5 5 5 5 5 2 5 0 4 160
Yam 5 5 5 5 5 5 4 5 4 0 175
Sum
162
168
172
160
1 6 8
1 6 4
168
162
168
172
166
172
168
173
166
162
164
164
162
160
166
1 6 0
1 6 8
172
164
166
163
167
168
160
160
160
165
175
160
163
163
1 6 0
1 7 5
Following Ricotta (2004), a distance of 1 is given if two species share the same genus, 2 if the share only the same family, 3 if they share only the same order, 4 if they share only the same class and 5 if they share only the same kingdom. Sources: Engels and Goettsch, 1991; Palgrave, 1984; Weirsema and Blanca, 1999; Wickens, 2001; Zomlefer, 1994..
32