The Effect of Urban Form on Traffic Accident Incidence DIANE JONES and MANOJ K. JHA 1 [email protected]; 2 [email protected]Department of Civil Engineering Morgan State University Baltimore, Maryland 21251, USA Abstract: - In this paper we determine the relationship between developmental patterns and the incidence of traffic accidents. We evaluate the accident data for four intersections, which inhabit two different developmental typologies of the urban environment. Key-Words: - urban core, sprawl development, arterial thorough fares, crash incidence, neighborhood scale. 1. Introduction This study evaluates whether certain developmental patterns, such as dense urban or transit oriented development versus sprawl or suburban development, has an impact on the incidence of traffic accidents. Sprawl is defined here as low density residential development with a rigid separation of homes, shops and workplaces, limited access, and large block sizes [1]. Suburban land use is typified by “bed room” communities outside the urban core with office and retail development located along arterial thoroughfares. This research defines urban development as high density land-use and pedestrian scaled environments. The density is high enough to support transit, and the human scale provides convenient walking distance. Environments in the urban core are often typified by a grid of interconnected streets and small blocks which provided access to transit, disperse traffic, and allow intimate thoroughfares. 1.1 Background and Previous Research Previous studies have looked at the built environment and traffic safety using various methods to establish a relationship between community design and traffic safety. Research by Eric Dumbaugh and Robert Ray (Safe Urban Form, 2009) [2] analyzed GIS data on crash incidence and urban form, for the City of San Antonio, Texas, using negative binomial models. They found urban arterials, arterial-oriented commercial developments to be associated with increased incidence of traffic related deaths. They also found that higher density communities with more traditional pedestrian scaled retail configurations to be associated with fewer crashes. The design configuration of retail uses appears to extremely important in crash incidence. Early planning to address traffic safety stressed the functional classification of roadways, the development of disconnected residential area and the location of retail along arterial roads. Early planners assumed that by widening and straightening new roads the driver’s ability to see any on- coming hazard and have time to decelerate would be enhanced. Therefore, new roads were designed to enhance site distance. These ideas were translated into form by Clarence Perry and Clarence Stein in the 1930’s [2]. The separation of traffic functions was reinforced by land use. Residential and civic uses, such as schools and RECENT ADVANCES in COMPUTER ENGINEERING and APPLICATIONS ISSN: 1790-5117 212 ISBN: 978-960-474-151-9
Transcript
The Effect of Urban Form on Traffic Accident Incidence
Morgan State University Baltimore, Maryland 21251, USA
Abstract: - In this paper we determine the relationship between developmental patterns and the incidence of traffic accidents. We evaluate the accident data for four intersections, which inhabit two different developmental typologies of the urban environment. Key-Words: - urban core, sprawl development, arterial thorough fares, crash incidence, neighborhood scale. 1. Introduction This study evaluates whether certain developmental patterns, such as dense urban or transit oriented development versus sprawl or suburban development, has an impact on the incidence of traffic accidents. Sprawl is defined here as low density residential development with a rigid separation of homes, shops and workplaces, limited access, and large block sizes [1]. Suburban land use is typified by “bed room” communities outside the urban core with office and retail development located along arterial thoroughfares. This research defines urban development as high density land-use and pedestrian scaled environments. The density is high enough to support transit, and the human scale provides convenient walking distance. Environments in the urban core are often typified by a grid of interconnected streets and small blocks which provided access to transit, disperse traffic, and allow intimate thoroughfares.
1.1 Background and Previous Research
Previous studies have looked at the built environment and traffic safety using various methods to establish a relationship between
community design and traffic safety. Research by Eric Dumbaugh and Robert Ray (Safe Urban Form, 2009) [2] analyzed GIS data on crash incidence and urban form, for the City of San Antonio, Texas, using negative binomial models. They found urban arterials, arterial-oriented commercial developments to be associated with increased incidence of traffic related deaths. They also found that higher density communities with more traditional pedestrian scaled retail configurations to be associated with fewer crashes. The design configuration of retail uses appears to extremely important in crash incidence.
Early planning to address traffic safety stressed the functional classification of roadways, the development of disconnected residential area and the location of retail along arterial roads. Early planners assumed that by widening and straightening new roads the driver’s ability to see any on- coming hazard and have time to decelerate would be enhanced. Therefore, new roads were designed to enhance site distance. These ideas were translated into form by Clarence Perry and Clarence Stein in the 1930’s [2]. The separation of traffic functions was reinforced by land use. Residential and civic uses, such as schools and
RECENT ADVANCES in COMPUTER ENGINEERING and APPLICATIONS
ISSN: 1790-5117 212 ISBN: 978-960-474-151-9
churches were included in the neighborhood unit, but uses such as retail and commercial were excluded and located on arterial roadways surrounding the neighborhood. Planners conceived that the relocation of those activities to arterial locations would remove cut through traffic from neighborhoods, while still allowing residents to access retail on trips to and from work. This conventional development, which built roads for one use type, was based on three safety premises. One, safety could be increased by the use of arterial roads designed to be wide and straight to increase sight distance. Secondly, street networks should be reconfigured to prevent vehicle traffic from entering residential areas and reduce the number of conflicts between opposing traffic flows. Four way intersections would be replaced with cul-de-sacs and three-way intersections, to limit the access to surrounding arterials. The optimal configuration would have only one link to the external street network.
Following implementation of these configurations, study was done to show if limited access neighborhoods were safer than those designed with a grid pattern. Gridded street networks typically carry heavier loads than disconnected subdivisions. Traffic volumes are likely to be one reason for differences in crash data. While limited access networks and configurations may reduce traffic volumes within residential areas, localized reductions may be offset by the crash frequency and severity on adjacent arterial roads. Several other studies have associated density with significantly fewer crashes. The study by Eric Dumbaugh and Robert Rae hypothesized that the arterial road ways often carry large share of traffic generated by a neighborhood and are therefore likely to experience a proportional amount of its crashes. Several variables were used in the study. These included block group acreage, age of drivers, freeways and arterial
miles, number of arterial commercial uses, vehicle miles traveled, and net population density. Net population density was measured as the total population of the block group, divided by the total acreage of residential parcels located in the block group. The results showed that areas with increased vehicle miles traveled (VMT) experience more crashes, with crash incidence increasing by roughly 0.75% with every million miles of travel. Arterial thoroughfares were associated with a 15% increase in total crashes with each additional mile of arterial. Each additional arterial oriented retail or commercial parcel increased total crashes by 1.3%, and each additional big box store increased crashes by 6.6 %. A 2.2% reduction in accident incidence was yielded by pedestrian scaled commercial uses [2]. Population density was also associated with fewer crashes. Each additional person per net residential acre decreased accident incidence by 0.05%. The study also revealed that with each additional centerline mile of arterial roadway, crashes with injury was increased roughly 17%. Intersection, 4 legged ones in particular, were also associated with crashes resulting in injury.
In relationship to land use, each additional arterial-oriented retail or commercial parcel was found to increase crashes with injury, and each big box store was found to increase injurious crashes by an additional 4%. In comparison, each additional pedestrian- scaled commercial and retail use corresponded to a 3.4% reduction in crashes with injury. Arterial roadways were also associated with significant increases in fatal crashes, with each additional arterial mile resulting in a 20% increase in crash fatalities [2].
A study by Reid Ewing of the University of Maryland 2009[3] also concluded that dense urban areas appear to be safer than the lower volume environments of the suburbs. The reason was attributed to the fact that fewer miles are driven, in the urban core, on a per capita
RECENT ADVANCES in COMPUTER ENGINEERING and APPLICATIONS
ISSN: 1790-5117 213 ISBN: 978-960-474-151-9
basis, and that it is performed at lower speeds. The study also stressed that density in urban areas, and less forgiving design treatments such as narrow streets, street trees, and traffic calming measures appear to enhance a roadway’s safety performance.
The built environment also affects traffic frequency and severity through the traffic volume it generates and the traffic speed it allows. Traffic volumes determine traffic frequency, and traffic speed has a direct correlation to traffic severity [3]. Higher speeds give drivers less time to react and result in increased severity of impact. Lower speeds result in less or lesser impacts. In relation to the built environment “Town Center” or urban core designs have the lowest rates of vehicle crashes, while metropolitan areas with wide travel lanes and higher operating speeds experience higher crash rates. Traffic speed is not the only reason for urban traffic accidents. The presence of driveways and side streets along arterials create conflicts between through moving vehicles and those making a turn into or out of adjacent driveways.
Vehicle miles traveled also is related to accident frequency. Development with lower VMT is like to have lower crash rates. This is directly related to density, diversity, design, and destination [3]. These principle elements are prevalent in transit oriented and walk-able developments. Density is measured by persons, jobs, or households per unit acre. Diversity refers to land-use mix. Design involves the street typology of a community. Typology can vary from grids of interconnected streets to loops or curving street networks. Design includes sidewalk coverage, building setbacks, pedestrian crossings, presence of street trees and site amenities. Destination relates to the accessibility to jobs, housing, and other attractions in the area. Destination, density, design and diversity have a direct relationship to
travel mode and trip length. Trip lengths are shorter at locations that have higher densities, a diversity of uses, and are design for varying modes of travel including walking, biking and transit. When these modes claim a larger portion of trips in higher density mixed use environments, vehicle miles traveled decrease [1].
A study by Ewing in 2002 showed that the relationship between VMT and fatalities was near linear. It would therefore be logical to purpose that sprawling environments would generate higher VMT and also report higher rates of traffic accidents and fatalities. The study, based on regression equation for annual traffic for one hundred thousand residents, developed a sprawl index and revealed that the higher the density, the finer the mix, the more centered the development pattern, the fewer highway fatalities occurred on a per capita basis. Analyzing the locations and rates of traffic fatalities determined that the more concentrated the area, the higher the traffic fatality rates of all modes of travel, and the higher the rate of pedestrian fatalities. Design plays a factor in this in that the traditional urban grid has a short block, straight and crossed street pattern. The suburban street network typically has large blocks with curving streets and a branching pattern. These networks differ in terms of block size, degree of curvature, and amount of connectivity. The Ewing study also determined that gridded networks usually had the highest crashes at four way intersections. It has also been found that built environments with more lane miles of arterials had higher crash rates related to those with more local streets [3]. Most interestingly it was found that higher intersection densities were associated with fewer total crashes injuries and fatal accidents. This was attributed to lower speeds.
Standard roadway design has employed the theory that straight, wide, open and flat is better
RECENT ADVANCES in COMPUTER ENGINEERING and APPLICATIONS
ISSN: 1790-5117 214 ISBN: 978-960-474-151-9
for traffic safety. Recent research has proven that a variety of factors influence highway safety and that land use context and vehicle-operating conditions are different in urban and suburban designed areas. Urban planners are now are campaigning for increased density, diversity, destination, and design in urban environments, in the hopes of instituting narrower, shorter, more enclosed, and interconnected streets leading to safer travel.
2. Methodology
As research already undertaken by others has shown, there are higher crash rates along arterial thorough fares and in suburban areas. This study looked at the relationship between certain components of urban form and traffic accident incidence.
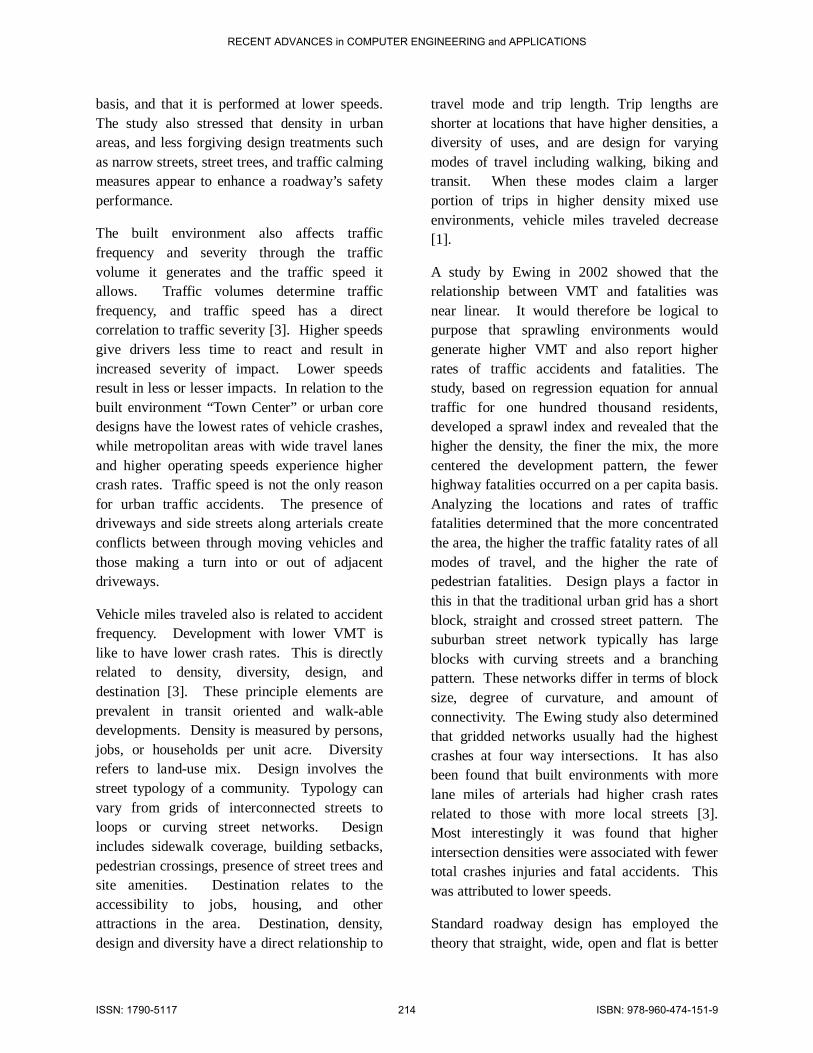
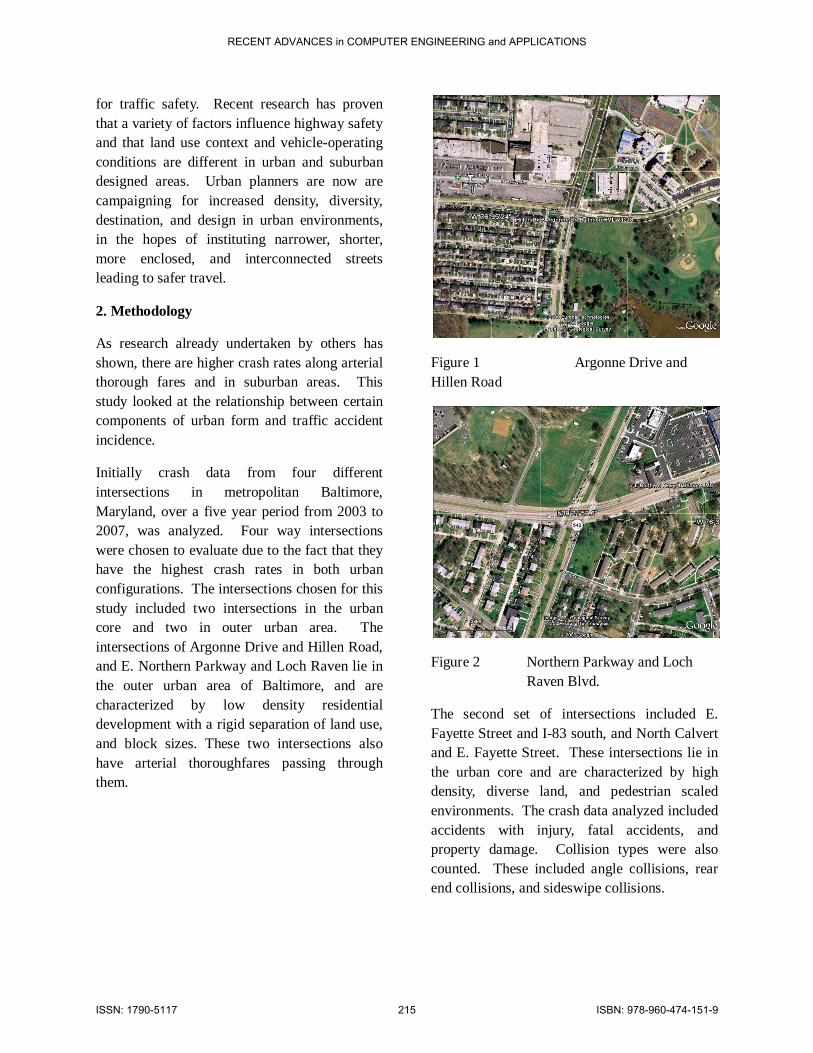
Initially crash data from four different intersections in metropolitan Baltimore, Maryland, over a five year period from 2003 to 2007, was analyzed. Four way intersections were chosen to evaluate due to the fact that they have the highest crash rates in both urban configurations. The intersections chosen for this study included two intersections in the urban core and two in outer urban area. The intersections of Argonne Drive and Hillen Road, and E. Northern Parkway and Loch Raven lie in the outer urban area of Baltimore, and are characterized by low density residential development with a rigid separation of land use, and block sizes. These two intersections also have arterial thoroughfares passing through them.
Figure 1 Argonne Drive and Hillen Road
Figure 2 Northern Parkway and Loch Raven Blvd.
The second set of intersections included E. Fayette Street and I-83 south, and North Calvert and E. Fayette Street. These intersections lie in the urban core and are characterized by high density, diverse land, and pedestrian scaled environments. The crash data analyzed included accidents with injury, fatal accidents, and property damage. Collision types were also counted. These included angle collisions, rear end collisions, and sideswipe collisions.
RECENT ADVANCES in COMPUTER ENGINEERING and APPLICATIONS
ISSN: 1790-5117 215 ISBN: 978-960-474-151-9
Figure 3. E. Fayette and N. Calvert Street
Figure 4 E. Fayette and I-83 S.
Urban form was studied because previous research revealed lower crash incidents in compact urban areas. Urban form was measured based on the following variables: building height, building setbacks, neighborhood scale, and design treatments. For this study scale was determined to be the relative massing of buildings and space, and was used to give a reflection of density.
3. Results
3.1 Crash Data Analysis
Crash data was analyzed at the following four intersections:
A- Argonne Dr. and Hillen Road B- Northern Parkway and Loch Raven
Blvd. C- N. Calvert St. and E. Fayette St. D- E. Fayette St. and I-83 South
Figure 5. Total Number of Accidents at the Four Intersections Figure 5 shows that the intersections located in the outer urban areas (A and B) had higher numbers of accidents within the 4 year data collection period than those in the urban core (C and D). Intersection B, Northern Parkway and Loch Raven, had 96 total accidents, while intersection D, E. Fayette St and I-83, had only 47 accidents.
Figure 6. Total Number of Injury Accidents at the Four Intersections
RECENT ADVANCES in COMPUTER ENGINEERING and APPLICATIONS
ISSN: 1790-5117 216 ISBN: 978-960-474-151-9
The number of injured also was greater in outer urban area as shown in Figure 6. Northern Parkway and Loch Raven (intersection B), had 67 persons injured, while intersection D, E. Fayette and I-83 had only 17 persons injured in the same period.
Figure 7. Angle Collison Type Accidents at the Four Intersections
Figure 8. Rear-End Collision Type Accidents at the Four Intersections
Figure 9. Side-Swipe Type Accidents at the Four Intersections The data for collision type accidents (Fig. 7) correlates with the number of accidents, in that the numbers for collision types at intersections in outer urban areas are much higher than accidents types in the urban core. Rear end and side-swipe accidents are shown in Figs. 8 and 9, respectively. 3.2 Physical Form Analysis The examination of the physical form of each intersection reveals the following: Street widths –As discussed in previous research, wide lanes (Fig. 10) may adversely affect traffic safety. In this study the streets with the widest or higher number of lanes have the highest crash data. Streets that have parking lanes also have an effect on pedestrian safety, in that parked cars can act as a buffer from traffic for pedestrians.
RECENT ADVANCES in COMPUTER ENGINEERING and APPLICATIONS
ISSN: 1790-5117 217 ISBN: 978-960-474-151-9
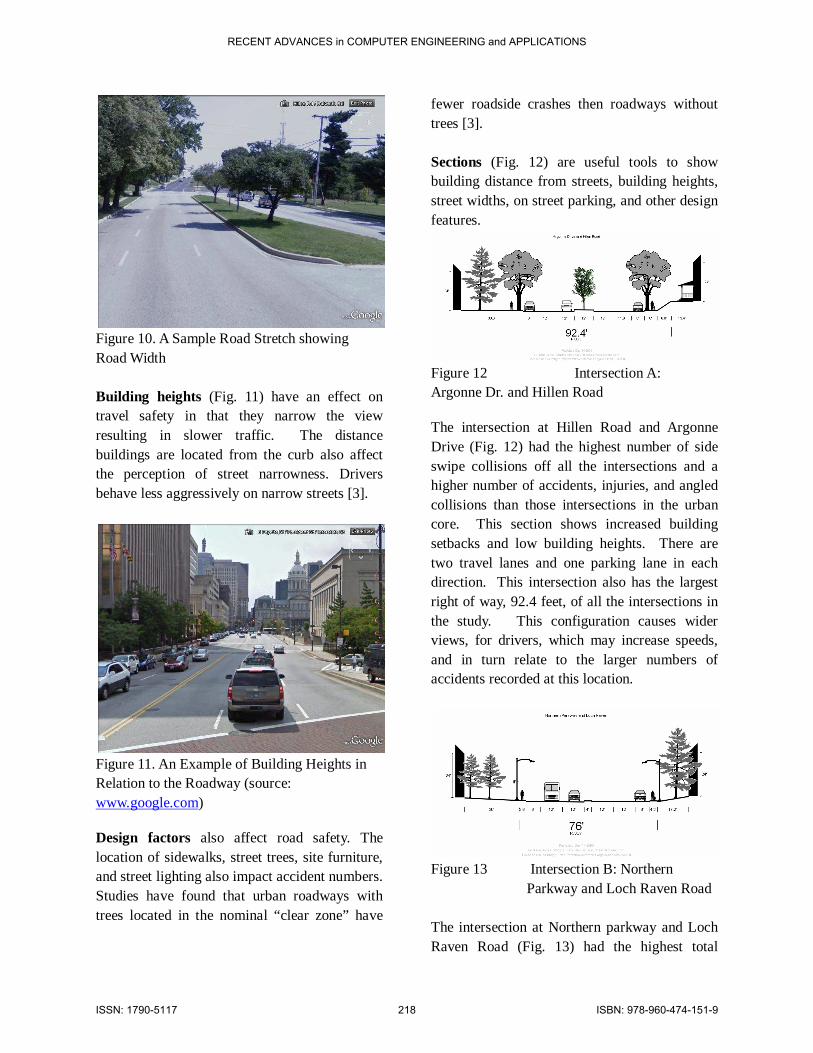
Figure 10. A Sample Road Stretch showing Road Width Building heights (Fig. 11) have an effect on travel safety in that they narrow the view resulting in slower traffic. The distance buildings are located from the curb also affect the perception of street narrowness. Drivers behave less aggressively on narrow streets [3].
Figure 11. An Example of Building Heights in Relation to the Roadway (source: www.google.com)
Design factors also affect road safety. The location of sidewalks, street trees, site furniture, and street lighting also impact accident numbers. Studies have found that urban roadways with trees located in the nominal “clear zone” have
fewer roadside crashes then roadways without trees [3]. Sections (Fig. 12) are useful tools to show building distance from streets, building heights, street widths, on street parking, and other design features.
Figure 12 Intersection A: Argonne Dr. and Hillen Road
The intersection at Hillen Road and Argonne Drive (Fig. 12) had the highest number of side swipe collisions off all the intersections and a higher number of accidents, injuries, and angled collisions than those intersections in the urban core. This section shows increased building setbacks and low building heights. There are two travel lanes and one parking lane in each direction. This intersection also has the largest right of way, 92.4 feet, of all the intersections in the study. This configuration causes wider views, for drivers, which may increase speeds, and in turn relate to the larger numbers of accidents recorded at this location.
Figure 13 Intersection B: Northern
Parkway and Loch Raven Road The intersection at Northern parkway and Loch Raven Road (Fig. 13) had the highest total
RECENT ADVANCES in COMPUTER ENGINEERING and APPLICATIONS
ISSN: 1790-5117 218 ISBN: 978-960-474-151-9
number of accidents, number of injured, angled collisions, and rear end collisions in the study. The section shows a wide right-of-way at 76 feet and buildings located a distance from the street. There is also no physical design feature, except the curb, that separates the pedestrian from the flow of traffic.
Figure 14 Intersection C Section: North
Calvert Street
This intersection C (Fig. 14), which is located in the urban core had a lower number of total crashes, and injured than intersections in the outer urban areas. The sections shows that this intersection is comprised of one way streets with narrow right-of-ways of only 40 feet. The buildings are tall and are located close to the street or cart way. This may help narrow the view, bringing the horizon closer, therefore slowing the driver down. The data collected did show that this intersection had a higher number of side swipe incidents, which may be due to the narrow street.
Figure 15 Intersection D Section: E. Fayette St.
Intersection D (Fig. 15) had the lowest total number of accidents, injured, rear end, and side swipe collisions in the study. The sections show two- way traffic on a right of way of 64’, much narrower than those in the outer urban area. There are multiple design amenities including, bus shelters, lighting, and street trees which provide additional separation of pedestrians from traffic on the street. The buildings are tall and located close to the cart way.
Neighborhood scale- neighborhood scale is a qualitative measure of the massing of buildings and spaces. Scale is relative to density which is a quantitative measure of the number of units on a land area [4]. Previous research has shown that larger block groups, often located at the periphery of metropolitan areas, tend to generate traffic destined for more central locations [2]. For this study figure grown diagrams were used to show the dispersion of development around each intersection. Figure ground drawings (Figs. 16-19) depict building as dark shapes on a white background. These drawings help in gaining a general understanding of the scale and
RECENT ADVANCES in COMPUTER ENGINEERING and APPLICATIONS
ISSN: 1790-5117 219 ISBN: 978-960-474-151-9
grain of development, in a particular neighborhood or built environment [4].
Figure 16 Intersection A Figure Ground:
Argonne Drive and Hillen Rd
Figure 17 Intersection B Figure Ground:
Northern Parkway and Loch Raven Blvd.
The figure ground drawings of development around intersections in the outer urban areas show that buildings are dispersed widely. The areas surrounding these intersections display low density. As discussed earlier, previous studies have shown that widely dispersed development and low density often increases VMT. Vehicle
miles traveled it directly related to higher accident rates [2].
Figure 18 Intersection C Figure Ground
E. Fayette St. and N. Calvert Street
Figure 19 Intersection C Figure Ground
E. Fayette St. and I-83 South In contrast to the outer urban areas, these figure ground drawings show that development around intersections in the urban core have more compact development. Studies have shown that compact development is a key factor in neighborhoods that are more transit oriented and
RECENT ADVANCES in COMPUTER ENGINEERING and APPLICATIONS
ISSN: 1790-5117 220 ISBN: 978-960-474-151-9
walk able. This also leads to fewer vehicle miles traveled. 3.3 Problem Formulation The following linear programming problem was formulated to minimize the accident incidence at intersections given the variables of neighborhood scale, street width and building height. Intersections
1 - Argonne Dr. and Hillen Road 2 - Northern Parkway and Loch Raven Blvd. 3 - N. Calvert St. and E. Fayette St. 4 - E. Fayette St. and I-83 South
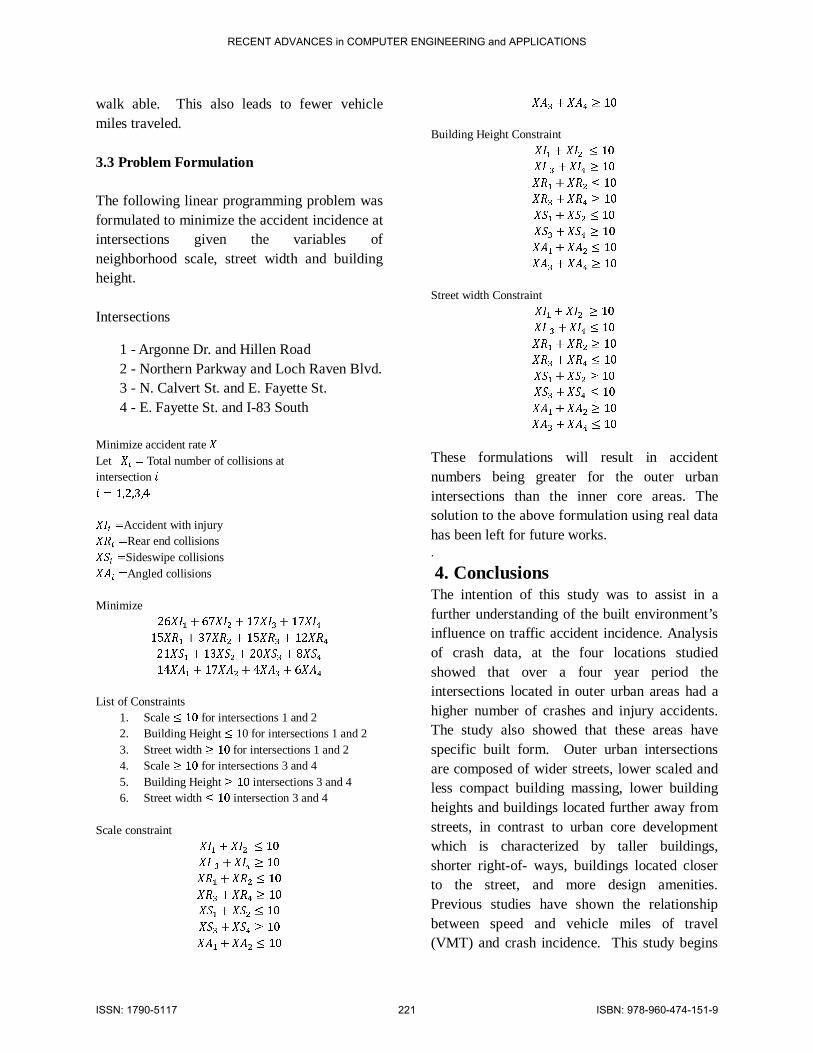
Minimize accident rate � Let �� = Total number of collisions at intersection � � = 1,2,3,4 ��� =Accident with injury ��� =Rear end collisions ��� =Sideswipe collisions ��� =Angled collisions Minimize 26��� + 67��� + 17���+ 17��� 15��� + 37��� + 15��� + 12��� 21��� + 13��� + 20��� + 8��� 14��� + 17���+ 4��� + 6��� List of Constraints
1. Scale ≤ 10 for intersections 1 and 2 2. Building Height ≤ 10 for intersections 1 and 2 3. Street width ≥ 10 for intersections 1 and 2 4. Scale ≥ 10 for intersections 3 and 4 5. Building Height ≥ 10 intersections 3 and 4 6. Street width ≤ 10 intersection 3 and 4
These formulations will result in accident numbers being greater for the outer urban intersections than the inner core areas. The solution to the above formulation using real data has been left for future works. .
4. Conclusions The intention of this study was to assist in a further understanding of the built environment’s influence on traffic accident incidence. Analysis of crash data, at the four locations studied showed that over a four year period the intersections located in outer urban areas had a higher number of crashes and injury accidents. The study also showed that these areas have specific built form. Outer urban intersections are composed of wider streets, lower scaled and less compact building massing, lower building heights and buildings located further away from streets, in contrast to urban core development which is characterized by taller buildings, shorter right-of- ways, buildings located closer to the street, and more design amenities. Previous studies have shown the relationship between speed and vehicle miles of travel (VMT) and crash incidence. This study begins
RECENT ADVANCES in COMPUTER ENGINEERING and APPLICATIONS
ISSN: 1790-5117 221 ISBN: 978-960-474-151-9
to show how form can affect vehicle speed. We need to better understand how developmental patters impact speed of travel and the necessity for vehicular travel itself. Sprawl development tends to increase nonresidential trips off of local streets on to arterials and thoroughfares designed for higher speeds. These higher speeds may lead to an increase in accident numbers. Therefore, we cannot ignore or disconnect the relationship between road safety and the physical form of00 built environment through which the road traverses. Further study should be undertaken on how the built environment encourages or discourages driver behavior.
Acknowledgement
Crash data was supplied by Baltimore City Department of Transportation-Traffic Division.
References:
[1] Reid, Ewing, Schieber, Richard, and Charles V. Zegeer, Urban Sprawl as a Risk Factor in Motor Vehicle Occupant and Pedestrian Fatalities, American Journal of Public Health, Volume 93, No.9, September 2003, pages 1541-1545, Architectural Press, Oxford, England.
[2] Dumbaugh, Eric and Robert Rae, Safe Urban Form: Revisiting the Relationship Between Community Design and Traffic Safety, Journal of the American Planning Association, Volume 75, No. 3, Summer 2009, pages 309-329, America Planning Association, Chicago, IL.
[3] Ewing, Reid and Eric Dumbaugh, The Built Environment and Traffic: A Review of Empirical Evidence, Journal of Planning Literature, Volume 23, No.
4, May 2009, pages 347-363, Sage Publications.
[4] Steiner, Frederick R. and Kent Butler, Planning and Urban Design Standards, 2007, John Wiley and Sons, Inc.
[5] Graham, Daniel J. and Stephen Glaister, Spatial Variation in Road Pedestrian Casualties: The Role of Urban Scale Density and Land-use Mix. Urban Studies, Volume 40, No. 8, July 2003, pages 1591-1607.
[6] Vuchic, Vukan. Transportation for Livable Cities, 1999, State of New Jersey.
[7] Dunham-Jones, Ellen and June Williamson, Retrofitting Suburbia: Urban Design Solutions for Redesigning Suburbs, 2009, John Wiley and Sons, Inc.
RECENT ADVANCES in COMPUTER ENGINEERING and APPLICATIONS