Southeast Asian Studies, Vol. 49, No. 1, June 2011 124 The Effects of Expansion of Private Wells on Rural Livelihood in Tank Intensive Watersheds: A Case Study in Upper Gundar River Basin, Tamil Nadu SATO Takahiro* and Periyar Ramasamy DURAIYAPPAN** Abstract This article aims to investigate the effects of the expansion of private wells on rural livelihood (income) in a tank-intensive watershed in the upper Gundar River Basin in southern Tamil Nadu, India, based on data obtained by recent field surveys, government statistics and meteorological records. For the entire upper river basin, we show spatial differences at the village (gram panchayat ( ( ) level and track the changes over the last two decades. The major finding is that although traditional crop production, mainly composed of paddy , millets and pulses, was dominant at least until the mid-1990s, the expansion of private wells enabled farmers to introduce cash crops, especially in the upper part of the basin. By contrast, fallow land increased sharply in the lower part of the basin due mainly to the disappointing performance of the wells. The different performance of wells finally resulted in a significant income gap between the upper and the lower river basin. Keywords: tank irrigation, private well, commercial agriculture, farm income I Introduction Based on tank (water reservoir) irrigation system, traditional rice-based agriculture has long been practiced in many parts of Tamil Nadu, India. Nowadays there are still 39,202 tanks in the state [Palanisami et al. 2008], which were constructed across the slope of valleys to catch and store water. These tanks have existed since “time immemorial” [Palanisami 2000]; one of the tanks in Madurai District, for instance, was constructed either in the later Pandiyas (1300AD–1600AD) or the Nayakas (1600AD–1800AD) period, deducing from its sluice structure and mortar [Ford Foundation and Anna University 2001]. Ludden [1979] argued that the civilization in Tamil Nadu matured amidst irrigated paddy fields which benefited from tank irrigation. * 佐藤孝宏,Center for Southeast Asian Studies, Kyoto University e-mail: takahi[email protected]yoto-u.ac.jp ** Centre for Agriculture and Rural Development Studies, Tamil Nadu Agricultural University
Transcript
Southeast Asian Studies, Vol. 49, No. 1, June 2011
124
The Effects of Expansion of Private Wells onRural Livelihood in Tank Intensive Watersheds:
A Case Study in Upper Gundar River Basin, Tamil Nadu
SATO Takahiro* and Periyar Ramasamy DURAIYAPPAN**
Abstract
This article aims to investigate the effects of the expansion of private wells on rural livelihood (income) in
a tank-intensive watershed in the upper Gundar River Basin in southern Tamil Nadu, India, based on data
obtained by recent field surveys, government statistics and meteorological records. For the entire upper
river basin, we show spatial differences at the village (gram panchayat(( ) level and track the changes over
the last two decades. The major finding is that although traditional crop production, mainly composed of
paddy, millets and pulses, was dominant at least until the mid-1990s, the expansion of private wells enabled
farmers to introduce cash crops, especially in the upper part of the basin. By contrast, fallow land increased
sharply in the lower part of the basin due mainly to the disappointing performance of the wells. The
different performance of wells finally resulted in a significant income gap between the upper and the
lower river basin.
Keywords: tank irrigation, private well, commercial agriculture, farm income
I Introduction
Based on tank (water reservoir) irrigation system, traditional rice-based agriculture has long been
practiced in many parts of Tamil Nadu, India. Nowadays there are still 39,202 tanks in the state
[Palanisami et al. 2008], which were constructed across the slope of valleys to catch and store water.
These tanks have existed since “time immemorial” [Palanisami 2000]; one of the tanks in Madurai
District, for instance, was constructed either in the later Pandiyas (1300AD–1600AD) or the Nayakas
(1600AD–1800AD) period, deducing from its sluice structure and mortar [Ford Foundation and Anna
University 2001]. Ludden [1979] argued that the civilization in Tamil Nadu matured amidst irrigated
paddy fields which benefited from tank irrigation.
* 佐藤孝宏,Center for Southeast Asian Studies, Kyoto Universitye-mail: [email protected]
** Centre for Agriculture and Rural Development Studies, Tamil Nadu Agricultural University
125
SATO T. and Periyar Ramasamy DURAIYAPPAN : The Effect of Expansion of Private Wells
It is well-known that minor irrigation, especially well irrigation, has played a critical role in agri-
cultural development in India since independence (e.g., Esho [2008]; Sivasubramaniyan [2006]). This
is also true for the tank-irrigated areas in south India, including Tamil Nadu. Expansion of private wells
that were constructed in the command area of tanks for supplementary irrigation and also in the dry
land for introducing irrigation have been leading agricultural development in such a region as well,
primarily through increased yield per unit of land for traditional crops, mainly rice (through the “Green
Revolution”). In recent years, the demand for rice in India has been approaching saturation point,
enabling the country to start exporting rice to the world market. However, because of the relatively
low productivity of rice in tank-irrigated areas (compared to Punjab, for instance), economic development
through rice exports cannot be expected in such areas.
Given that almost half of the working population is still engaged in agriculture in Tamil Nadu [GOTN
2006a]1) and agricultural development is still one of the key issues for economic development, increased
production of high-valued crops such as fruit and vegetables is essential in tank-irrigated areas.
High-valued crops are mainly for urban population; their number has been rapidly increasing, espe-
cially after the early 1990s when India started full economic liberalization and thereby accelerated the
development of industrial and service sectors (on Tamil Nadu, see Kajisa and Palanichamy [2006]).
Considering that more ample and timely irrigation is indispensable for growing fruit and vegetables or
other high-valued crops, the importance of private wells is also expected to grow. Tank water is stored
only during the rainy season, and the water volume is highly affected by climate conditions as well as
by tank management. By contrast, well water is available throughout the year, unless the well dries up.
The expansion of private wells after independence, especially since the 1960s, significantly contributed
to the “Green Revolution.” In Tamil Nadu, the “Green Revolution” spread mainly in the 1980s up to
the mid-1990s (Fujita [2011] in this issue). It is also reported that ground water irrigation started to
expand again after the 1990s in the state mainly due to the decline in the price of pumps and the cost
of drilling wells [Kajisa et al. 2007].
There are already a number of studies focusing on the expansion of private wells and its impact in
Tamil Nadu (e.g., Janakarajan [1993]; Palanisami et al. [2008]). The important role played by private
wells in agricultural development has been argued clearly but much attention has not been paid to the
salience of geographical location of their study site, because their analyses were largely confined to
individual villages or at most to some blocks (an administrative unit; see footnote 2)). For more sustainable
1) But the primary industry contributes less than 20% of net state domestic product in Tamil Nadu [GOTN 2006a],thus indicating the widening income disparity between urban and rural areas.
東南アジア研究 49巻 1号
126
rural development, watershed development programs have become a key strategy in India [GOTN 2010;
Shah 2000; Vaidyanathan 2006]. This means that when we deal with the expansion of private wells,
analyzing the issue within a wider geographical context such as at a river basin level is essential.
This article focuses on the entire upper part of the Gundar River Basin in southern Tamil Nadu,
which is one of the tank-intensive watersheds in the state. The major objective of the article is to
investigate the effect of the expansion of private wells by examining the changes in crop choice by
farmers during the last two decades from subsistence food crops (rice, millets and others) to cash crops.
In other words, based on data obtained from government statistics and recent field surveys, we attempt
to show how the expansion of private wells affected crop choice by farmers and their livelihood (income)
in the entire upper Gundar Basin. Although we offer detailed analysis of only two study villages from
the upper and the lower part of the basin, we illustrate the spatial variation at the village (gram panchayat(( )
level by showing several GIS (geography information system) maps.
The next chapter of this article provides an overview of the research site, namely, the upper Gundar
River Basin and the two study villages for an in-depth analysis. Then, the process of the expansion of
private wells in the study area is illustrated in Chapter III. After brief explanations on crop cultivation
in the studied four blocks in Chapter IV, we discuss the changes in crop choice and their impact on rural
livelihood (income) in Chapters V and VI. Before the conclusion, we discuss some major points raised
in this article in Chapter VII.
II Overview of the Research Site
II.1. Outline of the Upper Gundar River Basin
There are a total of 17 major river basins in Tamil Nadu, one of which is the Gundar River Basin (Fig. 1).
It has a total area of 5,647 km2, extending to 5 districts [Gowtham and Lawrence 2010]. The upper part
of the basin covers 3 blocks (Sedapatti, Tirumangalam and Kallikudi) of Madurai District and 1 block
(Kariapatti) of Virudhunagar District (Fig. 2).2) In the interest of simplicity, Sedapatti, Tirumangalam,
Kallikudi and Kariapatti blocks will be renamed according to their position in the basin as Blocks A, B,
C and D, respectively. The upper Gundar River Basin is composed of the two major tributaries, i.e.,
Goundanathi and Thekkar. The Goundanathi River starts from the two villages of Saptur and Elumalai
in Block A [GOTN 2008a]. The Goundanathi and Thekkar Rivers join at the P. Pudupatti Village in
Block D, from where the river is called the Gundar [ibid.].
2) The “block” is an administrative unit in India introduced for the purpose of development after independence.
127
SATO T. and Periyar Ramasamy DURAIYAPPAN : The Effect of Expansion of Private Wells
As illustrated in Fig. 2b, the four blocks under study are located south to west of Madurai, the
second largest city in Tamil Nadu. National highways extend radially from Madurai City, and state
highways are arranged to connect to these national highways. There are four wholesale markets near
the study area; Madurai, Tirumangalam, Usilampatti, and Virudhunagar [GOTN 2004]. The Madurai
Wholesale Market is the biggest, reflecting the largest population size of the city.
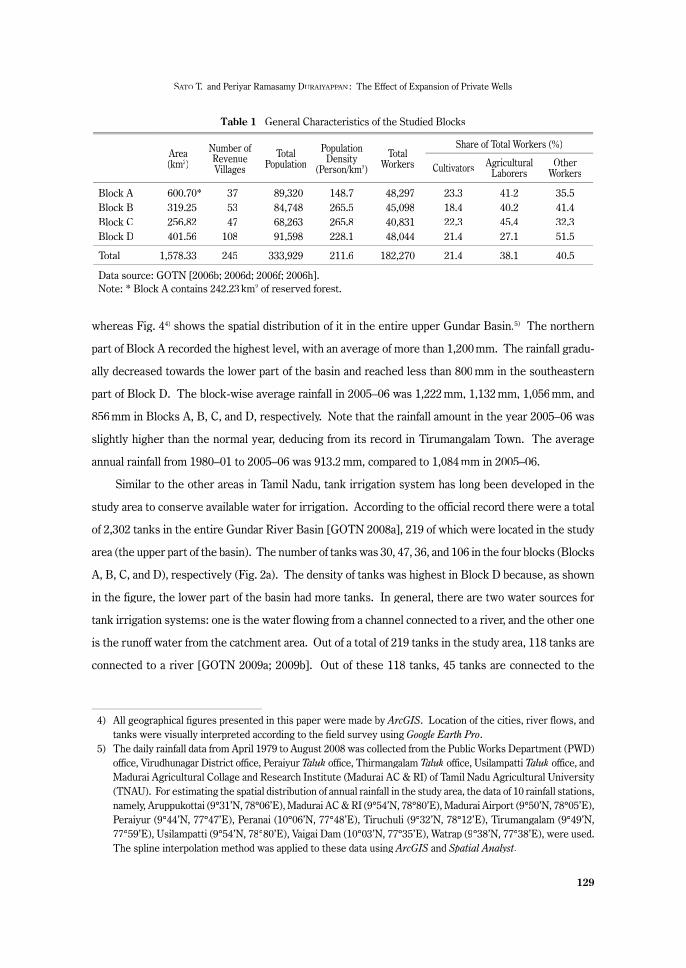
Table 1 presents the general characteristics of the four blocks. The total geographical area is
1,578 km2. The population density in Blocks A and D was lower than the other two, but the low den-
sity in Block A was mainly due to the existence of a large reserved forest. Since agricultural workers
(including cultivators and agricultural laborers) occupied more than half of the total workforce, the
agricultural sector still played a major role in the study area in general. However, out of the four blocks
Block D was an exception, with more than half of non-agricultural workers.
Fig. 3 shows the average monthly rainfall, in comparison with the reference evapotranspiration
(ET(( 0T ) measured at Madurai AC & RI.3) The value of ET0T is generally treated as potential evapo-
transpiration, which is the amount of water that could be evaporated or transpirated if sufficient soil
3) The monthly reference evapotranspiration (ET(( 0T ) was calculated by the methodology of Allen et al. [1998].
Fig. 1 Location of the Study Area
東南アジア研究 49巻 1号
128
water was available. The figure shows that the ET0T exceeds the rainfall almost all the year round
except during the three months from September to November, when the northeast monsoon brings
relatively plentiful rainfall in the area. River flow can only be observed a few times in this rainy
season (September–November) when it rained intensively. There is little river flow in the dry season
(December and January–August) because most of the rainfall in this season has evaporated. The
average rainfall of the whole study area in the 2005–06 agricultural year (June–May) was 913 mm,
Fig. 2 Maps of the Study Area
129
SATO T. and Periyar Ramasamy DURAIYAPPAN : The Effect of Expansion of Private Wells
whereas Fig. 44) shows the spatial distribution of it in the entire upper Gundar Basin.5) The northern
part of Block A recorded the highest level, with an average of more than 1,200 mm. The rainfall gradu-
ally decreased towards the lower part of the basin and reached less than 800 mm in the southeastern
part of Block D. The block-wise average rainfall in 2005–06 was 1,222 mm, 1,132 mm, 1,056 mm, and
856 mm in Blocks A, B, C, and D, respectively. Note that the rainfall amount in the year 2005–06 was
slightly higher than the normal year, deducing from its record in Tirumangalam Town. The average
annual rainfall from 1980–01 to 2005–06 was 913.2 mm, compared to 1,084 mm in 2005–06.
Similar to the other areas in Tamil Nadu, tank irrigation system has long been developed in the
study area to conserve available water for irrigation. According to the official record there were a total
of 2,302 tanks in the entire Gundar River Basin [GOTN 2008a], 219 of which were located in the study
area (the upper part of the basin). The number of tanks was 30, 47, 36, and 106 in the four blocks (Blocks
A, B, C, and D), respectively (Fig. 2a). The density of tanks was highest in Block D because, as shown
in the figure, the lower part of the basin had more tanks. In general, there are two water sources for
tank irrigation systems: one is the water flowing from a channel connected to a river, and the other one
is the runoff water from the catchment area. Out of a total of 219 tanks in the study area, 118 tanks are
connected to a river [GOTN 2009a; 2009b]. Out of these 118 tanks, 45 tanks are connected to the
4) All geographical figures presented in this paper were made by ArcGIS. Location of the cities, river flows, andtanks were visually interpreted according to the field survey using Google Earth Pro.
5) The daily rainfall data from April 1979 to August 2008 was collected from the Public Works Department (PWD)office, Virudhunagar District office, Peraiyur Taluk office, Thirmangalam Taluk office, Usilampatti Taluk office, andMadurai Agricultural Collage and Research Institute (Madurai AC & RI) of Tamil Nadu Agricultural University(TNAU). For estimating the spatial distribution of annual rainfall in the study area, the data of 10 rainfall stations,namely, Aruppukottai (9°31’N, 78°06’E), Madurai AC & RI (9°54’N, 78°80’E), Madurai Airport (9°50’N, 78°05’E),Peraiyur (9°44’N, 77°47’E), Peranai (10°06’N, 77°48’E), Tiruchuli (9°32’N, 78°12’E), Tirumangalam (9°49’N,77°59’E), Usilampatti (9°54’N, 78°80’E), Vaigai Dam (10°03’N, 77°35’E), Watrap (9°38’N, 77°38’E), were used.The spline interpolation method was applied to these data using ArcGIS and Spatial Analyst.
Table 1 General Characteristics of the Studied Blocks
Area(km2)
Number of Revenue Villages
TotalPopulation
PopulationDensity
(Person/km2)
TotalWorkers
Share of Total Workers (%)
Cultivators AgriculturalLaborers
OtherWorkers
Block A 600.70* 37 89,320 148.7 48,297 23.3 41.2 35.5Block B 319.25 53 84,748 265.5 45,098 18.4 40.2 41.4Block C 256.82 47 68,263 265.8 40,831 22.3 45.4 32.3Block D 401.56 108 91,598 228.1 48,044 21.4 27.1 51.5
Total 1,578.33 245 333,929 211.6 182,270 21.4 38.1 40.5
Data source: GOTN [2006b; 2006d; 2006f; 2006h].Note: * Block A contains 242.23 km2 of reserved forest.
東南アジア研究 49巻 1号
130
Fig. 3 Monthly Rainfall and Reference Evaporation (ETo(( ) in Madurai (averaged of 1980–2006)
Data source: Weather data at Madurai AC&RI, Tamil Nadu Agricultural UniversityNote: Vertical bars denote standard error.
Fig. 4 Spatial Distribution of Annual Rainfall in 2005–06 Agricultural Year (unit: mm/year)
Data source: Rainfall data at 10 rainfall stations (See text)
131
SATO T. and Periyar Ramasamy DURAIYAPPAN : The Effect of Expansion of Private Wells
Vaigai River which flows outside the Gundar River Basin. They are located in the northern part of
Blocks B and D. A continuous river flow throughout the year can be expected in the Vaigai River because
of the existence of the two large reservoirs [Sivasubramaniyan and Vaidyanathan 2001], so that the
period when water is stored in these 45 tanks is much longer; interview with farmers revealed that
water is normally stored from mid-October to the end of March (5.5 months). The remaining 73 system
tanks benefit from the Goundanathi or Thekkar River, and the tank water is normally stored only for
three months. Finally, the remaining 101 tanks are completely rain-fed; runoff water from the catchment
area is the only source of water. They are the most unstable tanks.
II.2. Outline of the Study Villages6)
For an in-depth study we selected two villages from the study area: one from the upper part of the basin
and the other from the lower part of it. The former village named Saptur Village is located in the west-
ern part, belonging to Sedapatti Block (Block A) of Madurai District (Fig. 2b). It is located 7.5 km away
from Peraiyur Town, where the taluk office is located.7) The total population of the village was 7,767
[GOTN 2006b], and almost 80% of the population lived in Saptur Hamlet, the biggest hamlet among the
six hamlets in the village. More than 70% of the workforce was engaged in agriculture and related
activities [ibid.]. The village is very close to the Western Ghats Mountains, and sits in the uppermost
part of the Gundar Basin (Figs. 2b and 5a). There are two tanks in the village that irrigate the wet land
in the tank command area (nañcai in Tamil) located in the northeastern part of the village. However,
most of the agricultural land owned by the villagers is categorized as dry land (puñcai (( in Tamil), falling
outside of the tank command area. A number of small rivers originating from the Western Ghats flow
through the puñcai, and some farmers who owned land adjacent to the small rivers may take the water
into their land for irrigation. The rainfall was recorded at 1,238 mm in Periyar Town in 2005–06.
The other study village named P. Pudupatti (the official name is Perunjaripudupatti) Village is located
in the southeastern part of the study area, belonging to Kariapatti Block (Block D) of Virudhunagar
District. It is located 11.2 km from Tiruchuli Town, where the taluk office is located. The total popula-
tion of the village was 1,150 [GOTN 2006h], and almost 90% of the population lived in Pudupatti Hamlet
(The other small hamlet is called Perunjari Hamlet). More than 60% of the workforce was engaged in
agriculture and related activities [ibid.]. As mentioned earlier, the two tributaries of the Gundar River
6) In this paper a village means an administrative unit officially called gram panchayat. A gram panchayat is usuallytcomposed of several hamlets (natural villages).
7) The taluk is an administrative unit introduced mainly for revenue collection in the British colonial era. Gener-ally, a taluk covers a wider area than a block in Tamil Nadu.
東南アジア研究 49巻 1号
132
(Thekkar and Goundanathi) join at this village (Figs. 2a and 5b). There is only one tank, which is con-
nected to the Thekkar River. The tank irrigates nañcai land located in the south. Puñcai land extends
widely to the southwestern side of the Thekkar/Gundar Rivers. The rainfall was recorded 720 mm in
Tiruchuli Town in 2005–06.
Fig. 5 Maps of the Study Villages
133
SATO T. and Periyar Ramasamy DURAIYAPPAN : The Effect of Expansion of Private Wells
III Process of Expansion of Wells in the Study Area
The spatial distribution of the density of dug wells in the entire study area is shown in Fig. 6. The
density of dug wells was highest in Block A, whereas in the two blocks located in the middle reach of
the basin (Blocks B and C), villages with high and low densities of dug wells form a mosaic. The den-
sity of wells was apparently low in Block D.
Now, in order to investigate the inter-temporal process of the expansion of private wells in the
study area, two kinds of data are presented here. One is the data from the government statistics (con-
fined to Madurai District) and the other is from the authors’ field surveys in the two study villages.
Fig. 7 shows the change in the number of wells, including dug wells and bore wells8) in Madurai
District during the last two decades. The figure shows that the number of both dug and bore wells
showed a slow increase until the end of the 1990s, but the speed of the increment suddenly accelerated
in the early 2000s. However, a sharp decline in the number of dug wells was observed from the mid-
2000s, which might reflect the abandonment of existing wells.
Next, let us examine the experiences in the two study villages regarding the change in the number
of private wells. Table 2 shows the trend in Saptur Village. It is found that in nañcai, the number as a
whole did not change, but dug wells were rapidly converted to dug-cum-bore wells after the mid-1990s.
By contrast, the number of wells in puñcai increased rapidly from the late-1990s due to the increase of
both dug-cum-bore wells and bore wells. On the whole, the total number of private wells in the village
showed an increase from 1998, and the depth of wells became deeper due to the conversion of dug wells
to dug-cum-bore wells. Regarding P. Pudupatti Village, a land registration map in 2008 suggested that
there existed 43 wells within the village boundary, but according to our field survey in 2008, in nañcai
there were only 10 active dug wells in 1998. Five were newly installed by 2008, but none of these was
in use in 2008. The reasons for the abandonment of wells were due to both a shortage of groundwater
and a problem with its salinity.9) It should be mentioned here that one farmer installed a bore well down
to around 350 feet from the soil surface in 1998, but could not obtain any water. On the other hand, in
puñcai there were only 2 dug wells in use in 2008; and the rest of the wells were also abandoned.
We observed a strong tendency toward the decrease of the density of wells from the upper to the
lower basin in accordance with the river flow (Figs. 2a and 6), which might correspond to the different
8) See Appendix, regarding the definition of wells. Data on dug-cum-bore well was also presented in the statisticaldata, but we did not present it because of its apparent inaccuracy.
9) We observed salinity problems of groundwater in the lower part of the basin, including P. Pudupatti Village, eventhough the village is not close to the sea.
東南アジア研究 49巻 1号
134
Fig. 6 Spatial Distribution of the Density of Dug Wells
Data source: GOTN [2006c; 2006e; 2006g; 2006i]
Fig. 7 Inter-temporal Changes in the Number of Private Wells in Madurai District*
Data source: Season and Crop Report of Tamil Nadu [various issues]Note: * Number of wells in Madurai and Theni Districts were aggregated because Theni
District was separated from the original Marudai District in 1996.
135
SATO T. and Periyar Ramasamy DURAIYAPPAN : The Effect of Expansion of Private Wells
performance of wells. According to data on groundwater level surveyed in May 2006 [GOTN 2007a;
2007b], which is expected to be the lowest in the whole year because of the pre-monsoon season, the
groundwater level was 2 to 5 meters in the three blocks located in the upper basin (Blocks A, B, and
C), and 5 to 10 meters in Block D. Given the fact that, as shown in Fig. 8, the permeable layers and
impermeable layers are alternately stratified under the soil surface, these figures seemed to be the
groundwater level just under the soil surface, from which dug wells can be recharged. The lower
groundwater level in Block D suggested above, therefore, indicates that farmers in Block D had to dig
dug wells deeper, just in order to get the same amount of water, compared to the other three Blocks. On
Table 2 Inter-temporal Changes in Private Wells in Saptur Village (Number of samples=58)
Land Type Well Type 1988 1993 1998 2003 2008
Dug well 22 21 20 17 16nañcai Dug-cum-bore well 1 2 5 8 9
Bore well 0 1 1 1 1
Total 23 24 26 26 26
Dug well 29 25 23 22 20puñcai Dug-cum-bore well 4 8 13 17 21
Bore well 0 0 1 4 6
Total 33 33 37 43 47
Dug well 51 46 43 39 36Total Dug-cum-bore well 5 10 18 25 30
Bore well 0 1 2 5 7
Total 56 57 63 69 73
Data source: Author’s field survey (December, 2008)
Fig. 8 Type of Wells
東南アジア研究 49巻 1号
136
the other hand, bore wells capture groundwater from the deep permeable layer. We have already intro-
duced above the story of a farmer in P. Pudupatti Village who failed to get water from the depth of around
350 feet (≒107 meter), which implies that farmers in the lower basin generally faced difficulties to get
groundwater from the deep layer as well. Such difficulties faced by farmers in the lower basin made
them hesitate to install new wells, and resulted in the spatial deviation of wells as shown in Fig. 6.
IV Spatial Differences in Cropping System within the River Basin
Table 3 is a summary of cropping in the four Blocks in the 2005–06 agricultural year. We found that
even though there was a total of 94,912 hectares of agricultural land, the gross cultivated area was only
55,908 hectares, with a cropping intensity of 58.9%; and the share of land lying fallow was large. Crop-
ping intensity was the highest in Block C (89.6%) and the lowest in Block D (42.0%). The average
irrigation ratio was 49.0%, whereas it was relatively high in Block D (65.3%) and A (51.7%).
Fig. 9 shows the spatial distribution of the “cultivation share” for subsistence food crops such as
paddy, millets,10) and pulses. The spatial distribution of the cultivation share for cash crops such as fibers,
oil crops, sugarcane, and fruit/vegetables is presented in Fig. 10. Note here that, given the fact that
tanks were concentrated in the northern side of the Thekkar River (Fig. 2a), the dashed lines in Figs.
9 and 10 separate the study area by the density of tanks. In the following part of this chapter, let us
refer to the area above and below the line as the “Tank-zone” and the “Rain-fed-zone,” respectively.
Now the major question is what kind of factors determined the crop choice by farmers, which was
quite different in each geographical unit, as shown in Figs. 9 and 10. The hypothesis here is that water
availability in each unit vis-à-vis water requirement for different crops was the major determinant. Let
us now examine this issue in depth.
10) Major millets in the study area include sorghum (cholam in Tamil), pearl millet (cumbu), finger millet (ragi), andmaize.
Table 3 Summary of Cropping in the Studied Blocks (2005–06 Agricultural Year)
SATO T. and Periyar Ramasamy DURAIYAPPAN : The Effect of Expansion of Private Wells
Generally speaking, almost all the farmers in the study area grow paddy during the rainy season
in nañcai, but some farmers with well-functioning wells grow paddy in puñcai, and in nañcai during the
dry season, as well. In Fig. 9, a high cultivation share of paddy was mainly observed in the Tank-zone,
but a relatively higher cultivation share (of paddy) was also noted in Block A. Millets were the tradi-
tional crops during the rainy season in puñcai, but many farmers now grow them in the dry season as
well. Millets are usually grown under rain-fed conditions, but farmers with wells give supplementary
irrigation. According to our interview with farmers the gruel made from millets was commonly used
as a staple food until 20 to 30 years ago. Currently, they mainly use millets for feeding cattle. Higher
cultivation share of millets was observed in the Rain-fed-zone, especially in Blocks A, B and C. Pulses
such as red gram and black gram are common food crops in the study area, and also used for making
saanbar (South Indian vegetable curry sauce), etc. We also observed a higher cultivation share of
pulses in the Rain-fed-zone, especially in Blocks B, C and D.
In Fig. 10, a higher cultivation share of fibers (mainly cotton) was evident in the Rain-fed-zone
(Blocks B, C and D), similar to pulses. By contrast, we observed a higher cultivation share of oil crops
Fig. 9 Spatial Distribution of Cultivation Share* of Subsistence Food Crops (2005–06 Agricultural year)
Data source: GOTN [2006c; 2006e; 2006g; 2006i]Note: * Cultivation share = (Area under each crop) / (Total cultivated area)
東南アジア研究 49巻 1号
138
(mainly groundnut) in the Tank-zone. Fibers and oil crops were usually cultivated during the dry season
under irrigation when well water is available. Relatively minor cash crops such as sugarcane and
fruit/vegetables displayed a unique spatial distribution. A high cultivation share of sugarcane can be seen
in the upper part of the river basin. Sugarcane farmers in the study area had wells without exception,
because it was one of the necessary conditions for making a contract with sugarcane factories. The grow-
ing period of sugarcane is two years (newly planted and ratoon). For fruit/vegetables, we observed a high
cultivation share only in the villages at the northeastern edge of the Tank-zone. Vegetables were grown
during the dry season under well irrigation because of the necessity for ample and timely irrigation.
Table 4 shows the estimated standard water requirement (ETc(( ) (maximum amount of water use
under favorable soil water conditions) for the major crops in the study area.11) The ETc is mainly
Fig. 10 Spatial Distribution of Cultivation Share* of Cash Crops (2005–06 Agricultural year)
Data source: GOTN [2006c, 2006e, 2006g, 2006i]Note: * Cultivation share = (Area under each crop) / (Total cultivated area)
11) For estimating the ETc, a monthly summary of weather data (rainfall amount, maximum and minimum tem-perature, relative humidity, sunshine hours or radiation, and wind velocity) during 1980–2005 (the data for 2001were not available) measured at Madurai AC & RI, TNAU was used. The growing period of crops were obtainedfrom our interviews with farmers as explained above, on a monthly basis. Crop evapotranspiration was esti-mated using single crop coefficient (k(( c) [Allen et al. 1998] and presented as the standard water requirement.Estimated values were the averages during 1980–2005.
139
SATO T. and Periyar Ramasamy DURAIYAPPAN : The Effect of Expansion of Private Wells
determined by the length of growing period and the dryness of the air during the growing period. The
crop-wise orders (from high to low) of the estimated ETc were paddy > millets > pulses for the sub-
sistence food crops, and sugarcane > fruit tree > fiber > oil seed > vegetables for the cash crops. The
crops with high ETc such as paddy, sugarcane and fruit/vegetables will naturally require irrigation, either
from tanks or wells.
To sum up the argument, firstly, the spatial distribution of crops in the study area was primarily
determined by the availability of tanks, because the cultivation share of paddy and oil crops was rela-
tively high in the Tank-zone, whereas that of millets, pulses and fibers was relatively high in the
Rain-fed-zone. However, secondly, differences in the cropping system within the same zone (either in
the Tank-zone or the Rain-fed-zone) were also evident. Fruit and vegetables, which require ample and
timely irrigation, for instance, were introduced only in the villages located at the northeastern edge of
the Tank-zone, because the tanks in these villages kept water for longer periods due to their connection
to the large-scale reservoirs, as explained earlier in Chapter II, although the vicinity to market (Madurai
City) was another major reason. In the Rain-fed-zone, paddy and sugarcane, which required more
water (Table 4), were introduced only in the uppermost part of the basin (Block A), because many
farmers in Block A had wells, which might enable them to supply enough water to the crops with high
water requirement. Also notable is the fact that the crops selected in Blocks B, C and D were similar
(such as millet, pulses and fibers), but the irrigation ratio of these crops in Block B was apparently
Table 4 Standard Water Requirement for Major Crops in the Study Area
Subsistence Food Crops / Cash Crops Category Kind of
Crop
MajorGrowingPeriod
Standard WaterRequirement
(mm)
Subsistence Food Crops
Paddy Paddy Oct–Jan 1200.6±239.9
Millets Sorghum Apr–Jul 441.8±119.3
Pulses Green gram Mar–May 291.0±80.6
Cash Crops
Fibers Cotton Mar–Aug 811.5±213.5
Oil crops Groundnut Jan–Apr 495.9±131.4
Sugar crops Sugarcane Apr–Mar 1813.2±423.8
Fruits andvegetables
Banana Apr–Mar 1657.8±387.4
Fruit trees – 1157.0±270.4
Vegetables Jun–Aug 438.4±119.1
Note: The values were calculated using the weather data at Madurai AC & RI, Tamil Nadu Agricultural University following Allen et al. [1998].Average numbers from 1980 to 2005 were presented.Numbers after “±” indicate standard error.Shading values in table indicate popular growing period in the study area.
東南アジア研究 49巻 1号
140
higher than in Blocks C and D (Table 5), because the wells in Block B might provide more water than
those in Blocks C and D. The cropping intensity was apparently higher in Block C than Block D (Table
3), which implied that water used for crop cultivation was larger in Block C than in Block D because of
the different well density between Blocks B and C. Therefore, the spatial differences in the cropping
system presented in Figs. 9 and 10 can be understood mainly by the factor of water. Water availability
was originally determined by tanks, but the availability of wells also became a major determinant of crop
choice in the study area.
V Differences in the Crop Composition between Upper and Lower Basin12)
The changes in the crop composition in the two study villages during the last two decades are shown
in Figs. 11 and 12, by using data obtained from the sample farmers (58 and 22 from Satpur and P.
Pudupatti Villages, respectively) on area of crops cultivated, which were added up and presented as a
share of crops in each village. Here, crops are categorized into two (subsistence food crops and cash
crops) and the share of fallow land is also shown. Now let us present the major findings for each village,
and by the category of land (nañcai and puñcai).
(1) Saptur Village
1) Nañcai
In the rainy season, the cultivation of subsistence food crops continued to be highly dominant, but a
Table 5 Irrigation Ratio of Selected Crops in the Studied Blocks (2005–06 Agricultural Year)
12) The authors visited the study villages (Saptur and P. Pudupatti) in September and December, 2008, to collectdetailed household-level data. The sample size of the households surveyed was 58 and 45 each. Details oncropping system, private wells, and household income for the year of 2007–08 were obtained through interviewsand questionnaire surveys. The size of land holding and the area under each crop (including leased-in land andmortgaged-in land) during the last 20 years were also investigated. Because of the time limitation, however,the number of samples for this question was limited to 22 (out of 45) in P. Pudupatti Village.
141
SATO T. and Periyar Ramasamy DURAIYAPPAN : The Effect of Expansion of Private Wells
gradual decrease in the area under paddy can be observed from 1998, as farmers shifted to cash crops
(mainly banana). Banana cultivation increased its share until 2008. On the other hand, in the dry season,
millet cultivation was originally dominant, but a remarkable change occurred from 1998, when almost
half of the area under millets was converted to cash crops (fibers and fruit/vegetables). In 2008, how-
ever, cash crops (oil crops and fibers) declined and shifted back to millets, while fruit/vegetables
remained the same. The ratio of fallow land decreased constantly until 2003, but increased sharply
thereafter and reached nearly 18% in 2008.
2) Puñcai
In the rainy season, paddy, millets and oil crops were originally dominant. A noticeable change was
observed with the introduction of sugarcane in 2003, which mainly replaced paddy and millets. How-
ever, sugarcane area decreased in 2008 and farmers converted back to paddy. In the dry season, nearly
50% of land remained fallow in 1988, but the cropping ratio increased continuously until 2008. Fallow
Fig. 11 Inter-temporal Changes in Crop Choice in Saptur Village
Data source: Author’s field survey (December, 2008)Note: Lines between the bar graphs illustrate the inter-temporal change of the share of the three crop
categories (Subsistence food crops, Cash crops and Fallow) presented in Figs. 9 and 10.
東南アジア研究 49巻 1号
142
land was converted mainly to cash crops (fibers, oil crops and sugarcane). Millets were originally
dominant, but as of 1993, some of them were also converted to oil crops and fibers.
(2) P. Pudupatti Village
1) Nañcai
During the rainy season paddy cultivation was highly dominant in 1988, which covered more than 80%
of the total area. The rest of the area was occupied by millets and there was no fallow land in 1988.
After that, however, paddy cultivation declined continuously and especially sharply since 2003. Some
of the areas under paddy were converted to fibers, millets and others, but more than 60% of land
remained fallow in 2008, even in the rainy season. In the dry season, on the other hand, fibers (cotton)
was extensively grown in 1988, occupying more than 40% of gross area. However, it also decreased
sharply in 2008 and even though some areas under cotton were converted to oil crops and others, fallow
land increased to nearly 85% in 2008.
Fig. 12 Inter-temporal Changes in Crop Choice in P. Pudupatti Village
Data source: Author’s field survey (September, 2008)Note: Lines between the bar graphs illustrate the inter-temporal change of the share of the three crop
categories (Subsistence crops, Cash crops, and Fallow) presented in Figs. 9 and 10.
143
SATO T. and Periyar Ramasamy DURAIYAPPAN : The Effect of Expansion of Private Wells
2) Puñcai
A sharp decline in cultivation was also observed in puñcai land. Originally, millets, fibers and oil crops
occupied nearly 50% of the cultivable land in the rainy season. However, from 2003, these crops were
gradually abandoned and declined sharply, with land remaining fallow. The fallow land occupied 77%
and 96% of puñcai land in the rainy and dry seasons, respectively, in 2008.
To sum up, from 1998, in Saptur Village, remarkable changes in crop choice occurred. First, millets
cultivation during the dry season in nañcai shifted to fibers. Then, in 2003, sugarcane was introduced
in puñcai. In both cases, the kind of crops introduced required more water than the originally culti-
vated crops (Table 4). The timing of the introduction of new crops coincided with that of the expansion
of wells in the village (Table 2). Considering such correlations, we think it highly plausible that the
change in the cropping system in the village became possible through the introduction of new wells or
upgrading of existing wells. On the other hand, crop cultivation in P. Pudupatti Village continuously
declined. The first decline occurred in nañcai during the rainy season in 1993, which continued until
2008. This decline might correspond to the decline in water storage capacity of the tank in the village
from 1993 onward. After that, the second decline occurred in puñcai during the rainy season in 2003,
followed by the decline in nañcai during the dry season. Finally, most of the cultivable land was left
fallow. It seems that after 2003, such a decline was caused by the disappointing performance of wells
in the village, as we discussed in Chapter III.
VI Differences in Farm Income between Upper and Lower Basin13)
In the previous chapter, we illustrated the different patterns of agricultural transformation between the
upper and the lower basin, and suggested that it might be caused by differences in the performance of
wells, depending upon the geographical location within the basin. In this chapter, we investigate the
13) Estimates of household income were undertaken as follows. Income sources were divided into three: farmincome, off-farm income and non-farm income. Each income was estimated separately in the rainy season(October–December) and the dry season (January–September). For estimating farm income, data on the sizeof cropped areas, yield, and farm gate prices were obtained for each crop grown in both nañcai and puñcai. Sincewe could not estimate the cost of production, we assumed the ratio of net income to gross revenue to be 60%uniformly, regardless of crops. The value of crops consumed by farmers was included in the farm income. Off-farm income was composed of income from agricultural wage labor and animal husbandry, and the latter wascomposed of income from sales of animals (sheep and goats) and milk from cows. We assumed that three kidsare born to an adult female sheep/goat in two years, and annual increment of value per head was assumed to beRs.3,000. Therefore, income from sale of animals is estimated from the number of livestock holding multipliedby the prevailing unit price (Rs.4,500 per head). There were some farmers engaging in goat/sheep tenancy, calledpangu-varam in Tamil. In this contract, owners and tenants share 50% of income from selling sheep/goats. Inestimating income, cash money provided by owners was treated as an income of tenants.
東南アジア研究 49巻 1号
144
effect of such differences in the crop choice on farmers’ income. The estimated annual income and its
breakdown into farm income, off-farm income (income from agricultural wage labor and animal hus-
bandry) and non-farm income in the two study villages (for the 58 and 45 sample farmers in each village)
are shown in Table 6 and the details of farm income are also shown in Table 7.
The tables show that 1) the income of Saptur Village was significantly higher than that of P.
Pudupatti Village, which is mainly attributed to the large difference in farm income and; 2) farm income
both in nañcai and puñcai and both in the rainy and the dry seasons was much higher in Saptur Village.
Such a large gap in farm income was created by the difference in crop choice (Figs. 11 and 12). However,
it should be noted that the major reason why off-farm income in P. Pudupatti Village was significantly
higher than in Saptur Village lies in the fact that the invader trees called Prosopis juliflora grew dense-
ly in the fallow land and could be cut every 2–3 years for sale as charcoal or firewood. Our interview
with farmers in 2008 revealed that since the price of the wood increased 5 times during the last 5 years,
landowners with fallow land received Rs.2,000–15,000/acre (Rs.5,000–37,500/hectare) without any major
cost. This wild tree also provided the villagers with opportunities for work during the dry season. The
fact that non-farm income in P. Pudupatti Village was not larger than in Saptur Village suggests the
reluctance of farmers in the lower river basin to seek other income sources, and their being “satisfied”
with the low income.
Fig. 13 shows the relationship between the volume of well water used for irrigation and the income
from crops.14) The sample size was 22. The figure shows that 1) there was a significant positive linear
Table 6 Annual Income and Its Components in the Two Study Villages
Data source: Author’s field survey (September and December, 2008)Note: Numbers after “±” indicate standard error.
1) Off-farm activities indicate agricultural wage labor works and works related to animal husbandry.* Indicates significant difference at 5% level.** Indicates significant difference at 1% level.
14) To investigate the relationship between well irrigation and income from production of crops in the study area,in addition to the two study villages, the authors also visited five selected villages located in the same riverbasin in September 2008. Detailed data on the cropping calendar, irrigation frequency, and hours irrigated pertime both in the rainy and the dry seasons were obtained from interview surveys. Based on information anddata collected, the irrigated hours for each crop during the whole growing period were estimated. In estimatingthe actual amount of irrigation, irrigation hours were uniformly multiplied by 26.4 m3/hour, which was esti-3
mated by the authors through a direct measurement in a selected well from the study area.
145
SATO T. and Periyar Ramasamy DURAIYAPPAN : The Effect of Expansion of Private Wells
Tab
le 7
Far
m In
com
e in
the
Tw
o St
udy
Vill
ages
Vill
age
Nam
eTo
tal
Nañ
cai
Puñ
cai
Lan
dH
oldi
ng(H
a)
Sub
Tota
l(1
03R
s.)
Rai
nySe
ason
(103
Rs.
)
Dry
Seas
on(1
03R
s.)
Ann
ual
Cro
ps(1
03R
s.)
Lan
dH
oldi
ng(H
a)
Sub
Tota
l(1
03R
s.)
Rai
nySe
ason
(103
Rs.
)
Dry
Seas
on(1
03R
s.)
Ann
ual
Cro
ps(1
03R
s.)
Sapt
ur (n
=58
)66
.5±
11.1
**0.
38±
0.08
16.6
±3.
4*
11.2
±2.
34.
6±1.
1**
0.8±
0.7
1.38
±0.
2050
.0±
10.3
**26
.1±
4.2
**13
.7±
2.5
**10
.5±
6.9
P. P
udup
atti
(n=
45)
12.9
±3.
00.
81±
0.34
8.9±
2.9
5.1±
2.2
0.8±
0.3
1.5±
1.0
1.54
±0.
405.
5±1.
41.
3±4.
80
4.2±
1.4
Dat
a so
urce
: Aut
hor’
s fie
ld s
urve
y (S
epte
mbe
r an
d D
ecem
ber,
2008
)N
ote:
Num
bers
aft
er “
±”
indi
cate
sta
ndar
d er
ror.
* In
dica
tes
sign
ifica
nt d
iffer
ence
at 5%
leve
l.**
Indi
cate
s si
gnifi
cant
diff
eren
ce a
t 1%
leve
l.
東南アジア研究 49巻 1号
146
relationship between the volume of well water consumed and the income from crop cultivation, and
2) crops which require more water could produce more value-added. Note that the volume of well
water shown in the figure was much higher than the standard water requirement (See Table 4). This
might be due to the loss of water when conveyed from the well to the field because most of the irrigation
channels in the study area were not lined with concrete or other low-permeable materials. The figure
simply shows the fact that “more water creates more money.” Such economic incentives for farmers
accelerated the introduction and renovation of wells in the upper basin, as shown in Fig. 7 and Table 2.
Note here that electricity supply is essential for pumping groundwater from wells. Electricity for
agricultural purposes is highly subsidized in Tamil Nadu. A flat rate system was introduced in 1984
(Rs.125/HP/year), but later electricity for agricultural purposes became totally free and remains so
even now, except for a brief period in 2003, when a flat rate system was briefly re-introduced (Rs.250
/HP/year) [Palanisami et al. 2008]. Such highly subsidized electricity, along with the declining cost of
Fig. 13 Relationship between Volume of Well Water and Income from Crops
Data source: Author’s field survey (September, 2008)Note: Colors painted over the markers indicate the range of standard water requirement:
< 500 mm 500–1,000 mm > 1,000 mmEquation in the figure indicates the simple linear regression line.
147
SATO T. and Periyar Ramasamy DURAIYAPPAN : The Effect of Expansion of Private Wells
installation of wells, encouraged farmers to introduce or update wells.
VII Discussion
India embarked on full-scale economic liberalization in 1991, and since then, the development of the
industrial and service sectors has accelerated. Such a change in economic structure created an increased
demand for cash crops, especially among urban populations, and spurred the agricultural transformation
from food crops to cash crops in rural Tamil Nadu, including the study area. Since cash crops were
usually grown in the dry season, they required additional irrigation water. Therefore, demand for the
groundwater irrigation rapidly expanded. Several factors, including the decline in pumping machine
prices, the cost of well drilling, and the existence of highly subsidized electricity [Kajisa et al. 2007;
Palanisami et al. 2008], encouraged farmers to install private wells.
In the upper Gundar River Basin, introduction of and deepening of wells, represented by the con-
version from dug wells to dug-cum-bore wells, accelerated from the end of the 1990s. Such a rapid
expansion of wells enabled more farmers to secure groundwater, which enhanced the introduction of
cash crops. Given the positive correlation observed between the volume of well water used and income
from crop production, farmers with good access to groundwater could gain higher income than before.
However, the introduction of cash crops did not occur uniformly within the basin, but was confined to
the upper part. The crop choice in the middle and the lower basin therefore remained the same,
mainly concentrated in subsistence food crops. In the lowermost part of the basin, much of the culti-
vable land was even abandoned and left fallow. This must be due to the disappointing performance of
wells in the area. As a result, a significant gap in farm income was created between the upper and the
lower part of the same river basin.
The performance of wells is highly affected by the surface water and cropping conditions close to
the well [Palanisami and Easter 1991; Srivastrava et al. 2009]. If water is properly stored in the tanks,
sufficient groundwater recharge, not only the direct one from tank water spread areas but also from the
tank command area, can be expected [Srivastava et al. 2009]. In Saptur Village, the share of area under
paddy in nañcai did not drop below 60% during the last two decades (Fig. 11), whereas the same figure
in P. Pudupatti Village was less than 20% in 2008 (Fig. 12). Such a difference in the crop choice between
the two villages was created by the difference in tank performance, which might further result in the
varying performance of wells. Therefore, as a whole, the difference in tank performance might be the
major reason for the difference in the crop choice within the river basin.
As argued above, tanks have been functioning as an important source of groundwater recharge.
東南アジア研究 49巻 1号
148
However, the performance of tanks has been declining mainly due to their inadequate operation and
maintenance [Palanisami and Easter 1991; Palanisami and Balasubramanian 1998; Sakthivadivel et al.
2004; Sivasubramaniyan 2006]. The expansion of wells was regarded as one of the biggest reasons for
its decline, because once farmers secured well water, they began to lose their interest and motivation
for getting involved in tank management [Janakarajan 2003]. In recent years, a variety of efforts have
been undertaken by the State Government of Tamil Nadu to improve the performance of tanks, but they
were not always effective. Restoring the physical condition of tanks through rehabilitation is indispens-
able, but equally crucial is finding ways to keep the rehabilitated tanks in good condition [Sakthivadivel
et al. 2004]. In this sense, to seek an appropriate institutional framework for promoting people’s par-
ticipation in tank management would be a more important issue for mitigating the income gap found
within the river basin.
VIII Conclusion
In this article, we investigated the effects of the expansion of private wells on rural livelihood (income)
in a tank-intensive watershed in the upper Gundar Basin in southern Tamil Nadu, focusing mainly on
the effects of wells on crop choice. Due to the high density of tanks in the study area, subsistence food
crops such as paddy, millets and pulses were planted at least until the mid-1990s in the entire basin,
including the two study villages. After the late-1990s, however, the construction/installation of wells
accelerated, especially in the upper part of the basin. This enabled farmers to shift their crop choice
from subsistence food crops to cash crops, because the latter requires more water. However, such a
shift in crop choice did not occur in the lower part of the basin, which can be attributed to the disap-
pointing performance of wells in the area. Because of the disappointing performance, farmers did not
dare to try to install/update their wells. Finally, such a difference in the expansion of wells resulted in
a significant income gap within the same river basin. For rural development in disadvantaged areas
such as the lower part of the basin, various governmental support such as the National Rural Employ-
ment Guarantee Act (NREGA) may be essential.
Acknowledgements
This article is one of the outcomes of the JSPS Global COE Program (E-04): “In Search of Sustainable Humanosphere in Asia and Africa,” and is financially supported by the Grant-in-Aid for Scientific Research Kiban C, No. 19580379: “Impact Assessment of Tank Modernization Project on Agricultural Water Use and Livelihood of the Farmers in Tamil Nadu, India.” The authors acknowledge useful comments from and discussions with the referees, Prof. Koichi Fujita, Prof. Yasuyuki Kono, Prof. Kuppanan Palanisami, Dr. Muniandi Jegadeesan, and other post-doctoral colleagues
149
SATO T. and Periyar Ramasamy DURAIYAPPAN : The Effect of Expansion of Private Wells
who participated in the Tuesday Seminar in the Center for Southeast Asian Studies, Kyoto University. We also grate-rfully thank to Mr. S. Subburaj for his kind support and assistance during our field survey.
References
Allen, R. G.; Pereira, L. S.; Raes, D.; and Smith, M. 1998. Crop Evapotranspiration: Guideline for Computing CropWater Requirements. FAO Irrigation and Drainage Paper 56. Rome: FAO.
Esho, H. 2008. Ririku shita Indo Keizai: Kaihatsu no Kiseki to Tenbo [Indian Economy has Taken Off: Track andProspects of Development]. (in Japanese) Kyoto: Minerva Shobo.
Ford Foundation and Anna University. 2001. Participatory Rehabilitation and Management in Sowdarapatti Tank.Chennai: Anna University.
Fujita, K. 2011. Introduction: Socio-Economic Dynamics in Tank-Irrigated Rural Area in Contemporary Tamil Nadu,India. Southeast Asian Studies 49 (1): 3–21.
Government of Tamil Nadu (GOTN). Various issues. Season and Crop Report of Tamil Nadu. Department of Eco-nomics and Statistics, Tamil Nadu, Chennai.―. 2004. Directory of Wholesale Agricultural Produce Assembling Markets in India. Ministry of Agricul-
ture.―. 2006a. Statistical Handbook of Tamil Nadu 2006. Department of Economics and Statistics. Tamil
Nadu.―. 2006b. Statistical Handbook of Sedapatti Block 2004–05. Department of Economics and Statistics, Madurai
District.―. 2006c. Sedapatti Block “G-Return” Data 2005–06. (Unpublished) Department of Economics and Statis-
tics, Madurai District.―. 2006d. Statistical Handbook of Tirumangalam Block 2004–05. Department of Economics and Statistics,
Madurai District.―. 2006e. Tirumangalam Block “G-Return” Data 2005–06. (Unpublished) Department of Economics and
Statistics, Madurai District.―. 2006f. Statistical Handbook of Kallikudi Block 2004–05. Department of Economics and Statistics, Madurai
District.―. 2006g. Kallikudi Block “G-Return” Data 2005–06. (Unpublished) Department of Economics and Statistics,
Madurai District.―. 2006h. Statistical Handbook of Kariapatti Block 2004–05. Department of Economics and Statistics,
Virudhunagar District.―. 2006i. Kariapatti Block “G-Return” Data 2005–06. (Unpublished) Department of Economics and Statistics,
Madurai District.―. 2007a. District Groundwater Brochure, Madurai District. Central Ground Water Board, Ministry of
Water Resources.―. 2007b. District Groundwater Brochure, Virudhunagar District. Central Ground Water Board, Ministry of
Water Resources.―. 2008a. Environmental Status of Gundar Including Kottakudiar (Uthirakosamangaiar) and Vembar Basin.
In Micro Level Environmental Status Report, edited by Public Works Department (PWD) of Tamil Nadu Govern-ment.―. 2008b. Fourth Census of Minor Irrigation Schemes (Saptur). Public Works Department (PWD) of Tamil
Nadu Government.―. 2009a. Water Resources Atlas of Madurai District, Sedapatti Block. District Rural Development Agency,
Madurai.―. 2009b. Water Resources Atlas of Madurai District, Tirumangalam Block. District Rural Development
Agency, Madurai.―. 2010. IAMWARM Project [Online]. Available at http://www.iamwarm.gov.in/brief-project.asp (verified
October 12, 2010).Gowtham, B.; and Lawrence, J. F. 2010. Identification of Groundwater Flow Direction Using Tritium Analysis of
東南アジア研究 49巻 1号
150
Lower Gundar Basin, Southern Tamil Nadu, India. In Recent Trends in Water Research: Hydrochemical andHydrological Perspectives, edited by S. Chidambaram, Al. Ramanathan, K. Shivanna, and J. R. Arthur, pp. 51–57.
Janakarajan, S. 1993. Economic and Social Implications of Groundwater Irrigation: Some Evidence from South India. Indian Journal of Agricultural Economy 48: 65–75.―. 2003. Need to Modernize the Tradition: Changing Role of Tanks in Response to Scarcity and Variability
(draft version). In Proceedings of the Conference on Market Development of Water and Water Technologies through Environmental Economics, 30th–31st October 2003, Delhi.
Kajisa, K.; and Palanichamy, N. V. 2006. Income Dynamics in Tamil Nadu, India from 1971 to 2003: Changing Rolesof Land and Human Capital. Agricultural Economics 35: 437–448.
Kajisa, K.; Palanisami, K.;and Sakurai, T. 2007. Effects on Poverty and Equity of the Decline in Collective TankIrrigation Management in Tamil Nadu, India. Agricultural Economics 36: 347–362.
Ludden, D. 1979. Patronage and Irrigation in Tamil Nadu: A Long-Term View. Indian Economic and Social HistoryReview 16 (3): 347–365.
Mahendra Dev, S.; Ravi, C.; Viswanathan, V.; Gulati, A.; and Ramachander, S. 2004. Economic Liberalisation, TargetedProgrammes and Household Food Security: A Case Study of India. MTID Discussion Paper No. 68. Washington,D.C.: International Food Policy Research Institute.
Palanisami, K. 2000. Tank Irrigation: Revival for the Prosperity. New Delhi: Asian Publication Services.Palanisami, K.; and Balasubramanian, R. 1998. Common Property and Private Prosperity: Tanks vs. Private Wells
in Tamil Nadu. Indian Journal of Agricultural Economy 53: 600–613.Palanisami, K.; and Easter, K. W. 1991. Hydro-Economic Interaction between Tank Storage and Groundwater
Recharge. Indian Journal of Agricultural Economy 46: 174–179.Palanisami, K.; Jegadeesan, M.; Fujita, K.; and Kono, Y. 2008. Impact of Tank Modernization Programme on Tank
Performance in Tamil Nadu State, India. Kyoto Working Papers on Area Studies No. 5 (G-COE series No. 3),Center for Southeast Asian Studies, Kyoto University.
Palanisami, K.; Vidhyavathi, A.; and Ranganathan, C. R. 2008. Wells for Welfare or “Illfare”? Cost of GroundwaterDepletion in Coimbatore, Tamil Nadu, India. Water Policy 10: 391–407.
PSS Borewell Services. 2010. Website of PSS Borewell Services [Online]. Available at http://www.pssborewell.com/ (verified October 27, 2010).
Sakthivadivel, R.; Gomathinayagam, P.; and Shah, T. 2004. Rejuvenating Irrigation Tanks through Local Institution.Economic and Political Weekly 39(31): 3155–3164.
Shah, A. 2000. Watershed Programmes: A Long Way to Go. Economic and Political Weekly 35(35): 3521–3526.Sivasubramaniyan, K. 2006. Sustainable Development of Small Water Bodies in Tamil Nadu. Economic and Political
Weekly 41(26): 2854–2863.Sivasubramaniyan, K.; and Vaidyanathan, A. 2001. Tanks of Periyar Vaigai Basin. In Tanks of South India, edited by
A.Vaidyanathan. New Delhi: Centre for Science and Environment.Srivastava, R. C.; Kannan, K.; Mohanty S.; Nanda, P.; Sahoo, N.; Mohanty, R. K.; and Das, M. 2009. Rainwater
Management for Smallholder Irrigation and Its Impact on Crop Yields in Eastern India. Water Resour. Manage23: 1237–1255.
Vaidyanathan, A. 2006. Restructing Watershed Development Programmes. Economic and Political Weekly 41(27):2984–2987.
Appendix: Type of Wells
The definition of various types of wells is as follows (PSS Borewell Services [2010]; Fig. 8).1. Dug well: A dug well is constructed by digging the soil or blasting the underground rock.2. Bore well: A bore well is a well of 4 1/2’’ to 12’’ in diameter drilled into the earth for retrieving water. It is
cased in the region of loose subsoil strata and opened in hard rock or in crystalline rock. High grade PVCpipes are used for casing in bore wells. The depth of a bore well can vary from 150 feet to 1,500 feet.
3. Dug-cum-bore well: A dug-cum-bore well is constructed by inserting a pipe from the bottom of a dug wellvertically (sometimes horizontally) deeper underground to lift up groundwater either by an electric motoror a diesel engine.