In this study, the effect of using fly ash in high strength lightweight aggregate concrete produced with expanded clay aggregate on physical and mechanical properties of the concrete was investigated. For this purpose, lightweight concrete mixtures with 350, 400 and 450 kg/m3 cement content were prepared using expanded clay aggregate. Besides, concretes with 0, 10, 20 and 30% fly ash replacement were produced out of the mixtures with different cement contents. Concrete density, porosity, ultrasonic pulse velocity, compressive and split tensile strength experiments were performed on the prepared samples. As a result, it was seen that it is possible to produce high strength lightweight concrete using expanded clay aggregate; the cement content with 450 kg/m3 among concrete mixtures had the highest strength values; mechanical properties of concrete could be enhanced by using 10% fly ash; thus a saving in cement amount could be achieved. Key words: Expanded clay aggregate, lightweight concrete, fly ash, strength, density.
INTRODUCTION In concrete construction, the concrete represents a very large proportion of the total load on the structure, and there are clearly considerable advantages in reducing its density. One of the ways to reduce the weight of a struc-ture is the use of lightweight aggregate concrete (LWAC) (Mouli and Khelafi, 2008).
In recent years, more attention has been paid to the development of lightweight aggregate concrete (Lo et al., 2007). The specific gravity of concrete can be lowered either by using porous, therefore lightweight aggregates instead of ordinary ones, or introducing air into the mor-tar, or removing the fine fractions of aggregate and com-pacting concrete only partially. In all cases, the main goal is to introduce voids into the aggregate and the mortar or between mortar and aggregate. A combination of these methods can also be made in order to reduce further the weight of concrete. The use of lightweight aggregates is by far the simplest and most commonly used method of making a lightweight concrete (Gündüz and U�ur, 2005).
The use of lightweight aggregate in concrete has many advantages. These include: (a) Reduction of dead load that may result in reduced footings sizes and lighter and smaller upper structure.
This may result in reduction in cement quantity and possible reduction in reinforcement. (b) Lighter and smaller pre-cast elements needing small-ler and less expensive handling and transporting equip-ment. (c) Reductions in the sizes of columns and slab and beam dimensions that result in larger space availability. (d) High thermal insulation. (e) Enhanced fire resistance (Kayali, 2007; ACI 213, 2003). LWAC is manufactured by using different kinds of light-weight aggregates, available in nature or artificially pro-duced, so that the properties of LWAC depend on the properties of the particular lightweight aggregate being used (Pioro, 2004). Natural lightweight aggregate sources can be found in regions characterized by vol-canic activity, where porous rocks (known as pumices) are available. Artificial lightweight aggregates (like the ex-panded clay obtained by thermal treatment of argilla-ceous materials) are produced in many countries, the raw materials being very common. They may exhibit higher resistance than natural lightweight aggregates, but this favorable result implies a greater production cost
276 Sci. Res. Essays
Figure 1. ECA (4 - 8 mm) used in this study.
(Cavaleri et al., 2008).
Clays has formed a mass full of with gas bubbles when it is heated and called “expanded clay”. It has the highest compressive strength among lightweight building ma-terials. They express volume increase during heating pro-cess. They produced granules when heating process reached between 1000 - 1300°C and contain homo-geneous, secret and little gaps called porous ceramic has sintered hard shell structures (Gündüz et al., 2006).
The most important characteristics of expanded clay are being a light material, having a high compressive strength and providing heat isolation. Earthquake da-mage effects have direct relation with building weights. Earthquake risks can be decreased with lightening build-ings static load. Earthquakes destructive damages can be diminished using lighter building materials (Gündüz et al., 2006; Suba�ı and Kap, 2009).
The use of mineral admixtures in concrete such as fly ash, silica fume, natural pozzolan, metakaolin and cal-cined clay has become widespread due to their pozzo-lanic reaction and environmental friendliness (Erdogan, 1997; Mehta, 1986; Neville, 2003). These pozzolanic admixtures are used for reducing the cement content in mortar and concrete production (Gleize and Cyr, 2007; Sabir et al., 2001). Also, the use of pozzolanic materials such as silica fume and fly ash are necessary for pro-ducing high performance concrete. These materials, when used as mineral admixtures in high performance concrete, can improve both the strength and durability properties of the concrete (Poon et al., 2006; Parande et al., 2008).
In this study, the effects of using fly ash in lightweight concrete produced by using expanded clay aggregate and having various cement contents (350, 400 and 450 kg/m3) on physical and mechanical properties of concrete were investigated .
EXPERIMENTAL DETAILS Materials Raw materials used in this study are composed of ordinary Portland cement, 0 - 2 mm natural sand (NS), 0 - 2, 2 - 4 and 4 - 8 mm Expanded Clay Aggregate (ECA), class F Fly Ash (FA), Super Plasticizer (SP) and water. The cement used was TS EN Type I normal Portland cement (NPC), having a 28 day compressive strength of 42.5 N/mm2 (MPa). Specific gravity of the cement was 3.15 g/cm3. Initial and final setting times of the cement were 2 and 3 h, respectively. Its Blaine specific surface area was 3172 cm2/g. The fly ash (FA) used was obtained from the Orhaneli Thermal Power Station in Turkey. It is class F fly ash. Its specific gravity was 2.70 g/cm3 and Blaine-specific surface area was 2970 cm2/g. Physical, chemical and mechanical properties of the cement and the FA were given in Table 1.
The ECA used in this study was supplied by Germany Liapor Company. The natural sand was obtained from Duzce Melen River in Turkey. The ECA which was used as aggregate in the concrete was shown in Figure 1. Physical properties of the natural sand and the ECA were listed in Table 2. Mix proportions and preparation of samples For preparing the mix design, three different reference concrete batches having 350, 400 and 450 kg/m3 (Set-I, II, III) cement content were designed. Then three different FA contents which are 10, 20 and 30% by weight of the cement content were used for preparing the other concrete batches. Totally 12 different batches of the concrete specimen were prepared. Mix designs of all of the concrete batches were shown in Table 3. In order to maintain the desired workability, the chemical admixture having water-reducing and plasticizer properties, with a density of 1.2 kg/lt, pH of 7.5 and which does not contain chloride, was used 1.2% by weight of the total cementitious material. Water/cement (W/C) ratio was taken as 0.45 in concrete mixtures.
Aggregates were used in the concrete mixtures after they were brought to saturated surface dry condition. Cube samples with dimensions of 150 x 150 x 150 mm were cast from fresh concrete mixtures. The complete compaction of the samples was obtained by means of vibration. All the test specimens were demoulded at 1 day and then cured under constant temperature and relative humidity conditions of 22 ± 1°C. Concrete density test Hardened concrete density test was performed on 150 x 150 x 150 mm cube samples in accordance with the principles indicated in the standard TS EN 12390-7 after they had been cured in water for 28 days. Tests were performed on a total of 48 samples, that is, 4 samples from each 12 different concrete mixtures. Porosity test Porosity test was performed on cube samples of 150 x 150 x 150 mm, cured in water for 28 days, in accordance with the principles indicated in ASTM C138 standard. “Equation 1” given below was employed in calculating the porosity. Tests were performed on a total of 48 samples, that is, 4 samples from each 12 different con-crete mixture.
100.0 DCAC
B−−= (1)
Suba�ı 277
Table 1. Physical and mechanical properties of the cement and the fly ash.
Cement Flay ash Chemical composition (%) Chemical composition (%)
SiO2 20.32 SiO2 48.53 Al2O3 5.59 AL2O3 24.61 Fe2O3 3.09 Fe2O3 7.59 CaO 62.50 S+A+F 80.73 MgO 1.74 CaO 9.48 SO3 3.29 MgO 2.28 Na2O 0.34 SO3 2.48 K2O 0.91 K2O 2.51 Loss on ignition 1.18 Na2O Unknown 0.31 Loss on ignition 1.69 CaO 0.93 Cl- 0.005 Physical properties Free CaO 0.11 Initial Setting Time, (h/m.) 01:58 Reactive SiO2 34.06 Final Setting Time, (h/m.) 02:57 Reactive CaO 7.58 Specific Gravity (g/cm³) 3.15 Specific Surface (cm²/g) 3172 Mechanical properties [compressive strength (MPa)] 2nd Day 30.8 7th Day 39.5 28th Day 56.0
Table 2. Physical properties of ECA and natural sand.
Figure 2. Cross-sections and photomicrographs of expanded clay aggregate which is used in this study. (a) Partial cross-section; (b) Micrograph of interior; (c) Surface texture.
Figure 3. Cross-section and photomicrographs of ECAC A: Interior of ECA, B: Sintered shell, C: Cement paste, N: Natural sand.
In the equation, B0 = Porosity ratio, % C = Weight of saturated surface dry after boiling, g A = Weight of oven dry, g D = Weight of in the water, g Ultrasonic pulse velocity tests Ultrasonic pulse velocity tests were performed on cube samples of 150 x 150 x 150 mm after the 28th day. Measurements were made on two different surfaces for each sample and ultrasonic pulse velocity values were determined using the average values of measurements. Test was performed on a total of 48 samples, that is, 4 samples from each 12 different concrete mixture and on oven-dry samples in accordance with the principles indicated in standard ASTM C597 - 97. Compressive and split tensile strength tests Prepared concrete specimens were cured in water during 28 days. And then the specimens were removed from the cure tank and dried in room condition to determine the compressive and the split tensile strength. For each concrete batches 6 cube specimens
having 150 x 150 x 150 mm dimensions were prepared for compressive strength and split tensile strength tests. Three cubes were used for compressive strength test; another three cubes were used for split tensile strength test in accordance with the TS EN 12390 - 3 and TS EN 12390 - 6 standards respectively. RESULTS AND DISCUSSION Descriptive statistics, Analysis of Variance (ANOVA), and the Turkey multiple comparisons tests were performed based on the experimental studies in this paper to evaluate the test results statistically. Besides, ECA used in high strength lightweight aggregate concrete produc-tion and the produced expanded clay aggregate concrete (ECAC) were examined using optic microscope. Interior structure and surface texture of ECA are seen in Figure 2 and the image of the cross section of the concretes produced is shown in Figure 3.
Partial cross section and sintered aggregate shell of ECA, porous interior structure of ECA, and surface texture of ECA can be seen in Figure 2a, b and c respec-
Suba�ı 279
Figure 4. Means of density values.
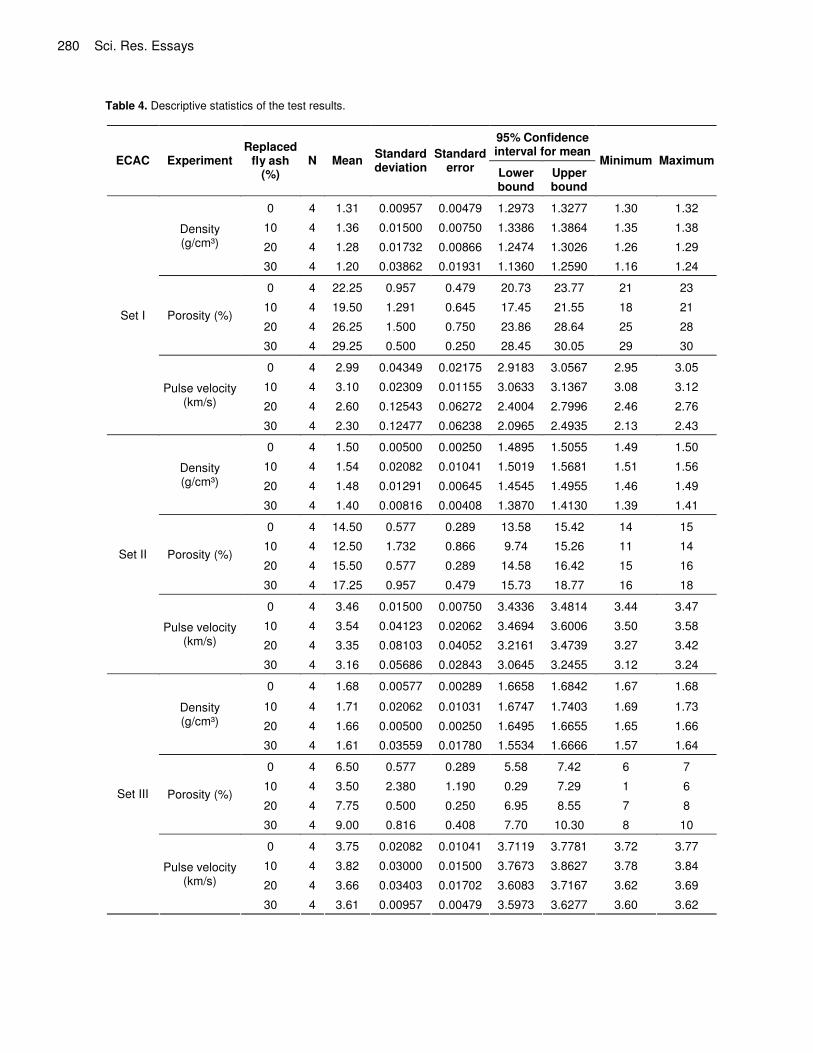
tively. Accordingly, ECA has a generally smooth surface and a porous interior structure. Interior structure of ECA (A), sintered shell (B), cement paste (C) and natural sand (N) are shown in the Figure 3. It is seen in Figure 3 that there is a strong bonding between cement paste and ECA interfacial transition zone in the cross section taken from ECACs produced. Physical properties of ECAC Descriptive statistics of the test results which were density, porosity and pulse velocity were summarized in Table 4 for each cement content (350, 400 and 450 kg/m3) respectively. As a result of the analysis of variance performed between the fly ash replacement amounts in each test type, significant differences were found between the groups (p � 0.05). In other words, test results changed significantly depending on the amount of fly ash replaced. Turkey Multiple Comparison test was performed in order to determine among which types of concrete the difference lays. The Turkey multiple comparison tests were demonstrated in Table 5.
The density values of the ECACs produced vary between 1.20 and 1.71 g/cm3 (Figure 4). It was found that Set I concretes with 30% FA replacement had the lowest density values and Set III concretes with 10% FA replacement had the highest density values ones. For all concrete batches, it is seen that concretes with 10% FA replacement have the highest density values while the concretes with 30% FA replacement have the lowest. For all the batches, the densities decrease in the
concretes with 20 and 30% FA replacement. As the cement content in concrete mixtures increase, so do the density values. According to the result of multiple comparison test performed between FA replacement amounts in terms of density values in each concrete batch (Table 5), it was seen that:
For all concrete batches, the density values of concretes with 0 and 20% FA replacement were identical but density values of other concretes were different from each other, (i) For all concrete batches, concretes with 10% FA replacement had the highest density values while those with 30% FA replacement had the lowest. (ii) For Set I, II and III concretes, densities of concretes with 10% FA replacement increased by 3, 2.5 and 2% respectively, relative to the reference concrete. (iii) Densities of concretes with 30% FA replacement decreased by 10, 7 and 4% respectively. (iv) Density values of concretes with 10% FA replacement were more than that of concretes with 30% FA replacement by the rates of 13, 9 and 6% respectively. Porosity values of ECACs vary between 3.5 and 29% (Figure 5). It was found that Set-III 10% FA replacement concretes had the lowest porosity value while Set-I 30% FA replacement concretes had the highest. It is seen that for all concrete batches, 10% FA replacement concretes have the lowest porosity values while 30% FA replace-ment concretes have the highest one. For all batches, porosities of concretes with 20 and 30% FA replacement
280 Sci. Res. Essays
Table 4. Descriptive statistics of the test results.
10 4 - - 3.82 - increase. The cement content increases in concrete mix-tures, but the porosity values decreases. According to the
result of the multiple comparison test performed between FA replacement values in terms of porosity values in
282 Sci. Res. Essays
Figure 5. Means of porosity values.
Figure 6. Means of ultrasonic pulse velocity values. each concrete batch (Table 5), it was seen that : (i) For Set-I concrete, all groups were different from each other. (ii) For Set-II concretes, 10 and 30% FA replacement concretes were different from each other and other concretes were identical in terms of porosity values. (iii) For Set-III concretes, 10% FA replacement concretes were different from other concretes. (iv) 0, 20 and 30% FA replacement concretes were not
different from each other. (v) For Set-I,II and III concretes, porosity values of con-cretes with an FA replacement ratio of 10% decreased by a ratio of 13, 14 and 46% respectively, relative to re-ference concrete. (vi) Porosity values of concretes with an FA replacement ratio of 30% increased by a ratio of 31, 18 and 38% respectively.
Ultrasonic pulse velocity values range between 2.3 and 3.82 km/s (Figure 6). It was found that the lowest pulse velocity value was of 30% FA replacement concretes of Set-I and the highest pulse velocity value was of 10% FA replacement concretes of Set-III. For all concrete batch-es, it is seen that concretes with FA replacement ratio of 10% have the highest pulse velocity values while concretes with FA replacement ratio of 30% have the lowest ones. It was observed that there was an increase in pulse velocity values in parallel to the increase in cement content in concrete mixtures. According to the result of multiple comparison test performed between FA replacement amounts in terms of pulse velocity values in each concrete batch, it was seen that (Table 5): (i) For Set-I concrete, concretes with 0 and 10% FA replacement were identical to each other and different from the others. (ii) For Set-II concretes, concretes with 10 and 30% FA replacement were different from each other and other concretes were identical. (iii) For Set-III concretes, concretes with 20 and 30% FA replacement were identical to each other and different
Suba�ı 283
Table 6. The results of regression analysis.
Parameter Estimates Dependent variable R- Square
b0 b1 b2 b3 b4 b5
Density (g/cm³) 0.979 -0.028 -0.003 0.004 -2.667×10⁻⁴ 1.875×10⁻⁵ 8.75×10⁻⁷
Figure 7. The relation graphic of among fly ash, cement content and density.
Figure 8. The relation graphic of among fly ash, cement content and porosity.
from other concretes. (iv) For Set-I,II and III concretes, pulse velocity values of concretes with an FA replacement ratio of 10% increased by a ratio of 4, 2.5 and 2% respectively, relative to refe-rence concrete. (v) Pulse velocity values of concretes with FA replace-ment ratio of 30% decreased by a ratio of 24, 9 and 5% respectively.
The relationship between the cement content and fly ash amounts were investigated in terms of density, porosity and ultrasonic pulse velocity values obtained as a result of the tests. Multiple nonlinear regression ana-lysis was performed on the data. The relationship bet-ween the data is expressed by the model equation Z = b0 + b1X + b2Y + b3X
2 + b4XY + b5Y2. In the equation, X and
Y denote FA (%), cement content (kg/m3) and density (g/cm3) respectively; and Z denote porosity (%) and pulse velocity (km/s) value; and bi is the regression coeffi-cients. The model equation parameters obtained from re-gression analysis are given in Table 6. Besides, the gra-phic of relationship between cement content and FA and density is given in Figure 7; the one with the porosity is seen in Figure 8 and finally in Figure 9 the relationship with pulse velocity is shown.
When Figure 7 is examined, it is seen that density increases as cement content increases, density increases up to 10% FA replacement and density values decrease for higher FA replacements. In Figure 8, it can be seen that porosity increases as cement content decreases, porosity decreases for 10% FA usage but it increases for higher replacement values. As for Figure 9, pulse velocity values increase in parallel to increase in cement content but pulse velocity decreases for 20 and 30% FA usage. It can be understood from the graphic that in order to obtain less porous ECACs, FA shouldn't be used more than 10% and cement content should be high. Compressive and split tensile strength of ECAC Descriptive statistics of the test results which were com-pressive and split tensile strength were summarized in Table 7 for each cement content (350, 400 and 450 kg/m3) respectively. As a result of the analysis of variance performed among fly ash replacement amounts in each
284 Sci. Res. Essays
Table 7. Descriptive statistics of the test results.
30 3 2.31 0.02517 0.01453 2.2508 2.3758 2.29 2.34 test type, significant differences were found between the groups (p � 0.05). In other words, compressive and ten-sile strength values changed significantly depending on fly ash replacement amount. In order to determine among which types of concrete the difference lies. Turkey Multi-ple comparison test was performed. The Turkey multiple comparison tests were demonstrated in Table 8.
It is seen that compressive strength values of ECACs vary between 10.82 and 44.37 MPa (Figure 10). It was found that the lowest compressive strength value was of Set-I concrete with 30% FA replacement while the high-est compressive strength value was of Set-III concretes with 10% FA replacement. For all concrete batches, 10% FA replacement concretes have the highest compressive strength values while 30% FA replacement concretes
have the lowest ones. Compre-ssive strength values of 20 and 30% FA replacement concrete decrease for all batches. As the cement content in concrete mixtures increases, so do compressive strength values. According to the result of multiple comparison test performed bet-ween FA replacement values with respect to compressive strength values in each concrete batch, it was seen that (Table 8) : (i) For Set-I and II, compressive strength values of 10 and 30% FA replacement concretes were different from each other and that of 0 and 20% FA replacement concretes were identical to each other. (ii) For Set-III, all FA replacement concretes were different from each other.
Figure 9. The relation graphic of among fly ash, cement content and pulse velocity.
(iii) For all concrete batches, 10% FA replacement con-cretes had the highest compressive strength values while 30% FA replacement concretes had the lowest. (iv) For Set-I,II and III concretes, compressive strength values of 10% FA replacement concretes increased by 7, 8 and 7% respectively, relative to reference concrete. (v) Compressive strength values of 30% FA replacement concretes decreased by 31, 20 and 39% respectively. (vi) 10% FA replacement concretes had a higher com-pressive strength value than that of 30% FA replacement concretes by the rates of 35, 25 and 42% respectively.
It is seen that compressive strength values increase directly proportional to the increase in density values and inversely proportional to the increase in porosity values. In other words, ECACs with high density and low porosity have high compressive strength values. This finding is also supported by the literature (Kayali, 2007; Mouli and Khefali, 2008; Lo et al., 2007).
It is seen that split tensile strength values of ECACs vary between 1.21 and 2.94 MPa (Figure 11). It was found that the lowest split tensile strength value was of Set-I concretes with 30% FA replacement and the highest split tensile strength values was of Set-III concretes with 10% FA replacement. For all concrete batches, it is seen that 10% FA replacement concretes have the highest split tensile strength values and 30% FA replacement concretes have the lowest ones. For all batches, split tensile strength values of 20 and 30% FA replacement concretes decrease. As the cement content in concrete mixtures increase, so do the split tensile strength values. According to the result of multiple comparison test perfor-med between FA replacement amounts in terms of split
Suba�ı 285
Figure 10. Means of compressive strength values. tensile strength values in each concrete batch it is seen that (Table 8):
(i) For Set-I, 10% FA replacement concrete is different from 20 and 30% FA replacement concretes and identical to 0% FA replacement concrete. (ii) For Set-II and III, 20 and 30% FA replacement concretes are identical to each other and different from 0 and 10% FA replacement concretes. (iii) For all concrete batches, 10% FA replacement concretes have the highest split tensile strength values while 30% FA replacement concretes have the lowest. (iv) For Set-I, II and III concretes, split tensile strength values of 10% FA replacement concretes increase by a ratio of 8, 11 and 7% respectively, relative to reference concrete. (v) Split tensile strength values of 30% FA replacement concretes decrease by 22, 13 and 16% respectively, relative to reference concrete. (vi) Split tensile strength value of 10% FA replacement concretes is higher than that of concretes with 30% FA replacement by the rates of 22, 27 and 26%, respectively. It is seen that split tensile strength values increase directly proportional to the increases in compressive strength and density values and inversely proportional to the increase in porosity values.
The relationships between the cement content and fly ash amounts of compressive and split tensile strength values were determined performing multiple nonlinear regression analysis. The relationship between the data is expressed by the model equation Z = b0 + b1X + b2Y + b3X
2 + b4XY + b5Y2. In the equation, X and Y denote FA
(%), cement content (kg/m3) respectively; and Z denote compressive and split tensile strength (MPa) value, and bi is the regression coefficients. The model equation para-
286 Sci. Res. Essays
Table 8. The results of Turkey multiple comparison tests.
Subset for alpha = 0.05 ECAC Experiment Replaced fly ash (%) N
1 2 3 4
30 3 10.82 - - -
20 3 - 13.71 - -
0 3 - 15.60 15.60 -
Compressive strength (MPa)
10 3 - - 16.65 -
30 3 1.21 - - -
20 3 - 1.48 - -
0 3 - 1.55 1.55 -
Set I
Split tensile strength (MPa)
10 3 - - 1.68 -
30 3 17.79 - - -
20 3 - 20.80 - -
0 3 - 22.05 22.05 -
Compressive strength (MPa)
10 3 - - 23.72 -
30 3 1.78 - - -
20 3 1.88 - - -
0 3 - 2.04 - -
Set II
Split tensile strength (MPa)
10 3 - - 2.26 -
30 3 25.47 - - -
20 3 - 30.16 - -
0 3 - - 41.27 -
Compressive strength (MPa)
10 3 - - - 44.37
30 3 2.31 - - -
20 3 2.42 - - -
0 3 - 2.76 - -
Set III
Split tensile strength (MPa)
10 3 - 2.94 -
Figure 11. Means of split tensile strength values.
meters obtained from regression analysis are given in Table 9. Besides, the graphic of the relationship between cement content and FA and compressive strength is given in Figure 12. While the one with split tensile strength is seen in Figure 13.
When Figure 12 and 13 are examined, it is seen that compressive and split tensile strength increase in parallel to increase in cement content; compressive and split tensile strength values increase up to 10% FA ratio; but decrease at 20 and 30% FA usage. It can be understood from the graphics that FA should be used at a ratio of 10% and cement content should be high in order to get ECACs with high strength values.
Many researchers report that pozzolanic admixtures such as fly ash, silica fume, natural pozzolan, metakaolin and calcined clay are used for reducing the cement con-tent in mortar and concrete production (Gleize and Cyr, 2007; Sabir et al., 2001). Poon et al. (2006) and Parande et al. (2008) indicated that the use of pozzolanic
Figure 12. The relation graphic of among fly ash, cement content and compressive strength.
materials such as silica fume and fly ash are necessary for producing high performance concrete. These mate-rials, when used as mineral admixtures in high perfor-mance concrete, can improve both the strength and dura-bility properties of the concrete. As a result of the tests performed in this study, it was found that it is possible to get lightweight aggregate concrete with high density, low porosity and high strength values by using FA at a ratio of 10% and physical and mechanical properties of ECACs could be improved by using mineral admixture. This finding is similar to ones in the literature. Conclusion In the study, in order to determine the effect of use of fly ash in expanded clay aggregated concretes on bond strength, lightweight concrete mixtures of 350, 400, 450 kg/m3 cement content and of 0, 10, 20 and 30% fly ash replacement were prepared. 15 x 15 x 15 cm cube speci-mens were prepared from the mixtures. Density, porosity, ultrasonic pulse velocity, compressive and split tensile strength tests were performed on the specimens. Also, samples taken from the concretes produced were inspec-ted under optical microscope. Statistical analysis was
Figure 13. The relation graphic of among fly ash, cement content and split tensile strength.
carried out on the obtained experimental data.
In microscopic examination a strong bonding was found between the cement paste and ECA interface of the ECACs produced. As ECA is a lighter aggregate with a higher strength when compared to other natural light-weight aggregates, it allows producing high strength light-weight concrete that can be used in structural systems of buildings. It was found that its physical and mechanical properties could be enhanced by using mineral admix-tures. When 10% FA was used in ECAC, it was deter-mined that density increased by an average ratio of 3%; porosity decreased 24%; ultrasonic pulse velocity increased 3%; compressive strength increased 8%; and split tensile strength increased 9% for the con-cretes with various cement contents. As a result of the tests per-formed on ECAC mixtures with different cement contents and FA replacement amounts, it was seen that concretes with 450 kg/m3 cement content and 10% FA replacement had the best strength values.
Also, by using FA, saving can be achieved on cement amount. By using ECA, it is possible to produce high strength lightweight aggregate concrete with a density of 1.71 g/cm3 and strength of approximately 45 MPa. ECACs usage in structural systems will make it possible
288 Sci. Res. Essays to construct buildings having lighter and smaller rein-forced concrete element sizes and being damaged less in earthquakes. REFERENCES ACI 213 R-03 (2003). Guide for Structural Lightweight-Aggregate
Concrete, American Concrete Institute Report, Reported by Committee. p. 213.
Cavaleri L, Miraglia N, Papia M (2008). Pumice concrete for structural wall panels. Engineering Structures. 25: 115-125.
Erdogan TY (1997). Admixtures for Concrete, Middle East Technical Univ. Press, Ankara, Turkey.
Gleize PJP, Cyr M, Escadeillas G (2007). Effects of metakaolin on autogenous shrinkage of cement pastes, Cement Concrete Compos. 29(2):80-87.
Gunduz L, �apcı N, Bekar M (2006). Utilization of expanded clay as lightweight aggregate, J. Clay Sci. Technol. Kibited 1(2): 43-49.
Gunduz L, U�ur I (2005). The effects of different fine and coarse pumice aggregate/cement ratios on the structural concrete properties without using any admixtures, Cement Concrete Res. 35: 1859-1864.
Kayali O (2007). Fly ash lightweight aggregates in high performance concrete, Construction and Building Materials, 22 (12): 2393-2399.
Lo TY, Tang WC, Cui HZ (2007). The effects of aggregate properties on lightweight concrete, Build. Environ. 42: 3025-3029.
Mehta PK (1986). Concrete: Structure, Properties, and Materials,
Prentice- Hall, Englewood, NJ. Mouli M, Khelafi H (2008). Performance characteristics of lightweight
Neville AM (2003). Properties of concrete, Fourth and Final Edition, Pearson Prentice Hall, England.
Parande AK, Babu BR, Karthik MA, Deepak Kumaar KK, Palaniswamy N (2008). Study on strength and corrosion performance for steel embedded in metakaolin blended concrete/mortar. Const. Build. Mater. 22(3):127-134.
Pioro a LS, Pioro IL (2004). Production of expanded-clay aggregate for lightweight concrete from non-selfbloating clays, Cement Concrete Compos. 26: 639-643.
Poon CS, Kou SC, Lam L (2006). Compressive strength, chloride diffusivity and pore structure of high performance metakaolin and silica fume concrete, Const. Build. Mater. 20(10): 858-865.
Sabir BB, Wild S, Bai J (2001). Metakaolin and calcined clays as pozzolans for concrete: a review, Cement Concrete Compos. 2001; 23(6):441-454.
Suba�ı S, Kap T (2009). The Effects of Use of Expanded Clay Aggregate Concrete on Structural Behavıour and Basıc Structure Cost, Technological Applied Sciences, e-Journal of New World Sciences Academy 4 (1): 48-54.