53
The Elderly Population in Maryland Data from the 2000 Census and Projections MACo Summer Conference, August 14 th , 2003 Maryland Department of Planning
| Date post: | 31-Dec-2015 |
| Category: |
Documents |
| Upload: | marny-cook |
| View: | 51 times |
| Download: | 1 times |

The Elderly Population in Maryland
Data from the 2000 Census
and Projections
MACo Summer Conference, August 14th, 2003
Maryland Department of Planning

Elderly Population in Maryland
• Elderly Population Totals & Shares by County
• Socioeconomic Characteristics from the 2000 Census
• Projections

Percent of Population Ages 65+ in 2000
12.4%11.3%
0%
3%
6%
8%
11%
14%
U.S. Maryland(Ranked 41st)
Prepared by the Maryland Department of Planning, from U.S. Census Data

12.9%
13.2%
13.5%
14.2%
14.2%
14.6%
14.9%
17.7%
17.9%
19.3%
20.1%
20.4%
0% 5% 10% 15% 20% 25%
Queen Anne's
Baltimore city
Caroline
Somerset
Washington
Baltimore Co
Garrett
Dorchester
Allegany
Kent
Worcester
Talbot
Percent Age 65+ by Jurisdiction – 2000
Prepared by the Maryland Department of Planning, from U.S. Census data

7.5%
7.7%
7.8%
8.9%
9.1%
9.6%
10.0%
10.1%
10.5%
10.8%
11.2%
12.8%
0% 5% 10% 15% 20% 25%
Howard
Prince George's
Charles
Calvert
St. Mary's
Frederick
Anne Arundel
Harford
Cecil
Carroll
Montgomery
Wicomico
Percent Age 65+ by Jurisdiction – 2000
Prepared by the Maryland Department of Planning, from U.S. Census data
continued
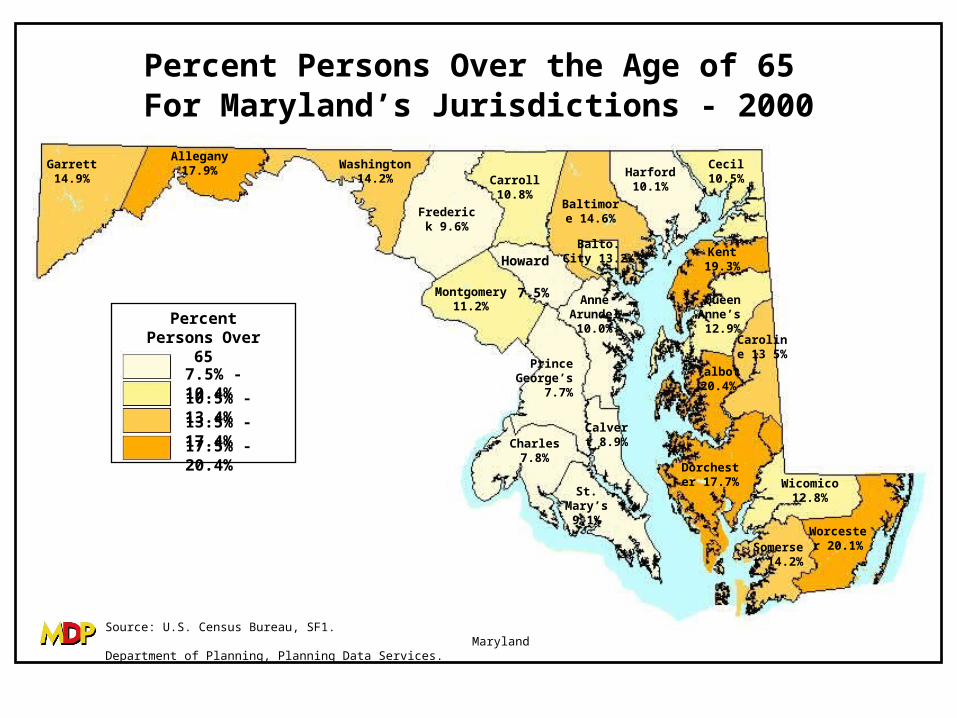
Percent Persons Over the Age of 65 For Maryland’s Jurisdictions - 2000
Garrett 14.9%
Allegany 17.9% Washington
14.2%
Frederick 9.6%
Carroll 10.8%
Baltimore 14.6%
Montgomery 11.2%
Harford 10.1%
Cecil 10.5%
Charles 7.8%
Prince George’s
7.7%
St. Mary’s 9.1%
Howard 7.5%
Anne Arundel 10.0%
Kent 19.3%
Balto. City 13.2%
Talbot 20.4%
Calvert 8.9%
Dorchester 17.7%
Caroline 13 5%
Queen Anne’s 12.9%
Wicomico 12.8%
Somerset 14.2%
Worcester 20.1%
Source: U.S. Census Bureau, SF1. Maryland Department of Planning, Planning Data Services.
Percent Persons Over 65
7.5% - 10.4%
17.5% - 20.4%
10.5% - 13.4%
13.5% - 17.4%
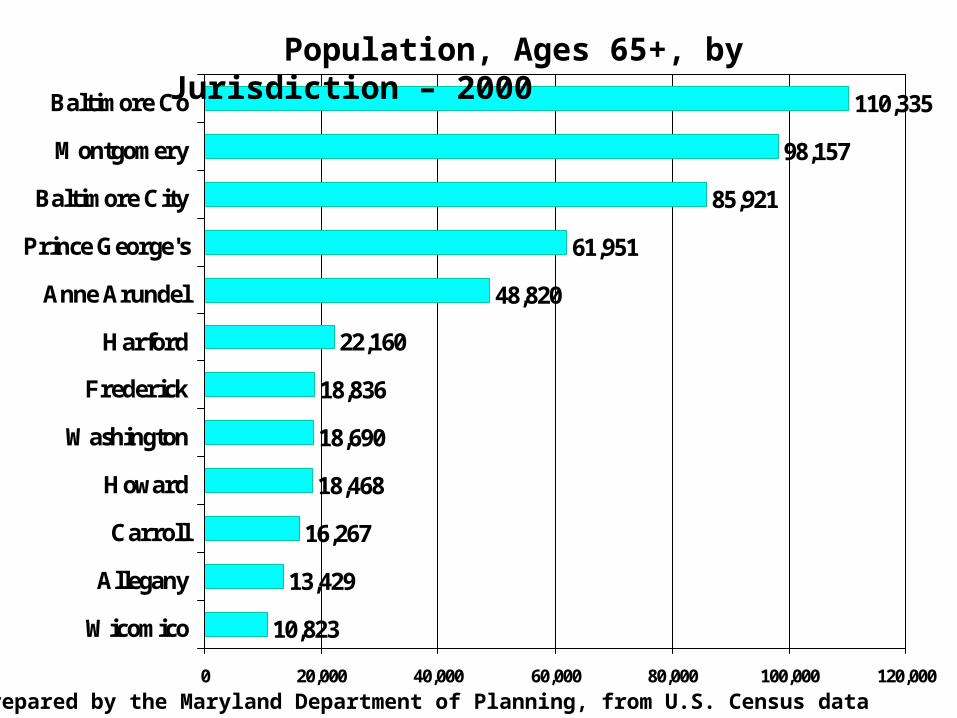
10,823
13,429
16,267
18,468
18,690
18,836
22,160
48,820
61,951
85,921
98,157
110,335
0 20,000 40,000 60,000 80,000 100,000 120,000
Wicomico
Allegany
Carroll
Howard
Washington
Frederick
Harford
Anne Arundel
Prince George's
Baltimore City
Montgomery
Baltimore Co
Population, Ages 65+, by Jurisdiction – 2000
Prepared by the Maryland Department of Planning, from U.S. Census data

3,503
3,708
4,031
4,461
5,227
5,423
6,627
6,897
7,825
8,995
9,351
9,402
0 20,000 40,000 60,000 80,000 100,000 120,000
Somerset
Kent
Caroline
Garrett
Queen Anne's
Dorchester
Calvert
Talbot
St. Mary's
Cecil
Worcester
Charles
Population, Ages 65+, by Jurisdiction – 2000
Prepared by the Maryland Department of Planning, from U.S. Census data
continued

1,899
2,045
2,829
3,287
3,710
4,627
7,069
7,126
11,255
11,608
13,486
20,666
0 5,000 10,000 15,000 20,000 25,000
Washington
Calvert
Charles
Worcester
Carroll
Frederick
Howard
Harford
Anne Arundel
Prince George's
Baltimore Co
Montgomery
Change in Population Ages 65+ by Jurisdiction – 1990 - 2000
Prepared by the Maryland Department of Planning, from U.S. Census data

-14,995
-451
-1
141
197
594
689
769
856
1,264
1,525
1,630
-20,000 -15,000 -10,000 -5,000 0 5,000 10,000 15,000 20,000 25,000
Baltimore City
Allegany
Somerset
Caroline
Dorchester
Garrett
Kent
Talbot
Queen Anne's
Wicomico
St. Mary's
Cecil
Change in Population Ages 65+ by Jurisdiction – 1990 - 2000
Prepared by the Maryland Department of Planning, from U.S. Census data
continued

17.8%
18.0%
18.0%
19.5%
21.7%
23.6%
28.5%
34.8%
45.0%
50.8%
0% 10% 20% 30% 40% 50% 60%
Montgomery
Anne Arundel
Washington
Harford
Baltimore Co
Talbot
Worcester
Garrett
Dorchester
Kent
Elderly Change as a Pct of Total Pop Change, 1990 - 2000
Prepared by the Maryland Department of Planning, from U.S. Census data

0.0%
5.2%
8.8%
10.3%
11.2%
11.7%
12.3%
13.0%
13.5%
14.6%
0% 10% 20% 30% 40% 50% 60%
Somerset
Caroline
Calvert
Frederick
Cecil
Howard
Wicomico
Queen Anne's
Carroll
Charles
Elderly Change as a Pct of Total Pop Change, 1990 - 2000
Prepared by the Maryland Department of Planning, from U.S. Census data
continued

Characteristics of the Elderly
• Median Household Income & Poverty
• Percent of Income Spent on Housing
• Vehicle Availability
• Ability to Speak English
• Disability Status

Median Household Income (1999)by Age of Household Head - Maryland
$27,015
$48,851
$61,027
$68,364
$60,585
$38,607
$27,246
0
10,000
20,000
30,000
40,000
50,000
60,000
70,000
< 25 25-34 35-44 45-54 55-64 65-74 75+
Prepared by the Maryland Department of Planning, from U.S. Census Data

Poverty Rates in 1999 by Age Group in Maryland
8.5% 8.5%7.4%
10.0%
11.7%10.7%
0%
2%
4%
6%
8%
10%
12%
Total 65+ 65-74 75+ <5 < 18
Prepared by the Maryland Department of Planning, from U.S. Census Data

7.9%
8.5%
8.6%
8.8%
8.9%
9.5%
9.5%
12.3%
13.9%
14.2%
18.0%
19.1%
0% 5% 10% 15% 20% 25%
Talbot
Kent
Charles
Wicomico
St. Mary's
Washington
Allegany
Caroline
Garrett
Dorchester
Baltimore city
Somerset
Percent Age 65+ in Poverty by Jurisdiction – 1999
Prepared by the Maryland Department of Planning, from U.S. Census data

4.9%
5.7%
5.8%
5.9%
6.0%
6.4%
6.5%
6.7%
6.9%
6.9%
7.3%
7.7%
0% 5% 10% 15% 20% 25%
Carroll
Calvert
Anne Arundel
Montgomery
Frederick
Worcester
Baltimore Co
Harford
Prince George's
Howard
Queen Anne's
Cecil
Percent Age 65+ in Poverty by Jurisdiction – 1999
Prepared by the Maryland Department of Planning, from U.S. Census data
continued

2.7%
3.1%
3.2%
3.2%
3.4%
4.9%
7.1%
8.5%
9.2%
9.6%
10.9%
13.1%
-4% -2% 0% 2% 4% 6% 8% 10% 12% 14%
Prince George's
Caroline
Talbot
Garrett
Washington
Dorchester
Wicomico
Allegany
Kent
Somerset
Worcester
Baltimore city
Pct Pt Diff Between Child Poverty & Elderly Poverty – 1999
Prepared by the Maryland Department of Planning, from U.S. Census data
Child poverty > elderly poverty

-2.8%
-1.6%
-0.8%
-0.6%
-0.5%
-0.3%
0.0%
0.3%
0.4%
0.9%
1.2%
1.8%
-4% -2% 0% 2% 4% 6% 8% 10% 12% 14%
Howard
Charles
Frederick
Carroll
Harford
Calvert
St. Mary's
Montgomery
Queen Anne's
Anne Arundel
Baltimore Co
Cecil
Pct Pt Diff Between Child Poverty & Elderly Poverty – 1999
Prepared by the Maryland Department of Planning, from U.S. Census data
Child poverty > elderly poverty
Elderly poverty > child poverty
continued

Characteristics of the Elderly
• Median Household Income & Poverty
• Percent of Income Spent on Housing
• Vehicle Availability
• Ability to Speak English
• Disability Status

Pct of Homeowners in 2000, by age of Household Head, Who Pay More Than 30% of Income for
Housing in Maryland
40.9%
27.8%24.9%
20.7% 21.1% 21.4% 22.0%
0%
5%
10%
15%
20%
25%
30%
35%
40%
45%
< 25 25-34 35-44 45-54 55-64 65-74 75+
Prepared by the Maryland Department of Planning, from U.S. Census Data

Pct of Renters in 2000, by age of Household Head, Who Pay More Than 30% of Income for Housing
in Maryland
48.9%
31.6% 32.7% 31.8%
38.6%
48.5%
55.9%
0%
10%
20%
30%
40%
50%
60%
< 25 25-34 35-44 45-54 55-64 65-74 75+
Prepared by the Maryland Department of Planning, from U.S. Census Data
Characteristics of the Elderly
• Median Household Income & Poverty
• Percent of Income Spent on Housing
• Vehicle Availability
• Ability to Speak English
• Disability Status

Pct of Households in 2000, by age of Household Head, with No Vehicle Available in Maryland
19.4%
9.7% 8.5% 7.6%9.0%
13.6%
27.5%
0%
5%
10%
15%
20%
25%
30%
< 25 25-34 35-44 45-54 55-64 65-74 75+
Prepared by the Maryland Department of Planning, from U.S. Census Data
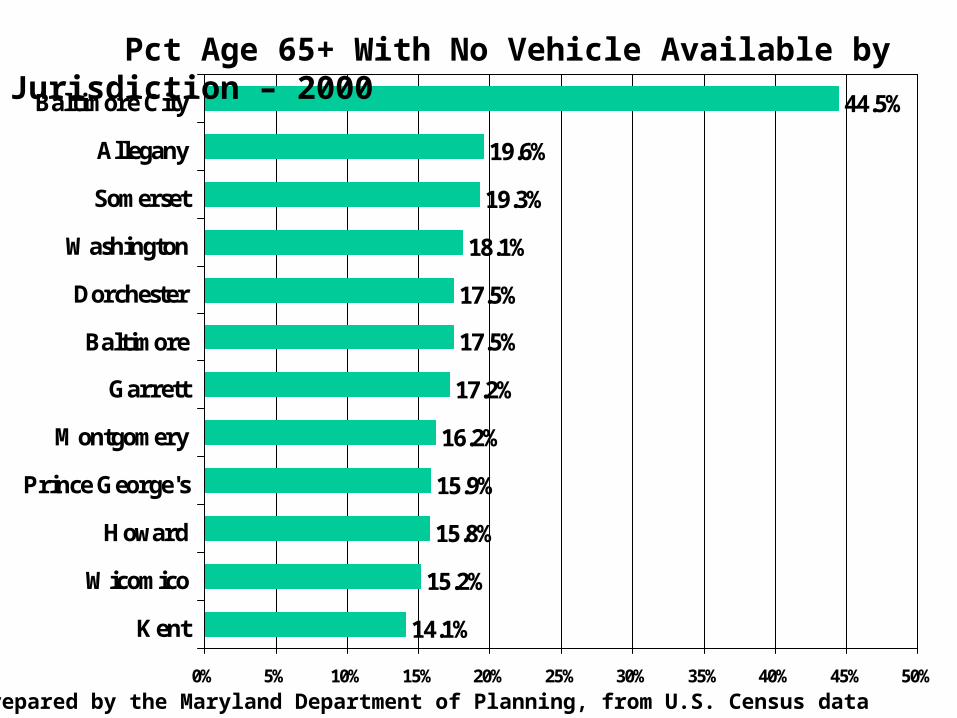
14.1%
15.2%
15.8%
15.9%
16.2%
17.2%
17.5%
17.5%
18.1%
19.3%
19.6%
44.5%
0% 5% 10% 15% 20% 25% 30% 35% 40% 45% 50%
Kent
Wicomico
Howard
Prince George's
Montgomery
Garrett
Baltimore
Dorchester
Washington
Somerset
Allegany
Baltimore City
Pct Age 65+ With No Vehicle Available by Jurisdiction – 2000
Prepared by the Maryland Department of Planning, from U.S. Census data

9.1%
9.6%
11.2%
11.7%
11.7%
11.7%
11.8%
12.2%
12.7%
13.0%
13.1%
14.1%
0% 5% 10% 15% 20% 25% 30% 35% 40% 45%
Queen Anne's
Calvert
Worcester
Talbot
Caroline
Carroll
St. Mary's
Anne Arundel
Charles
Harford
Frederick
Cecil
Pct Age 65+ With No Vehicle Available by Jurisdiction – 2000
Prepared by the Maryland Department of Planning, from U.S. Census data
continued

Characteristics of the Elderly
• Median Household Income & Poverty
• Percent of Income Spent on Housing
• Vehicle Availability
• Ability to Speak English
• Disability Status
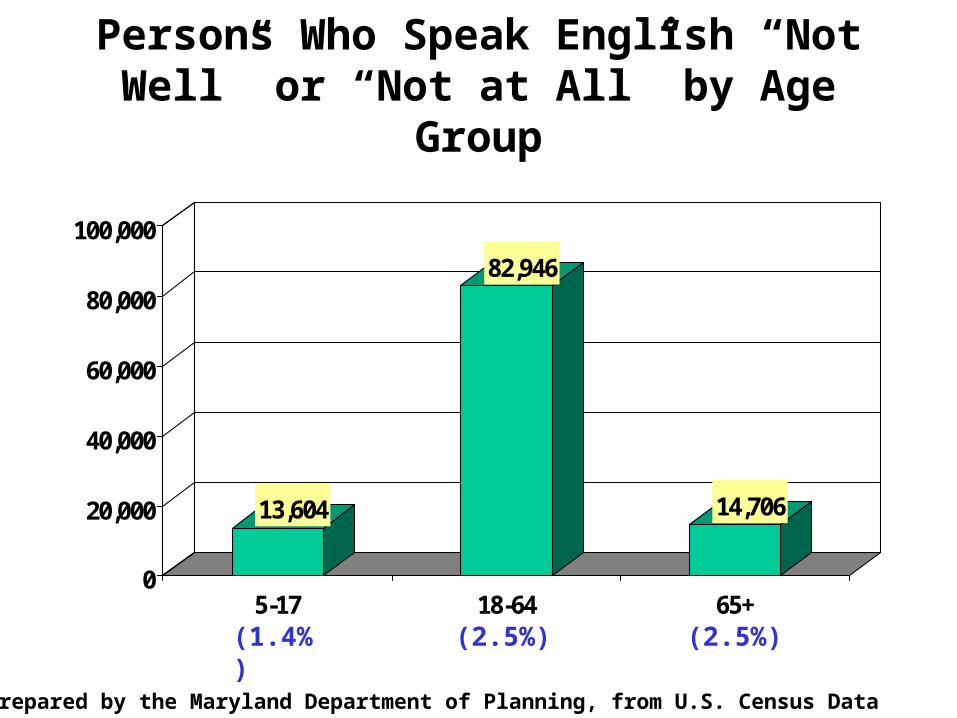
Persons Who Speak English “Not Well” or “Not at All” by Age Group
13,604
82,946
14,706
0
20,000
40,000
60,000
80,000
100,000
5-17 18-64 65+
(1.4%) (2.5%) (2.5%)
Prepared by the Maryland Department of Planning, from U.S. Census Data

Persons Ages 65+ Who Speak English “Not Well or “Not at All”
1,334
668
1,597
1,942
2,244
6,921
0 2,000 4,000 6,000 8,000 10,000
Remainder
Howard
Baltimore City
Prince George's
Baltimore
Montgomery
Prepared by the Maryland Department of Planning, from U.S. Census Data
Characteristics of the Elderly
• Median Household Income & Poverty
• Percent of Income Spent on Housing
• Vehicle Availability
• Ability to Speak English
• Disability Status
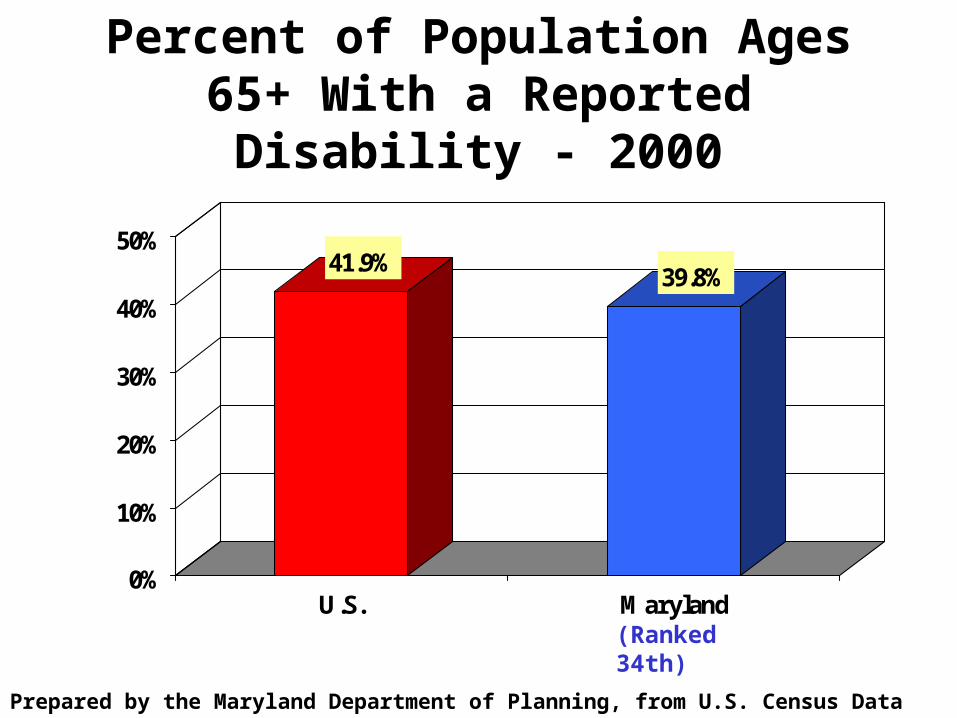
Percent of Population Ages 65+ With a Reported Disability - 2000
41.9%39.8%
0%
10%
20%
30%
40%
50%
U.S. Maryland(Ranked 34th)
Prepared by the Maryland Department of Planning, from U.S. Census Data
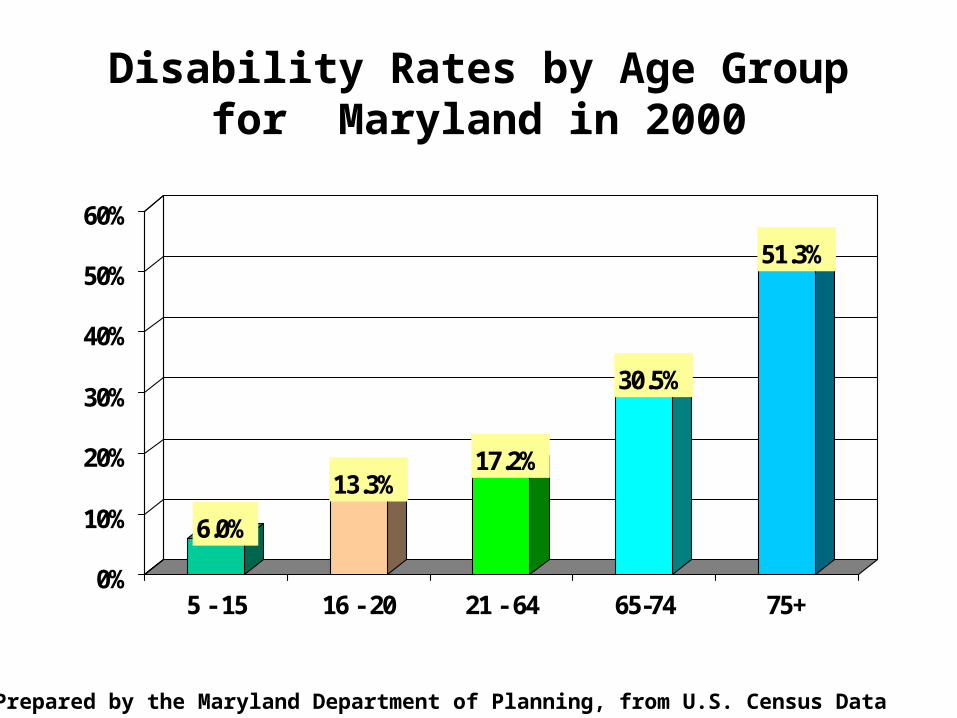
Disability Rates by Age Group for Maryland in 2000
6.0%
13.3%17.2%
30.5%
51.3%
0%
10%
20%
30%
40%
50%
60%
5 - 15 16 - 20 21 - 64 65-74 75+
Prepared by the Maryland Department of Planning, from U.S. Census Data

Type of Disabilities Reported in Maryland for Population Ages 65+ in 2000
71,858
153,499
0
50,000
100,000
150,000
200,000
Sensory Physical
Prepared by the Maryland Department of Planning, from U.S. Census Data

Disabilities Reported in Maryland by Activity Category in 2000 for Population Ages 65+
52,021
57,568
116,401
0 50,000 100,000 150,000
Self-care
Mental
Go-outside-home
Prepared by the Maryland Department of Planning, from U.S. Census Data

4,093
5,370
6,089
6,521
6,531
7,562
8,544
17,914
23,846
30,541
40,666
42,156
0 5,000 10,000 15,000 20,000 25,000 30,000 35,000 40,000 45,000
Wicomico
Allegany
Carroll
Howard
Frederick
Washington
Harford
Anne Arundel
Prince George's
Montgomery
Baltimore
Baltimore City
Population Age 65+ With Disabilities by Jurisdiction – 2000
Prepared by the Maryland Department of Planning, from U.S. Census data

1,316
1,562
1,644
1,679
1,836
2,158
2,281
2,358
2,716
3,306
3,373
3,833
0 5,000 10,000 15,000 20,000 25,000 30,000 35,000 40,000 45,000
Kent
Somerset
Caroline
Queen Anne's
Garrett
Dorchester
Calvert
Talbot
St. Mary's
Cecil
Worcester
Charles
Population Age 65+ With Disabilities by Jurisdiction – 2000
Prepared by the Maryland Department of Planning, from U.S. Census data
continued

39.6%
39.7%
40.0%
40.5%
41.0%
42.5%
42.5%
43.1%
43.1%
44.5%
47.2%
51.2%
0% 10% 20% 30% 40% 50% 60%
Harford
Carroll
Prince George's
Wicomico
Dorchester
Allegany
Charles
Washington
Caroline
Garrett
Somerset
Baltimore City
Percent Age 65+ With Disabilities by Jurisdiction – 2000
Prepared by the Maryland Department of Planning, from U.S. Census data

32.7%
33.5%
35.7%
36.1%
37.1%
37.2%
37.3%
37.5%
38.0%
38.1%
38.2%
39.1%
0% 10% 20% 30% 40% 50% 60%
Montgomery
Queen Anne's
Talbot
Calvert
Frederick
Worcester
Howard
St. Mary's
Anne Arundel
Baltimore
Kent
Cecil
Percent Age 65+ With Disabilities by Jurisdiction – 2000
Prepared by the Maryland Department of Planning, from U.S. Census data
continued

Characteristics of the Elderly
• Median Household Income & Poverty
• Percent of Income Spent on Housing
• Vehicle Availability
• Ability to Speak English
• Disability Status
Elderly Population Projections for Maryland
• Total Elderly Population
• Elderly Share of Total Population
• Implications - Disability
• Dependent Populations

Population, Ages 65 +, in Maryland,
Actual and Projected
599.3 649.3732.8
870.8
1,022.2
1,184.1
1,328.5
0
200
400
600
800
1,000
1,200
1,400
Tho
usan
ds
2000 2005 2010 2015 2020 2025 2030
Source: The U.S. Census Bureau and the Maryland Department of Planning, Planning Data Services

Change in Maryland Population,
Ages 65 +
84,963
133,544
289,285306,372
0
50,000
100,000
150,000
200,000
250,000
300,000
350,000
1990-2000 2000-2010 2010-2020 2020-2030
Source: The U.S. Census Bureau and the Maryland Department of Planning, Planning Data Services

Projected Population Gain in Maryland, 2000–2030(Ages 0-64 and 65 +)
336.4
729.2
0
200
400
600
800
Th
ousa
nd
s
0 - 64 65+
Source: The Maryland Department of Planning, Planning Data Services

Historical and Projected Population, Ages 65+ for Maryland
10.8% 11.3%12.8%
16.7%
20.9%
0%
5%
10%
15%
20%
25%
1990 2000 2010 2020 2030
Source: The U.S. Census Bureau and the Maryland Department of Planning, October 2002
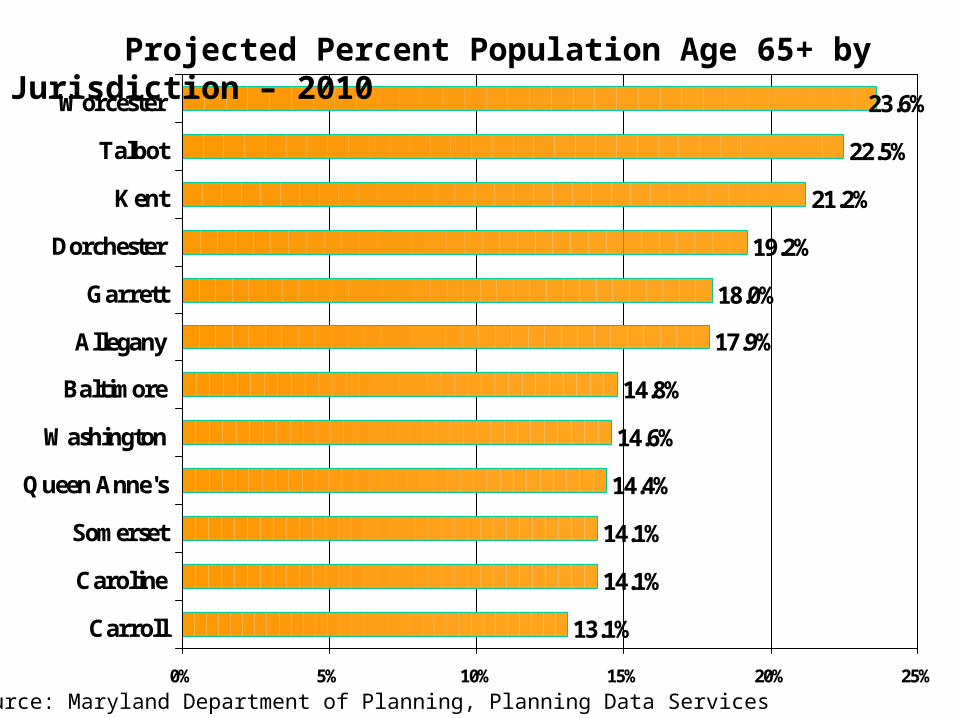
13.1%
14.1%
14.1%
14.4%
14.6%
14.8%
17.9%
18.0%
19.2%
21.2%
22.5%
23.6%
0% 5% 10% 15% 20% 25%
Carroll
Caroline
Somerset
Queen Anne's
Washington
Baltimore
Allegany
Garrett
Dorchester
Kent
Talbot
Worcester
Projected Percent Population Age 65+ by Jurisdiction – 2010
Source: Maryland Department of Planning, Planning Data Services

9.9%
10.5%
10.8%
10.8%
11.2%
11.4%
11.6%
12.6%
12.8%
12.9%
13.0%
13.0%
0% 5% 10% 15% 20% 25%
Prince George's
Howard
Frederick
Charles
Calvert
Cecil
St. Mary's
Baltimore City
Wicomico
Anne Arundel
Harford
Montgomery
Projected Percent Population Age 65+ by Jurisdiction – 2010
Source: Maryland Department of Planning, Planning Data Services
continued
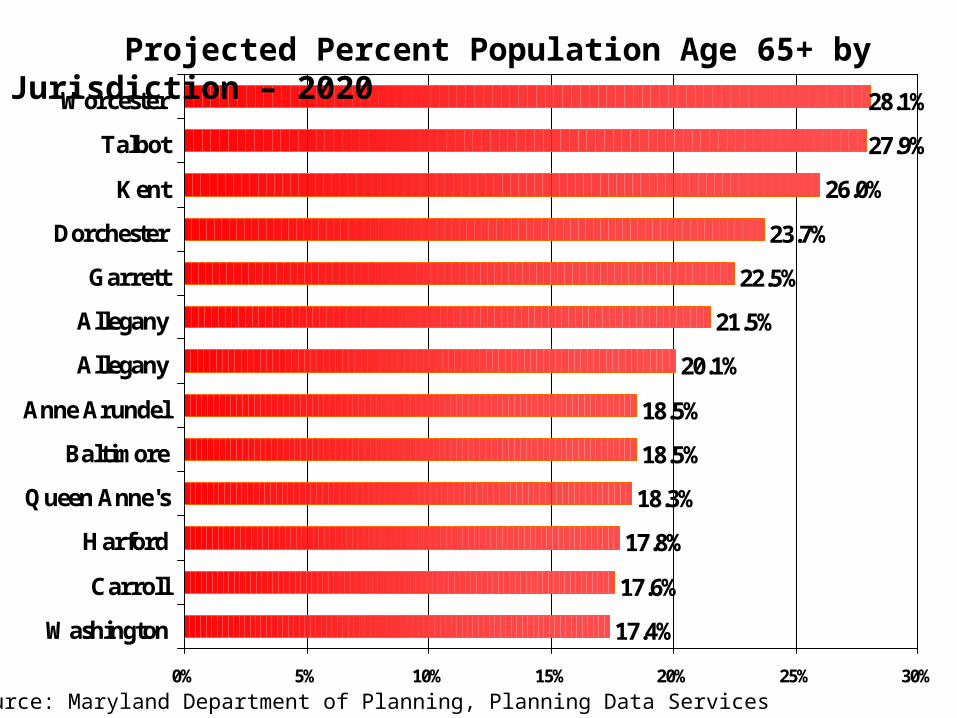
17.4%
17.6%
17.8%
18.3%
18.5%
18.5%
20.1%
21.5%
22.5%
23.7%
26.0%
27.9%
28.1%
0% 5% 10% 15% 20% 25% 30%
Washington
Carroll
Harford
Queen Anne's
Baltimore
Anne Arundel
Allegany
Allegany
Garrett
Dorchester
Kent
Talbot
Worcester
Projected Percent Population Age 65+ by Jurisdiction – 2020
Source: Maryland Department of Planning, Planning Data Services

13.7%
14.4%
14.8%
14.9%
15.1%
15.3%
15.6%
15.7%
16.7%
17.2%
17.3%
17.4%
17.4%
0% 5% 10% 15% 20% 25% 30%
Prince George's
Frederick
Charles
Baltimore City
Cecil
Howard
Wicomico
St. Mary's
Calvert
Somerset
Montgomery
Caroline
Washington
Projected Percent Population Age 65+ by Jurisdiction – 2020
Source: Maryland Department of Planning, Planning Data Services
continued

22.3%
22.5%
22.6%
23.3%
23.3%
24.0%
24.0%
27.9%
29.5%
32.2%
32.8%
33.3%
0% 5% 10% 15% 20% 25% 30% 35%
Baltimore
Allegany
Carroll
Calvert
Harford
Queen Anne's
Anne Arundel
Garrett
Dorchester
Kent
Worcester
Talbot
Projected Percent Population Age 65+ by Jurisdiction – 2030
Source: Maryland Department of Planning, Planning Data Services

17.5%
17.7%
18.2%
18.3%
19.0%
19.2%
20.2%
20.8%
21.2%
21.4%
21.6%
21.6%
0% 5% 10% 15% 20% 25% 30% 35%
Baltimore City
Prince George's
Wicomico
Frederick
Cecil
Charles
Howard
Somerset
Washington
St. Mary's
Montgomery
Caroline
Projected Percent Population Age 65+ by Jurisdiction – 2030
Source: Maryland Department of Planning, Planning Data Services
continued

Actual and Projected Number of People Ages 65 + with Disabilities
227.9275.3
376.8
500.2
0
100
200
300
400
500
600
Tho
usan
ds
2000 2010 2020 2030
Source: U.S. Census Bureau and the Maryland Department of Planning

Dependency Ratios for Maryland *
10
20
30
40
50
60
70
1990 2000 2010 2020 2030
Total Youth Elderly
•Pop < 16/pop16-64 x100 = youth dependency ratio
•Pop 65+/pop16-64x100 = elderly dependency ratioSource: Maryland Department of Planning, Planning Data Services

Maryland State Data CenterMaryland State Data Center
Website:
www.mdp.state.md.us/msdc
Mark Goldstein
410-767-4454


