The emergence, progress, and impact of sound change in progress in Seoul Korean: implications for mechanisms of tonogenesis Hye-Young Bang ∗1 , Morgan Sonderegger 1,2 , Yoonjung Kang 3,4 , Meghan Clayards 1,2 , and Tae-Jin Yoon 5 1 Department of Linguistics, McGill University, Canada 2 Centre for Research on Brain, Language, and Music, McGill University, Canada 3 Centre for French and Linguistics, University of Toronto Scarborough, Canada 4 Department of Linguistics, University of Toronto, Canada 5 Department of English Language and Literature, Sungshin Women’s University, Korea Abstract This study examines the origin, progression, and impact of a sound change in Seoul Korean where the primary cue to a stop contrast in phrase-initial position is shifting from VOT to f0. Because it shares similarities with the initial phase of tonogenesis, investigating this “quasi-tonogenetic” sound change provides insight into the nature of the emergence of contrastive f0 in “tonogenetic” sound changes more generally. Using a dataset from a large apparent-time corpus of Seoul Korean, we built mixed-e↵ects regression models of VOT and f0 to examine the time-course of change, focusing on word frequency and vowel height e↵ects. We found that both VOT contrast reduction and f0 contrast enhancement are more advanced in high-frequency words and in stops before non-high vowels, indicating that the change is spreading across words and phonetic contexts in parallel. Furthermore, speakers suppress non-contrastive variation in f0 as f0 emerges as a primary cue. Our findings suggest that one impetus for tonogenetic change is production bias coupled with an adaptive link between the cues. We further discuss the role of Korean intonational phonology on f0 which may help explain why the phonetic precondition leads to change in Seoul Korean but not in other languages. Key Words— Tonogenesis, Transphonologization, Vowel intrinsic f0, Word frequency, Cue tradeo↵, Sound change, Korean 1 Introduction Tonogenesis (Matiso↵, 1973) is a linguistic process whereby redundant pitch patterns be- come phonologized and contrastive over time. It is a common type of sound change, and has occurred across many genetically unrelated languages (Hombert, Ohala & Ewan, 1979; Kingston, 2011). Tonogenesis has its origins in various phonetic sources (Kingston, 2011) ∗ Correspondence address: 1085 Dr. Penfield, Room 111, Montreal, Quebec, H3A1A7; Tel.: 1 514-398-4222; Fax: 1 514-398-7088; E-mail address: [email protected]1
Transcript
The emergence, progress, and impact of sound change in
progress in Seoul Korean: implications for mechanisms of
tonogenesis
Hye-Young Bang∗1, Morgan Sonderegger1,2, Yoonjung Kang3,4, Meghan Clayards1,2, and Tae-Jin Yoon5
1Department of Linguistics, McGill University, Canada
2Centre for Research on Brain, Language, and Music, McGill University, Canada
3Centre for French and Linguistics, University of Toronto Scarborough, Canada
4Department of Linguistics, University of Toronto, Canada
5Department of English Language and Literature, Sungshin Women’s University, Korea
Abstract
This study examines the origin, progression, and impact of a sound change in Seoul
Korean where the primary cue to a stop contrast in phrase-initial position is shifting from
VOT to f0. Because it shares similarities with the initial phase of tonogenesis, investigating
this “quasi-tonogenetic” sound change provides insight into the nature of the emergence of
contrastive f0 in “tonogenetic” sound changes more generally. Using a dataset from a large
apparent-time corpus of Seoul Korean, we built mixed-e↵ects regression models of VOT
and f0 to examine the time-course of change, focusing on word frequency and vowel height
e↵ects. We found that both VOT contrast reduction and f0 contrast enhancement are more
advanced in high-frequency words and in stops before non-high vowels, indicating that the
change is spreading across words and phonetic contexts in parallel. Furthermore, speakers
suppress non-contrastive variation in f0 as f0 emerges as a primary cue. Our findings suggest
that one impetus for tonogenetic change is production bias coupled with an adaptive link
between the cues. We further discuss the role of Korean intonational phonology on f0 which
may help explain why the phonetic precondition leads to change in Seoul Korean but not in
other languages.
Key Words— Tonogenesis, Transphonologization, Vowel intrinsic f0, Word frequency,
Cue tradeo↵, Sound change, Korean
1 Introduction
Tonogenesis (Matiso↵, 1973) is a linguistic process whereby redundant pitch patterns be-
come phonologized and contrastive over time. It is a common type of sound change, and
has occurred across many genetically unrelated languages (Hombert, Ohala & Ewan, 1979;
Kingston, 2011). Tonogenesis has its origins in various phonetic sources (Kingston, 2011)
For example, Kirby (2014) examines production and perception for an ongoing sound
change in Phnom Penh Khmer, where /r/ in consonant clusters in onset position is being
replaced by other acoustic cues associated with the following vowel (e.g. breathiness, f0
contour). The origin of the sound change is argued to lie in perceptual reanalysis of colloquial
speech variants. Coetzee et al. (2014) examine an emergent tonogenetic sound change in
Afrikaans, which traditionally contrasted prevoiced and voiceless unaspirated stop series in
word initial position. However, in present-day Afrikaans VOT is similar for the two stop
series, which now di↵er primarily in f0. The focus of this body of work is, however, limited
to either the precondition or origin of change at the language level or its spread at the
community level.
Building on this existing literature, the current study focuses on Seoul Korean as a case
study for understanding the broader pathway of a sound change which bears similarities
to cases of tonogenesis, using a large corpus dataset. We address how this sound change
originates, progresses, and impacts other aspects of the linguistic system. Seoul Korean
provides a rich empirical foundation for understanding tonogenetic sound changes, for several
reasons. First, a sound change is currently in progress whereby the primary cue to the
aspirated/lax stop distinction in phrase-initial position is shifting from VOT to f0 over
time. (Korean has a three-way aspirated/lax/tense stop contrast, discussed below.) We
call this ongoing change quasi-tonogenesis because the change does not to date exhibit all
features of tonogenesis, where lexical tonal contrast develops from consonant-induced f0
distinction. The change a↵ects only sounds at the left edge of the accentual phrase (AP)
and higher prosodic domains, conditioned by Korean intonational phonology (Jun, 1996,
1998, 2005) (see Section 5.4). Hence, in present day Seoul Korean, for speakers where
this change has occurred, high/low tone di↵erentiates the meaning of relevant lexical items
only in phrase-initial position. For example, the minimal pair [phal] ‘arm’ vs. [pal] ‘foot’
(where [p] is used for a lax stop) is realized approximately as [pal] vs. [pal] phrase-initially,
while the same words are distinguished by the traditional consonantal cues in phrase-medial
position.1 Despite the fact that f0 cannot be used to mark arbitrary syllables as H/L in
Seoul Korean, we make reference to the tonogenesis literature because we believe our results
have implications for a better understanding of tonogenesis. The change in Seoul Korean
1IPA symbols indicate approximate phonetic realizations, based on previous literature on this sound changediscussed below. The use of [pal] in particular should not be taken to indicate total absence of aspiration.
2
essentially exhibits the same type of transphonologization we find in cases of ‘tonogenesis’
reported in the literature (e.g. Khmer, Afrikaans), where f0 shifts from a redundant phonetic
property of a laryngeal contrast to a primary cue. Furthermore, there is a large phonetic
literature on laryngeal contrasts in Seoul Korean and a large apparent-time corpus (The
National Institute of the Korean Language, 2005) spanning much of the time period over
which the change has occurred. For all these reasons, Seoul Korean is an ideal case study
for better understanding the pathway and mechanism of tonogenetic sound change.
Seoul Korean has a three-way laryngeal contrast of tense (or fortis), lax (or lenis),
and aspirated. When described across all speakers of di↵erent ages, the three categories
are contrasted by a combination of acoustic cues: primarily VOT and f0 on the following
vowel, and also closure duration, F1 trajectory, and breathiness (Cho, Jun & Ladefoged,
2002; Cho & Keating, 2001; Hardcastle, 1973; Kang & Guion, 2008; Lee & Jongman, 2012;
Lisker & Abramson, 1964; Park, 2002). In traditional descriptions, in phrase-initial position,
aspirated, lax, and tense stops have progressively shorter VOT, and f0 on the following
vowel is higher for aspirated and tense stops than for lax stops. The contrast between lax
and aspirated stops—which is of main interest here—was traditionally realized primarily
using VOT with f0 playing a secondary role (Han & Weitzman, 1967, 1965; Hardcastle,
1973; Kang & Han, 2013; Kim, 1965). For example, Han & Weitzman (1967) found that f0
values for all three categories overlapped significantly, and Kang & Han (2013) found that a
41-year-old speaker recorded in the 1930s realized the aspirated/lax distinction exclusively
using VOT. However, the VOT di↵erence between lax and aspirated stops reported in more
recent studies is much smaller compared to those reported for the 1930s–1960s, while the
f0 di↵erence has increased (Beckman, Li, Kong & Edwards, 2014; Silva, 2002). f0 is also
the primary perceptual cue to the lax/aspirated stop contrast in present-day Seoul Korean
These two frequency e↵ects are in line with two known mechanisms by which phoneti-
cally motivated sound changes, such as tonogenesis, can be triggered. First, the change can
originate in misparsing of the speech signal (Ogura, 2012; Ohala, 1993a; Ohala & Sprouse,
2003), which should impact low-frequency words first, because language users have rela-
tively less experience with these words, which will add more ambiguity in perceptual parsing
than for high frequency words (Bybee, 2012; Hay et al., 2015). Ohala (1981) suggests that
misperceptions occur, although rarely, when listeners fail to compensate for coarticulatory
e↵ects on segments. For the case of tonogenesis, if listeners su�ciently often misattribute
the f0 di↵erence to the vowel itself rather than to the preceding consonant (what speak-
ers intended) (Beddor, 2009; Beddor, McGowan, Boland, Coetzee & Brasher, 2013), the
speaker’s production target could shift (a ‘mini sound change’: Ohala, 1993b), which could
then spread to other individuals with whom they interact via imitation (Baker, Archangeli
& Mielke, 2011; Harrington, 2012; Stevens & Harrington, 2014), eventually leading to the
emergence of a tonal system in the language. This is consistent with the view in classic pa-
pers on tonogenesis (Hombert, 1974; Hombert et al., 1979; Hyman, 1976; Ohala, 1978) that
“phonological change is perception-oriented” (Hyman, 1976, p. 40), and listeners’ eventual
selection of novel variants is not necessarily linked to the magnitude of coarticulation. We
use the term misparsing to refer to the driving factors behind this type of change.
Second, change may originate from production variation, specifically a lenition bias tar-
geting high-frequency words. The general lenition bias in high-frequency words will cause
overall shortening of VOT in stops, and is expected to a↵ect long-lag aspirated stops dispro-
portionately more than other stops, based on cross-linguistic work on how VOT is a↵ected
in hypospeech (Kessinger & Blumstein, 1997; Miller, Green & Reeves, 1986; Pind, 1995, for
English, Icelandic, Thai). In the Korean case, this would lead to reduction of the VOT
contrast between lax and aspirated stops. Subsequently, a perceptual reinterpretation of the
speech signal by the listener may follow (Beddor, 2009; Bybee, 2012; Harrington, Kleber,
Reubold & Siddins, 2015; Lindblom et al., 1995). This account is consistent with the view
that “significant change in the phonetic pattern” (Lindblom et al., 1995, p. 16) must be
present to trigger reanalysis by listeners. We use the term production bias to refer to the
driving forces (gestural undershoot, reduction) behind this type of change.
There has been little investigation of the role of word frequency in tonogenetic sound
changes. We are aware of one experimental study which examines the degree of coda reduc-
tion in laryngealization in Vietnamese as a function of frequency and speech style (Stebbins,
2010), and argues for a relationship with an ongoing sound change. However, because di↵er-
ent speaker ages or recording years are not considered, the findings cannot be unambiguously
linked to the change.
5
Our first research question addresses how the change is spreading across words: are there
word frequency e↵ects in how the quasi-tonogenetic sound change in Seoul Korean spreads
through the lexicon, and if so, do high or low-frequency words lead the change? Any word
frequency e↵ects found in our apparent-time data would give evidence for the origin of this
change in production bias or misparsing. The patterns expected under the production bias
and misparsing scenarios are schematized in panels A and D of Figure 1.
2.3 Spread of transphonologization: words and vowel con-
texts
Once transphonologization is triggered, how does the change spread from word to word and
from context to context? During intermediate periods of a tonogenetic change, it is unlikely
that speakers will use either the ‘traditional’ (maximal VOT contrast) or ‘innovative’ (max-
imal f0 contrast) system in production. Rather, as sound change is generally phonetically
gradual, it is likely that speakers use a mixture of intermediate values of the two cues, and
that the consonantal cue is used progressively less and the vocalic cue progressively more
over time. Indeed, for Seoul Korean, Kang (2014) found continuous and parallel change in
VOT contrast loss and f0 contrast enhancement across speakers of di↵erent ages and genders.
These findings suggest there is a close, inverse relationship between the role of VOT and f0
in signaling the contrast, and that this relationship shifts over time such that f0 becomes the
dominant cue. A similar relationship between two cues was observed in pre-nasal vowels in
English by Beddor (2009), who found an inverse relationship between nasality in the vowel
and duration of the nasal consonant across contexts. Although this data is from speakers
of similar ages, the observed relationship is argued to be the precursor to the diachronic
development of nasal vowels.
There are several possible mechanisms for such inverse relationships between cues. Lis-
teners may adjust the roles of di↵erent cues to balance the total signaling requirements of
the contrast (‘cue enhancement’: Kirby, 2013), or because they perceive both cues as arising
from a single articulatory source (Beddor, 2009). Whatever the mechanism, in this study we
use the term adaptivity to refer to continouous and inverse shift in the role of VOT and f0.
What is not known is at what level the adaptivity operates—whether adaptivity would
manifest not just across speakers, but across di↵erent linguistic contexts as well. Put oth-
erwise, in words and phonetic contexts where the VOT cue is used less, is the f0 cue used
more? (One could imagine, alternatively, that the sound change is adaptive for any given
speaker, but f0 contrast enhancement is ahead in some words and VOT contrast loss is ahead
in others). We predict that if VOT contrast loss and f0 contrast enhancement are linked
by adaptivity, they should proceed in tandem, both a↵ecting the same words and phonetic
contexts.
Here we discuss possible patterns that could occur during the change and how each
pattern is diagnostic of a di↵erent underlying mechanism.
2.3.1 Predictions: Word frequency
If the sound change originates in production bias we expect to observe the pattern in Figure
1 A, where VOT contrast reduction is more advanced in high-frequency words, while if the
sound change originates in misparsing, we expect to observe the pattern in Figure 1 D, where
f0 contrast enhancement is more advanced in low-frequency words. Either pattern would
be expected if the observed di↵erences in the timecourse of change for words with di↵erent
frequencies are due to synchronically-motivated word frequency e↵ects: there would be more
6
reduction in the size of VOT contrast (caused by production bias) for higher-frequency words,
and more expansion in the size of f0 contrast (caused by misparsing) for lower-frequency
words. Either pattern (A) or (D) occurring independently or both occurring together would
be consistent with there being an adaptive link between VOT and f0 across speakers, but
not across words. This is the first of three possible scenarios:
Time
Con
trast
size
high freq.
no freq. effect
low freq.
VOT: under production bias
TimeC
ontra
st s
ize
VOT: adaptation in response to D
Time
Con
trast
size
f0: adaptation in response to A
Time
Con
trast
size
f0: under misparsing
A B
C D
Figure 1: Hypothesized e↵ects of word frequency on sound change in Seoul Korean: TheS-curves illustrate change over time in the importance of VOT (A, B) and f0 (C, D) incontrasting aspirated and lax stop series. The solid lines represent the expected patternif there were no frequency e↵ect. The dotted and dashed lines represent the expectedtrajectories for words with high and low frequency respectively, under di↵erent assumptionsabout the source of the change: production bias (A, C) or misparsing (B, D).
1. (A), (D) or (A) + (D): production bias and/or misparsing & no adaptivity
2. (A) + (C): production bias & adaptivity
3. (B) + (D): misparsing & adaptivity
In scenario 2, VOT contrast reduction in high-frequency words is a trigger of f0 contrast
enhancement. This pattern would be driven by production bias a↵ecting the VOT contrast,
as in (A), and adaptivity compensating for decreased VOT informativity by the f0 contrast
being enhanced, as in (C). In Scenario 3, it is the low-frequency words that lead both changes
(B + D), as would be expected if the change is driven by misparsing and adaptivity.
The three scenarios just outlined describe diachronic change. That is, they assume
that any observed di↵erence in the size of the VOT or f0 contrast between high- and low-
frequency words at any time point is due to one set of words being ahead of the other.
7
However, for any given time point, a synchronic source is possible. For example, decreased
VOT contrast size between high-frequency words relative to low-frequency words could be
due to known reduction e↵ects, operating on high-frequency words in a similar way across
time points. We call these two possibilities time-of-inception (i.e. diachronic) and magnitude
(i.e. synchronic) e↵ects. Across the full time-course of sound change these two possibilities
should have di↵erent trajectories, schematized in Figure 2. Panels A and C illustrate a
time-of-inception e↵ect where one of the curves is shifted forward in time, while Panels B
and D illustrate a magnitude e↵ect where one of the curves is shifted up across time points.
Crucially, for a time-of-inception e↵ect, the di↵erence in contrast size across words would
change over time.
Time
Con
trast
size
high freq.
low freq.
VOT: Timing difference
Time
Con
trast
size
VOT: Magnitude difference
Time
Con
trast
size
f0: Timing difference
Time
Con
trast
size
f0: Magnitude difference
A B
C D
Figure 2: Schematic of e↵ects of word frequency on sound change that would result fromtiming e↵ects (A, C) versus magnitude e↵ects (B, D). The solid (high frequency) and dot-ted (low frequency) lines represent the expected trajectories for words with high and lowfrequency. (A) and (C) are expected if the change is caused by production bias in VOT andan adaptive link to f0, as predicted in Scenario 2 (see text).
The patterns in (A) and (C) of Figure 2, where high-frequency words change sooner, could
be also explained by a ‘rate e↵ect’ predicted by usage-based accounts of sound change (Bell,
Brenier, Gregory, Girand & Jurafsky, 2009; Bybee, 2000; Hay et al., 2015; Pierrehumbert,
2002, 2001): high-frequency words would change at a faster rate than low-frequency words in
reduction-driven changes, and vice versa for ambiguity or analogy-driven changes (see Sec.
2.2) In the presence of a rate e↵ect, the di↵erence in contrast size across words again would
change over time.
Either a time-of-inception e↵ect or a rate e↵ect would lead to some words being ahead of
others in the middle of the sound change. Distinguishing between these two types of e↵ects
requires a broader time range than is available in our data, containing a stable time period
before the change begins. We use the term timing e↵ects to encompass time-of-inception
8
and rate e↵ects, because what is crucial for our research questions is not to di↵erentiate
between these two types of e↵ects, but to distinguish them from (synchronic) magnitude
e↵ects. Either type of timing e↵ect would indicate di↵erent progression of the change across
words, while a magnitude e↵ect would not. Any timing e↵ect is most likely to be detected
during a portion of the S-shaped curve of the change when there is large variation across
words.
2.3.2 Predictions: Vowel height
Word frequency is one way to examine propagation of a tonogenetic change through a lan-
guage’s lexicon. Another way is to examine change across phonetic contexts. We focus
on vowel height in particular because it a↵ects both VOT of the preceding stop and f0
of the vowel (both are increased in high vowel contexts compared to non-high contexts,
1995). Thus, variation in f0 can be due to physiological factors as well as muscular control
and these components can in principle work together to enhance vowel height contrasts or
consonant voicing (Hoole, Honda, Murano, Fuchs & Pape, 2006; Kingston, 1992), or against
each other to preserve or enhance tonal contrasts (Connell, 2002).
IF0 e↵ects appear to be near-universal: Whalen & Levitt (1995) found an IF0 e↵ect in
all 31 languages studied in a meta-analysis, and argue that IF0 is an automatic physiological
process. However, the size of IF0 e↵ects di↵er substantially across speakers and languages
(e.g. Van Hoof & Verhoeven, 2011). In particular, based on data from four African tone
languages and Whalen & Levitt (1995)’s survey, Connell (2002) argues that IF0 e↵ects in
tonal languages are generally smaller than in intonational languages, and concludes that IF0
e↵ects may be smaller in a language where they would obscure tonal contrasts.
These studies lead to the question of whether the emergence of contrastive f0 in tono-
genetic sound change could a↵ect non-contrastive variation in f0. While previous work has
compared across di↵erent languages, the change in progress in Korean a↵ords an interesting
opportunity to observe the relationship between the size of the IF0 e↵ect and the role of
f0 within a single language, where other variables are held constant. Because f0 variation
arises from both mechanical factors and active control (Sole, 2007), one possibility is that
speakers actively attenuate the mechanical factors in order to enhance the contrastive use of
f0 as transphonologization occurs. In this case, the size of the IF0 e↵ect would di↵er before
and after the tonogenetic sound change. IF0 e↵ects could be also a↵ected by the fact that
the direction and magnitude of the f0 change di↵ers by stop in Seoul Korean—f0 decreases
for lax stops and increases for both aspirated and tense stops, but less so for tense stops
(Kang, 2014). It has been argued that IF0 attenuation is primarily constrained by the me-
chanical status of the larynx in low tone production (Ladd & Silverman, 1984; Whalen &
Levitt, 1995). If this is correct, IF0 e↵ects may be attenuated to a greater degree for lax
stops, which have the lowest f0, than other categories. Alternatively, if IF0 e↵ects are largely
constrained by pressure to maintain tonal contrast (Hoole et al., 2006), the degree of change
in the IF0 e↵ect over time may depend on the degree of the importance of f0 for signaling
phonological contrasts of a particular stop category.
Our third research question is: does the IF0 e↵ect in Seoul Korean change as contrastive
f0 emerges, and does the magnitude of change in the IF0 e↵ect di↵er by stop?
3 Data and Methods
We address our research questions on the origin, progression, and impact of tonogenetic
sound change, using apparent-time corpus data from Seoul Korean.
10
3.1 Corpus data
The data come from The Speech Corpus of Reading-Style Standard Korean (The National
Institute of the Korean Language, 2005), henceforth the NIKL Corpus. The corpus con-
sists of recordings of 120 Seoul dialect speakers, aged 19 to 71 years old, reading essays
and children’s stories. The recordings were made in sound attenuated booths in the Seoul
metropolitan area in 2003, and each sentence was stored as an individual audio file. We
used a version of the corpus which is force-aligned at the word and segment level using the
Korean Phonetic Aligner (Yoon, 2014; Yoon & Kang, 2014). This corpus was also used by
Kang (2014), who examined a subset of 1250 tokens from 11 words, across 118 speakers,
in utterance-initial position. (Following Kang (2014), we excluded two speakers for whom
all sound files contained recording errors.) Given our focus on the spread of the sound
change across words and lexical contexts, we expanded the dataset as much as possible to
include many more words. We also considered positions besides utterance-initial, in order
to increase the amount of data per speaker and word, to maximize our statistical power
for detecting word-level e↵ects. To examine the pronunciation of di↵erent words over time,
it was important to use words pronounced by speakers from all age groups. We therefore
limited ourselves to the 11 stories (out of 19) read by speakers from all age groups.
Using the data from these 11 stories for the 118 speakers, we first extracted all words
beginning with any of the nine stops ({alveolar, bilabial, velar} ⇥ {tense, lax, aspirated}).The dataset was then constructed by restricting it by prosodic context and other factors, as
follows.
The nature of the sound change a↵ecting lax and aspirated stops crucially depends on
prosodic structure. Korean is often analyzed as having three prosodic units larger than a
Prosodic Word (PW): the Accentual Phrase (AP), Intermediate Phrase (ip), and Intonation
Phrase (IP) (Jun, 2005). Each higher-order prosodic unit consists of one or more lower
units. For example, an AP consists of one or more PW’s. The sound change in progress in
Seoul Korean is thought to a↵ect only sounds at the left edge of the AP (and thus higher
prosodic domains). Because of the di�culty of annotating AP boundaries, we limited our
investigation to IP-initial stops (Jun, 1993, 1996): all tokens in sentence-initial position, as
well as a subset of tokens in sentence-medial position, were selected as follows:
• Only stops preceded by a force-aligned pause longer than 30 ms (to lessen the possibility
of including stop closures mislabeled as pauses)—since IP’s are almost always preceded
by some pause.
• Among these stops, tokens were selected if there was a syntactic clause boundary (e.g.
after a conjunctive morpheme or a topic marker).
• In other cases where there was a force-aligned pause, the first author manually identified
IP boundaries which were cued by pitch resetting (a secondary cue for IP’s).
This subset of the data, consisting only of IP-initial stops, was then further restricted to
a subset of items, defined as a particular occurrence of a word in a sentence. Each item was
present for a di↵erent number of speakers (since speakers di↵er in whether utterance-medial
items were produced with a preceding pause). In order to address our research questions
about how the change is impacted by properties of words and phonetic contexts (i.e., items),
we selected items to give a roughly equal distribution among di↵erent values of item-level
variables (laryngeal category, place of articulation, and vowel height), and we prioritized
items which occurred for a larger number of speakers. The final dataset consisted of 6916
tokens from 81 items.
11
3.2 Dataset construction
For each token in this dataset, we measured VOT, f0, and other variables. We measured
VOT using a semi–automatic method (similar to Stuart-Smith, Sonderegger & Rathcke,
2015): automatic measurement, followed by manual correction. Automatic measurements
were obtained using the software package ‘AutoVOT’ (Keshet, Sonderegger & Knowles,
2014), which uses an algorithm trained on a small set of hand-annotated tokens to measure
VOT. For the training dataset, VOT onset was determined at the time of the burst and
VOT o↵set at the time of the first visible indication of voicing, based on the initiation of
periodicity in the waveform. The algorithm was separately trained for each of the three
laryngeal categories based on 100 manually-coded VOTs, then used to assign automatic
measurements to each stop in the full dataset. All automatic measurements were manually
checked (by the first author), and hand-adjusted if necessary based on the same criteria
applied to the training dataset.
For each token, f0 was extracted at the vowel midpoint using a Praat script (25 ms
analysis window; f0 range of 80–450 Hz; time step = 5 ms). To detect pitch tracking
errors, we examined histograms of the resulting f0 values by gender, decade of birth, and
stop category (lax, aspirated, tense); values at histogram edges were manually checked and
remeasured if necessary. Errors due to devoiced high vowels were removed (n = 67), due to
undefined f0, leaving a total of 6849 tokens in the final dataset. Summary statistics for f0
and VOT by stop category and speaker decade of birth are shown in Table 1.
The measurement of f0 varies across speakers as a function of age and gender (Titze, 1989;
Torre & Barlow, 2009): in addition to higher overall f0 for female speakers, there is a general
lowering of f0 for women and raising of f0 for men in older age (Soltani, Ashayeri, Modarresi,
Salavati & Ghomashchi, 2014; Torre & Barlow, 2009); pitch range varies as well as a function
of age and gender, as a higher mean f0 is associated with a larger pitch range. Such age
and gender-related variation must be controlled for when examining a diachronic change
in an f0 contrast (Reubold & Harrington, 2015). We do so by converting f0 to semitones,
which represent equal perceptual intervals relative to each speaker’s mean f0 (Nolan, 2003).
Each speaker’s mean f0 was estimated by averaging f0 over all vowels (n=504) in one story
(Sungnyungyi Jihye), and used to convert raw f0 values into semitones. On this logarithmic
scale, positive and negative values indicate f0 values higher and lower than a speaker’s mean.
We also used two measures of speech rate. Raw speech rate was defined as syllables
per second in a sentence. We then calculated each speaker’s mean speech rate (mean of raw
speech rate across all sentences), and the di↵erence between each token’s raw speech rate and
the speaker’s mean rate (speech rate deviation). These two measures account for two ways
speech rate might a↵ect VOT (following Stuart-Smith et al., 2015): within speakers, VOT
may be shorter for faster speech; across speakers, VOT may be shorter for faster speakers.
Finally, wordform frequency information was taken from the KAIST Concordance pro-
gram (KAIST, 1999) based on the 70 million–word KAIST Corpus (Yoon & Choi, 1999) and
log-transformed.
3.3 Statistical models
3.3.1 Variables
We model VOT and f0 as a function of a number of variables that are properties of speakers,
items, and utterances (termed speaker–level variables, etc.), indicated in small caps.
The speaker-level variables year of birth (yob) and gender are included in the models
12
Table 1: Summary statistics for VOT (ms) and f0 (Hz, before normalization) by stopcategory and speaker decade of birth: mean, standard deviation, and number of tokens (n).Number of speakers per decade is shown in parentheses.
Decade Laryngeal Stop VOT (msec) f0 (Hz) nof birth class mean SD mean SD
to account for the diachronic change and the expectation that it is led by female speakers
(Kang, 2014; Kong et al., 2011; Oh, 2011). Based on exploratory plots, as well as the
nonlinear relationship between year of birth and VOT/f0 evident in previous work (Kang,
2014), yob was coded as linear and nonlinear e↵ects. Specifically, we coded yob using a
restricted cubic spline with three knots, using rcs() in the rms package (Harrell & Frank,
2015) in R, with degrees of freedom chosen based on exploratory plots. This corresponds to
two variables for yob, called components, which are shown in Figure 3 to aid in interpreting
model results involving yob. The first component, which looks roughly like a line, we call the
‘linear’ component. The second component, which looks roughly like a quadratic function,
we call the ‘nonlinear’ component. Thus, the two components can be interpreted roughly as
the linear and quadratic terms of a polynomial, which are a common way to model nonlinear
e↵ects that “look quadratic” (e.g. as used in Zellou & Tamminga, 2014), but with the crucial
property that they grow linearly rather than quadratically at the minimum and maximum
of the range of yob, which is preferable for accurately predicting near these endpoints (see
Baayen, 2008; Harrell, 2001). Both components are included in each model below, to jointly
represent the e↵ect of yob.2
yob was first centered and divided by two standard deviations (standardized ; see Gelman
& Hill, 2007), and gender was coded using sum contrasts (female < male).
−2
−1
0
1
2
19301940
19501960
19701980
Year of birth
Valu
e componentlinearnonlinear
Figure 3: Values of the first (‘linear’) and second (‘nonlinear’) components of the restrictedcubic spline coding of yob, for the range of years of birth represented in the dataset.
Four item-level variables were included in the model. Of primary interest is how the
contrast between lax and aspirated stops changes over time and depends on other variables;
thus, laryngeal class (laryngeal) was coded using Helmert contrasts, corresponding to
tense vs. non-tense stops (laryngeal1) and lax vs. aspirated stops (laryngeal2). Each
item’s word frequency and vowel height (of the vowel following the stop) are included; the
e↵ects of these variables are critical for our research questions. Log-transformed frequency
was standardized, and height was coded using sum contrasts (non-high < high). Place of
2A reviewer suggests instead using a logistic function of time, reflecting the ‘S-shaped curve’ characteristic oflinguistic change. We experimented with doing so, but found that it was not possible to fit logistic functionsbecause the data is not from a large enough time range to infer the full S-shape, and is thus ambiguous betweendi↵erent possible diachronic trajectories (e.g. magnitude versus timing e↵ects). We believe this situation in factobtains for most cases of phonetic change in progress, and we follow other recent work on such cases by codingtime using a linear or non-logistic nonlinear function (Fruehwald, 2016; Hay & Foulkes, 2016; Hay et al., 2015;Kang, 2014; Zellou & Tamminga, 2014). The broader issue of what can be inferred about the overall trajectory ofchange from data from only part of the change is an interesting one for future work.
14
articulation of the stop was included as a control variable (coded using Helmert contrasts:
labial vs. nonlabial; alveolar vs. velar), due to its strong e↵ect on VOT cross-linguistically
and in Seoul Korean (expected: labial<alveolar<velar; Cho et al., 2002; Cho & Ladefoged,
1999; Lisker & Abramson, 1964).
Several utterance-level variables are also included in the model. Recall that the data
comes from IP-initial words, which may be sentence-initial or follow a pause. Both utterance
position and the quantitative strength of a prosodic boundary (using the proxy of pause
duration) are expected to a↵ect both VOT and f0 in Seoul Korean (Cho & Keating, 2001;
Jun, 1996, 1998; Kang & Guion, 2008; Keating, Cho, Fougeron & Hsu, 2003). We coded
both sentence position and pause duration as a single position factor with four levels, with
pause duration cuto↵s chosen using cut2 in the Hmisc package (Harrell, 2015) in R: (1)
utterance-initial stops; utterance-medial stops preceded by (2) a short pause (< 280 ms);
(3) a medium pause (280–430 ms); (4) a long pause (� 430 ms). position was coded using
Helmert contrasts: utterance-initial stops vs. utterance-medial stops (position1); stops
after a short pause vs. after medium–long pauses (position2); stops after a medium pause
vs. after a long pause (position3). Thus, position1 encodes utterance position, while
position2 and position3 encode pause length for sentence-medial stops.
Each speaker’s mean speech rate (speaker mean rate; a speaker-level variable) and
deviation from the mean for each token (rate deviation; an utterance-level variable) were
included in the models. Cross-linguistically, faster speech is strongly negatively correlated
with VOT for stops signaled with long-lag VOT, while short-lag categories show small or null
e↵ects (Kessinger & Blumstein, 1997; Miller et al., 1986; Pind, 1995). Because all three stop
categories are signaled with positive VOT in Seoul Korean, we expect that speech rate will
negatively a↵ect VOT, but possibly only for long-lag stops (i.e., especially for aspirated stops
in the case of Korean). In particular, we expect these e↵ects for rate deviation, which
corresponds to slower/faster speech by a given speaker relative to his/her mean speaking
rate. In addition to a speech rate e↵ect on VOT, both speech rate measures may index
the degree of hyperarticulation, which may play a role in this sound change (see above Sec.
2.2), thus influencing both VOT and f0. Including speaker mean rate also controls for an
important confound for any e↵ect of speaker age (which is of primary interest, for inferring
change over time): older speakers may speak slower than younger speakers (e.g. Jacewicz,
Fox, O’Neill & Salmons, 2009), which could in turn a↵ect VOT and f0 for the reasons just
mentioned, potentially interfering with inferences about change in VOT and f0. Both speech
rate measures were standardized.
The dependent variables VOT and f0 were transformed before inclusion in the models.
The distribution of VOT, which can only be positive (for Korean stops), is heavily right-
skewed; VOT was thus log-transformed, to bring its distribution closer to normality. f0 was
normalized by converting to semitones, as discussed above.
3.3.2 Model structure
VOT and f0 were modeled as a function of the nine independent variables introduced above,
using linear mixed-e↵ects models, fitted using the lmer function from the lme4 package
(Douglas, Martin, Ben & Steve, 2015) in R. The models for VOT and f0 had identical
structure (fixed and random e↵ects), which allows us to assess to what extent VOT and f0
are changing in parallel across speakers, words, and phonetic contexts.
Fixed e↵ects: Main e↵ect terms were included for the nine independent variables.
Interaction terms were chosen to address our research questions and control for known fac-
tors a↵ecting VOT and f0. Two-way interactions between laryngeal category and speaker-
15
level variables (laryngeal:yob, laryngeal:gender) were included to capture how both
cues to the stop contrast are changing over time, across speakers. Interactions between
laryngeal category and (1) frequency and (2) vowel height (laryngeal:frequency, la-
ryngeal:height) were included to examine how the change is spreading across words of
di↵erent frequencies and across vowel contexts (Questions 1–2). The interaction between
height and yob was included to examine whether and how the IF0 e↵ect is modulated by
the sound change (Question 3). The interaction between laryngeal and rate deviation
was included to account for expected speech rate e↵ects on VOT, which should di↵er between
stop categories, as well as any hyperarticulation e↵ects on VOT and f0. The interaction be-
tween laryngeal and position was included to control for expected prosodic e↵ects on
both cues.
We included two types of three-way interactions to address dynamic aspects of the sound
change (related to Questions 2–3). The yob:larygneal:frequency and yob:larygneal:height
interactions assess whether word frequency and vowel height tease apart synchronic magni-
tude e↵ects and diachronic timing e↵ects. The yob:larygneal:height interaction further
addresses whether there is a di↵erence in the magnitude of the IF0 change over time between
laryngeal categories. Note that we do not include a yob:larygneal:gender interaction—
this e↵ect has already been discussed by Kang (2014) for this dataset, and is not related to
our research questions.
Random e↵ects: The models included by-item and by-speaker random intercepts, to
account for variability in VOT and f0 of speakers and items beyond the e↵ects of variables
included in the models. The models also included all possible by-item and by-speaker random
slopes, to account for variability among speakers and items in the e↵ects of variables on VOT
and f0 (Barr, Levy, Scheepers & Tily, 2013). Correlations between random-e↵ect terms were
omitted to facilitate model convergence.
We note that our statistical methodology is highly conservative: we do not omit non-
significant fixed-e↵ect terms from models—all of which are either related to our research
questions or motivated based on prior work—and include all possible random slopes. By
doing so, we prioritize accurate coe�cient estimates and minimize spurious e↵ects (Type I
errors), at the risk of lower statistical power (i.e., overly conservative significances). (For
discussion of these issues, see e.g. Barr et al., 2013; Bates, Kliegl, Vasishth & Baayen, 2015;
Gelman & Hill, 2007; Matuschek, Kliegl, Vasishth, Baayen & Bates, 2015.) As a result, it is
crucial when discussing our results to discuss the direction and values of coe�cient estimates
corresponding to our research questions, regardless of whether they reach a conventional
significance threshold (e.g. p < 0.05).
4 Results
The fixed e↵ects for the statistical models of VOT and f0 are summarized in Table 2: each
fixed-e↵ect coe�cient is shown with its associated standard error, degrees of freedom, test
statistic, and significance, calculated using the Satterthwaite approximation as implemented
in the lmerTest package (Kuznetsova, Brockho↵ & Christensen, 2015). We present these
results in stages, showing di↵erent aspects of how the sound change progresses. (Random
e↵ects are not shown.) We first discuss how VOT and f0 for aspirated and lax stops are
a↵ected by the speaker-level variables (year of birth, gender; Sec. 4.1) addressed in previous
work; we then turn to the e↵ects of word frequency and following vowel height (word-level
variables: Sec. 4.2), which are the foci of our research questions; and briefly discuss the
e↵ects of other variables included as controls (Sec. 4.3). For each subset of fixed-e↵ect
16
terms, we summarize the model results quantitatively (using the regression table results)
and graphically, by showing model predictions corresponding to these terms (how they are
predicted to a↵ect VOT and f0, holding other variables constant),3 as well as the empirical
trends corresponding to these predictions (where other variables are not held constant).
Our primary interest is to assess the change in the way lax and aspirated stops are con-
trasted (laryngeal2) over time and how other variables modulate the change. Therefore,
most of the main e↵ects are discussed in terms of their interaction with laryngeal2. In
both models, all the categorical predictors were coded using Helmert or sum contrasts and
all continuous predictors were centered. Therefore, the coe�cient for a main e↵ect term of a
variable X can be interpreted as its “average” e↵ect, marginalizing over any other variables
which are part of interactions involving X (holding continuous variables at average values;
averaging over categorical variables).
4.1 Change across speakers
We first present the model results with respect to the speaker-level variables age (yob: lin-
ear and nonlinear components) and gender, and their interactions with the aspirated/lax
contrast (laryngeal2), which establishes the basic pattern of sound change in the aspi-
rated/lax contrast for VOT and f0. Figure 4 shows the empirical distributions and the
model predictions of f0 and VOT by stop category, speaker year of birth, and gender.
female male
19301940
19501960
19701980
19301940
19501960
19701980
−5
0
5
Year of Birth
f0 (s
t)
tense lax aspirated
f m
19301940
19501960
19701980
19301940
19501960
19701980
0
25
50
75
100
125
Year of Birth
VOT
(ms)
tense lax aspirated
female male
19301940
19501960
19701980
19301940
19501960
19701980
−2
0
2
4
Year of Birth
Pred
icte
d f0
(st)
tense lax aspirated
female male
19301940
19501960
19701980
19301940
19501960
19701980
25
50
75
100
Year of Birth
Pred
icte
d VO
T (m
s)
tense lax aspirated
Figure 4: Empirical plots (top) and model prediction plots (bottom) for f0 (left) andfor VOT (right) of three laryngeal categories for female and male speakers as a functionof speaker year of birth: Lines show a quadratic smooth to empirical data or the model-predicted e↵ect; shadings are 95% confidence intervals (CIs).
395% confidence intervals for model predictions in Figures 4–8 were calculated using the variance-covariancematrix of the fixed-e↵ect terms.
17
Table 2: Summary of all fixed-e↵ect coe�cients for the models of f0 (left) and log(VOT)(right): coe�cient estimates, standard errors, degrees of freedom (df), t-values, and signifi-cances. yob0 and yob
00 refer to the linear and nonlinear components of the year of birth
variable. Note that laryngeal2 compares lax and aspirated stops.
The significant main e↵ects of laryngeal2 (� = 4.149, p < 0.001) and laryngeal1 ( � =
-1.038, p = < 0.001) show that lax stops have lower f0 than aspirated stops and non-tense
stops have lower f0 than tense stops, averaging over other variables. No main e↵ects of
yob reach significance. There is a significant interaction between laryngeal2 and yob
(linear: � = -0.362, p < 0.001; nonlinear: � = 1.692, p < 0.001), which can be interpreted
using Figure 4 (lower-left): the di↵erence in f0 between lax and aspirated stops increases
over time, confirming that Seoul Korean is undergoing a sound change. In addition, this
change slows down among speakers born after 1960. There is also a significant interaction
between laryngeal1 and yob (linear: � = 0.145, p = 0.006; nonlinear: � = -0.614, p =
0.016), whose interpretation (Figure 4, lower-left) is that the di↵erence in f0 between tense
and nontense stops is increasing over time, and that the change in tense stops slows down,
keeping pace with aspirated stops.
Turning to gender e↵ects: male speakers use a smaller f0 di↵erence in contrasting aspi-
rated and lax stops than female speakers (laryngeal2:gender: � = -1.048, p < 0.001),
which can be interpreted as the sound change (f0 contrast enhancement) being more ad-
vanced for female speakers. The f0 di↵erence between tense and non-tense stops does not
significantly di↵er by gender (laryngeal1:gender: p= 0.651). The significant main e↵ect
of gender (gender: � = -1.248, p < 0.001) and interaction with time (yob0:gender: � =
-0.285, p=0.007; yob00:gender: p=0.536) also plausibly reflect the sound change: speak-
ers for whom the sound change is more advanced (female speakers, younger speakers) have
higher ‘average f0’ across the three laryngeal classes (Figure 4, lower-left).
4.1.2 VOT
There is a significant main e↵ect of yob (linear: � = -0.034, p=0.006; nonlinear: p =
0.959), with VOT, averaged across laryngeal categories, becoming shorter over time. Aspi-
rated stops have significantly longer VOT than lax stops, averaged across other variables
(laryngeal2: � = 0.221, p < 0.001). VOT is also greater for non-tense stops than for tense
stops (laryngeal1: � = 1.242, p < 0.001), which is consistent with VOT continuing to
serve as the primary cue di↵erentiating tense from lax/aspirated stops. The significant inter-
action between laryngeal2 and yob (linear: � = -0.118, p< 0.001; nonlinear: � = 0.173,
p=0.014) can be interpreted using Figure 4 (lower-right): the di↵erence in VOT between
lax and aspirated stops is decreasing over time, confirming that part of the ongoing sound
change is the loss of the aspirated/lax VOT contrast. In addition, the change slows down over
time (nonlinear term), though not as dramatically as was the case for f0. Finally, the VOT
di↵erence between tense and nontense stops also decreases over time (yob0:laryngeal1: �
= -0.061, p=0.001; yob00:laryngeal1: p=0.684), primarily due to change in aspirated stop
VOT (Figure 4, lower-right).
Male speakers have significantly longer VOT than female speakers, across laryngeal cate-
gories (gender: � = 0.127, p < 0.001), and the VOT di↵erences between aspirated and lax
stops and between tense and non-tense stops are larger for male speakers (laryngeal2:gender:
� = 0.16, p < 0.001; laryngeal1:gender: � = -0.155, p = 0.001). All these e↵ects can
be interpreted using Figure 4 (right panels), as the sound change being more advanced for
female speakers.4 Interestingly, the VOT values for aspirated stops and lax stops are re-
versed for the youngest speakers. This is consistent with Silva (2006), who found a negative
4Note that the overall gender di↵erence in VOT is unlikely to be due to physiological di↵erences, which wouldif anything suggest women should have higher VOT than men (Morris, McCrea & Herring, 2008).
19
aspirated/lax VOT di↵erence for a handful of young speakers.
4.1.3 Summary
We found that the aspirated/lax distinction in Seoul Korean has shifted over time from
primarily VOT-based to primarily f0-based, this change is more advanced for female speakers,
VOT contrast reduction and f0 contrast enhancement are proceeding in parallel, and tense
stops pattern together with aspirated stops in f0 change (but to a lesser extent). These
findings all replicate Kang (2014) on a significantly larger dataset.
4.2 Change across words
4.2.1 Word Frequency
We now discuss the e↵ects of word frequency on VOT and f0 predicted by the models, which
addresses our first two research questions: is there a word frequency e↵ect in this sound
change, and how is this sound change spreading across the lexicon of Seoul Korean? We
examine the directionality of any word frequency e↵ect, whether this directionality is the
same for VOT and f0, and whether the role of frequency changes over time, all of which o↵er
evidence for the mechanism behind this sound change. The relationship of word frequency
with VOT and f0 are captured in the models (Table 2) by terms for the main e↵ect of
frequency and its interactions with laryngeal2 and yob. Three-way interactions will
be discussed in Sec. 4.2.3. Figures 5–6 show the empirical and model-predicted e↵ects of
word frequency on VOT and f0.
4.2.1.1 f0
There is a marginal negative e↵ect of word frequency on f0 (frequency: � = -0.304, p =
0.054), suggesting that frequently used words have lower f0 than infrequently used words.
This may be due to factors observed cross-linguistically: high-frequency words tend to be
produced with lower pitch (Cantonese: Zhao & Jurafsky, 2007, 2009) and phrasal prominence
is reduced with higher predictability (English: Pan & Hirschberg, 2000).
We find a marginal interaction between laryngeal class and frequency (laryngeal2:frequency
� = 0.625, p = 0.072), such that the di↵erence in f0 between aspirated and lax stops is greater
for high-frequency words (averaging across speakers of di↵erent ages). This e↵ect is visible
in Figure 5 as an increasing distance between the lines corresponding to aspirated and lax
stops, as frequency increases.5 When this frequency e↵ect is interpreted with the significant
yob:laryngeal2 interaction seen above, the diachronic divergence in f0 between laryngeal
classes is more advanced for high-frequency words. Note that this diachronic pattern is un-
likely to result from a synchronic magnitude e↵ect, which would if anything predict smaller
f0 di↵erences between laryngeal classes for higher frequency words (since they would be
more predictable, and hence less informative; e.g. Aylett & Turk, 2006), the opposite of the
pattern observed here.
An additional observation can be made from Figure 5 for tense stops, for which f0 appears
to be increasing over time along with aspirated stops, as a member of the same natural class
5A reviewer notes discrepancies between the empirical trends and model fits in word frequency e↵ects on bothVOT and f0 (in Figure 5 and Figure 6). These discrepancies are largely due to unbalanced data in terms offrequency and vowel height. Low-frequency words are skewed towards nonhigh vowel contexts and high-frequencywords are skewed towards high vowel contexts. When the same plots are made for just tokens with a fixed vowelheight, the empirical plots look much closer to the model prediction plots.
20
Q1 Q2 Q3 Q4 Q5
19301940
19501960
19701980
19301940
19501960
19701980
19301940
19501960
19701980
19301940
19501960
19701980
19301940
19501960
19701980
−5
0
5
Year of Birth
f0 (s
t)
tense lax aspirated
Q1 Q2 Q3 Q4 Q5
19301940
19501960
19701980
19301940
19501960
19701980
19301940
19501960
19701980
19301940
19501960
19701980
19301940
19501960
19701980
−2
0
2
4
Year of Birth
Pred
icte
d f0
(st)
tense lax aspirated
Figure 5: Empirical plots (top) and model prediction plots (bottom) of f0 as a function ofword frequency & laryngeal category. Lines and shadings as in Figure 4. Q1–Q5 refer toword frequency quantiles from lowest (Q1) to highest (Q5).
(as proposed by Kang, 2014). However, for tense stops, the change in f0 is more advanced
before lower frequency words. This pattern makes sense if f0 in tense stops is changing
by analogy with aspirated stops—since low-frequency words are expected to lead analogical
sound changes.6
4.2.1.2 VOT
High-frequency words have significantly shorter VOT than low-frequency words (frequency:
� = -0.11, p = 0.031), averaged across speakers and stop categories. This directionality is
expected, as a synchronic e↵ect, independent of sound change in progress: higher-frequency
words show shorter segmental durations due to hypoarticulation (e.g. Aylett & Turk, 2004;
Baker & Bradlow, 2009; Bell et al., 2003). There is also a marginal interaction of frequency
with laryngeal class (laryngeal2:frequency: � = -0.185, p = 0.095), such that the VOT
di↵erence between lax and aspirated stops is smaller for high-frequency words (averaging
across speakers of di↵erent ages). This e↵ect is visible in Figure 6 as a decreasing distance
between the lines corresponding to aspirated and lax stops, as frequency increases, due pri-
marily to VOT for aspirated stops decreasing. When this frequency e↵ect is interpreted in
view of the diachronic change (laryngeal2:yob), it suggests that the diachronic merger of
6We thank an anonymous reviewer for this suggestion.
21
Q1 Q2 Q3 Q4 Q5
19301940
19501960
19701980
19301940
19501960
19701980
19301940
19501960
19701980
19301940
19501960
19701980
19301940
19501960
19701980
0
25
50
75
100
125
Year of Birth
VOT
(ms)
tense lax aspirated
Q1 Q2 Q3 Q4 Q5
19301940
19501960
19701980
19301940
19501960
19701980
19301940
19501960
19701980
19301940
19501960
19701980
19301940
19501960
19701980
30
60
90
Year of Birth
Pred
icte
d VO
T (m
s)
tense lax aspirated
Figure 6: Empirical plots (top) and model prediction plots (bottom) of VOT as a functionof word frequency & laryngeal category. Lines and shadings as in Figure 4. Q1–Q5 refer toword frequency quantiles from lowest (Q1) to highest (Q5).
VOT happens earlier for high-frequency words.
We also note the marginal interaction of laryngeal1 with word frequency (laryngeal1:
frequency: � = 0.193, p = 0.096): the di↵erence in VOT between tense and nontense stops
is larger for words with higher frequency; this is due to a negative relationship between word
frequency and VOT for tense stops and a positive relationship for lax stops (Figure 6 bot-
tom). We do not have an explanation for this pattern, and leave the more general question
of the role of tense stops in this sound change to future work.
4.2.2 Vowel Height
We turn to the e↵ect of vowel height on VOT and f0, which addresses our second and third
questions: how is the change propagating across vowel contexts, and how is the magnitude
of vowel-height dependent IF0 e↵ects influenced by the emergence of contrastive f0? We
examine the directionality of any vowel height e↵ect, whether this directionality is the same
or di↵erent for VOT and f0, and whether the IF0 e↵ect varies over time and across stop
categories.
The relationship between vowel height and each cue (VOT, f0), and how it changes over
time, are captured in the models (Table 2) by terms for the main e↵ect of height and its
interaction with yob. Di↵erences in IF0 e↵ects and how the IF0 e↵ect changes over time
for each laryngeal class are captured by laryngeal:height and yob:laryngeal:height
22
interaction terms.
Figure 7 shows the empirical and model-predicted e↵ects of vowel height on VOT and
f0, and Figure 8 shows the diachronic development of this e↵ect for each stop category.
nonhigh high
19301940
19501960
19701980
19301940
19501960
19701980
−5
0
5
Year of Birth
f0 (s
t)
tense lax aspirated
nonhigh high
19301940
19501960
19701980
19301940
19501960
19701980
0
25
50
75
100
125
Year of Birth
VOT
(ms)
tense lax aspirated
nonhigh high
19301940
19501960
19701980
19301940
19501960
19701980
−2
0
2
4
Year of Birth
Pred
icte
d f0
(st)
tense lax aspirated
nonhigh high
19301940
19501960
19701980
19301940
19501960
19701980
30
60
90
Year of Birth
Pred
icte
d VO
T (m
s)
tense lax aspirated
Figure 7: Empirical plots (top) and model prediction plots (bottom) of f0 (left) and VOT(right), as a function of vowel height and laryngeal category. Lines and shadings as in Figure4.
4.2.2.1 f0: across vowel context
Concerning our second research question, the f0 di↵erence between aspirated and lax stops
is modulated by vowel height. As can be seen in Figure 7, the di↵erence in f0 between
aspirated and lax stops is greater for stops in nonhigh vowel context than for those in high
vowel context (averaging across speakers of di↵erent ages) (laryngeal2:height: � = -
0.692, p = 0.04). When this height e↵ect is interpreted in reference to the ongoing sound
change across speakers, it indicates that the divergence of f0 over time is more advanced in
nonhigh vowel context than in high vowel context.
4.2.2.2 IF0 e↵ects
There is a significant main e↵ect of height: as expected (Sec. 2.4), high vowels have intrin-
sically higher f0 than low vowels (� = 0.96, p < 0.001). More importantly, as illustrated in
Figure 8, we find a significant interaction between yob and height: the linear term sug-
gests that the intrinsic di↵erence in f0 between high and nonhigh vowels is attenuated over
time as contrastive f0 emerges in the language (� = 0.142, p = 0.007), while the nonlinear
term suggests that this attenuation in IF0 e↵ects is slowing down (� = -0.583, p = 0.018).
The pattern of slowing down fits with the significant interaction between yob (nonlinear)
and laryngeal2 observed for change across speakers. Together, the yob
00:height and
23
tense lax aspirated
19301940
19501960
19701980
19301940
19501960
19701980
19301940
19501960
19701980
−5
0
5
Year of Birth
f0 (s
t)
height nonhigh high
tense lax aspirated
19301940
19501960
19701980
19301940
19501960
19701980
19301940
19501960
19701980
−2
0
2
4
Year of Birth
Pred
icte
d f0
(st)
height nonhigh high
Figure 8: Empirical plots (left) and model prediction plots (right) showing a change in thesize of IF0 e↵ects over time by each laryngeal category. Lines and shadings as in Figure 4.
yob
00:laryngeal2 e↵ects suggest that IF0 attenuation is decelerating as the sound change
is nearing completion in phrase-initial position.
4.2.2.3 VOT
There is a significant e↵ect of height in the cross-linguistically expected direction (Higgins
et al., 1998; Stevens, 1998): VOT is longer for stops before a high vowel than before a non-
high vowel (� = 0.134, p = 0.036). This di↵erence is attenuated over time (yob0:height: p
= 0.393; yob00:height: � = 0.154, p = 0.016).
Crucially, the VOT di↵erence between lax and aspirated stops is significantly smaller in
non-high vowel context than in high vowel context (laryngeal2:height: � = 0.326, p =
0.002). Similarly to the results for f0, this vowel height e↵ect has a clear interpretation in
terms of sound change when interpreted together with the community-level change results:
the diachronic merger of VOT for the aspirated/lax stop contrast observed across the speech
community occurs earlier in nonhigh vowel context.
4.2.3 Magnitude versus timing e↵ects
In Sec. 2.3.1 above we considered the issue of whether the e↵ects we have observed can be
interpreted as e↵ects of magnitude (i.e. pre-existing synchronic di↵erences between classes
of words that are maintained during diachronic change) or timing (i.e. diachronic change
proceeding faster or earlier in some environments). So far we have interpreted our results
to mean that non-high vowels and high-frequency words are leading the change in VOT and
f0 contrasts—that is, we have interpreted them as timing e↵ects. We now consider to what
extent we have evidence for this claim.
As explained in Sec. 2.3.1, timing di↵erences should manifest themselves across the full
time range of the sound change as di↵erences in the rate of change over time—corresponding
to three-way interaction terms in the statistical models between year of birth, laryngeal
class and either frequency or vowel height. We consider only terms involving laryngeal2
(aspirated/lax contrast), which are of interest for the sound change, and do not discuss terms
involving laryngeal1 (tense/non-tense contrast). In unpacking these terms, we will use
the plots in Figure 9, which show the model-predicted di↵erence in VOT and f0 between
aspirated and lax stops over time, for words with di↵erent frequencies and with di↵erent
24
vowel heights (with other variables held constant, as above).7
We first consider three-way interactions with frequency, the evidence for which was mixed.
For f0, the direction of the interaction between laryngeal2, year of birth and frequency is
consistent with a timing e↵ect, where the sound change has progressed more over time for
high-frequency words, as can be seen in Figure 9(c). However, this interaction does not reach
significance (yob0:laryngeal2:frequency: p = 0.466; yob00:laryngeal2:frequency: p
= 0.251). For VOT, the interaction between laryngeal class, and frequency has both very
small e↵ect size and does not reach significance (p = 0.389), as is clear in Figure 9(d).
Turning to the three-way interaction terms with vowel height: for f0, there is a marginal
interaction of laryngeal2 with vowel height and year of birth (yob00:laryngeal2:height:
p = 0.089). This trend indicates that the magnitude of the nonlinear change in laryngeal2
over time di↵ers by vowel context, as shown in Figure 9(a): the enhancement of the f0
contrast is more advanced in nonhigh vowel contexts than high vowel contexts, as expected
for a timing e↵ect where stops in nonhigh vowel contexts lead the change. (Alternatively,
this trend may be interpreted as a di↵erence in the magnitude of IF0 attenuation over time
between stop categories.) For VOT, the interaction of laryngeal2 with vowel height and
year of birth has small e↵ect size and does not reach significance (yob0:laryngeal2:height:
p = 0.273; yob00:laryngeal2:height: p = 0.472) (Figure 9(b)).
In sum, the three-way interactions (between laryngeal2, year of birth, and frequency/vowel
height) for f0 were generally in the direction predicted under a timing e↵ect interpretation,
but the weak significances of these terms mean that they do not o↵er strong evidence for
this interpretation over a magnitude interpretation. Any three-way interactions for VOT
were negligible. Like all null results, the f0 and VOT three-way interaction results are not
meaningful a priori since there are many reasons a “real” e↵ect may have not been detected
if it existed. One such reason is suggested by the model–predicted VOT and f0 contrasts
over time, for di↵erent classes of words in Figure 9, which can be compared directly to the
trajectories that were predicted under magnitude versus timing e↵ects in Figure 2.
Crucially, the slopes for f0 di↵erence seem to vary across words with di↵erent frequency
(Figure 9(c)) and stops in di↵erent vowel contexts (Figure 9(a)) until the change becomes
stabilized (compare to Figure 2(c)). In contrast, the slopes for VOT di↵erences do not
exhibit noticeable di↵erences across words (Figure 9(d)) and vowel contexts (Figure 9(b)).
Thus, the null e↵ects for f0 in the three-way interactions involving yob—particularly for the
linear term (yob0:laryngeal2:frequency and yob
0:laryngeal2:height)—may be due
in part to reduced variation in the stable portion at the endpoint of the S-curve.
To test this idea, we carried out a post-hoc analysis by building a new f0 model on just
data from speakers born before 1965. The time band was chosen because the empirical
and model prediction plots show the beginning of stabilization in the 1960s, consistent with
previous work (Silva, 2006) that found a critical divide around 1965 between ‘traditionalists’
(VOT users) and ‘innovators’ (f0 users).
On the subsetted data, the new model was constructed in the same way as the previous
model, keeping most terms the same. Because we intended this model to only include the
linear trend for year of birth, the nonlinear term yob
00 and all interaction terms involving
yob
00 were excluded. The fixed e↵ects for the new f0 model are summarized in Table A1
in the appendix. We omit discussion of most results of this model, which largely overlap
with our previous f0 model, and report only the two three-way interaction terms of interest:
7Model predictions and 95% prediction intervals were approximated by simulation. For each model (VOT and
f0), n = 10000 draws of the fixed e↵ect coe�cients (~�) from the model’s posterior distribution were taken usingthe sim function in the arm package (Gelman & Su, 2015), then used to calculate a median prediction and 95%prediction intervals, which correspond to the lines and shading in in Figure 9 and Figure 10.
25
Figure 9: Model-predicted di↵erences between aspirated and lax stop VOT and f0 overtime, for di↵erent vowel heights (top row) and word frequencies (bottom row). Lines andribbons are median model predictions and 95% prediction intervals calculated by simulationfrom the model posterior. Q1–Q5 refer to word frequency quantiles from lowest (Q1) tohighest (Q5).
Figure 10: Model-predicted IF0 e↵ect (f0 di↵erence between high and non-high vowels)over time, for each class of stops. Lines and ribbons are as in Figure 9.
26
yob:laryngeal2:frequency and yob:laryngeal2:height.
Crucially, both terms are statistically significant with notably increased e↵ect sizes rela-
tive to the earlier f0 model (yob:laryngeal2:frequency: � = 1.186, p = 0.019;
yob:laryngeal2:height: � = -1.561, p = 0.01). This indicates that for speakers born up
to 1965, high-frequency words and stops preceding a nonhigh vowel are ahead in the change
in f0 contrast enhancement, and these e↵ects are beyond synchronic magnitude e↵ects. Thus,
this model provides our best evidence of observing timing rather than magnitude e↵ects.
The three-way interaction between year of birth, laryngeal class, and vowel height
(yob:laryngeal2:height) also adds to our interpretation of how the IF0 e↵ect changes
over time. The IF0 attenuation is significantly greater for aspirated stops than for lax
stops, as can be seen in Figure 10, which shows the model-predicted IF0 e↵ect (f0 for high
minus non-high vowels) of stops over time (with other variables held constant).8 By 1965,
the predicted IF0 di↵erence approaches zero for aspirated stops, but is still positive for lax
stops. Another interesting pattern is that the IF0 e↵ect for tense stops always remains larger
than for aspirated stops. The di↵erent development of IF0 e↵ects over time for di↵erent stop
classes is discussed further below (Sec. 5.3).
4.2.4 Frequency versus vowel height e↵ects
Before proceeding, we note that the frequency e↵ects observed in our data are weaker than
the corresponding vowel height e↵ects—especially for VOT—with the frequency e↵ects of
interest often having higher p-values and smaller e↵ect sizes than the analogous vowel height
e↵ects of interest. One possible explanation for the asymmetry between frequency and
vowel height e↵ects is that more meaningful frequency e↵ects exist, but are masked due
to the distribution of the data and our statistical methodology. In this dataset, we found
high multicollinearity between frequency, place of articulation, and vowel height, leading
to unstable models when terms for all of their interactions with laryngeal category were
included. Because word frequency and vowel height are central to our research questions,
we had to exclude the interaction of place of articulation and laryngeal category. However,
because place of articulation is a priori expected to a↵ect VOT, we retained the main ef-
fect of place. We also included all possible random slopes. Both aspects of our modeling
methodology may lead to conservative p-values, while prioritizing accurate coe�cient esti-
mates (see Sec. 3.3.2).9 Thus, in the remainder of this paper, we acknowledge the weakness
of some frequency e↵ects (p < 0.1) in our results by labeling them as ‘tentative’, but discuss
the direction of these e↵ects nonetheless.
Another possibility is that the true frequency e↵ects in this dataset are weaker than the
height e↵ects—as reflected by the model results. Yet another possibility is that a frequency
e↵ect on VOT exists as a synchronic e↵ect, but its role is limited to triggering the change.
We return to these possibilities below (Sec. 5.2), in the context of what each one would mean
for our research questions.
4.2.5 Summary
We found that VOT contrast reduction and f0 contrast enhancement are greater in stops
preceding a nonhigh vowel, and tentatively greater in words with high frequency. In a further
analysis exploring a period of time (year of birth < 1965) where there is more variation in
8These model predictions and prediction intervals are calculated using the same simulation-based method asfor the aspirated/lax di↵erences.
9Indeed, removing all terms for place lowered the p-values of all frequency e↵ects.
27
f0, we found evidence that this f0 pattern can be interpreted as a timing e↵ect: f0 contrast
enhancement is spreading across words of di↵erent frequencies and vowels of di↵erent heights
in a non-uniform way. The parallel frequency and vowel height e↵ects on VOT merger and
f0 contrast enhancement o↵er important evidence for our proposal, discussed below, that
this sound change results from a combination of contrast reduction in one dimension (VOT)
and adaptive behavior in another (f0) to preserve the contrast. We also found evidence that
the universal trend of IF0 di↵erence between high and nonhigh vowels is attenuated over
time as contrastive f0 emerges in the language, and that the e↵ect di↵ers by stop category.
4.3 Other Factors
We briefly discuss the f0 and VOT results for variables included in our model as controls
(position, speaker mean rate, rate deviation, place), restricting ourselves to terms
which are significant (p < 0.05) or are relevant for our research questions.
f0 was higher for utterance-medial stops before a longer pause than before a shorter
pause (position2: � = 0.243, p < 0.001), perhaps due to larger f0 resets at prosodic bound-
aries signaled by longer pause durations (Fant, Kruckenberg & Gustafson, 2002). There
is a marginal trend for the f0 di↵erence between lax and aspirated stops to be greater for
utterance-medial stops than for utterance-initial stops (laryngeal2:position1: � = 0.527,
p = 0.076).
f0 increases for faster speech within a speaker, averaging across stops (rate deviation:
� = 0.157, p = 0.011). There is a trend for faster speech to be associated with reduction
in the f0 contrast (laryngeal2:rate deviation: p = 0.17), but this e↵ect does not reach
significance.
VOT is higher utterance-medially than utterance-initially (position1: � = 0.1, p =
0.005), and there is a trend for the VOT di↵erence between aspirated and lax stops to be
larger utterance-medially (laryngeal2:position1:� = 0.158, p= 0.092). Among utterance-
medial stops, the aspirated/lax contrast in VOT is greater following a long pause than before
shorter pauses (laryngeal2:position3: � = 0.075, p = 0.047). The lack of a significant
speaker mean rate e↵ect on VOT (p = 0.546) suggests that the reduced VOT contrast
for younger speakers cannot be attributed to age-dependent speech rate variation. Faster
speech does not significantly a↵ect the aspirated/lax VOT contrast (laryngeal2:rate de-
viation: p = 0.86). Finally, VOT is larger for less anterior places of articulation, as expected
cross-linguistically (place1 (labial vs. nonlabial): � = 0.123, p = 0.012; place2 (alveolar
vs. velar): � = 0.314, p < 0.001).
5 Discussion
In the current study, we first confirmed previous findings (Kang, 2014) on the quasi-tonogenetic
sound change underway in Seoul Korean in phrase-initial position: the change is led by fe-
male speakers, for both VOT contrast reduction and f0 contrast enhancement; the di↵usion
of the change through the speech community proceeds by a gradual parallel change of VOT
and f0 in the inverse direction over time; and the change is slowing down, suggesting it is
nearing completion in the speech community. During this sound change, VOT ‘reduction’
(over time) comes largely from aspirated stops, while lax stops show little change. This
asymmetry between aspirated and lax stops parallels how reduction a↵ects VOT of di↵erent
stop classes cross-linguistically (synchronically): in hypospeech, the contrast between long
and short-lag stops is attenuated, mainly due to decrease in the long-lag stop’s VOT, as
28
observed in languages including English, Icelandic, and Thai (Kessinger & Blumstein, 1997;
Miller et al., 1986; Pind, 1995). Our proposal that the sound change is driven in part by
production bias in VOT provides a natural explanation for why change in VOT a↵ects only
aspirated stops, rather than lax stops or both stop classes.
We then provided three novel findings. First, while not definitive, our results lead us to
tentatively conclude that sound change impacted high-frequency words before low-frequency
words, suggesting that lenition may be a driving factor of the sound change. Second, the
change is spreading through words and vowel contexts as well as speakers in an adaptive
manner: both VOT contrast reduction and f0 contrast enhancement are greater in the same
conditions. Third, the vowel intrinsic f0 di↵erence between high and non-high vowels is
attenuated as contrastive f0 emerges over time. These findings suggest that transphonolo-
gization in Seoul Korean is driven by production bias and adaptive reinterpretation of the
speech signal.
We now discuss our results on the quasi-tonogenetic change in progress in Seoul Korean,
which shed light on the origin, progression, and the impact of tonogenesis.
5.1 Origin: Production bias
Our first research question concerned word frequency e↵ects in tonogenesis. There is almost
no previous work addressing the role of word frequency in tonogenetic sound change. The
results tentatively suggested that high-frequency words are produced with more innovative
pronunciation than low-frequency words, by having both a greater f0 di↵erence and smaller
VOT di↵erence between lax and aspirated stops. From this finding we suggested that quasi-
tonogenesis in Seoul Korean may be driven by contrast reduction—namely, production bias
a↵ecting VOT— and that production bias in VOT may be one source of tonogenetic sound
change more generally.
This interpretation of the word frequency e↵ect is based on work showing lenition-driven
sound change tends to a↵ect high-frequency words first (see Sec. 2.2). We do not commit to
“when” frequency plays a role (acquisition vs. adulthood), or “where” (mental representa-
tion), which are the subject of significant debate (Bell et al., 2009; Gahl, 2008; Harrington,
The attenuation of the IF0 e↵ect in our data was larger for aspirated stops than for lax or
tense stops, with the IF0 e↵ect for aspirated stops approaching zero over time. This category-
dependent variation may be motivated by the language-specific implementation of stops in
Korean. Speakers may not attenuate IF0 e↵ects for tense stops as much as for aspirated
stops because there is no functional pressure to do so: the primary cue contrasting tense
stops from lax/aspirated stops is VOT, before and after the sound change. The diachronic
development of f0 for tense stops also supports this view: f0 increases for tense stops, but
not as much as for aspirated stops (Figure 4). However, this account does not explain why
the IF0 e↵ect is attenuated less over time for lax stops, compared to aspirated stops. This
pattern is puzzling because lax stops have lower f0 than aspirated stops, and IF0 e↵ects are
smaller in the lower part of a speaker’s pitch range cross-linguistically (Ladd & Silverman,
1984; Whalen & Levitt, 1995). One possibility is that the low f0 target for Korean lax stops
is not in the lowest region of a speaker’s f0 range, while the f0 target for aspirated stops is
in the higher region of a speaker’s f0 range. Increased activity of the cricothyroid muscle
involved in the production of higher f0 (Hoole & Honda, 2011; Lofqvist et al., 1989) may
therefore result in greater attenuation of IF0 for aspirated stops. Thus, IF0 attenuation that
accompanies the enhancement of f0 di↵erences or the emergence of contrastive f0 may be
due to the ‘controlled’ mechanism suppressing the ‘automatic’ mechanism. The controlled
mechanism may play a more important role in the stop category that is both prone to merger
and occurs in the highest f0 range (i.e. aspirated stops), compared to other categories.
In sum, we find that as f0 becomes contrastive in Seoul Korean, the size of the IF0 e↵ect
is attenuated, especially for the stop category most a↵ected by the sound change (aspirated
stops), suggesting that speakers suppress non-contrastive variation in f0 (due to vowel height)
as a consequence of its rise as a primary cue.
5.4 Actuation: Korean intonational phonology
We have argued that frequently used words and stops before nonhigh vowels lead the change
in both VOT contrast reduction and f0 contrast enhancement, suggesting that transphonol-
ogization in Seoul Korean was triggered by lenition a↵ecting the VOT contrast, which led
to the phonologization of the f0 contrast. However, this does not explain why transpho-
nologization has happened in Korean but not in other languages, even though reduction
of long-lag stops in certain speech conditions presumably exists as a precondition in every
32
language with long-lag stops. The role of f0 in prosodic marking in Seoul Korean may help
resolve this issue, as follows.
Phonological control of f0 in Seoul Korean related to adjacent consonants is in fact
not new to the language, but is a long-standing part of the intonational phonology (Jun,
1993, 1996, 1998). Korean is unusual in that the way prosodic domains (APs) are marked is
influenced by the identity of segments at domain edges. In Seoul Korean, tense and aspirated
stops and a↵ricates (as well as/s/, tense /s*/, /h/) condition a high (H) boundary tone, while
other consonants condition a low (L) boundary tone. This segment-induced f0 distinction
is argued to be phonologically-controlled ‘phrase initial strengthening’ which is functionally
motivated by perceptual enhancement (Jun, 1993, 1996, 2005). The prosodic tone-bearing
segments pattern exactly together with the segments that are undergoing f0 change in Seoul
Korean diachronically: the distance in f0 between the H-tone bearing segments and the
L-tone bearing segments increases over time in parallel with VOT contrast reduction.
We suggest that the language-specific implementation of f0 for domain strengthening,
which makes the f0 di↵erence between categories larger than expected from purely physio-
logical factors, may mean Seoul Korean listeners are more attuned to f0 than would be the
case in other languages—especially in contexts where the VOT contrast is weaker (e.g. high-
frequency words). In other words, we conjecture that the process of quasi-tonogenetic change
we describe—hypoarticulation-driven reduction of VOT contrast and adaptive f0 contrast
enhancement—may have begun when the domain-initial f0 distinction was already in place.
When the VOT merger began, the prosodic f0 distinction was readily available to listen-
ers, which facilitated adaptive enhancement. This language-specificity may help explain the
broader long-standing question of why tonogenetic sound change is not more common cross-
linguistically, given that segment-induced f0 perturbations are present in most languages.10
Our account is also consistent with Kirby (2013), who argues that transphonologization to f0
as opposed to another outcome occurred in Seoul Korean because of the high ‘informativity’
of the f0 contrast which existed at the outset of the change.
The current study has a weakness which could be addressed in future cross-linguistic
work. We have taken parallelism between VOT contrast reduction and f0 contrast enhance-
ment as evidence for language adaptivity during a diachronic change. However, we are not
certain whether this parallelism is expected cross-linguistically, or is unique to languages
undergoing (quasi-)tonogenetic sound change. That is, is parallelism between VOT and f0
a cause of transphonologization (a “phonetic precursor”), or a consequence of the sound
change in progress? While the relationship between VOT and f0 in voicing contrasts cross-
linguistically is well-studied (e.g. Kirby & Ladd, 2015; McCrea & Morris, 2005), we are aware
of only three studies addressing the relationship between VOT and f0 contrast strength (i.e.
cue weights) across speakers, all in English, which reach conflicting results: Shultz, Francis
& Llanos (2012) and Clayards (2008) find that talkers who contrast voicing categories with
a larger VOT cue weight produce the contrast with a smaller f0 weight (that is, the same
direction observed in Korean), while Clayards (2018) finds the opposite pattern. We are not
aware of any studies addressing VOT and f0 contrast tradeo↵ across words (e.g. frequency)
or contexts (e.g. vowel height). Future work could examine whether the trading pattern
seen in Seoul Korean is found in other languages, and shed light on the more general issues
of what the phonetic precursors to tonogenesis are, and the relationship of tonogenesis to
synchronic variability in how laryngeal contrasts are implemented.
As a final remark, we note that the contrastive use of f0 in Seoul Korean is still constrained
10This is a special case of the more general ‘actuation problem’ (why any sound change is not more common;Soskuthy, 2015; Weinreich et al., 1968).
33
by phrase-level intonational phonology, which makes the Korean sound change a sub-optimal
case study to address general issues of tonogenesis. We believe the quasi-tonogenetic sound
change in Seoul Korean shares enough similarity with ‘true’ cases of tonogenesis—including
the rise of contrastive f0 by a combination of prosodic and segmental sources (Kingston,
2011)—for our findings to o↵er insight into tonogenetic sound changes more generally. How-
ever, at this point Seoul Korean is clearly not a tonal language. For Seoul Korean to develop
into a true tonal language, where its lexical items are specified and distinguished by a
paradigmatic set of more than one contrastive pitch, the use of contrastive f0 would need to
descend from phrase-initial position to lower prosodic levels, for example through the process
of ‘domain-narrowing’ (Bermudez-Otero, 2015). Only time will tell whether Seoul Korean
will follow this pathway to develop lexical tone.
6 Conclusion
We examined the origin, propagation, and impact of a quasi-tonogenetic sound change in
Seoul Korean, and related our findings to these aspects of tonogenetic sound changes more
broadly. We found that VOT contrast reduction and f0 contrast enhancement spread across
phonetic contexts (vowels of di↵erent heights), and possibly words (of di↵erent frequencies),
in parallel. These findings suggest that the sound change is propagating across speakers and
the language in an adaptive manner, driven by a combination of production bias leading to
contrast reduction in one dimension (VOT), and adaptive expansion of contrast in another
dimension (f0), plausibly to avoid merger. We also found evidence that the vowel intrinsic
pitch di↵erence is attenuated as contrastive f0 emerges, possibly due to the combined e↵ect
of controlled and automatic mechanisms. These findings shed light on how the sound system
of a language dynamically changes in an incremental and adaptive manner via continuous
adjustments in speech production and perception.
7 Acknowledgements
A preliminary version of this paper was published as Bang, Sonderegger, Kang, Clayards &
Yoon (2015). We thank audiences at the 2014 Montreal-Ottawa-Toronto Phonology work-
shop, ICPhS 2015, and ICKL & Harvard-ISOKL 2015, as well as James Kirby for useful
feedback. We especially thank three anonymous reviewers and the editor (Taehong Cho)
for their helpful comments. This work was supported by SSHRC grant 430-2014-00018 and
FRQSC grant 183356 to MS, SSHRC grant 435-2014-1504 to MC, and SSHRC Partnership
Development Grant 890-2012-25 to YK.
34
References
Abramson, A. S., L-Thongkum, T., & Nye, P. (2005). Voice register in Suai (Kuai): An analysis ofperceptual and acoustic data. Phonetica, 61 (2-3), 147–171.
Atkinson, J. E. (1972). Correlation analysis of the physiological features controlling fundamentalvoice frequency. Journal of the Acoustical Society of America, 63, 211–222.
Aylett, M. & Turk, A. (2004). The Smooth Signal Redundancy Hypothesis: A Functional Explana-tion for Relationships between Redundancy, Prosodic Prominence, and Duration in SpontaneousSpeech. Language and Speech, 47 (1), 31–56.
Aylett, M. & Turk, A. (2006). Language redundancy predicts syllabic duration and the spectralcharacteristics of vocalic syllable nuclei. Journal of the Acoustical Society of America, 119 (5),3048–3058.
Baayen, R. (2008). Analyzing linguistic data. Cambridge: Cambridge University Press.
Bailey, G., Wikle, T., & Tillery, J. (1993). Some patterns of linguistic di↵usion. Language Variationand Change, 5 (3), 359–390.
Baker, A., Archangeli, D., & Mielke, J. (2011). Variability in American English s-retraction suggestsa solution to the actuation problem. Language Variation and Change, 23 (03), 347–374.
Baker, R. E. & Bradlow, A. R. (2009). Variability in Word Duration as a Function of Probability,Speech Style, and Prosody. Language and Speech, 52 (4), 391–413.
Bang, H.-Y., Sonderegger, M., & Clayards, M. (2017). Speaker Variability in Cue Weighting forLaryngeal Contrasts: the Relationship to Sound Change. Edinburgh, Scotland: University ofEdinburgh.
Bang, H. Y., Sonderegger, M., Kang, Y., Clayards, M., & Yoon, T.-J. (2015). The E↵ect of Word Fre-quency on the Timecourse of Tonogenesis in Seoul Korean. In Proceedings of the 18th InternationalCongress of Phonetic Sciences, Glasgow, Scotland, UK.
Barr, D. J., Levy, R., Scheepers, C., & Tily, H. J. (2013). Random e↵ects structure for confirmatoryhypothesis testing: Keep it maximal. Journal of Memory and Language, 68 (3), 255–278.
Bates, D., Kliegl, R., Vasishth, S., & Baayen, H. (2015). Parsimonious mixed models. arXiv preprintarXiv:1506.04967.
Beckman, M. E., Li, F., Kong, E. J., & Edwards, J. (2014). Aligning the timelines of phonologicalacquisition and change. Laboratory Phonology, 5 (1), 151–194.
Beckman, M. E. & Pierrehumbert, J. B. (1986). Intonational structure in Japanese and English.Phonology, 3 (1), 255–309.
Beddor, P. (2015). The Relation between Language Users’ Perception and Production Repertoires.In for ICPhS 2015, T. S. C. (Ed.), Proceedings of the 18th International Congress of PhoneticSciences, (pp. Paper 1041.1–9)., Glasgow, UK. The University of Glasgow.
Beddor, P. S. (2009). A Coarticulatory Path to Sound Change. Language, 85 (4), 785–821.
Beddor, P. S., McGowan, K. B., Boland, J. E., Coetzee, A. W., & Brasher, A. (2013). The time courseof perception of coarticulation. Journal of the Acoustical Society of America, 133, 2350–2366.
Bell, A., Brenier, J. M., Gregory, M., Girand, C., & Jurafsky, D. (2009). Predictability e↵ectson durations of content and function words in conversational English. Journal of Memory andLanguage, 60 (1), 92–111.
Bell, A., Jurafsky, D., Fosler-Lussier, E., Girand, C., Gregory, M., & Gildea, D. (2003). E↵ects ofdisfluencies, predictability, and utterance position on word form variation in English conversation.Journal of the Acoustical Society of America, 113 (2), 1001–1024.
Bell-Berti, F. (1975). Control of pharyngeal cavity size for English voiced and voiceless stops. Journalof the Acoustical Society of America, 57, 456–461.
Bermudez-Otero, R. (2015). Amphichronic explanation and the life cycle of phonological processes.In The Oxford handbook of historical phonology (pp. 374–399). Oxford University Press.
Berry, J. & Moyle, M. (2011). Covariation among vowel height e↵ects on acoustic measures. Journalof the Acoustical Society of America, 130 (5), 365–371.
35
Bush, N. (1999). The predictive value of transitional probability for word-boundary palatalization inEnglish. Masters’ thesis, University of New Mexico.
Bybee, J. L. (1985). Morphology: A Study of the Relation Between Meaning and Form. Philadelphia,PA: John Benjamins Publishing.
Bybee, J. L. (2000). The phonology of the lexicon: Evidence from lexical di↵usion. In M. Barlow &S. Kemmer (Eds.), Usage-based models of language (pp. 65–85). Stanford, CA: CSLI.
Bybee, J. L. (2002). Word frequency and context of use in the lexical di↵usion of phoneticallyconditioned sound change. Language Variation and Change, 14, 261–290.
Bybee, J. L. (2012). Patterns of lexical di↵usion and articulatory motivation for sound change. InM.-J. Sole & D. Recasens (Eds.), The Initiation of Sound Change, Perception, Production, andSocial Factors (pp. 210–234). Amsterdam, the Netherlands: Benjamins.
Bybee, J. L. & Hopper, P. (2001). Frequency and the Emergence of Linguistic Structure. JohnBenjamins Publishing.
Chen, M. (1972). The time dimension: contribution toward a theory of sound change. Foundationsof language, 8 (4), 457–498.
Chen, Y. (2011). How does phonology guide phonetics in segment–f0 interaction? Journal ofPhonetics, 39 (4), 612–625.
Cho, T., Jun, S. A., & Ladefoged, P. (2002). Acoustic and aerodynamic correlates of Korean stopsand fricatives. Journal of Phonetics, 30 (2), 193–228.
Cho, T. & Keating, P. (2001). Articulatory and acoustic studies on domain-initial strengthening inKorean. Journal of Phonetics, 29, 155–190.
Cho, T. & Ladefoged, P. (1999). Variation and universals in VOT: evidence from 18 languages.Journal of Phonetics, 27 (2), 207–229.
Clayards, M. (2008). The ideal listener: Making optimal use of acoustic-phonetic cues for wordrecognition. PhD thesis, University of Rochester.
Clayards, M. (2018). Individual talker and token covariation in the production of multiple cues tostop voicing. Phonetica, 75 (1), 1–23.
Coetzee, A. W., Beddor, P. S., & Wissing, D. P. (2014). Emergent tonogenesis in Afrikaans. Journalof the Acoustical Society of America, 135, 2421.
Connell, B. (2002). Tone languages and the universality of intrinsic F0: evidence from Africa. Journalof Phonetics, 30 (1), 101–129.
DiCanio, C. T. (2012). Coarticulation between tone and glottal consonants in Itunyoso Trique.Journal of Phonetics, 40 (1), 162–176.
Douglas, B., Martin, M., Ben, B., & Steve, W. (2015). Fitting linear mixed-e↵ects models usinglme4. Journal of Statistical Software, 67 (1), 1–48.
Eckert, P. (1989). The whole woman: Sex and gender di↵erences in variation. Language Variationand Change, 1 (3), 245–267.
Esposito, A. (2002). On vowel height and consonantal voicing e↵ects: Data from Italian. Phonetica,59, 197–231.
Fant, G., Kruckenberg, A., & Gustafson, K. (2002). A new approach to intonation analysis andsynthesis of Swedish. In Proceedings of Fonetik, TMH-QPSR, (pp. 161–164)., Aix en Provence.
Fischer-Jørgensen, E. (1990). Intrinsic F0 in tense and lax vowels with special reference to German.Phonetica, 47 (3-4), 99–140.
Fruehwald, J. (2016). The early influence of phonology on a phonetic change. Language, 92, 376–410.
Fruehwald, J., Gress-Wright, J., & Wallenberg, J. C. (2013). Phonological rule change: The con-stant rate e↵ect. In Proceedings of the 40th Annual Meeting of the North East Linguistic Society.Massachusetts: GLSA Publications.
Gahl, S. (2008). Time and thyme are not homophones: The e↵ect of lemma frequency on worddurations in spontaneous speech. Language, 84, 474–496.
Gelman, A. & Hill, J. (2007). Data analysis using regression and multilevel/hierarchical models.Cambridge: Cambridge University Press.
36
Gelman, A. & Su, Y.-S. (2015). arm: Data Analysis Using Regression and Multilevel/HierarchicalModels. R package version 1.8-6.
Hagege, C. & Haudricourt, A.-G. (1978). La phonologie panchronique. Paris: Presses Universitairesde France.
Han, M. S. & Weitzman, R. S. . (1967). Studies in the phonology of Asian languages V: Acousticfeatures in the manner-di↵erentiation of Korean stop consonants. In Studies in the phonology ofAsian languages V. Los Angeles: Acoustic Phonetics Research Laboratory, University of SouthernCalifornia.
Han, M. S. & Weitzman, R. S. (1965). Studies in the phonology of Asian Languages III: Acousticcharacteristics of Korean stop consonants. In Studies in the phonology of Asian languages III. LosAngeles: Acoustic Phonetics Research Laboratory, University of Southern California.
Hardcastle, W. J. (1973). Some observations on the tense-lax distinction in initial stops in Korean.Journal of Phonetics, 1, 263–272.
Harrell, F. (2001). Regression modeling strategies: with applications to linear models, logistic regres-sion, and survival analysis. New York: Springer Verlag.
Harrell, J. (2015). Hmisc: Harrell miscellaneous. R package version 3.17-1.
Harrell, J. & Frank, E. (2015). rms: Regression modeling strategies. R package version 4.4-1.
Harrington, J. (2012). The relationship between synchronic variation and diachronic change . In A. C.Cohn, C. Fougeron, & M. K. Hu↵man (Eds.), Handbook of Laboratory Phonology (pp. 321–332).Oxford University Press.
Harrington, J., Kleber, F., Reubold, U., & Siddins, J. (2015). The relationship between prosodicweakening and sound change: evidence from the German tense/lax contrast. Laboratory Phonology,6 (1), 87–117.
Harrington, J., Kleber, F., & Stevens, M. (2016). The Relationship Between the (Mis)-Parsingof Coarticulation in Perception and Sound Change: Evidence from Dissimilation and LanguageAcquisition. In A. Esposito, M. Faundez-Zanuy, A. Esposito, G. Cordasco, T. Drugman, J. Sol-Casals, & F. Morabito (Eds.), In Recent Advances in Nonlinear Speech Processing (pp. 15–34).Switzerland: Springer International Publishing.
Hay, J. & Foulkes, P. (2016). The evolution of medial /t/ over real and remembered time. Language.in press.
Hay, J. B., Pierrehumbert, J. B., Walker, A. J., & LaShell, P. (2015). Tracking word frequency e↵ectsthrough 130 years of sound change. Cognition, 139, 83–91.
Higgins, M. B., Netsell, R., & Schulte, L. (1998). Vowel-related di↵erences in laryngeal articulatoryand phonatory function. Journal of Speech and Hearing Research, 41 (4), 712–724.
Hirose, H. & Gay, T. J. (1972). The activity of the intrinsic laryngeal muscles in voicing control: anelectromyographic study. Phonetica, 25, 140–164.
Hockett, C. F. A. (1958). A course in modern linguistics. New York: Mcmillan.
Hombert, J.-M. (1974). Universals of downdrift: their phonetic basis and significance for a theory oftone. Studies in African Linguistics, 5, 169–183.
Hombert, J.-M. (1977). Consonant types, vowel height and tone in Yoruba. Studies in AfricanLinguistics, 8 (2), 1–18.
Hombert, J.-M., Ohala, J. J., & Ewan, W. (1979). Phonetic explanations for the development oftones. Language, 55 (1), 37–58.
Honda, K. (1983). Relation between pitch contral and vowel articulation. Haskins Laboratories StatusReport on Speech Research, SR 73, 269–282.
Honda, K., Hirai, H., & Dang, J. (1994). A physiological model of speech production and theimplication of tongue-larynx interaction. In Proceedings of the 1994 International Conference onSpoken Language Processing (ICSLP 94), (pp. 157–178)., Yokohama, Japan.
Hoole, P. & Honda, K. (2011). Automaticity vs. feature-enhancement in the control of segmental F0.In G. Clements & N. Ridouane (Eds.), Where Do Phonological Features Come From?: Cognitive,Physical And Developmental Bases Of Distinctive Speech Categories (pp. 131–171). Amsterdam:John Benjamins Publishing Company.
37
Hoole, P., Honda, K., Murano, E., Fuchs, S., & Pape, D. (2006). Go with the flow: Betweenautomaticity and enhancement in control of segmental F0. In Proceedings of the 7th InternationalSeminar on Speech Production.
Hooper, J. B. (1976). Word frequency in lexical di↵usion and the source of morphophonologicalchange. In W. Christie (Ed.), Current progress in historical linguistics (pp. 96–105). Amsterdam:North-Holland.
Hyman, L. M. (1976). Phonologization. In A. Juilland (Ed.), Linguistic Studies O↵ered to JosephGreenberg, volume 2. Saratoge, CA: Anma Libri.
Hyman, L. M. (2008). Universals in phonology. The Linguistic Review, 25, 83–137.
Hyslop, G. (2009). Kurtop tone: a tonogenetic case study. Lingua, 119 (6), 827–845.
Jacewicz, E., Fox, R. A., O’Neill, C., & Salmons, J. (2009). Articulation rate across dialect, age, andgender. Language Variation and Change, 21 (2), 233–256.
Jun, S. A. (1993). The Phonetics and Phonology of Korean prosody. PhD thesis, the Ohio StateUniversity.
Jun, S. A. (1996). Intonational Phonology of Seoul Korean revisited. In the 14th Japanese/KoreanLinguistics conference, (pp. 14–25)., Tucson Arizona. UCLA Working Papers in Phonetics.
Jun, S. A. (1998). The Accentual phrase in the Korean prosodic hierarchy. Phonology, 15, 189–226.
Jun, S. A. (2005). Intonational phonology of Seoul Korean revisited. UCLA Working Papers inPhonetics, 104, 14–25.
Jurafsky, D., Bell, A., Gregory, M., & Raymond, W. D. (2001). Probabilistic relations between words:Evidence from reduction in lexical production. In J. Bybee & P. Hopper (Eds.), Frequency and theEmegernce of Linguistic Structure (pp. 229–254). Amsterdam, The Netherlands: John BenjaminsPublishing Company.
Kang, K.-H. & Guion, S. G. (2008). Clear speech production of Korean stops: changing phonetictargets and enhancement strategies. Journal of the Acoustical Society of America, 124 (6), 3909–3917.
Kang, Y. (2014). Voice Onset Time merger and development of tonal contrast in Seoul Korean stops:A corpus study. Journal of Phonetics, 45, 76–90.
Kang, Y. & Han, S. (2013). Tonogenesis in early Contemporary Seoul Korean: A longitudinal casestudy. Lingua, 134, 62–74.
Kang, Y. & Nagy, N. (2016). VOT Merger in Heritage Korean in Toronto. Language Variation andChange, 28 (2), 249–272.
Kang, Y., Yoon, T.-J., & Han, S. (2015). Frequency e↵ects on the vowel length contrast merger inSeoul Korean. Laboratory Phonology, 6 (3-4), 469–503.
Keating, P., Cho, T., Fougeron, C., & Hsu, C. (2003). Domain-initial articulatory strengthening infour languages. In J. Local, R. Ogden, & R. Temple (Eds.), Papers in Laboratory Phonology VI:Phonetic interpretations (pp. 143–161). Cambridge, UK: Cambridge University Press.
Keshet, J., Sonderegger, M., & Knowles, T. (2014). AutoVOT: A tool for automatic measurementof voice onset time using discriminative structured prediction [Computer program]. Version 0.91.https://github.com/mlml/autovot/.
Kessinger, R. H. & Blumstein, S. E. (1997). E↵ects of speaking rate on voice-onset time in Thai,French, and English. Journal of Phonetics, 25 (2), 143–168.
Kim, C.-W. (1965). On the autonomy of the tensity feature in stop classification. Word, 21, 339–359.
Kim, J. (2016). Perceptual associations between words and speaker age. Journal of the Associationfor Laboratory Phonology, 7 (1), 1–22.
Kim, M.-R., Beddor, P. S., & Horrocks, J. (2002). The contribution of consonantal and vocalicinformation to the perception of Korean initial stops. Journal of Phonetics, 30 (1), 77–100.
Kingston, J. (1992). The phonetics and phonology of perceptually motivated articulatory covariation.Language and Speech, 35, 99–113.
38
Kingston, J. (2005). The phonetics of Athabaskan tonogenesis. In S. Hargus & K. Rice (Eds.),Athabaskan Prosody (pp. 137–184). Amsterdam: Benjamins.
Kingston, J. (2011). Tonogenesis. In M. van Oostendorp, C. J. Ewen, E. Hume, & K. Rice (Eds.),The Blackwell companion to phonology (pp. 2304–2333). Oxford: Oxford University Press.
Kirby, J. & Ladd, D. R. (2015). Stop voicing and f0 perturbations: evidence from French and Italian.In Proceedings of the 18th International Congress of Phonetic Sciences, Glasgow.
Kirby, J. P. (2013). The role of probabilistic enhancement in phonologization. In A. C. L. Yu (Ed.),Origin of Sound Change: Approaches to Phonologization. OUP: Oxford.
Kirby, J. P. (2014). Incipient tonogenesis in Phnom Penh Khmer: Acoustic and perceptual studies.Journal of Phonetics, 43, 69–85.
Klatt, D. H. (1975). Voice onset time, frication, and aspiration in word-initial consonant clusters.Journal of Speech and Hearing Research, 18 (4), 686–706.
Kong, E. J., Beckman, M. E., & Edwards, J. (2011). Why are Korean tense stops acquired so early?:The role of acoustic properties. Journal of Phonetics, 39 (2), 196–211.
Kuznetsova, A., Brockho↵, P. B., & Christensen, R. H. B. (2015). lmertest: Tests in linear mixede↵ects models. R package version 2.0-29.
Labov, W. (1966). The social stratification of English in New York City. Washington, DC: Centerfor Applied Linguistics.
Labov, W. (1990). The intersection of sex and social class in the course of linguistic change. LanguageVariation and Change, 2 (02), 205–254.
Labov, W. (1994). Principles of Linguistic Change, Vol. 1: Internal Factors. Malden, MA: Wiley-Blackwell.
Labov, W. (2001). Principles of Linguistic Change, Social Factors, Vol. 2, Social factors. Oxford:Wiley-Blackwell.
Labov, W. (2007). Transmission and di↵usion. Language, 83, 344–387.
Labov, W. (2010). Principles of Linguistic change. Volume III: Cognitive & Cultural Factors. Oxford:Wiley Blackwell.
Ladd, D. R. & Silverman, K. E. A. (1984). Vowel intrinsic pitch in connected speech. Phonetica, 41,31–40.
Lee, H. & Jongman, A. (2012). E↵ects of tone on the three-way laryngeal distinction in Korean: Anacoustic and aerodynamic comparison of the Seoul and South Kyungsang dialects. Journal of theInternational Phonetic Association, 42 (02), 145–169.
Lee, H., Politzer-Ahles, S., & Jongman, A. (2013). Speakers of tonal and non-tonal Korean dialectsuse di↵erent cue weightings in the perception of the three-way laryngeal stop contrast. Journal ofPhonetics, 41, 117–132.
Lehiste, I. (1976). Suprasegmental features of speech. In N. J. Lass (Ed.), Contemporary Issues inExperimental Phonetics (pp. 225–239). New York: Academic Press.
Lieberman, E., Michel, J.-B., Jackson, J., Tang, T., & Nowak, M. A. (2007). Quantifying theevolutionary dynamics of language. Nature, 449 (7163), 713–716.
Lindblom, B., Guion, S. G., Hura, S., Moon, S.-J., & Willerman, R. (1995). Is sound change adaptive?Rivista di Linguistica, 7, 5–36.
Lisker, L. & Abramson, A. S. (1964). A Cross-language Study of Voicing in Initial Stops: acousticalmeasurements. Word, 20, 384–422.
Lofqvist, A., Baer, T., McGarr, N. S., & Story, R. S. (1989). The cricothyroid muscle in voicingcontrol. Journal of the Acoustical Society of America, 85 (3), 1314–1321.
Maran, L. R. (1973). On becoming a tone language: a Tibeto-Burman model of tonogenesis. Conso-nant types and tone, southern California occasional papers in linguistics, 1, 97–114.
Matiso↵, J. A. (1973). Tonogenesis in Southeast Asia. In L. M. Hyman (Ed.), Consonant Types andTones (pp. 72–95). Southern California Occasional Papers in Linguistics.
Matuschek, H., Kliegl, R., Vasishth, S., Baayen, H., & Bates, D. (2015). Balancing type i error andpower in linear mixed models. arXiv preprint arXiv:1511.01864.
39
Mazaudon, M. & Michaud, A. (2009). Tonal contrasts and initial consonants: a case study of Tamang,a missing linkin tonogenesis. Phonetica, 65 (4), 231–256.
McCrea, C. R. & Morris, R. J. (2005). The e↵ects of fundamental frequency level on voice onset timein normal adult male speakers. Journal of Speech and Hearing Research, 48 (5), 1013–1024.
Miller, J. L., Green, K. P., & Reeves, A. (1986). Speaking rate and segments: A look at the relationbetween speech production and speech perception for the voicing contrast. Phonetica, 43, 106–115.
Misnadin, M., Kirby, J., & Remijsen, B. (2015). Temporal and spectral properties of Madurese stops.In for ICPhS 2015, T. S. C. (Ed.), Proceedings of the 18th International Congress of PhoneticSciences, (pp. Paper 789.1–5)., Glasgow, UK. The University of Glasgow.
Morris, R. J., McCrea, C. R., & Herring, K. D. (2008). Voice onset time di↵erences between adultmales and females: Isolated syllables. Journal of Phonetics, 36 (2), 308–317.
Nolan, F. (2003). Intonational equivalence: an experimental evaluation of pitch scales. In Sole, M.-J., Recasens, D., & Romero, J. (Eds.), Proceedings of the 15th International Congress of PhoneticSciences, Barcelona, Spain.
Ogura, M. (2012). The Timing of Language Change. In J. M. Hernandez-Campoy & J. C.Conde-Silvestre (Eds.), The handbook of historical sociolinguistics (pp. 427–450). Oxford: Wiley-Blackwell.
Oh, E. (2011). E↵ects of speaker gender on voice onset time in Korean stops. Journal of Phonetics,39, 59–67.
Ohala, J. (1981). The Listener as a Source of Sound Change. In C. Masek, R. A. Hendrick, & M. F.Miller (Eds.), Papers from the Parasession on Language and Behavior Chicago Linguistic Society(pp. 178–203). Chicago: Chicago Linguistics Society.
Ohala, J. J. (1978). Production of Tone. In V. A. Fromkin (Ed.), Tone: A linguistic survey (pp.1–18). New York: Academic Press.
Ohala, J. J. (1993a). Sound change as nature’s speech perception experiment. Speech Communication,13 (1), 155–161.
Ohala, J. J. (1993b). The phonetics of sound change. In C. Jones (Ed.), Historical linguistics:Problems and perspectives (pp. 237–278). London: Longman.
Ohala, J. J. (2000). The physiology of tone. In L. Hyman (Ed.), Consonant types and tone (pp.3–14). Los Angeles: University of Southern California.
Ohala, J. J. & Sprouse, R. (2003). E↵ects on speech of introducing aerodynamic perturbations. InProceedings of the 15th International Congress of Phonetic Sciences, Barcelona.
Pan, S. & Hirschberg, J. (2000). Modeling local context for pitch accent prediction. In Proceedingsof the ACL 2000, (pp. 233–240)., Hong Kong.
Park, H. (2002). The Time Courses of F1 and F2 as a Descriptor of Phonation Types. Acta Oto-laryngolical, 33, 87–108.
Phillips, B. S. (1984). Word frequency and the actuation of sound change. Language, 60 (2), 320–342.
Phillips, B. S. (2006). Word frequency and lexical di↵usion. Basingstoke: Palgrave Macmillan.
Pierrehumbert, J. (2002). Word-specific phonetics. In C. Gussenhoven & N.Warner (Eds.), LaboratoryPhonology (pp. 101–139). Berlin: Mouton de Gruyter.
Pierrehumbert, J. B. (2001). Exemplar dynamics: Word frequency, lenition and contrast. In J. L.Bybee & P. Hopper (Eds.), Frequency e↵ects and the emergence of lexical structure (pp. 137–157).Amsterdam: John Benjamins.
Pind, J. (1995). Speaking rate, voice-onset time, and quantity: the search for higher-order invariantsfor two Icelandic speech cues. Perception and Psychophysics, 57 (3), 291–304.
Purcell, E., Villegas, G., & Young, S. (1978). A before and after for tonogenesis. Phonetica, 35 (5),284–293.
Reubold, U. & Harrington, J. (2015). Disassociating the e↵ects of age from phonetic change. InA. Gerstenberg & A. Voeste (Eds.), Language Development: The life span perspective (pp. 9–37).Amsterdam/Philadelphia: John Bensamin Publishing Company.
40
Roubeau, B., Chevrie-Muller, C., & Saint Guily, J. L. (1972). Electromyographic activity of strapand cricothyroid muscles in pitch change. Acta Otolaryngolical, 117, 459–464.
Sanko↵, G. (2004). Adolescents, young adults and the critical period: Two case studies from ’SevenUp’. In C. Fought (Ed.), Sociolinguistic variation: Critical reflections (pp. 121–139). Oxford:Oxford University Press.
Shultz, A. A., Francis, A. L., & Llanos, F. (2012). Di↵erential cue weighting in perception andproduction of consonant voicing. Journal of the Acoustical Society of America, 132 (2), EL95–E101.
Siddins, J. & Harrington, J. (2015). Does vowel intrinsic F0 a↵ect lexical tone? In Proceedings ofthe 18th International Congress of Phonetic Sciences, (pp. 27–43)., Glasgow, Scotland.
Silva, D. J. (2002). Consonant aspiration in Korean: a retrospective. In S.-O. Lee & G. K. Iverson(Eds.), Pathways into Korean language and culture: essays in honor of Young-Key Kim-Renaud(pp. 447–469). Seoul: Pagijong Press.
Silva, D. J. (2006). Acoustic evidence for the emergence of tonal contrast in contemporary Korean.Phonology, 23 (02), 287–308.
Sole, M.-J. (2007). Controlled and mechanical properties in speech: A review of literature. In M.-J.Sole, P. Beddor, & M. Ohala (Eds.), Experimental Approaches to Phonology (pp. 302–321). Oxford:Oxford University Press.
Soltani, M., Ashayeri, H., Modarresi, Y., Salavati, M., & Ghomashchi, H. (2014). Fundamentalfrequency changes of persian speakers across the life span. Journal of Voice, 28 (3), 274–281.
Soskuthy, M. (2015). Understanding change through stability: A computational study of soundchange actuation. Lingua, 163, 40–60.
Stebbins, J. (2010). Usage frequency and articulatory reduction in Vietnamese tonogenesis. PhDthesis, University of Colorado, Boulder.
Stevens, K. (1998). Acoustic Phonetics. MA: MIT Press.
Stevens, M. & Harrington, J. (2014). The individual and the actuation of sound change. Loquens, 1,e003.
Stuart-Smith, J., Sonderegger, M., & Rathcke, T. (2015). The private life of stops: VOT in a real-timecorpus of spontaneous Glaswegian. Laboratory Phonology, 6 (3-4), 505–549.
Svantesson, J.-O. & House, D. (2006). Tone production, tone perception and Kammu tonogenesis.Phonology, 23 (02), 309–333.
The National Institute of the Korean Language (2005). A speech corpus of reading-style standardKorean [DVDs]. Seoul: NIKL.
Titze, I. R. (1989). Physiologic and acoustic di↵erences between male and female voices. Journal ofthe Acoustical Society of America, 85, 1699–1707.
Torre, III, P. & Barlow, J. A. (2009). Age-related changes in acoustic characteristics of adult speech.Journal of Communication Disorders, 42 (5), 324–333.
Torreira, F., Bogels, S., & Levinson, S. C. (2015). Intonational phrasing is necessary for turn-takingin spoken interaction. Journal of Phonetics, 52, 46–57.
Van Hoof, S. & Verhoeven, J. (2011). Intrinsic vowel F0, the size of vowel inventories and secondlanguage acquisition. Journal of Phonetics, 39 (2), 168–177.
Wagner, S. E. (2012). Age grading in sociolinguistic theory. Language and Linguistics Compass,6 (6), 371–382.
Walker, A. & Hay, J. (2011). Congruence between ’word age and ’voice age facilitates lexical access.Laboratory Phonology, 2 (1), 219–237.
Wang, W. S. Y. (1969). Competing changes as a cause of residue. Language, 45, 9–25.
Weinreich, U., Labov, W., & Herzog, M. I. (1968). Empirical Foundations for a Theory of LanguageChange. In W. Lehmann & Y. Malkiel (Eds.), Directions for Historical Linguistics (pp. 95–195).Austin: University of Texas Press.
Whalen, D. H. & Levitt, A. G. (1995). The universality of intrinsic F0 of vowels. Journal of Phonetics,23 (3), 349–366.
41
Whalen, D. H., Levitt, A. G., Hsiao, P.-L., & Smorodinsky, I. (1995). Intrinsic F0 of vowels in thebabbling of 6-, 9-, and 12-month-old French- and English-learning infants. Journal of the AcousticalSociety of America, 97 (4), 2533–2539.
Wright, J. D. (2007). Laryngeal contrast in Seoul Korean. PhD thesis, University of Pennsylvania.
Yip, M. (2002). Tone. Cambridge: Cambridge University Press.
Yoon, J. & Choi, K.-S. (1999). Study on KAIST corpus. CS-TR-99-139, KAIST CS.
Yoon, T.-J. (2014). A corpus-based study on the layered duration in Standard Korean. In M. Ken-stowicz, T. Levin, & R. Masuda (Eds.), Japanese/Korean Linguistics 23. Chicago: University ofChicago Press.
Yoon, T.-J. & Kang, Y. (2014). Monophthong Analysis on a Large-scale Speech Corpus of Read-StyleKorean. Phonetics and Speech Sciences, 6, 139–145.
Zellou, G. & Tamminga, M. (2014). Nasal coarticulation changes over time in Philadelphia English.Journal of Phonetics, 47, 18–35.
Zhao, Y. & Jurafsky, D. (2007). The e↵ect of lexical frequency on tone production. In Proceedingsof the 16th International Congress of Phonetic Sciences, (pp. 477–480)., Saarbrucken.
Zhao, Y. & Jurafsky, D. (2009). The e↵ect of lexical frequency and Lombard reflex on tone hyperar-ticulation. Journal of Phonetics, 37 (2), 231–247.
42
Appendices
Table A1: Summary of fixed-e↵ect coe�cients in the static model of F0 on the subsetteddata(speaker year of birth < 1965)


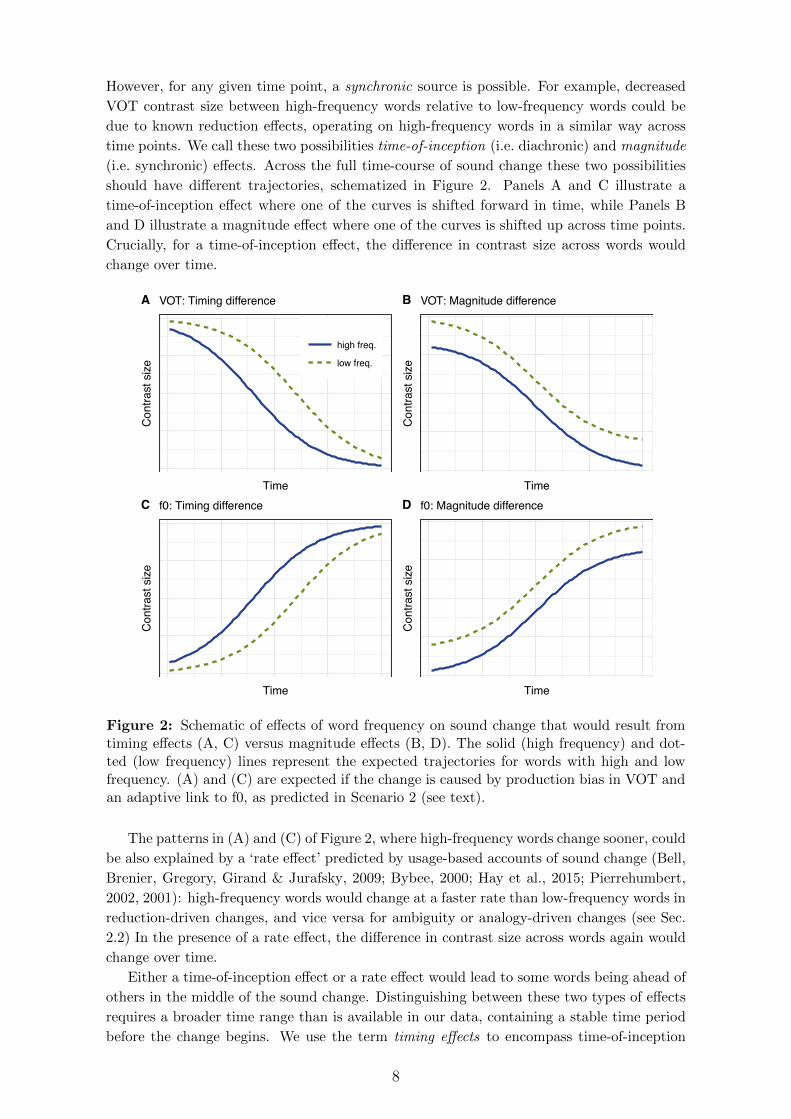


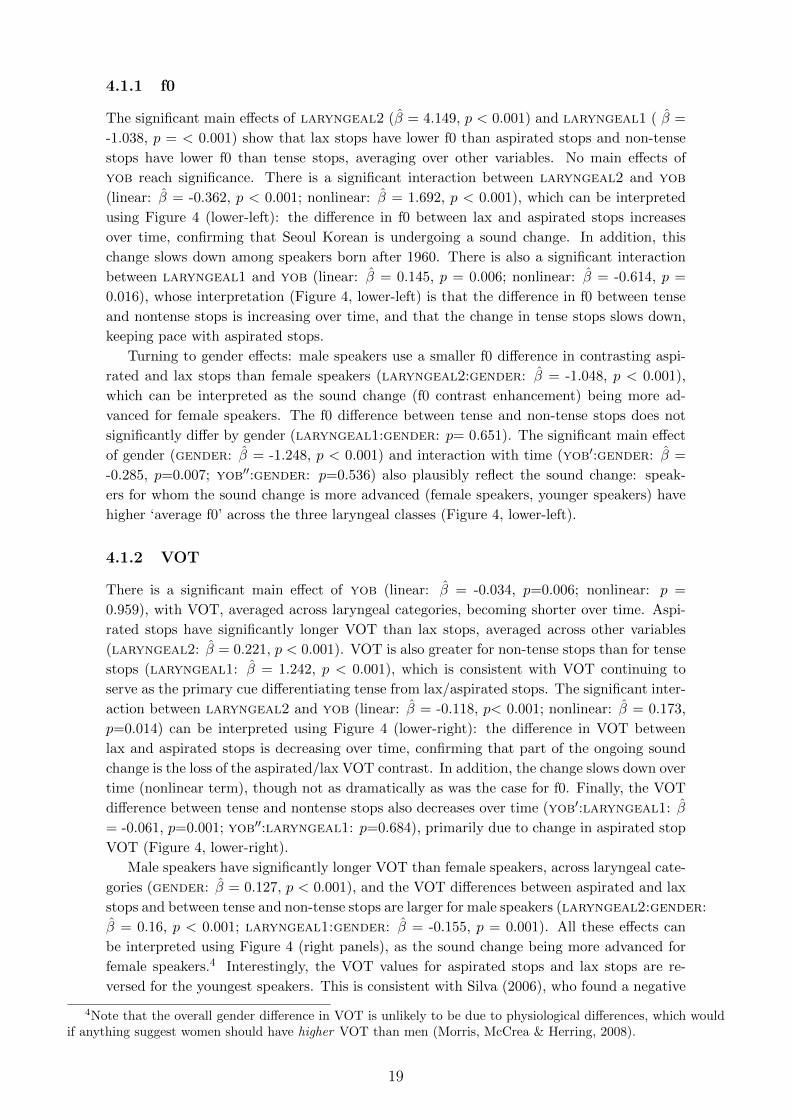


![SoundNet: Learning Sound Representations from Unlabeled …vondrick/soundnet.pdfthe emergence of massive labeled datasets [31, 42, 10] and learned deep representations [17, 33, 10,](https://static.documents.pub/doc/80x56/5f17725fcae7a5753e7d38fa/soundnet-learning-sound-representations-from-unlabeled-vondricksoundnetpdf-the.jpg)


