The Evolving Relation between Earnings, Dividends, and Stock Repurchases* Douglas J. Skinner Graduate School of Business University of Chicago 5807 South Woodlawn Avenue Chicago, IL 60637 [email protected]May 2006 Abstract: There have been fundamental changes in corporate dividend policy over the last several decades (Fama and French, 2001; DeAngelo, DeAngelo, and Skinner, 2000). To shed new light on the disappearance of dividends, this paper examines how the relation between earnings and corporate payout policy changes over the last 50 years. Since 1980, two groups of payers emerge: firms that both pay dividends and make repurchases and firms that only make repurchases. For firms that both pay dividends and make repurchases, managers increasingly coordinate dividend and repurchase decisions in a way that maps total payouts into earnings. Because managers use repurchases to pay out earnings increases, this helps to explain why dividend policy becomes increasingly conservative. The large majority of these firms have paid dividends for decades. Earnings do a good job of explaining payouts for firms that only make repurchases as well, suggesting that newer firms without a dividends history use repurchases in place of dividends. Overall, the evidence suggests that corporate earnings now drive total firm payouts – dividends and repurchases – and that repurchases play an increasingly important role, which helps to explain the disappearance of dividends. _______________________________________________________________________ *My thinking on dividend policy has been significantly influenced by my joint work on this topic with Harry and Linda DeAngelo. This version has benefited from comments by Harry DeAngelo, Linda DeAngelo, and Gene Fama. I am grateful for financial support from the Neubauer Faculty Fellows program at the University of Chicago, Graduate School of Business.
Transcript
The Evolving Relation between Earnings, Dividends, and Stock Repurchases*
Abstract: There have been fundamental changes in corporate dividend policy over the last several decades (Fama and French, 2001; DeAngelo, DeAngelo, and Skinner, 2000). To shed new light on the disappearance of dividends, this paper examines how the relation between earnings and corporate payout policy changes over the last 50 years. Since 1980, two groups of payers emerge: firms that both pay dividends and make repurchases and firms that only make repurchases. For firms that both pay dividends and make repurchases, managers increasingly coordinate dividend and repurchase decisions in a way that maps total payouts into earnings. Because managers use repurchases to pay out earnings increases, this helps to explain why dividend policy becomes increasingly conservative. The large majority of these firms have paid dividends for decades. Earnings do a good job of explaining payouts for firms that only make repurchases as well, suggesting that newer firms without a dividends history use repurchases in place of dividends. Overall, the evidence suggests that corporate earnings now drive total firm payouts – dividends and repurchases – and that repurchases play an increasingly important role, which helps to explain the disappearance of dividends. _______________________________________________________________________ *My thinking on dividend policy has been significantly influenced by my joint work on this topic with Harry and Linda DeAngelo. This version has benefited from comments by Harry DeAngelo, Linda DeAngelo, and Gene Fama. I am grateful for financial support from the Neubauer Faculty Fellows program at the University of Chicago, Graduate School of Business.
1
1. Introduction
Fama and French (2001) provide evidence that the number of listed US firms
paying cash dividends declines dramatically after 1978, and that this can only be partly
attributed to changes in the characteristics of publicly-held firms. DeAngelo, DeAngelo
and Skinner (2000) show that the use of special dividends by listed US firms as a means of
making discretionary payouts has all but disappeared. Both papers argue that the
emergence of repurchases as an alternative means of distributing cash to stockholders is
unlikely to explain their findings. On the other hand, Grullon and Michaely (2002)
provide evidence that repurchases serve as substitutes for dividends. Overall, the question
of why firms are less likely to pay dividends, along with the relation of repurchases to this
phenomenon, remains unresolved in corporate finance.
Traditionally, earnings are the key driver of dividend payouts (Lintner, 1956; Fama
and Babiak, 1968). In this paper, I link changes in corporate payout policy – dividends and
repurchases – to changes in the nature of reported earnings to provide evidence on how and
why payout policy changes over the last 50 years. The key finding is that the relation
between earnings and payouts remains almost as strong today as it was in the 1950s and
1960s. While this is surprising in light of a weaker relation between dividends and
earnings, I find that there are now two principal groups of payers, and that the relation
between earnings and payouts for each of these sets of firms remains strong. Repurchases
are now an important part of firms’ ongoing payout policy, and are now used either by
themselves (for firms that did not pay dividends) or in conjunction with dividends (for
firms that traditionally paid dividends) to distribute earnings to stockholders.
2
There have been several significant changes in the nature of corporate payout
policy and reported earnings over the last 30 years or so. Fama and French (2001) report
that the proportion of listed US firms paying regular cash dividends declines from 66.5%
in 1978 to 20.8% in 1999, and DeAngelo, DeAngelo and Skinner (2000) show that special
dividends, long an important component of firms’ payout policies, have all but disappeared
as a way of distributing cash to stockholders on a regular basis. DeAngelo, DeAngelo and
Skinner (2004) report that aggregate regular dividends paid by US firms increase over the
same period, and show that this is due to a large increase in the concentration of dividend
payments. Repurchases emerge as an economically significant phenomenon in the early
1980s (Bagwell and Shoven, 1989) and have grown considerably since that time to the
point that aggregate repurchases are of approximately the same magnitude as aggregate
dividends.1 The approximate correspondence in the timing of the shifts in dividend policy
and repurchases leads to the idea that repurchases substitute for dividends although there
are other explanations for repurchases, including signaling, the funding of corporate
acquisitions, management of the dilutive effects of employee stock option (ESO) plans,
and the management of reported EPS (see Allen and Michaely, 2003; Brav et al., 2005).
With regard to earnings, previous research documents: (i) a large increase in the
frequency and magnitude of losses along with a corresponding increase in the frequency
and magnitude of negative special items (Hayn, 1995; Collins, Maydew and Weiss, 1997),
(ii) an increase in the concentration of corporate earnings,2 (iii) a surge in the number of
new lists, increasing left skewness in the profitability of these firms, and a corresponding
1 My numbers show that in fiscal 2004 (net) repurchases for US industrials were $155 billion while dividends were around $137 billion. In fiscal 2003, repurchases total $104 billion while dividends totaled $119 billion. 2 In fiscal 2000 over half of aggregate Compustat earnings are due to the 25 firms reporting the largest earnings (DeAngelo, DeAngelo and Skinner, 2004)
3
increase in the left skewness of the overall earnings distribution (Fama and French, 2004).
Overall, the cross-sectional distribution of earnings is considerably more variable after
1980.
I connect these regularities in a way that helps explain the disappearance of
dividends and how it relates to the emergence of stock repurchases. I confirm that
dividend policy has become increasingly conservative over the last several decades: the
median annual dividend increase, while always smaller in magnitude than dividend
decreases, is now 11% compared to a median decrease of 38% (the discrepancy is even
larger – 7% versus 43% – for firms that have paid dividends for 40 years or more). In
addition, the proportion of firms that increase dividends declines while the proportion of
firms that hold dividends constant increases. I use the Lintner (1956) model to examine
how the relation between dividends and earnings changes over time, and find that the
relation weakens considerably after 1980, in conjunction with managers’ increasing
reluctance to increase dividends.3
The strength of the relation between earnings and firm payouts increases when
dividends and repurchases are combined, and varies across different payer groups. Two
groups of payers emerge since 1980: firms that consistently pay both dividends and
repurchases, and firms that only make repurchases; few firms pay dividends without also
making repurchases. For firms that both pay dividends and make repurchases, the relation
between earnings and total payout is strong, supporting the idea that these firms are now
more likely to use repurchases to pay out earnings increases, which helps explain the
increasing reluctance to increase dividends. I also show that the strength of the relation
between earnings changes and changes in repurchases increases from the 1980s to the 3 Choe (1990) also reports evidence that the relation between earnings and dividends weakens over time.
4
present, and that there is an increasingly strong relation between dividend changes and
changes in repurchases over the same period. I show that earnings do an equally good job
of explaining payouts for firms that only make repurchases, suggesting that these are firms
that in earlier times would have initiated dividends (Fama and French, 2001; Grullon and
Michaely, 2002).
The strength of the relation between earnings and payouts increases further when
the unit of estimation is lengthened to two years (as opposed to one year), suggesting that
managers make decisions about total payout based on earnings over a multi-year horizon.
These results suggest that managers set the level of total payouts on the basis of earnings
over a two year window but retain the flexibility to time repurchases based on other
considerations, such as when the stock price is relatively low, for signaling reasons, to fund
acquisitions, or to offset the dilutive effects of ESO programs. This evidence also supports
the idea that repurchases now serve the role that special dividends served in earlier periods
(e.g., Brickley, 1983; DeAngelo et al., 2000); that is, repurchases are now used to
distribute more transitory earnings increases, and that managers can perhaps better assess
this over a multi-year horizon (see also Jagannathan, Stephens, and Weisbach, 2000; Guay
and Harford, 2000).
There is evidence of a systematic relation between losses and payout policy,
consistent with earlier evidence in DeAngelo, DeAngelo, and Skinner (1992). Losses are
unusual among firms that pay both dividends and make repurchases, more common among
firms that only make repurchases, and commonplace among firms that do not pay out cash
to stockholders. Thus, losses continue to be an important determinant of payout policy.
Perhaps because it is difficult for firms that report losses to pay dividends (for institutional,
5
including legal, reasons), firms that initiate payouts now do so almost exclusively through
repurchases, which are less likely to be constrained in these ways.4 When firms that pay
out cash to stockholders do report losses those losses are more likely to be transitory
(attributable to special items) than losses reported by non-payers. Thus, it is again the case
that changes in the cross-sectional distribution of earnings – in this case the relative
frequency and persistence of losses – map closely into changes in the distribution of firm
payouts. In all tests, the strength of the relation between earnings and payouts becomes
stronger when I adjust for the effect of the (transitory, non-cash) special items included in
earnings, which are now both large and frequent.
For the period after 1979, I provide evidence on how firms that both pay dividends
and make repurchases differ from those that only make repurchases, as well as on variables
that explain the mix of dividends and repurchases for firms that pay both. Firms that pay
both dividends and repurchases are larger, have relatively larger retained earnings, and
have fewer growth opportunities than firms that only make repurchases. These attributes
are those traditionally associated with dividend-payers (Smith and Watts, 1992; Fama and
French, 2001; DeAngelo, DeAngelo, and Stulz, 2005). These are almost exclusively firms
that paid dividends in 1980; firms that now consistently pay both dividends and
repurchases are the same firms that traditionally paid dividends. In contrast, firms that
consistently only make repurchases after 1980 did not pay dividends in 1980. This implies
that firms that continue to pay dividends are largely firms with a history of paying
dividends, the large majority of which now make repurchases as well. Conversely, newer
firms with no history of paying dividends (like Cisco and Dell) tend to rely exclusively on
4 For example, debt covenants often restrict dividends to some function of retained earnings, and corporate law sometimes does the same thing. The restrictions are less likely to apply to repurchases.
6
stock repurchases and are unlikely to initiate dividends, helping to explain the declining
propensity to pay dividends.
For firms that pay both dividends and repurchases, I am not able to explain cross-
sectional variation in the mix of dividends and repurchases, suggesting that these payout
mechanisms are now largely interchangeable.5 This suggests that while earnings affect the
level of these firms’ payouts, earnings do not greatly affect the form of those payouts.
Over the period from 1980 to the present, these firms display an increasing tendency to use
repurchases rather than dividends; repurchases now represent about half of total payouts.
These firms now pay out over half of their earnings, and these payouts account for about
85% of aggregate payouts for listed firms. This is consistent with suggestions in Fama and
French (2001) and DeAngelo et al. (2004) that repurchases as well as dividends are now
concentrated among a relatively small group of payers that dominate the distribution of
aggregate earnings.6 Overall, the evidence also supports the contention in DeAngelo et al.
(2004) that industrial firms now exhibit a two-tiered structure in which a relatively small
number of firms dominate the supply of both earnings and payouts. In addition, these
findings cast further doubt on the notion that dividend changes provide information about
changes in future earnings (see also DeAngelo et al., 2004; Grullon et al., 2005).
Section 2 provides evidence on trends in earnings and payout policy from the 1950s
to the present to help motivate the subsequent empirical analyses. Section 3 reports
5 The only variable that consistently explains the mix of dividends and repurchases is an ESO-driven dilution measure, which is positively related to the extent to which firms use repurchases in the years since 2000 (e.g., Kahle, 2002; Bens et al., 2003). 6 Consistent with the suggestion in DeAngelo et al. (2004), I show that repurchases are nearly as highly concentrated as dividends. In 2003, for example, 49.7% of total payouts (dividends plus net repurchases) were provided by the 25 firms with the largest payouts, which also accounted for 48.7% of total net repurchases and 50.8% of total dividends. These proportions were 50.0%, 50.2%, and 49.8%, respectively, in 2002.
7
evidence on how the relation between earnings and payouts evolves over this period and
connects these findings to the disappearance of dividends. Section 4 concludes.
2. Aggregate Data on Earnings, Dividends, and Repurchases
Figures 1, 2, and 3 show the main time-series features of the earnings and payout data that
help motivate the empirical analyses. (The numbers underlying Figure 1 are tabulated in
the Appendix.) Because I use Annual Compustat, the time-series begins in the early 1950s
and ends in 2004.7
Figure 1 shows that aggregate Compustat earnings become increasingly volatile
over time. Part of this increasing volatility is due to the increasing frequency and
magnitude of losses, due in turn to an increasing frequency and magnitude of special items.
In F2001 Compustat firms collectively report special items of -$331 billion, which causes
aggregate Compustat earnings to be -$120 billion. This trend has been discussed in a
number of papers, along with various explanations. Some ascribe it to a change in the
nature of accounting policy over time,8 but the overall increase in earnings volatility is
unlikely to be solely due to accounting changes. Fama and French (2001, 2004) report a
shift in the nature of firms that go public over this period, with an increasing tendency for
firms to go public when they are less profitable. Klein and Marquardt (2006) argue that
economic factors are at least as important as accounting factors in explaining the
increasing prevalence of losses.
7 The data used are from Compustat Industrial Annual, as made available through WRDS. Following Fama and French (2001) and DeAngelo et al. (2004), I remove financial and utility firms, as well as firms not incorporated in the US. 8 The increase in losses could reflect an increase in accounting conservatism (e.g., Basu, 1997) and/or an increase in bath-taking, a form of earnings management. Papers that document the increasing prevalence of losses and/or negative special items include Hayn, 1995; Collins, Maydew and Weiss, 1997; Joos and Plesko, 2005; Klein and Marquardt, 2006.
8
Aggregate dividends increase smoothly during the entire period and do not display
the increase in volatility evident in the earnings time series. This suggests that the
traditionally strong relation between earnings and dividends (Fama and Babiak, 1968)
weakens over this period, as documented by Choe (1990).
The emergence of stock repurchases as a significant payout mechanism in the early
1980s is also evident in Figure 1 (e.g., Bagwell and Shoven, 1983; Grullon and Michaely,
2002). In 1998, aggregate (net) repurchases outstrip aggregate dividends for the first time,
and did so again in 1999, 2000, and 2004.9 This is at least partly driven by an increase in
the number of firms repurchasing shares, which also increases noticeably in the late 1990s
(Figure 2).
Because dividends are traditionally related to firms’ ongoing, sustainable earnings
stream (e.g., Miller and Rock, 1985; Miller, 1986), the approximately concurrent changes
in the time series of earnings and dividends, along with the rise of repurchases, raises the
question of how the relation between payout policy and earnings changes over time, which
is the principal research question that I address in this paper.
Figure 2 provides counts of the number of firms in each year that fall into each of
four groups: (1) firms that pay both dividends and repurchases, (2) firms that pay only
9 Following Fama and French (2001), I measure repurchases as net repurchases; i.e., after removing from share purchases the effect of shares issued for employee stock option programs, to fund acquisitions, and for other corporate purposes. I follow their approach of using the increase in common treasury stock (Compustat #226) if the firm uses the treasury stock method for repurchases. If the firm uses the ‘retirement’ method instead (which I infer from the fact that treasury stock is zero in the current and prior year), I measure repurchases as the difference between stock purchases (#115) and stock issuances (#108) from the statement of cash flows. If either of these amounts (the change in treasury stock or the difference between #115 and #108) is negative, repurchases are set to zero. It is preferable to use the change in treasury stock, if available, rather than net purchases (#115 - #108) because the change in treasury stock nets out any associated issuances, including non-cash issuances. For example, in 2002 IBM made net stock purchases of about $3.1 billion but then issued about the same amount in treasury shares for three purposes – to employees under stock option plans, to fund the acquisition of PwCC, and to help fund its pension plan – so that the net increase in treasury stock was close to zero. A number of prominent repurchasers, including Microsoft, Intel, and Cisco Systems, do not use the treasury stock method.
9
repurchases, (3) firms that pay only dividends, (4) firms that do not pay out cash to
stockholders. This approach understates the number of firms that both pay dividends and
make repurchases (group (1)) and overstates the number of firms that only pay dividends
(group (3)) if firms with an ongoing policy of paying dividends and repurchases do not
make repurchases in every year. For example, these firms may choose to make
repurchases only in those years when earnings increase by amounts that exceed a long-run
sustainable growth rate, since one of the advantages of repurchases over regular dividends
is that firms are not committed to making a certain level of payments every year (e.g., see
Jagannathan et al., 2000; Guay and Harford, 2000). In this sense, they are similar to the
traditional role of special dividends (Brickley, 1983; DeAngelo et al., 2000).
Consistent with Fama and French (2001), Figure 2 shows a large increase in the
number of non-payers over the sample period and that the number of dividend-payers
declines beginning in the late 1970s. The number of firms that both make repurchases and
pay dividends in any given year is relatively stable from 1973 onwards, varying in the
range of 500-700 firms, although the dollar magnitude of repurchases is not economically
significant until about 1983 (Figure 1). The number of firms that only make repurchases
increases gradually over the sample period, from 300-400 in the 1970s to 500-700 in the
1980s, before increasing sharply in the mid- to late-1990s to levels well over 1,000, before
falling back in the last couple of years. The declining number of pure dividend-payers
along with the increasing number of repurchasers and the emergence of firms paying both
dividends and repurchases is consistent with the idea that the emergence of repurchases
helps explain the disappearance of dividends.
10
Because Figure 2 does not consider firms’ payout policies over time, I compute the
number of firms that pay dividends and repurchases on a consistent basis in the years after
1979 (results not tabulated). The findings indicate that there are now two groups of payers
because, over the last 25 years or so, few firms consistently pay dividends without also
making repurchases. Only 12 (82) firms pay dividends for at least 20 (10) years in the
period after 1979 without also making repurchases, and only 90 (383) firms pay dividends
for at least 20 (10) years in this period while making repurchases in five or fewer years.
In the period after 1979, 400 (330) firms pay dividends in 15 (20) or more years
and make repurchases in ten or more years, so that around 400 firms consistently pay both
dividends and repurchases. Firms that only make repurchases are also a significant group:
3,909 firms make at least one repurchase but do not pay dividends during this period, while
628 firms make repurchases in five or more years without paying dividends. This indicates
that there are now two significant groups of payer firms, with markedly different policies.
I show later that firms in the former group are typically those that have a history of paying
dividends, while firms in the latter group have not ever paid dividends.
Figure 3 shows that firms that both pay dividends and make repurchases dominate
the distribution of aggregate payouts. Figure 3 plots the share of aggregate payout
attributable to each of the three groups of payers, beginning in 1971 when firms first
repurchase stock (as in Figure 2, this figure classifies payers into three groups). Before the
mid-1980s, dividend-payers dominate the overall supply of cash payouts, contributing 60-
80% of the total. Around 1984, however, there is a significant transition with the
proportion of total payout attributable to dividend-payers dropping sharply while the
proportion attributable to firms paying both increases sharply. By the late 1980s, firms
11
making both types of payouts dominate the supply of total payout, with over 70% of the
total in most years since 1995. Conversely, the proportion attributable to firms that only
pay dividends drops to around 20-25% in most years since 1998. Because these two
groups of firm/year observations really represent the same set of payer firms, these
proportions should be combined, implying that firms that pay both now contribute around
85% of total payout.
For most of the period since repurchases begin in the early 1970s, firms that only
make repurchases contribute trivially to total payout, with around 1% of payouts in the
1970s and less than 5% of payouts in most of the 1980s and early 1990s. There is a
noticeable increase, however, in the mid-1990s, with the proportion of payouts attributable
to these firms increasing to around 15%, which may reflect the increasing influence of
ESO programs on stock repurchases (e.g., see Kahle, 2002) and/or an increasing tendency
for firms to issue shares to finance mergers and acquisitions (Fama and French, 2001).
Another (non-mutually exclusive) possibility is that more newly-listed firms are simply
choosing not to pay dividends as they grow and mature. Under this view, these firms’
repurchases would be made as part of an ongoing payout policy, and so would depend on
their earnings, but in a different way to those of firms that also pay dividends, a
proposition that I test below.
3. Empirical Analyses
Section 3.1 provides evidence on changes in the nature of dividend policy over the sample
period and on the relation between dividend changes and changes in repurchases. Section
3.2 provides evidence on the relation between earnings, dividends, and repurchases, and
how that relation changes over the sample period. Section 3.3 provides evidence on
12
differences between the firms that pay both dividends and make repurchases and those that
only make repurchases, on differences between repurchasers and non-payers, and on
factors that affect the mix of repurchases and dividends for the firms that pay both.
3.1 The relation between dividend and repurchases
I first provide evidence on changes in payout policy over the period since the 1950s, and in
particular on the relation between dividends and stock repurchases. To show trends more
clearly, I partition the data by decade, from the 1950s until the 2000s.
Table 1 reports on two aspects of dividend policy. First, the table shows the
relative frequency of increases, decreases, and no-changes in dividends from one (fiscal)
year to the next. Second, I report on the magnitude of the increases and decreases,
measured as percentage changes. Because some of these series are affected by changes in
the set of listed firms over time (such as the introduction of NASDAQ firms in the 1970s),
I report these data for: (i) all firm/years with available data, and (ii) the set of firms with
data available for at least 40 years (“long-dividend payers”).
Two clear trends are evident in Table 1, both of which show that dividend policy
becomes more conservative over the sample period. First, while the proportion of dividend
decreases stays relatively constant over this period, at around 10% overall and slightly less
than that for long-dividend payers, managers are more reluctant to increase dividends in
the 1990s and 2000s than in the 1970s and 1980s, and are more likely to hold dividends at
a constant level. For the long-dividend payers, the proportion of dividend increases falls
from 74% in the 1970s and 1980s to 63% in the 1990s and 49% in the 2000s, with
corresponding increases in the proportion of no-change observations, from around 20% in
13
the 1970s and 1980s, to 30% in the 1990s, and 42% in the 2000s. The changes are similar
but slightly less pronounced for the overall sample.
Second, there a consistent decline in the magnitude of dividend increases and a
consistent increase in the magnitude of dividend decreases, trends that are again more
pronounced for long dividend-payers. For these firms, the median dividend increase falls
from 13.8% in the 1950s, to 11.1% in the 1970s and 1980s, to 9.1% in the 1990s, and to
6.8% in the 2000s. In contrast, the size of the median decrease increases from 17.9% in
the 1960s, to 20% in the 1980s, to 33.3% in the 1990s, and to 42.9% in the 2000s.
Overall, this evidence suggests that dividend policy becomes increasingly
asymmetric over the sample period, consistent with an increasing reluctance to increase
dividends. One possible explanation for this trend is that earnings increases are less
sustainable than in the past, due to the increase in earnings volatility shown in Figure 1.
Alternatively, it could be that the attributes of earnings for those firms that pay dividends
do not change but that managers adapt their payout policies to include repurchases on an
ongoing basis. If this is the case I expect that managers are more likely to increase payouts
by using stock repurchases than dividends, and that dividend and repurchase decisions are
increasingly coordinated for those firms that pay both.
To test this, Table 2 presents evidence on how changes in dividends and
repurchases are related for those firms that pay both dividends and repurchases. For each
decade beginning in the 1970s, I present contingency tables of the relative frequency of
increases, decreases, and no-changes in dividends and repurchases. All firm-years with
dividend data in consecutive years are included.10
10 The table will thus include data for the group of firms that both repurchase shares and pay dividends but not for those firms that only make repurchases. As before, changes in dividends are computed on a per-share
14
Table 2 shows little evidence of a relation between dividends and repurchases in
the 1970s. Firms increase repurchases in 18% of firm/years, decrease repurchases in 18%
of firm/years, and hold repurchases constant in 64% of firm/years (the large majority of
these are cases where no repurchases are made in either year). These proportions are
similar across the three dividend change groups. As the decades progress, however, there
is increasing evidence of a relation between dividends and repurchases: as we move from
the dividend decrease to the no-change to the increase group, the proportion of firms that
increase repurchases increases while the proportion of firms that hold repurchases constant
falls. In the 1980s, the proportion of firm/years that increase repurchases increases from
17% in the dividend-decrease group to 23% in the no-change group and 24% in the
dividend-increase group, with corresponding decreases in the proportion of firm/years for
which repurchases do not change. This trend is stronger in the 1990s (for which the
increase proportions are 20%, 27%, and 33%, respectively) and the 2000s (for which the
proportions are 17%, 26%, and 32%, respectively).11 This is evidence of an increasing
complementarity between firms’ dividend and repurchase decisions, suggesting that
managers of firms that pay both dividends and repurchases make these decisions as part of
a coordinated payout policy. The next section investigates the extent to which these
payouts are linked to earnings.
3.2 The Relation between Earnings and Payout Policy
This section reports evidence on changes in the relation between earnings, dividends, and
repurchases. I first present evidence on whether changes in the relative frequency and
basis. However, because repurchases are not usually considered as a per-share number, changes in repurchases are defined using total repurchases for a given firm-year. 11 Although in the 2000s, the proportion of decrease shows some tendency to increase across the groups. There is no such tendency in the 1990s.
15
persistence of losses explain changes in the nature of payout policy. DeAngelo, DeAngelo
and Skinner (1992) find that losses are essentially a necessary condition for dividend
reductions or omissions, but that less persistent losses – those largely attributable to
accounting write-offs and other similar “special items” – are less likely to lead to dividend
reductions/omissions, presumably because these items are more likely to be transitory,
increasing the likelihood the losses will reverse. Given the substantial increase in the
prevalence of losses and special items discussed in Section 2, it seems likely that the
changing frequency and nature of reported losses will affect payout policy, and could help
explain the disappearance of dividends.
Table 3 presents evidence on the relation between losses, special items, and payout
policy for each decade in the sample period. The table first reports the frequency of losses.
Consistent with prior research, the fraction of Compustat firms reporting losses increases
from less than 10% in the 1950s and 1960s to over 40% in the 1990s and over 50% in the
2000s. There is a corresponding increase in the fraction of firms reporting negative special
items, from less than 10% of firm/years in the 1950s, 1960s, and 1970s, to 20% in the
1980s, 32% in the 1990s, and 44% in the 2000s. I also report on how many of these losses
are primarily attributable to special items and so relatively transitory, which makes it less
likely they will affect payouts. I define a loss as largely transitory when the pretax
magnitude of special items is 80% or more of the bottom-line reported loss (to the extent
the special items are taxable, this implies they account for roughly 50% or more of the
bottom-line loss).12 Many, although certainly not the majority, of these losses are largely
attributable to special items, with the fraction of largely transitory losses increasing to
around 12% in the 1990s and 2000s, from around 6% in previous decades. 12 This assumes a tax rate of 40%. The results are not very sensitive to this cutoff.
16
Consistent with the evidence in DeAngelo et al. (1992), the fraction of losses
among dividend-payers is low, although it increases over the sample period. Before the
1980s, losses among dividend-payers were rare, occurring less than 3% of the time. As
with losses in general, however, the fraction of dividend-payers with losses increases over
the sample period – to 9.1% in the 1980s, 11.1% in the 1990s, and 13.5% in the 2000s.
The table also shows that a disproportionate fraction of dividend-payer losses are largely
transitory. The fraction of dividend-payer losses largely attributable to special items is
31.5% compared to 10.0% for the sample overall, a difference that persists throughout the
sample period.13 The fact that losses continue to be relatively uncommon among dividend-
payers, coupled with the large increase in the overall fraction of firms that report losses, is
consistent with the Fama and French (2001) finding that the increasing fraction of
unprofitable public firms helps explain the decline in the number of dividend payers.
Losses are even less frequent among firms that both pay dividends and make
repurchases. The fraction of years in which firms make both forms of payout and report
losses is 6.5% for the full sample period and only 8% in the 1990s and 2000s (this
compares to an overall fraction of 30%-40%, and 11%-14% for dividend firm/years).
Moreover, a relatively large fraction of these losses are largely transitory – 42.9% across
all decades, and over 50% in the 1990s and 2000s. These numbers show that firms are
unlikely to pay dividends and repurchases in years when they report losses, and when they
do those losses are often due to largely transitory special items. Overall, this evidence
supports the idea that those firms now paying both dividends and repurchases are the same
firms that previously paid dividends, a result that emerges more clearly in Section 3.3.
13 The differences in proportions across payer groups discussed in this section are all statistically significant at the 1% level or better.
17
The relation between losses and repurchases is not as strong as that for dividends.
Although the fraction of loss firm/years in which firms make repurchases is lower than the
overall fraction of losses (21.1% versus 33.4%) it is higher than for dividend payers
(6.6%). This indicates that firms often repurchase shares in spite of losses, and suggests
that the increasing extent of losses among public firms may help explain the transition to
repurchases and away from dividends.
To summarize, firms are unlikely to pay dividends, especially both dividends and
repurchases, in years when they report losses. When firms do pay dividends and
repurchases in conjunction with losses, those losses are more likely to be transitory. This
is not nearly as true for firms that make repurchases but do not pay dividends. Losses,
especially persistent losses, are most common among firms that do not pay out cash to
stockholders. All of this is evidence that earnings – in this case losses and the nature of
those losses – are strongly associated with payout policy. Perhaps more important, this
evidence suggests that the large change in the extent and nature of reported losses helps
explain not only why fewer firms make payouts, but also the form of those payouts:
dividends remain the province of firms that rarely report losses while firms that report
losses are more likely to use repurchases.
To provide more general evidence on whether changes in earnings help to explain
changes in firms’ payouts, I next provide evidence on the relation between earnings,
dividends, and repurchases, how this relation changes over time, and whether this relation
varies systematically between firms that pay both dividends and repurchases and firms that
only make repurchases. On the latter point, it seems likely, especially given the evidence
in Table 2 that firms that pay both dividends and repurchases do so as part of a coordinated
18
policy, that their overall payouts depend on earnings. This may also be true of firms that
only make repurchases, especially if these are firms that initiate payouts but decide not to
pay dividends. Alternatively, for firms that only make repurchases, payouts are more
likely to be driven by non-earnings factors, such as signaling that their stock is
undervalued (e.g., Ikenberry, Lakonishok, and Vermaelen, 1995), distributing transitory
cash windfalls (Guay and Harford, 2000; Jagannathan, Stephens and Weisbach, 2000),
funding acquisitions (Fama and French, 2001), or offsetting the dilutive effects of ESO
plans (e.g., Kahle, 2002; Bens et al., 2003).
I first plot total earnings (adjusted for special items) and payouts for firms that both
pay dividends and make repurchases (Figure 4) and firms that only make repurchases
(Figure 5). Consistent with the notion that these two sets of firms’ payout policies are
systematically different, these figures present a clearer picture of the relation between
payouts and earnings than Figure 1, which combines these series as well as earnings for
non-payers. For firms that pay both dividends and repurchases, Figure 4a shows that
dividends and repurchases, considered separately, are loosely tied to earnings. However,
consistent with the prediction that these firms coordinate their dividend and repurchase
policies in a manner that is related to earnings, when these series are combined (Figure 4b)
total payouts track earnings closely. Figure 5 shows that (adjusted) earnings also track
payouts fairly well for those firms that only make repurchases. This relation breaks down
in 2001 and 2002 when these firms report large losses but returns in 2003 and 2004.
Overall, the evidence in Figures 4 and 5 supports the view that earnings does a good job of
explaining payouts for both sets of payers, albeit in different ways.
19
To more formally investigate the relation between these two groups’ earnings and
payouts, I estimate Lintner model regressions.14 I first estimate the following traditional
(dividends) form of the model:
ΔDt = α0 + α1.Et + α2.Dt-1 + ut …………………………………………………..…(1)
I then report results that modify the traditional model in two ways. First, rather than using
bottom-line earnings (net income) as the earnings measure, I adjust earnings to remove the
effect of special items.15 Second, based on the argument that managers now think about
payout policy in terms of the overall level of cash paid out, I estimate a total payout
version of (1):
ΔPayt = α0 + α1.Et + α2.Payt-1 + ut ………………………………………..………..(2)
Where Payt is the sum of dividends and repurchases in a given firm/year. I estimate these
models both on a time-series basis by firm (Table 4) and using pooled cross-sectional time-
series data with standard errors clustered at the firm level (Table 5). All regressions are
estimated using nominal dollars (the regressions generally have higher R-squares and
larger t-statistics if I convert these amounts into real dollars). To investigate whether and
to what extent the relation between earnings and payout policy is affected by the changes
in the earnings time-series and by the changes in payout policy discussed above, I estimate
these regressions for two subperiods, 1953-1979 and 1980-2004.16 Because I am
interested in the extent to which earnings determines payout policy across the two groups
14 These regressions have a long history in the dividends literature (Fama and Babiak, 1968). 15 I add-back 60% of special items, which assumes an effective tax rate of 40%. 16 There are several reasons for splitting the time series at this point. First, it divides the overall sample period approximately in half, maximizing the power of time-series regressions. Second, several significant changes occur at about this time: (i) the increase in earnings volatility and the related increase in the prevalence of losses and special items begins about this time; (ii) the declining number of dividend-payers and the corresponding increase in the concentration of dividend payments begins in the late 1970s, with the peak in the number of dividend-payers occurring in 1979 (Fama and French, 2001; DeAngelo et al., 2004); (iii) although firms repurchase stock during the 1970s, repurchases do not become an economically significant phenomenon until the first part of the 1980s (e.g., see Bagwell and Shoven, 1988).
20
of payers, I estimate these regressions separately for the two groups in the second
subperiod. To investigate the prediction that managers make their payout decisions over
windows longer than one year, Table 6 presents results that use two year estimation
windows.
In these regressions, the coefficient on lagged payout is the (negative of the) speed
of adjustment coefficient while that on earnings is the product of the payout ratio and the
speed of adjustment coefficient. Because I expect firms’ repurchase decisions to reflect
more transitory earnings changes while dividend changes reflect firms’ long-run,
sustainable earnings, the speed of adjustment should be higher (closer to one) for
repurchases than for dividends. If managers are more reluctant to increase dividends in the
second subperiod, I expect the speed of adjustment coefficient for dividends to decline.
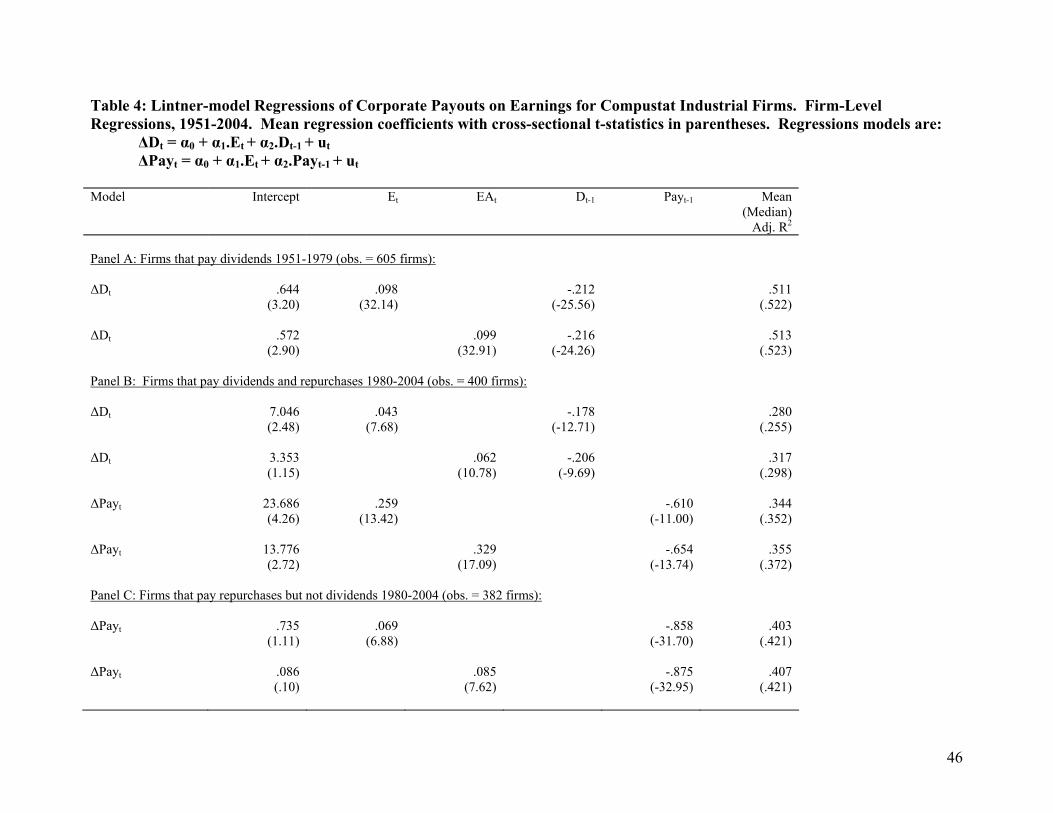
Table 4 reports the results of estimating these regressions using time series
regressions for each firm and then reporting simple cross-sectional means and t-statistics of
the regression coefficients, as well as mean and median R-squareds. Given the likely
dependence in these data, the t-statistics are provided for descriptive purposes only; this is
addressed by the clustered standard errors reported for the pooled regressions in Table 5.
Panel A reports regressions estimated for the period before 1980. To be included, I require
that firms pay dividends in at least 20 years during this period; 605 firms that satisfy this
requirement. Panel B of the table reports regressions estimated over the 1980-2004 period
for those firms that both pay dividends and make repurchases, defined as firms that pay
dividends in at least 15 years and repurchases in at least 10 years; 400 firms satisfy these
requirements. Panel C reports regressions estimated for those firms that only make
repurchases, defined as firms that do not pay dividends during the period, that make
21
repurchases in at least five years, and that have at least 15 years of non-missing data for the
regressions; 382 firms satisfy these criteria.
The results in Table 4 support the view that the relation between dividends and
earnings weakens from the first subperiod to the second, but that combining repurchases
and dividends to form an overall measure of payout helps to reverse this effect. The first
set of regressions shows a strong relation between dividends and earnings in the 1950s,
1960s, and 1970s, consistent with previous research (Fama and Babiak, 1968). As
expected under the Linter model, the mean coefficient on earnings is reliably positive (.10,
t = 32.1) while that on lagged dividends is reliably negative (-.21, t = -25.6), and the mean
(median) R-squared is relatively high, at 51% (52%).
The results for this traditional specification are noticeably weaker in the second
subperiod, consistent with findings of Choe (1990). For the base model (with bottom-line
earnings), the mean (median) R-squared declines to 28% (26%), the coefficient on earnings
remains reliably positive but is smaller and less significant than in the first period (.04, t =
7.7), while the same is true of the coefficient on dividends (-.18, t = -12.7). The relation is
a bit stronger when I adjust for the effect of special items: the mean (median) R-squared
increases to 32% (30%), the coefficient on earnings increases to .06 (t = 10.8), and the
coefficient on lagged dividends is -.21 (t = -9.7). The fact that the coefficients are smaller
in magnitude than in the first subperiod supports the prediction that managers now set
dividends more cautiously.
Table 5 reports corresponding results using pooled cross-sectional time series
regressions and standard errors clustered at the firm level. For the period before 1980
(Panel A), the coefficient on earnings is .15 (t = 3.03), the coefficient on lagged dividends
22
is -.22 (t = -2.2), and the R-squared is 45%. Consistent with the results in Table 4, the R-
squared for the traditional model with bottom-line earnings drops substantially in the
period after 1980, to about 20%, with lower regression coefficients. While the R-squared
also declines for the model that uses earnings adjusted for special items (from 45% to
37%), the coefficients on this model are at least as large as those reported in Panel A,
indicating that part of the decline in the earnings-dividends relation is attributable to the
increased frequency and magnitude of special items.
When I use total payout in place of dividends, the strength of the relation increases
relative to the dividend-only model, consistent with the idea that repurchases are now
integrated into these firms’ (i.e., dividend-payers’) payout policies, and that earnings now
drive overall payouts rather than dividends. Looking first at Table 4, Panel B, the mean
(median) R-squared for overall payout model is 34% (35%) compared to 28% (26%) for
the dividend model. The higher coefficient magnitudes for this model support the
prediction that speed of adjustment is higher for repurchases than for dividends (the larger
coefficient on earnings also reflects the naturally higher payout ratio once repurchases and
dividends are combined). The results are similar when the regressions are estimated using
the pooled cross-sectional time series data (Table 5, Panel B). Here the coefficients are
substantially larger using the overall payout model than using the dividend-only model,
and the R-squared increases from 20% to 25%. Results are similar using earnings adjusted
for special items, although in this specification the R-squared declines for the overall
payout specification relative to the dividend-only specification. Overall though, the
evidence in Panel B of Tables 4 and 5 supports the idea that there is a stronger relation
between earnings and overall payouts than between earnings and dividends alone.
23
The results reported thus far relate to dividend-payers. To provide evidence on
whether earnings also drive payouts for firms that make repurchases but do not pay
dividends, Panel C of Tables 4 and 5 reports the results of estimating (2) for firms that pay
repurchases but not dividends (because repurchases only begin in material amounts during
the 1980s, these regressions can only be estimated in the second subperiod). The results
indicate that the relation between payouts and earnings is at least as strong for these firms
as for firms that pay both dividends and repurchases. In the first specification, which uses
bottom-line earnings as the earnings measure, the mean R-squared is 40%, with a mean
coefficient on earnings of .07 (t = 6.9) and a negative and significant coefficient on payout
(-.86, t = -31.7). The results are similar when earnings are adjusted for special items. The
corresponding results in Panel C of Table 5 are similar, in that they reveal a relatively
strong and significant relation between overall payout and earnings. The coefficients on
earnings are larger than those in Panel B, and are highly significant. In these regressions,
however, the coefficient on lagged payout is not statistically significant, with t-statistics of
-1.2. The relatively strong relation between earnings and repurchases for firms that only
make repurchases is somewhat surprising given that the literature tends to attribute
repurchases to non-earnings factors.
One advantage of repurchases over dividends is that repurchases do not have to be
paid in every period. Given this, it seems reasonable to expect that while the overall
amount of firms’ repurchases is likely to be tied to earnings, managers have considerable
flexibility over the timing of repurchases, and are likely to time repurchases in strategic
ways; for example, to manage the dilutive effects of ESO programs, finance mergers and
acquisitions, manage reported EPS, correct perceived misvaluations, etc.. In other words,
24
managers may decide on an overall level of repurchases for a two or three year window
based on earnings they expect to report over that period – but then time actual repurchases
within that period to achieve other objectives as well.17 If this is the case, estimating the
relation between earnings and total payouts using annual data may be restrictive in a way
that is not the case for dividends, which are traditionally set on an annual basis.
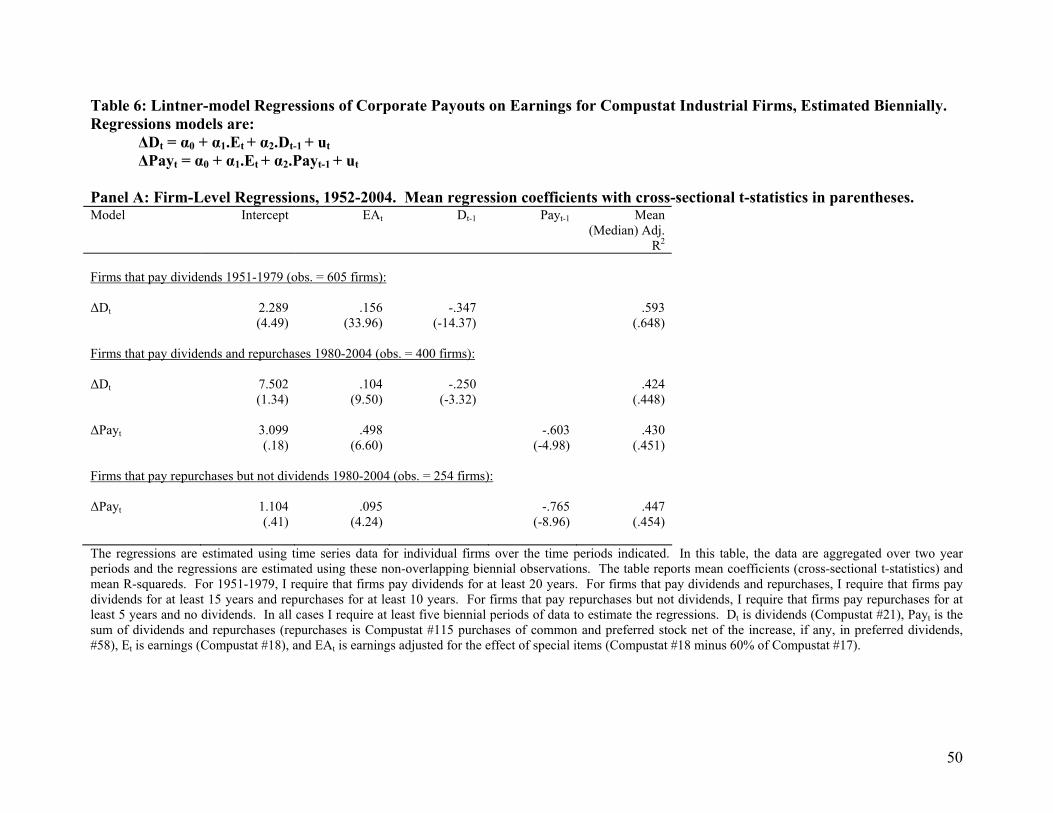
To address the possibility that earnings and overall payouts are linked over
windows longer than one fiscal year, Table 6 reports estimates of the same regression
models using non-overlapping two-year data windows (i.e., all variables are redefined
based on numbers aggregated over two fiscal years). To economize on space, Table 6
reports only on models that use earnings adjusted for special items. I again report results
for the firm-level time series regressions (Panel A) and for the pooled cross-sectional time
series regressions (Panel B). The results are consistent with the prediction that managers
make payout decisions over windows longer than one year; this result holds for dividends
as well as for overall payouts. For the dividend-only specification before 1980, the mean
R-squared increases from 50% in Table 4 to 59% in Table 6, Panel A with larger
coefficients. The increase is even larger, from 45% to 70%, using the pooled regressions
in Panel B. The R-squareds also increase noticeably for the specifications estimated in the
period after 1980 both for firms that both pay dividends and make repurchases and for
firms that only make repurchases. This evidence suggests that managers’ payout decisions
tend to be based on windows longer than one year.
17 The fact that firms generally announce repurchases every couple of years, and sometimes do not follow through on those announcements, is consistent with repurchase decisions being made over a longer horizon than dividend decisions and with managers exercising discretion over the timing/amount of actual repurchases (e.g., Ikenberry and Vermaelen, 1996; Stephens and Weisbach, 1998).
25
Overall, these results indicate that while the traditional (dividend-based) version of
the Lintner model works well before 1980, the relation between earnings and dividends
weakens after that time, as managers become more reluctant to increase dividends. A
relatively stable set of firms now pay both dividends and repurchases and the relation
between these firms’ overall payouts and earnings is strong, consistent with the idea that
repurchases now form part of these firms’ overall payout policy, helping to offset (or
perhaps causing) the increasingly conservative dividend policy. There is an equally strong
relation between earnings and payouts for firms that only make repurchases. I also find
that regressions of payouts on earnings have greater explanatory power when estimated
using windows that are longer than one year, suggesting that firms now make payout
decisions based on earnings over two to three year windows. Finally, adjusting earnings
for the effect of special items improves the fit of models estimated using data after 1980.
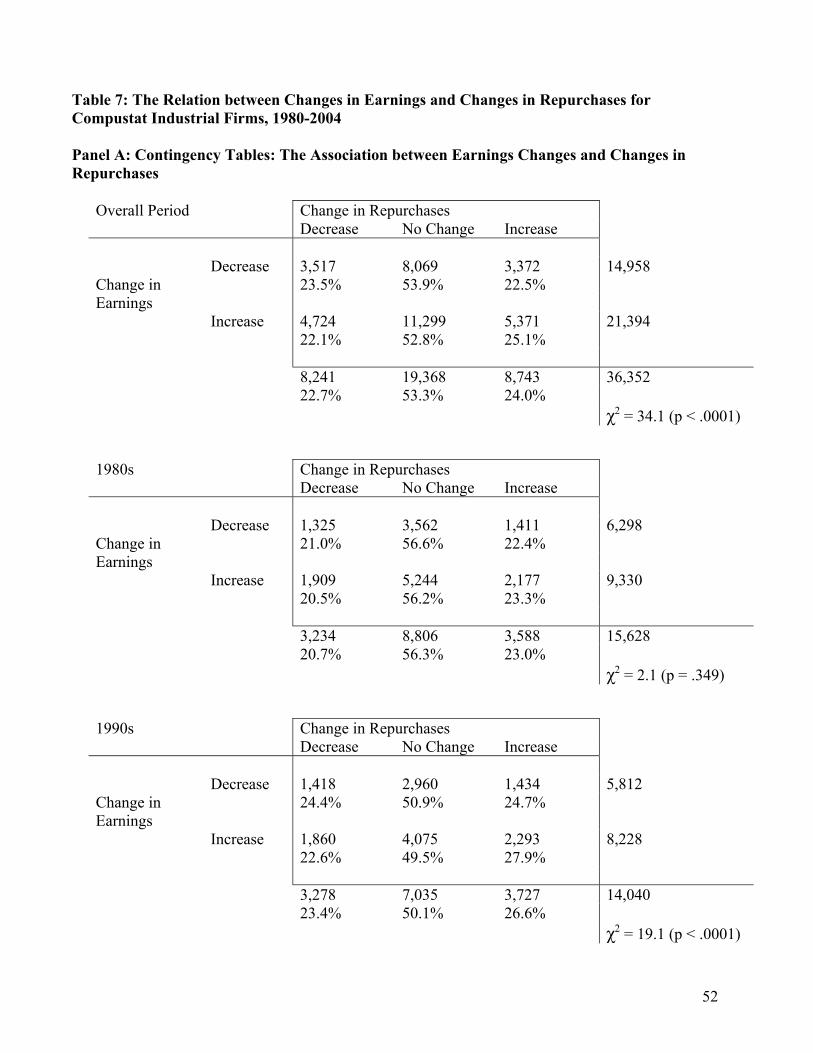
Table 7 provides another way of analyzing the strength of the relation between
earnings, dividends, and repurchases, this time by investigating the relation between
earnings changes and changes in dividends and repurchases (in the spirit of Fama and
Babiak, 1968). Panel A presents contingency tables that divide firm/year observations into
those in which earnings-per-share (EPS) increases or decreases and examines the extent to
which earnings changes are related to changes in repurchases, defined the same way as in
Table 2 (to economize on space, and because the relation between earnings changes and
dividend changes is well known, results for dividends are not tabulated). Panel B
investigates the same question using logit regressions that regress the sign of the earnings
change on indicators for changes in dividends, changes in repurchases, and an interaction
26
term. Results are again presented by decade (beginning with the 1980s, when repurchases
first become material) to assess trends.
Panel A shows that, overall, there is a statistically significant relation between EPS
changes and changes in repurchases but the relation is modest in economic terms.18 For
the period overall, firms are slightly more likely to increase repurchases (25.1% versus
22.5%) and slightly less likely to decrease repurchases (22.1% versus 23.5%) when EPS
increases than when EPS decreases. In comparison, dividends increase 67% of the time
when EPS increases versus 46% of the time when EPS declines, and decrease 21% of the
time when EPS declines versus 10% of the time when EPS increases (dividend results not
tabulated).
The relation between changes in repurchases and EPS becomes stronger during the
sample period, indicating that repurchases are increasingly tied to earnings. In the 1980s
the relation is not significant in economic or statistical terms. However, there is evidence
of a relation in the 1990s and stronger evidence in the 2000s. In the 2000s, repurchases
increase 23.5% (18.5%) of the time when EPS increases (decreases) and decrease 24.9%
(27.2%) of the time.
The logit regressions in Panel B provide evidence on the relative magnitude of the
relation between earnings changes and changes in dividends and repurchases as well on
whether there is an interaction between dividends and repurchases in their relation with
earnings changes. This evidence shows that the main effect for dividends is larger than
that for repurchases overall (coefficient of .49 versus .09) and that the strength of the
relation between changes in EPS and repurchases increases over the sample period, with
18 Inferences remain largely unchanged if I eliminate firm/year observations for which repurchases are zero in year t or year t-1.
27
coefficients on repurchases of .02 in the 1980s (not significant), .11 in the 1990s
(significant at better than 1%), and .18 in the 2000s (also highly significant). There is little
evidence of an interaction effect. Overall, the evidence in Table 7 supports the view that
managers’ repurchase decisions are increasingly tied to earnings.
Section 3.3 Variation in the Importance of Earnings to Different Types of Payout Firms
The evidence in previous sections shows that since 1980, there are three principal groups
of firms with respect to payout policy: non-payers, firms that only make stock repurchases,
and firms that pay both dividends and repurchases. In this section, I investigate the
determinants of managers’ payout policy choices to try and shed further light on the extent
to which the disappearance of dividends can be explained by changes in firm
characteristics rather than a declining propensity to pay. Specifically, I provide evidence
on: (1) why some firms pay both dividends and repurchases while others only use
repurchases, (2) why some firms choose not to pay out cash at all, and (3) whether there is
predictable variation in the mix of dividends and repurchases for firms that choose to use
both mechanisms.
To address the first question, Table 8 provides year-by-year logit regressions. The
dependent variable is set to one for firm/years in which there are only repurchases and zero
for firm/years in which both are paid. I expect that firms that pay out cash using both
dividends and repurchases are larger, more profitable firms, with fewer growth
opportunities (e.g., Smith and Watts, 1992; Fama and French, 2001). These attributes are
measured using the natural log of total assets; a loss dummy to measure profitability;19 and
19 Because of the strong relation between losses and payout policy, I use this measure rather than return on assets (ROA). The results are slightly weaker if the ROA variable is used instead. The results are almost identical if the loss dummy is defined using losses that cannot be attributed to special items, as defined above.
28
market-to-book, R&D intensity, and asset growth to measure growth opportunities. For
the years since 2000, I include the implied ESO expense divided by sales to proxy for the
extent to which ESO plans dilute stockholders’ claims.20 Following DeAngelo, DeAngelo,
and Stulz (2005), I also include the level of firms’ retained earnings (deflated by
stockholders’ equity) as a measure of the relative extent of earned versus contributed
capital.21 This measure helps determine whether firm lifecycle affects its payout policy
choice; DeAngelo et al. (2005) find that this variable does a good job of explaining which
firms pay dividends.
Consistent with expectations, firms that only make repurchases have lower levels
of retained earnings, higher R&D intensity, and are smaller than firms that pay both
dividends and repurchases; these variables are consistently significant at the 1% level.22
The explanatory power of these regressions is relatively high, with Cox-Snell (1989) R-
squareds of 40%-50%. The ESO variable is significant in four of the five years that it is
included (2000-2005), suggesting that firms that only make repurchases do so in part to
offset the dilutive effects of ESO programs (Kahle, 2002; Bens et al., 2003). The inclusion
of this variable, however, reduces the significance of the R&D variable. All of this is
evidence that firms that pay dividends and repurchases have largely the same attributes as
previously observed for dividend-payers. This implies that these are largely the set of
20 Since 1995, the FASB has required US firms to report the pro-forma ESO expense in footnotes, and this number is now reported by Compustat (item #399). Although Compustat reports this variable for some firms in the mid-1990s, its coverage does not appear to be complete before 2000. The expense is computed (roughly speaking) as the Black-Scholes value of options granted during a particular year, which I use as a proxy for cross-sectional variation in the likely extent of ESO-driven dilution. 21 Results are similar if I deflate retained earnings by total assets. 22 Consistent with what DeAngelo et al. (2005) report, the retained earnings variable dominates the loss/ROA variable. The loss dummy variable is consistently significant (and positive, as expected) when the retained earnings variable is excluded. The ROA variable is also significant when the retained earnings variables is excluded although not as significant as the loss dummy.
29
large, mature, and profitable firms that have paid dividends for many years and now
dominate the supply of dividend payments (DeAngelo et al., 2004).
To further investigate this argument, I analyze the past dividend policy of the two
groups of firms. Firms that both pay dividends and make repurchases are largely firms that
have paid dividends historically, while firms that only make repurchases are largely firms
that have never paid dividends. Of the 400 firms that, since 1980, pay dividends in 15 or
more years and make stock repurchases in ten or more years, 345 (86%) paid dividends in
1980.23 Conversely, of the set of 949 firms that made repurchases but did not pay
dividends in at least five years over the same period, only 44 (less than 5%) paid dividends
in 1980. This is clear evidence that firms that have always paid dividends are reluctant to
discontinue that practice while firms with no dividend history are unlikely to initiate
dividends. Consistent with what DeAngelo et al. (2004) contend, some of these firms are
large technology firms, including Dell, Cisco, Oracle and (until recently) Microsoft, which
have the size and profitability traditionally associated with dividend payers. The
emergence of firms that consistently make repurchases but do not pay dividends helps
explain the declining propensity to pay dividends.
Table 9 provides evidence on how firms that make repurchases differ from those
that do not pay out cash to stockholders. Once again, I report annual cross-sectional logit
regressions using the same variables.24 Collectively, these variables explain relatively
little of the choice between the decision to make repurchases and not pay cash to
23 It is also true that very few firms that paid dividends in 1980 continue to pay dividends without also making repurchases on a relatively frequent basis. Of the set of 1,996 firms paying dividends in 1980, 562 paid dividends in 20 or more years from 1980 to 2004. Only 12 (2%) of these firms do not make any repurchases in this period while 482 (86%) make repurchases in five or more years. 24 Here I deflate retained earnings by total assets rather than equity since equity is negative for a relatively large and increasing fraction of the non-payers
30
stockholders. For most years the Cox-Snell R-squareds are less than 5%. Four variables
show some level of consistent significance. First, non-payers are more likely to report
losses than repurchasers, although this result only holds over the last ten years or so.
Second, the retained earnings variable is reliably positive in 14 (of 23) years, indicating
that repurchasers have larger relative levels of retained earnings than non-payers. Third,
non-payers tend to have higher market-to-book ratios and asset growth rates than
repurchasers. This evidence is consistent with the idea that non-payers are less profitable,
less mature firms with more growth opportunities than repurchasers, although the lower R-
squares show that these differences are less pronounced than those between firms that pay
both dividends and repurchases and firms that only make repurchases.
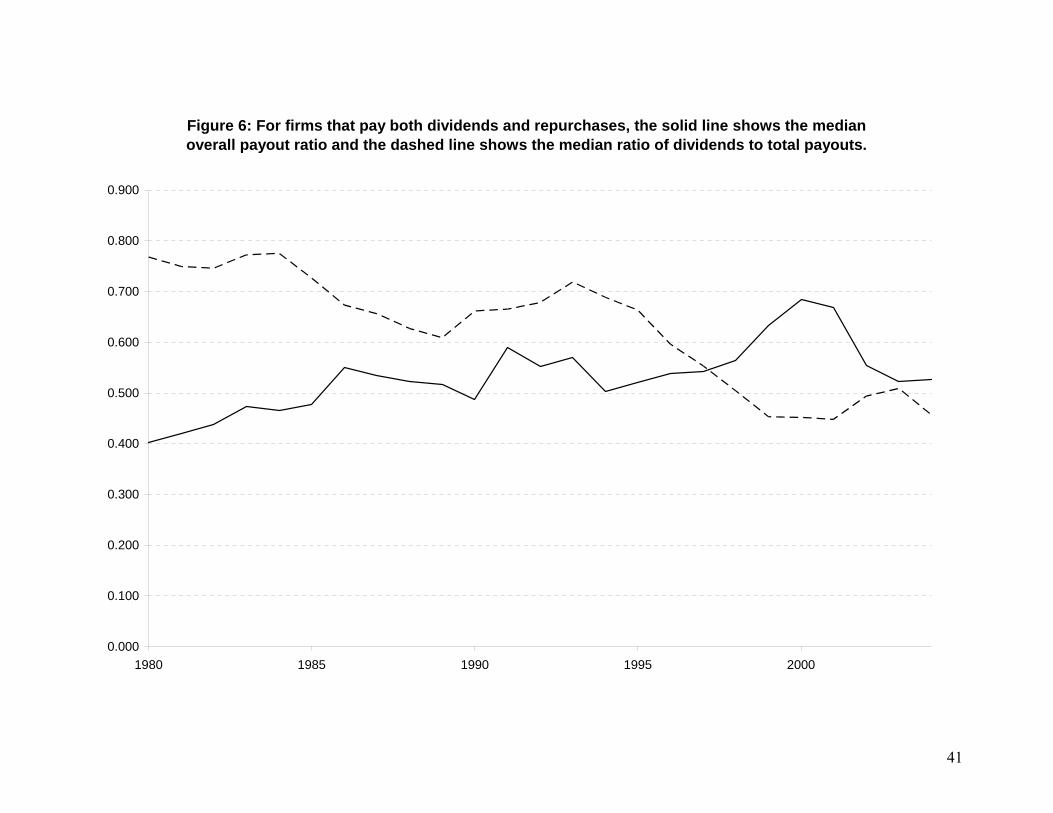
To investigate the third question I first compute the ratio of dividends to total cash
payout for firms that pay both dividends and repurchases. To measure these firms’
ongoing payout policy and because repurchases may not be paid every year, I compute this
ratio over a three year period for each firm/year observation. The median ratio of
dividends to total payout is plotted in Figure 6, along with the median overall payout ratio.
While the overall level of payouts for these firms increases over this period, from 40% of
earnings in 1980 to over 50% of earnings in the years since 1990, the share of payout
attributable to dividends declines from around 75% in the early 1980s to 50% or less in the
years since 1998. Given that these firms now account for the bulk of total cash paid out by
public firms (Figure 3), this indicates that dividends have become relatively less important
overall for payouts in the economy but are far from being economically insignificant.
To provide evidence on which variables explain the extent to which these firms pay
out cash as dividends versus repurchases, I estimate annual cross-sectional regressions of
31
the dividend (to total payout) ratio on firm profitability, growth, and size, along with the
ESO dilution measure. I report these results in Table 10. Apart from 1980-1982 and
2001-2005, these regressions have little explanatory power. For 2001-2005, both ROA
and the ESO variable tend to be negatively related to the dividend ratio, suggesting that
firms that are more profitable and with relatively more dilutive ESO programs are more
likely to use repurchases. There is no evidence that the earnings persistence variable is
significantly related to the relative extent of dividend payouts, inconsistent with
conventional wisdom (results not tabulated).
Overall, this suggests that while the level of firms’ cash payouts is driven by
earnings, the nature of their earnings (and other variables) does little to explain the form of
those payouts. Because these firms are exclusively those that have paid dividends, it could
be that dividend levels largely just depend on dividend history.
4. Conclusions
This paper shows that there are now, in the period since 1980, two groups of firms
that pay out cash to stockholders: firms that both pay dividends and make repurchases and
firms that only make repurchases. Earnings are an important determinant of payouts for
both sets of firms. The results show that the larger, more profitable, and more mature
firms that previously paid dividends now pay both dividends and repurchases, that
managers of these firms coordinate their payout decisions (rather than deciding separately
on dividends and repurchases), and that overall payouts are well-explained by earnings.
Managers have become increasingly reluctant to increase dividends, apparently because
the emergence of repurchases provides them with an alternative way of distributing
earnings increases. This means that the traditionally strong relation between dividends and
32
earnings evident in papers such as Fama and Babiak (1968) weakens considerably after the
late 1970s.
Losses are also an important variable. The increasing fraction of public firms that
report losses (over 50% in recent years) makes dividends increasingly undesirable given
legal and institutional constraints on paying dividends when earnings are negative,
potentially helping to explain the declining propensity to pay. I find that losses are unusual
among firms that pay both dividends and repurchases, somewhat more common among
repurchasers, and relatively frequent among non-payers.
Perhaps surprisingly given the existence of other explanations for repurchases,
earnings also do a good job of explaining payouts for firms that only make repurchases,
consistent with the idea that these firms use repurchases as a substitute for dividends. In
addition, I find that repurchasers are largely firms that have never paid dividends, while
firms that both pay dividends and make repurchases are largely those firms that have a
long history of paying dividends, implying that history is important in explaining dividend
policy. There are now three different groups of firms: (i) non-payers, which are largely
unprofitable but have large growth opportunities, (ii) repurchasers, which are more
profitable and mature than non-payers, and that have no history of paying dividends, and
(iii) firms that both pay dividends and make repurchases, which tend to be large, mature
firms with consistent profitability and a history of paying dividends. Other things held
constant, the evidence suggests that group (ii) will become increasingly important as more
relatively young firms (like Dell, Cisco, and Oracle) mature and begin to distribute cash to
33
stockholders, since these firms are unlikely to initiate dividends.25 Thus, the evidence here
helps to explain the declining propensity to pay dividends (Fama and French, 2001).
The results are also largely consistent with the recent contention in DeAngelo et al.
(2004) that industrial firms now display a largely two-tiered structure, with a small number
of large firms that collectively dominate the distribution of both earnings and payouts, and
a large number of smaller, often unprofitable firms with high growth opportunities (also
see Fama and French, 2004). While the top tier largely comprises firms that pay both
dividends and repurchases, firms such as Dell, Cisco, and Oracle are also in this group,
indicating that some of the top earners eschew dividends in favor of repurchases. This
suggests that while firm-level inertia in dividend payments is considerable, there may
come a time when dividends will truly disappear.
25 A counterexample is Microsoft, which recently paid a large special dividend and initiated a regular dividend. It is arguably the cases that the recent change in the US Tax Code, which reduces the tax disadvantage of dividends, helps explain the Microsoft decision. It remains to be seen whether this tax change, if it persists, will spur other repurchasers to initiate dividends.
34
Appendix: Aggregate Compustat Earnings, Special Items, Dividends, and Repurchases, with the Number and Percentage of Loss Firms, 1952-2004. Amounts in $ million.
Firm/years are included if they have non-missing earnings (#18) and dividends (#21) data on annual Compustat in a given year and are incorporated in the United States (using the Compustat incorporation code). Utilities and financial firms are excluded. Aggregate earnings are total earnings (#18) for these firms. The number of loss firms is the number of firms with negative earnings (#18) for the year. Aggregate special items is total special items (#17) for the year and aggregate dividends is total dividends for the year (#21). Aggregate repurchases is total repurchases defined as purchases of common and preferred stock (#115) net of the decline, if any, in preferred stock (#58).
35
Figure 1: Aggregate Compustat Earnings (solid line), Special Items (short and long dashes), Dividends (short dashes), and Net Repurchases (long dashes), 1950-2004
-400000
-300000
-200000
-100000
0
100000
200000
300000
400000
1950 1960 1970 1980 1990 2000
36
Figure 2: Counts of firm/years with: (1) no cash payout (top dashed line); (2) dividends only (solid line); (3) both dividends and repurchases (long dashes); (4) repurchases only (lower
line, short dashes). Compustat data, 1950-2004.
0
500
1000
1500
2000
2500
3000
3500
4000
4500
5000
1950 1960 1970 1980 1990 2000
37
Figure 3: Proportion of aggregate payouts attributable to firm/years with: (1) dividends only (dashed line); (2) dividends and repurchases (upper solid line); (3) repurchases only (lower
solid line).
0.000
0.100
0.200
0.300
0.400
0.500
0.600
0.700
0.800
0.900
1.000
1971 1976 1981 1986 1991 1996 2001
38
Figure 4a: For firms that pay both dividends and earnings, the figure plots earnings adjusted for special items(solid line), dividends (long dashes), and repurchases (short dashes).
0
50,000
100,000
150,000
200,000
250,000
1971 1976 1981 1986 1991 1996 2001
39
Figure 4b: For firms that pay both dividends and earnings, the figure plots earnings adjusted for special items (solid line) and total payouts (dividends plus repurchases; dashed line).
0
50,000
100,000
150,000
200,000
250,000
1971 1976 1981 1986 1991 1996 2001
40
Figure 5: For firms that only make repurchases, the figure plots earnings adjusted for special items (solid line) and repurchases (dashed line).
-5000
0
5000
10000
15000
20000
25000
30000
35000
40000
45000
1971 1976 1981 1986 1991 1996 2001
41
Figure 6: For firms that pay both dividends and repurchases, the solid line shows the median overall payout ratio and the dashed line shows the median ratio of dividends to total payouts.
0.000
0.100
0.200
0.300
0.400
0.500
0.600
0.700
0.800
0.900
1980 1985 1990 1995 2000
42
Table 1: The Frequency and Magnitude of Changes in Regular Dividends for Compustat Industrial Firms, 1952-2004
Decade:
Increases No Changes Decreases
All Obs. Long-payers
All Obs. Long-payers
All Obs. Long-payers
1950s 48.5% 54.1% 35.2% 33.9% 16.4% 11.9% .143 .138 -.200 -.191 (.284) (.266) (-.243) (-.214) 1960s 60.0% 67.5% 31.6% 27.7% 8.4% 5.0% .138 .120 -.213 -.179 (.286) (.186) (-.273) (-.203) 1970s 65.7% 73.7% 24.6% 20.7% 9.8% 5.7% .167 .111 -.273 -.200 (.367) (.174) (-.337) (-.234) 1980s 63.5% 73.8% 25.6% 20.4% 10.9% 5.9% .138 .111 -.160 -.243 (.359) (.163) (-.329) (-.285) 1990s 56.0% 62.7% 33.5% 30.0% 10.5% 7.3% .118 .091 -.333 -.333 (.306) (.127) (-.500) (-.356) 2000s 49.0% 49.0% 40.5% 42.3% 10.5% 8.7% .109 .068 -.375 -.429 (.566) (.170) (-.392) (-.422) The table reports the relative frequency of dividend changes in each category along with the median (mean) magnitude of the change. These numbers are based on changes in total dividends (Compustat data item #21) and exclude changes that exceed 1,000%. The All Observations columns include all firm-years with non-zero, non-missing dividends in the current and prior year; the Long Payers columns include all firm-years that meet the same requirements and that pay dividends for at least 40 years.
43
Table 2: The Relation between Changes in Dividends and Changes in Repurchases for Compustat Industrial Firms, 1970-2004
1970s Changes in Repurchases Decreases No Changes Increases
307 996 247 1,550 20% 64% 16%
Decreases
463 1,636 507 2,606 18% 63% 19%
No Changes
1,801 6,593 1,893 10,287 18% 64% 18%
Increases
Changes in Dividends
2,571 9,225 2,647 14,443 18% 64% 18% 1980s Changes in Repurchases Decreases No Changes Increases
474 1,504 408 2,386 20% 63% 17%
Decreases
777 1,944 833 3,554 22% 55% 23%
No Changes
1,970 5,309 2,335 9,614 20% 55% 24%
Increases
Changes in Dividends
3,221 8,757 3,576 15,554 21% 56% 23%
44
Table 2 (Cont.): The Relation between Changes in Dividends and Changes in Repurchases for Compustat Industrial Firms, 1970-2004
1990s Changes in Repurchases Decreases No Changes Increases
459 973 355 1,787 26% 54% 20%
Decreases
963 1,726 982 3,671 26% 47% 27%
No Changes
1,773 2,825 2,305 6,903 26% 41% 33%
Increases
Changes in Dividends
3,195 5,524 3,642 12,361 26% 45% 29% 2000s Changes in Repurchases Decreases No Changes Increases
222 369 123 714 31% 52% 17%
Decreases
547 682 422 1,651 33% 41% 26%
No Changes
831 775 758 2,364 35% 33% 32%
Increases
Changes in Dividends
1,600 1,826 1,303 4,729 34% 39% 27% For each decade, I classify firm/years into those in which split-adjusted dividends per share increase, decrease, or do not change, as well as into those for which repurchases (in total) increase, decrease, or do not change. I require non-missing, non-zero dividends in current and prior years. Chi-squared tests of association are statistically significant at better than the 1% level for all tables.
45
Table 3: The Relation between Losses, Special Items, Dividends, and Repurchases for Compustat Industrial Firms, 1952-2004
Obs. Count of losses (% of obs.)
Count of negative Special Items (% of obs.)
Count of losses (% of losses) due to Special Items
Count of div. payers with losses (% of div. payers)
Count of repurchasers with losses (% of repurchasers)
Count of “both” firms with losses (% of both)
Count of losses due to SI for div. payers (% of DP losses)
Count of losses due to SI for repurchasers (% of repurchaser losses)
Count of losses due to SI for “both” firms (% of “both” firm losses)
1950s 5,324 108 487 6 38 NA NA 3 NA NA 2.0% 9.4% 5.9% 0.9% 7.9% 1960s 18,066 1,329 540 25 198 NA NA 3 NA NA 7.4% 2.8% 1.9% 1.6% 1.5% 1970s 35,441 5,798 2,432 346 625 692 116 78 78 21 16.4% 6.9% 6.0% 3.4% 9.9% 2.8% 12.5% 12.5% 18.1% 1980s 47,517 16,622 9,657 1,131 1,475 2,064 384 372 258 111 35.0% 20.3% 6.8% 9.1% 21.0% 7.5% 25.2% 12.5% 28.9% 1990s 63,044 26,712 20,382 3,306 1,543 2,837 436 666 720 218 42.4% 32.3% 12.4% 11.1% 22.3% 8.0% 43.2% 25.4% 50.0% 2000s 29,915 15,727 13,158 1,846 652 1,805 176 296 433 94 52.6% 44.0% 11.7% 13.5% 27.8% 8.2% 45.4% 24.0% 53.4% Total 199,307 66,296 46,620 6,660 4,531 7,398 1,112 1,427 1,489 444 33.3% 23.4% 10.0% 6.5% 20.5% 6.6% 31.3% 20.1% 39.9% For each decade, I tabulate the number of firm/years that fall into each of the following categories: (1) number of firm/years in which losses (negative value for Compustat #18) are reported; (2) number of firm/years in which negative special items (negative value for Compustat #17) are reported; (3) number of firm/years with losses largely attributable to special items (pretax special items are negative and at least 80% of bottom-line loss); (4) number of firm/years with reported loss and dividends (Compustat #21); (5) number of firm/years with reported loss and repurchases (Compustat #115 net of decline, if any, in Compustat #58); (6) number of firm/years with reported loss, and “both” dividends and repurchases, (7) number of firm/years with dividends and loss largely attributable to special items, (8) number of firm/years with repurchases and loss largely attributable to special items, (9) number of firm/years with “both” dividends and repurchases and loss largely attributable to special items.
46
Table 4: Lintner-model Regressions of Corporate Payouts on Earnings for Compustat Industrial Firms. Firm-Level Regressions, 1951-2004. Mean regression coefficients with cross-sectional t-statistics in parentheses. Regressions models are:
ΔDt = α0 + α1.Et + α2.Dt-1 + ut ΔPayt = α0 + α1.Et + α2.Payt-1 + ut
(.523) Panel B: Firms that pay dividends and repurchases 1980-2004 (obs. = 400 firms): ΔDt 7.046
(2.48) .043
(7.68) -.178
(-12.71) .280
(.255) ΔDt 3.353
(1.15) .062
(10.78) -.206
(-9.69) .317
(.298) ΔPayt 23.686
(4.26) .259
(13.42) -.610
(-11.00) .344
(.352) ΔPayt 13.776
(2.72) .329
(17.09) -.654
(-13.74) .355
(.372) Panel C: Firms that pay repurchases but not dividends 1980-2004 (obs. = 382 firms): ΔPayt .735
(1.11) .069
(6.88) -.858
(-31.70) .403
(.421) ΔPayt .086
(.10) .085
(7.62) -.875
(-32.95) .407
(.421)
47
The regressions are estimated using time series data for individual firms over the time periods indicated. The table reports mean coefficients (cross-sectional t-statistics) and mean (median) R-squareds. For Panel A, I require that firms pay dividends for at least 20 years of the sample period. For Panel B, I require that firms pay dividends in at least 15 years and repurchases in at least 10 years. For Panel C, I require that firms pay repurchases for at least 5 years, do not pay dividends, and have at least 15 years of data. Dt is dividends (Compustat #21), Payt is the sum of dividends and repurchases (repurchases is Compustat #115 purchases of common and preferred stock net of the increase, if any, in preferred dividends, #58), Et is earnings (Compustat #18) and EAt is earnings adjusted for the effect of special items (Compustat #18 minus 60% of Compustat #17).
48
Table 5: Lintner-model Regressions of Corporate Payouts on Earnings for Compustat Industrial Firms. Pooled Cross-Sectional Time-Series Regressions for All Firms with available data, 1951-2004. Regressions models are:
ΔDt = α0 + α1.Et + α2.Dt-1 + ut ΔPayt = α0 + α1.Et + α2.Payt-1 + ut
Model Intercept Et EAt Dt-1 Payt-1 Adj. R2 Panel A: Firms that pay dividends 1951-1979 (obs. = 15,685/15,408 firm/years): ΔDt -.988
(-2.46) .154
(3.03) -.224
(-2.19) .450
ΔDt -1.034
(-2.49) .158
(3.07) -.231
(-2.24) .455
Panel B: Firms that pay dividends and repurchases 1980-2004 (obs. = 9,475/8,911 firm/years): ΔDt .617
(.29) .113
(2.92) -.201
(-1.95) .202
ΔDt -4.501
(-2.61) .162
(2.77) -.303
(-1.90) .366
ΔPayt 7.323
(2.55) .288
(7.09) -.390
(-4.57) .250
ΔPayt -1.264
(-.37) .392
(10.72) -.544
(-8.57) .323
Panel C: Firms that pay repurchases but not dividends 1980-2004 (obs. = 7,478/7,232 firm/years): ΔPayt -1.970
(-1.86) .412
(5.50) -.246
(-1.24) .345
ΔPayt -2.835
(-2.60) .418
(5.43) -.250
(-1.26) .252
49
The regressions are estimated using pooled cross-sectional time-series data for all firms that meet the following requirements. The t-statistics are based on standard errors clustered at the firm-level. In each panel the smaller number of observations are for regressions that use earnings adjusted for special items (EA), since special items are sometimes reported as a combined figure which I code as missing. For Panel A, I require that firms pay dividends for at least 20 years. For Panel B, I require that firms pay dividends in at least 15 years and repurchases in at least 10 years. For Panel C, I require that firms pay repurchases for at least 5 years, no dividends, and have at least 15 years of data. Dt is dividends (Compustat #21), Payt is the sum of dividends and repurchases (repurchases is Compustat #115 purchases of common and preferred stock net of the increase, if any, in preferred dividends, #58), Et is earnings (Compustat #18) and EAt is earnings adjusted for the effect of special items (Compustat #18 minus 60% of Compustat #17).
50
Table 6: Lintner-model Regressions of Corporate Payouts on Earnings for Compustat Industrial Firms, Estimated Biennially. Regressions models are:
ΔDt = α0 + α1.Et + α2.Dt-1 + ut ΔPayt = α0 + α1.Et + α2.Payt-1 + ut
Panel A: Firm-Level Regressions, 1952-2004. Mean regression coefficients with cross-sectional t-statistics in parentheses. Model Intercept EAt Dt-1 Payt-1 Mean
(.648) Firms that pay dividends and repurchases 1980-2004 (obs. = 400 firms): ΔDt 7.502
(1.34) .104
(9.50) -.250
(-3.32) .424
(.448) ΔPayt 3.099
(.18) .498
(6.60) -.603
(-4.98) .430
(.451) Firms that pay repurchases but not dividends 1980-2004 (obs. = 254 firms): ΔPayt 1.104
(.41) .095
(4.24) -.765
(-8.96) .447
(.454) The regressions are estimated using time series data for individual firms over the time periods indicated. In this table, the data are aggregated over two year periods and the regressions are estimated using these non-overlapping biennial observations. The table reports mean coefficients (cross-sectional t-statistics) and mean R-squareds. For 1951-1979, I require that firms pay dividends for at least 20 years. For firms that pay dividends and repurchases, I require that firms pay dividends for at least 15 years and repurchases for at least 10 years. For firms that pay repurchases but not dividends, I require that firms pay repurchases for at least 5 years and no dividends. In all cases I require at least five biennial periods of data to estimate the regressions. Dt is dividends (Compustat #21), Payt is the sum of dividends and repurchases (repurchases is Compustat #115 purchases of common and preferred stock net of the increase, if any, in preferred dividends, #58), Et is earnings (Compustat #18), and EAt is earnings adjusted for the effect of special items (Compustat #18 minus 60% of Compustat #17).
51
Panel B: Pooled Cross-Sectional Time-Series Regressions for All Firms with available data, 1951-2004. Model Intercept EAt Dt-1 Payt-1 Mean
Firms that pay dividends and repurchases 1980-2004 (obs. = 372 firms): ΔDt -13.365
(-3.25) .162
(2.66) -.225
(-1.44) .539
ΔPayt -9.245
(-.79) .481
(11.68) -.644
(-7.99) .406
Firms that pay repurchases but not dividends 1980-2004 (obs. = 254 firms): ΔPayt -10.749
(-2.76) .786
(7.06) -.686
(-4.57) .521
The regressions are estimated using pooled cross-sectional time-series data for all firms that meet the following requirements. The t-statistics are based on standard errors clustered at the firm-level. In this table, the data are aggregated over two year periods and the regressions are estimated using these non-overlapping biennial observations. For 1951-1979, I require that firms pay dividends for at least 20 years. For firms that pay dividends and repurchases, I require that firms pay dividends for at least 15 years and repurchases for at least 10 years. For firms that pay repurchases but not dividends, I require that firms pay repurchases for at least 5 years and no dividends. In all cases I require at least five biennial periods of data to estimate the regressions. Dt is dividends (Compustat #21), Payt is the sum of dividends and repurchases (repurchases is Compustat #115 purchases of common and preferred stock net of the increase, if any, in preferred dividends, #58), Et is earnings (Compustat #18), and EAt is earnings adjusted for the effect of special items (Compustat #18 minus 60% of Compustat #17).
52
Table 7: The Relation between Changes in Earnings and Changes in Repurchases for Compustat Industrial Firms, 1980-2004 Panel A: Contingency Tables: The Association between Earnings Changes and Changes in Repurchases
Overall Period Change in Repurchases Decrease No Change Increase
2000s Change in Repurchases Decrease No Change Increase
774 1,547 527 2,848 27.2% 54.3% 18.5%
Decrease
955 1,980 901 3,836 24.9% 51.6% 23.5%
Increase
Change in Earnings
1,729 3,527 1,428 6,684 25.9% 52.8% 21.4% χ2 = 24.6 (p < .0001) Panel B: Logit Regressions of Earnings Changes on Changes in Dividends, Changes in Repurchases, and an Interaction term. Period: Intercept ∆Dividend ∆Repurchases Interaction Full Period, 1980-2004
.198 (<.0001)
.487 (<.0001)
.085 (<.0001)
-.032 (.155)
1980s
.138 (<.0001)
.576 (<.0001)
.018 (.564)
-.015 (.662)
1990s
.268 (<.0001)
.387 (<.0001)
.112 (.0002)
-.061 (.090)
2000s
.205 (<.0001)
.450 (<.0001)
.182 (<.0001)
-.003 (.963)
For each decade, I classify firm/years into those in which split-adjusted earnings per share increase or decrease, as well as into those for which repurchases (in total) increase, decrease, or do not change. Chi-squared tests of association are statistically significant at better than the 1% level for all tables. For the logit regressions, the dependent variable is set to one for increases in EPS and zero otherwise, and the independent variables are indicator variables for dividend and repurchases changes set to one for increases, zero for no-changes, and minus one for decreases. The table reports logit coefficients and associated p-values.
54
Table 8: Annual Logit Regressions of Payout Policy (firm/years with repurchases versus firm/years with both dividends and repurchases) on Hypothesized Determinants, 1980-2004
Logit regressions estimated each year using all firm/years with available data from Compustat. The dependent variable is coded one for firm/years in which the firm pays repurchases but not dividends and zero for firm/years in which the firm pays both dividends and repurchases. The loss dummy is a dummy variable coded one for firm/years with negative net income (Compustat #18) and 0 otherwise. Market-to-book is the ratio of market value of equity (#24*#25) divided by the book value of common equity (#60). R&D/Sales is R&D expense (#46) divided by sales (#12). Asset growth is the change in total assets (#6). Size is the natural log of total assets. ESO is pro-forma employee stock options expense (#399) divided by sales (#12); this variable is not available for many firms prior to 2000. Variables are winsorized at the 1% and 99% deciles. *Denotes significant at the 1% level. ^Denotes significance at the 5% level.
55
Table 9: Annual Logit Regressions of Payout Policy (firm/years with repurchases versus firm/years without payouts) on Hypothesized Determinants, 1980-2004
Logit regressions estimated each year using all firm/years with available data from Compustat. The dependent variable is coded one for firm/years in which the firm pays repurchases but not dividends and zero for firm/years in which the firm pays both dividends and repurchases. The loss dummy is a dummy variable coded one for firm/years with negative net income (Compustat #18) and 0 otherwise. RE/TA is retained earnings (#259) divided by total assets (#12); this variable is set to 0 if retained earnings are negative. Market-to-book is the ratio of market value of equity (#24*#25) divided by the book value of common equity (#60). R&D/Sales is R&D expense (#46) divided by sales (#12). Asset growth is the change in total assets (#6). Size is the natural log of total assets. ESO is pro-forma employee stock options expense (#399) divided by sales (#12); this variable is not available for many firms prior to 2000. Variables are winsorized at the 1% and 99% deciles. *Denotes significant at the 1% level. ^Denotes significance at the 5% level.
56
Table 10: Annual OLS Regressions of Ratio of Dividends to Total Payout for Firms that Pay Both Dividends and Repurchases on Hypothesized Determinants, 1980-2004
OLS regressions for firms that pay both dividends and repurchases of the ratio of dividends to total payouts on various determinants. The dependent variable is the sum of dividends in the current and previous two years divided by the sum of total payouts (dividends plus repurchases) over the same interval. ROA is earnings (Compustat #18) after adding back after-tax interest expense (#15) and special items (#17) divided by lagged total assets (#6). Market-to-book is the ratio of market value of equity (#24*#25) divided by the book value of common equity (#60). R&D/Sales is R&D expense (#46) divided by sales (#12). Asset growth is the change in total assets (#6). Size is the natural log of total assets. ESO is pro-forma employee stock options expense (#399) divided by sales (#12); this variable is not available for many firms prior to 2000. Variables are winsorized at the 1% and 99% deciles. *Denotes significant at the 1% level. ^Denotes significance at the 5% level.
57
References Allen, Franklin, and Michaely Roni, 2003. Payout Policy. In: G. M. Constantinedes, M.
Harris, and R. Stulz (Eds.), Handbook of the Economics of Finance, Elsevier, Amsterdam: 337-429.
Bagwell, Laura, and J. Shoven, 1988, Share repurchases and acquisitions: An analysis of
which firms participate, in: A. J. Auerbach, ed., Corporate Takeovers: Causes and Consequences (University of Chicago Press: Chicago, IL) 191-213.
Basu, Sudipta. 1997. The conservatism principle and the asymmetric timeliness of
earnings. Journal of Accounting and Economics, 24, 1, 3-37.
Bens, Daniel A., Venky Nagar, Douglas J. Skinner and M.H. Franco Wong. 2003. Employee stock options, EPS dilution, and stock repurchases. Journal of Accounting and Economics 36: 51-90.
Bernartzi, Shlomo, Roni Michaely, and Richard Thaler. 1997. Do Changes in Dividends Signal the Future or the Past? Journal of Finance 52, 3, 1007-1043.
Brav, Alon, John R. Graham, Campbell R. Harvey, and Roni Michaely, 2005, Payout
policy in the 21st century. Journal of Financial Economics 77, 3: 483-527. Brickley, James, 1983, Shareholder wealth, information signaling, and the specially
designated dividend: An empirical study. Journal of Financial Economics 12: 187-209.
Choe, Hyuk. 1990. Intertemporal and cross-sectional variation of corporate dividend
policy. Ph.D. Dissertation. University of Chicago, Chicago, IL. Collins, Daniel W., Edward L. Maydew, and Ira S. Weiss. 1997. Changes in the value
relevance of earnings and book values over the past forty years. Journal of Accounting and Economics 24, 1, 39-67.
Cox, D.R. and Snell, E.J. (1989), The Analysis of Binary Data, Second Edition, London: Chapman and Hall.
DeAngelo, Harry, Linda E. DeAngelo, and Douglas J. Skinner. 1992. Dividends and losses. Journal of Finance 47, 1837-1863.
DeAngelo, Harry, Linda E. DeAngelo, and Douglas J. Skinner. 2000. Special Dividends
and the Evolution of Dividend Signaling. Journal of Financial Economics 57, 309-354.
DeAngelo, Harry, Linda E. DeAngelo, and Douglas J. Skinner, 2004. Are Dividends
Disappearing? Dividend Concentration and the Consolidation of Earnings. Journal of Financial Economics 72:425-456.
58
DeAngelo, Harry, Linda E. DeAngelo, and Rene M. Stulz, 2005. Dividend Policy and the
Earned/Contributed Capital Mix: A Test of the Lifecycle Theory. Forthcoming, Journal of Financial Economics.
Fama, Eugene F., and Babiak, Harvey, 1968. Dividend Policy: An Empirical Analysis.
Journal of the American Statistical Association, 63, 324, 1132-1161. Fama, Eugene F., and Kenneth R. French, 2001. Disappearing dividends: changing firm
characteristics or lower propensity to pay? Journal of Financial Economics 60, 3-43.
Fama, Eugene F., and Kenneth R. French, 2004. New lists: Fundamentals and survival
rates. Journal of Financial Economics 73: 229-269. Grullon, Gustavo, and Roni Michaely. 2002. Dividends, Share Repurchases, and the
Substitution Hypothesis. Journal of Finance 57: 1649-1684. Grullon, Gustavo, Roni Michaely, Shlomo Benartzi and Richard H. Thaler. 2005.
Dividend Changes Do Not Signal Changes in Future Profitability. Journal of Business 78, 5: 1659-1682.
Guay, Wayne, and Jarrod Harford. 2000. The cash-flow permanence and information
content of dividend increases versus repurchases. Journal of Financial Economics 57: 385-415.
Hayn, C., 1995. The information content of losses. Journal of Accounting and Economics
20, 125-153. Ikenberry, David, and Theo Vermaelen, 1996, The option to repurchase stock. Financial
Management 24, 9-24 Jagannathan, M., C. P. Stephens, and M. S. Weisbach, 2000, Financial flexibility and the
choice between dividends and stock repurchases, Journal of Financial Economics 57, 355-384.
Joos, Peter R., and Plesko, George A., 2005, Valuing loss firms, The Accounting Review
80, 3 (July): 847-870. Kahle, Kathleen. M. 2002. When a buyback isn’t a buyback: Open market repurchases
and employee options. Journal of Financial Economics 63: 235-261. Klein, April, and Carol Marquardt., 2006. Fundamentals of Accounting Losses. The
Accounting Review 81, 1 (January): 179-206.
59
Lintner, J. 1956. Distribution of incomes of corporations among dividends, retained earnings, and taxes. American Economic Review 46, 97-113.
Miller, Merton H. 1986. Behavioral rationality in finance: The case of dividends.
Journal of Business 59, S451-S468. Miller, Merton H., and Franco Modigliani. 1961. Dividend Policy, Growth and the
Valuation of Shares. Journal of Business 34, 411-433. Miller, Merton H., and Kevin Rock. 1985. Dividend policy under asymmetric
information. Journal of Finance 40: 1031-1051. Smith, Clifford W., and Ross L. Watts. 1992. The investment opportunity set and
corporate financing, dividend, and compensation policies, Journal of Financial Economics 32: 263-292.
Stephens, C., and M. Weisbach, 1998, Actual share repurchases in open-market repurchase