The Fisheries Sector Jonathan Barton Instituto de Estudios Urbanos y Territoriales Pontificia Universidad Católica de Chile, Santiago de Chile [email protected]Chile and New Zealand – between competition and co-operation? Victoria University of Wellington 22 April 2005
Transcript
The Fisheries Sector
Jonathan BartonInstituto de Estudios Urbanos y Territoriales
Pontificia Universidad Católica de Chile, Santiago de [email protected]
Chile and New Zealand –between competition and co-operation?
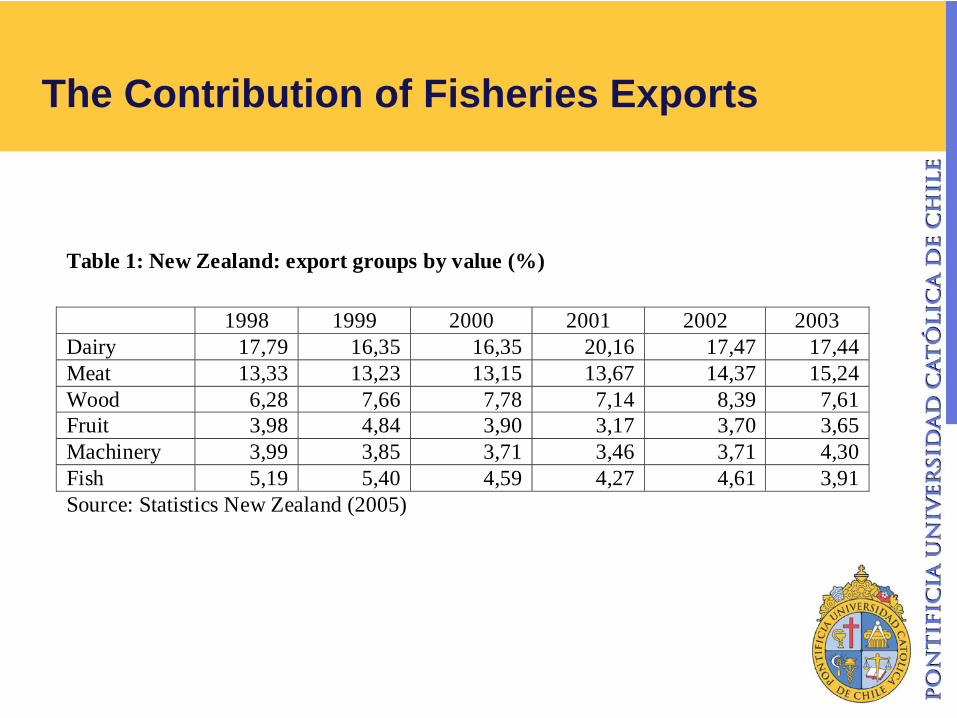
Table 2: Chile: export groups by value (%) 1995 1997 1999 2000 2001 2002 Copper (refined and ores) 37,9 40,0 35,0 38,7 35,0 34,6Fish 4,5 5,1 6,8 6,5 6,7 6,9Wood (pulp and lumber) 8,3 5,3 5,9 6,9 6,8 6,1Wine - 2,5 3,4 3,2 3,4 3,5Grapes 2,2 2,5 2,6 2,8 2,5 3,1Source: Adapted from CEPAL (2004)
The Crisis in Capture FisheriesThe Crisis in Capture Fisheries
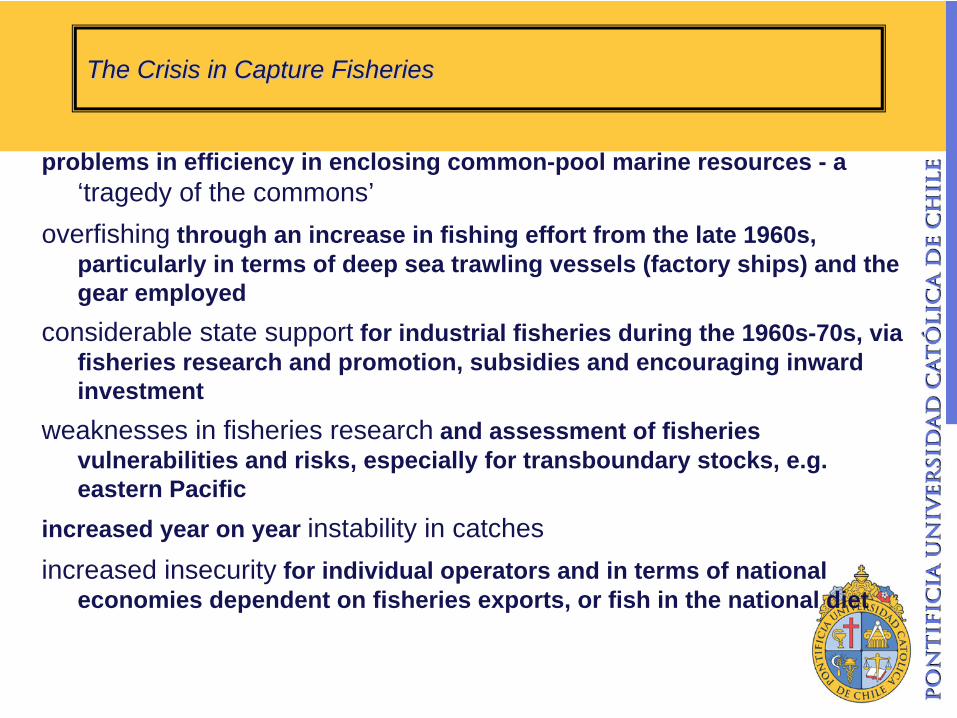
problems in efficiency in enclosing common-pool marine resources - a ‘tragedy of the commons’
overfishing through an increase in fishing effort from the late 1960s, particularly in terms of deep sea trawling vessels (factory ships) and the gear employed
considerable state support for industrial fisheries during the 1960s-70s, via fisheries research and promotion, subsidies and encouraging inward investment
weaknesses in fisheries research and assessment of fisheries vulnerabilities and risks, especially for transboundary stocks, e.g. eastern Pacific
increased year on year instability in catchesincreased insecurity for individual operators and in terms of national
economies dependent on fisheries exports, or fish in the national diet
The Peruvian ‘spike’
Maximum Sustainable Yield
Options for Improved Fisheries ManagementOptions for Improved Fisheries Management
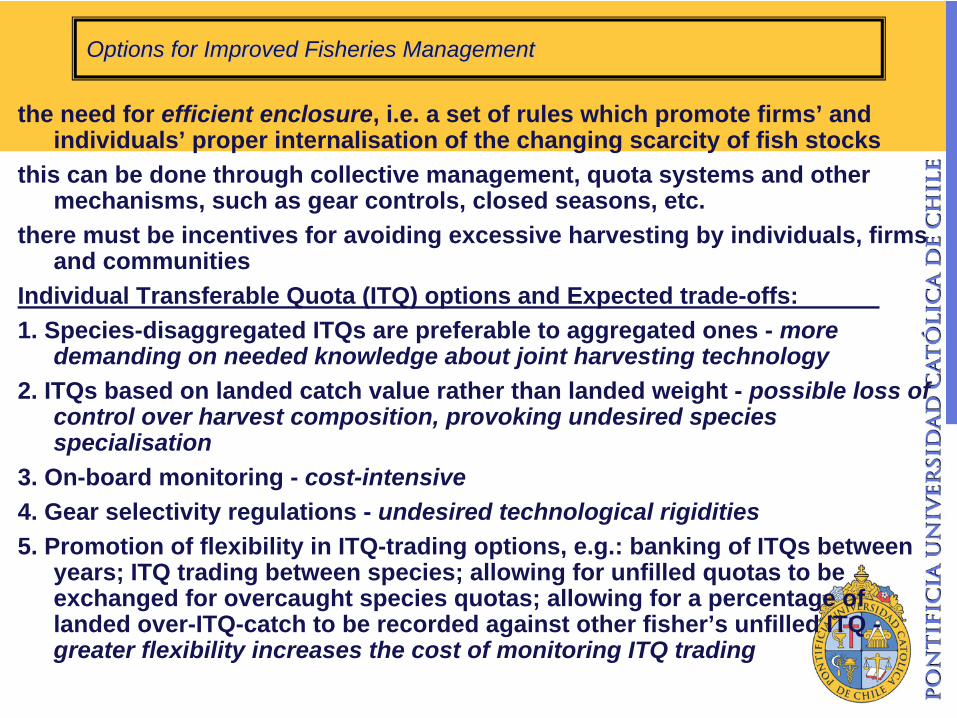
the need for efficient enclosure, i.e. a set of rules which promote firms’ and individuals’ proper internalisation of the changing scarcity of fish stocks
this can be done through collective management, quota systems and other mechanisms, such as gear controls, closed seasons, etc.
there must be incentives for avoiding excessive harvesting by individuals, firms and communities
Individual Transferable Quota (ITQ) options and Expected trade-offs:1. Species-disaggregated ITQs are preferable to aggregated ones - more
demanding on needed knowledge about joint harvesting technology2. ITQs based on landed catch value rather than landed weight - possible loss of
control over harvest composition, provoking undesired species specialisation
3. On-board monitoring - cost-intensive4. Gear selectivity regulations - undesired technological rigidities5. Promotion of flexibility in ITQ-trading options, e.g.: banking of ITQs between
years; ITQ trading between species; allowing for unfilled quotas to be exchanged for overcaught species quotas; allowing for a percentage of landed over-ITQ-catch to be recorded against other fisher’s unfilled ITQ - greater flexibility increases the cost of monitoring ITQ trading
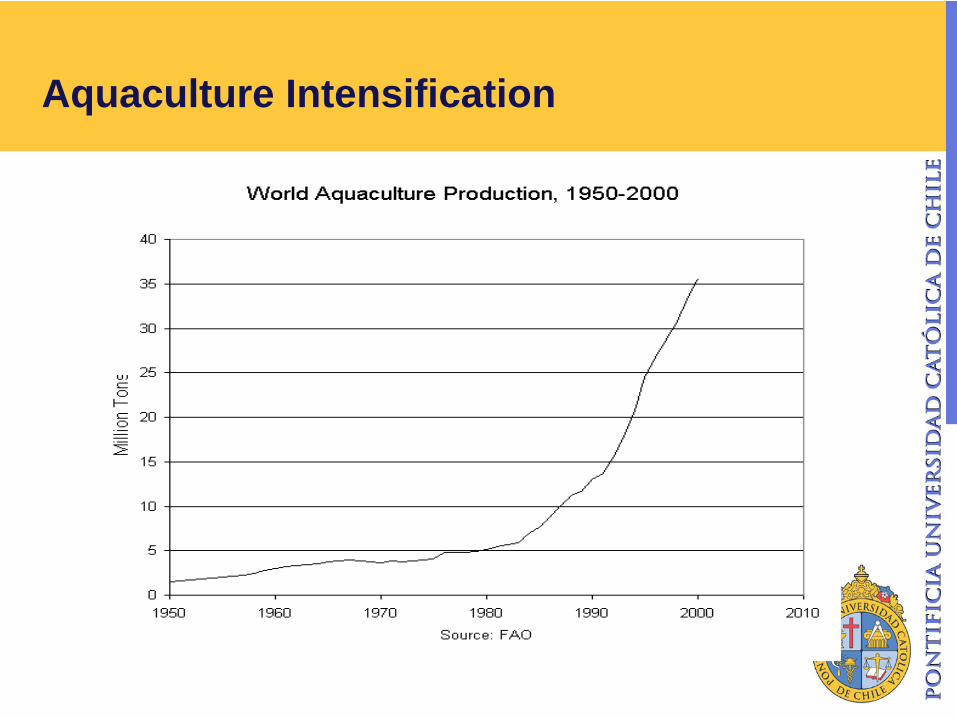
Aquaculture Intensification
Growth in Aquaculture in New Zealand and Australia (FAO data)
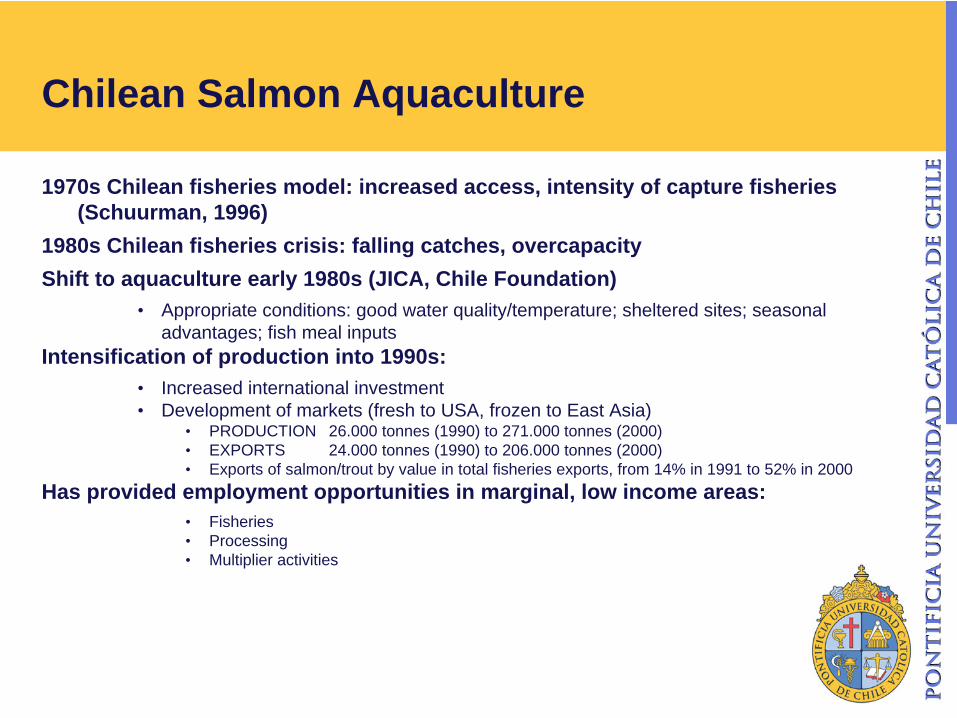
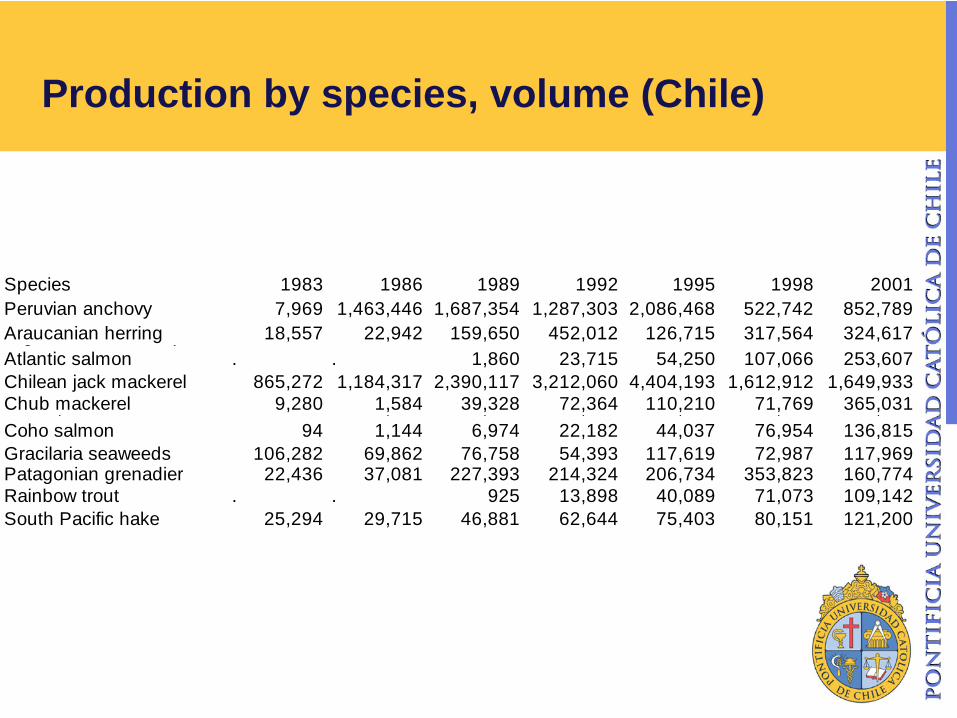
1980s Chilean fisheries crisis: falling catches, overcapacityShift to aquaculture early 1980s (JICA, Chile Foundation)
• Appropriate conditions: good water quality/temperature; sheltered sites; seasonal advantages; fish meal inputs
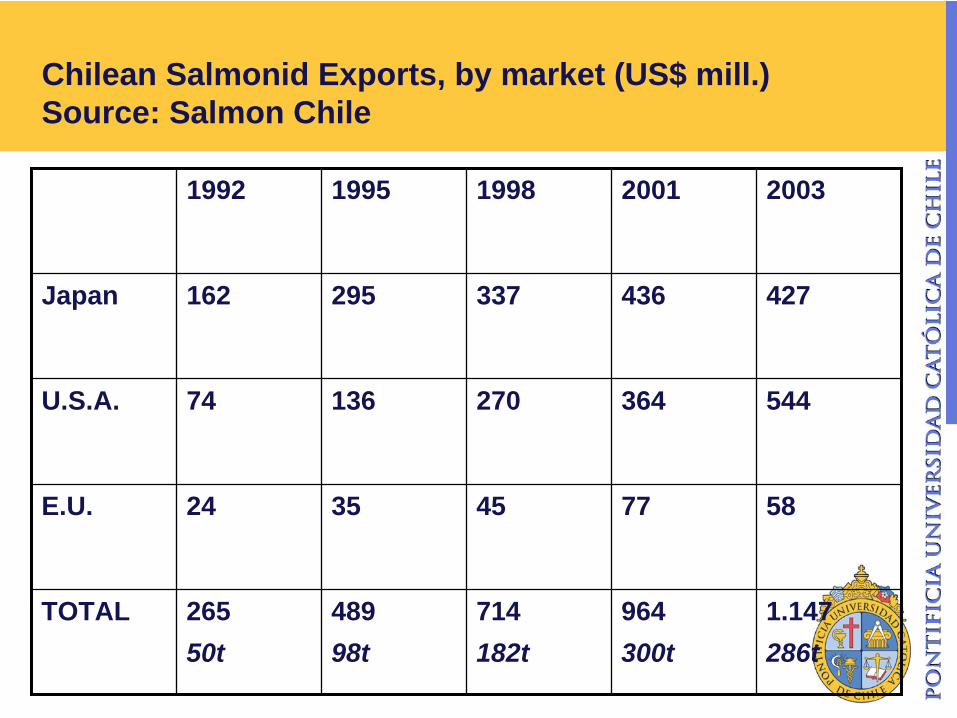
Intensification of production into 1990s: • Increased international investment• Development of markets (fresh to USA, frozen to East Asia)
• PRODUCTION 26.000 tonnes (1990) to 271.000 tonnes (2000)• EXPORTS 24.000 tonnes (1990) to 206.000 tonnes (2000)• Exports of salmon/trout by value in total fisheries exports, from 14% in 1991 to 52% in 2000
Has provided employment opportunities in marginal, low income areas:• Fisheries• Processing• Multiplier activities
Production Site
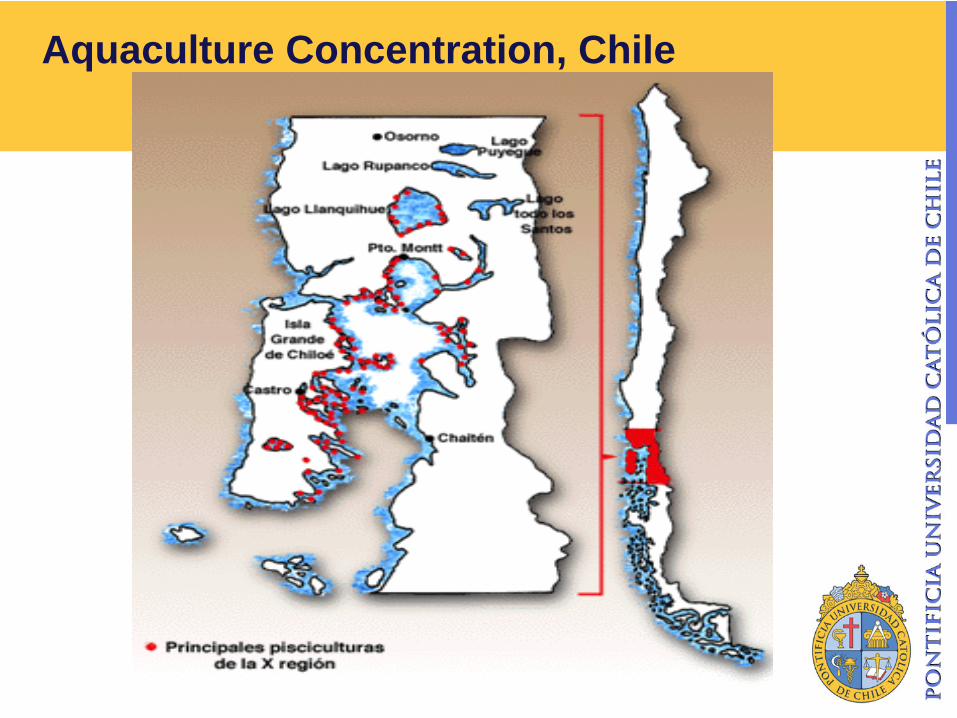
Aquaculture Concentration, Chile
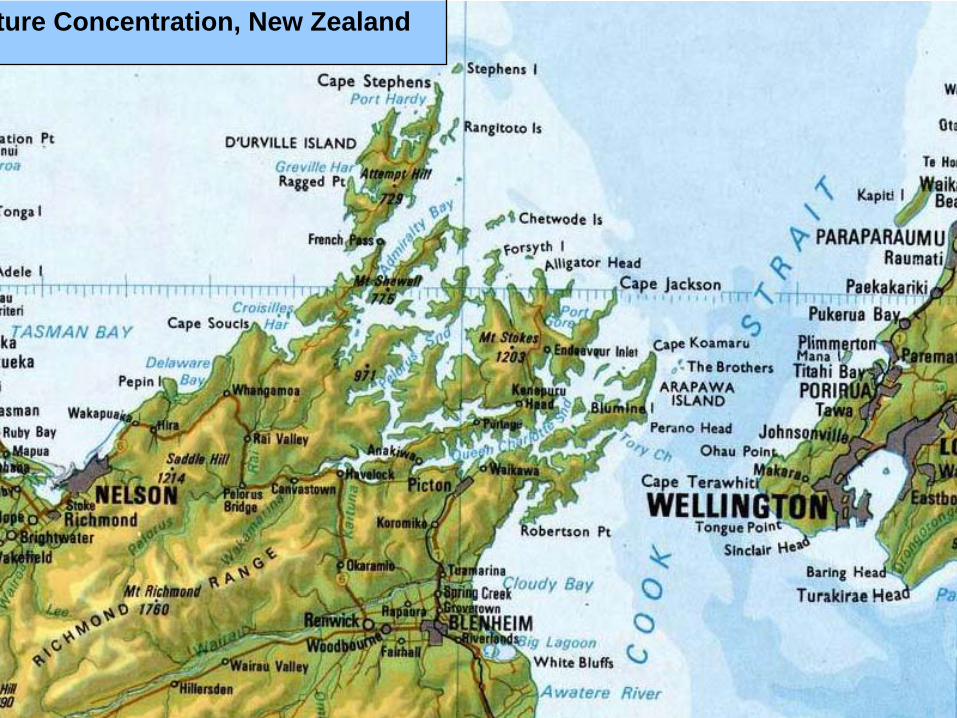
ture Concentration, New Zealand
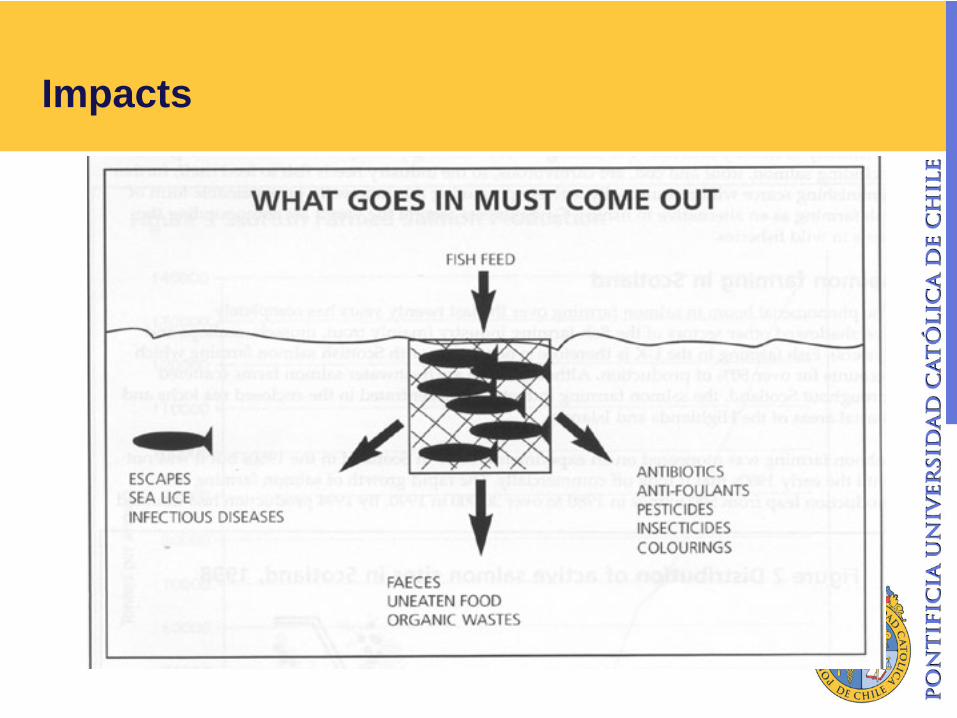
Impacts
Reducing the Impacts
ENVIRONMENTALIntensity of productionFragile marine environment(water column, benthic layer from
feed/antibiotics)
Impacts on wild fish(genetics, diseases)
Impacts on seals and sea lionsImpacts on landscape and
tourism
CONFLICTSPoor regulation and
implementationFarmers versus
environmentalistsFarmers and local people (theft)Concessions and
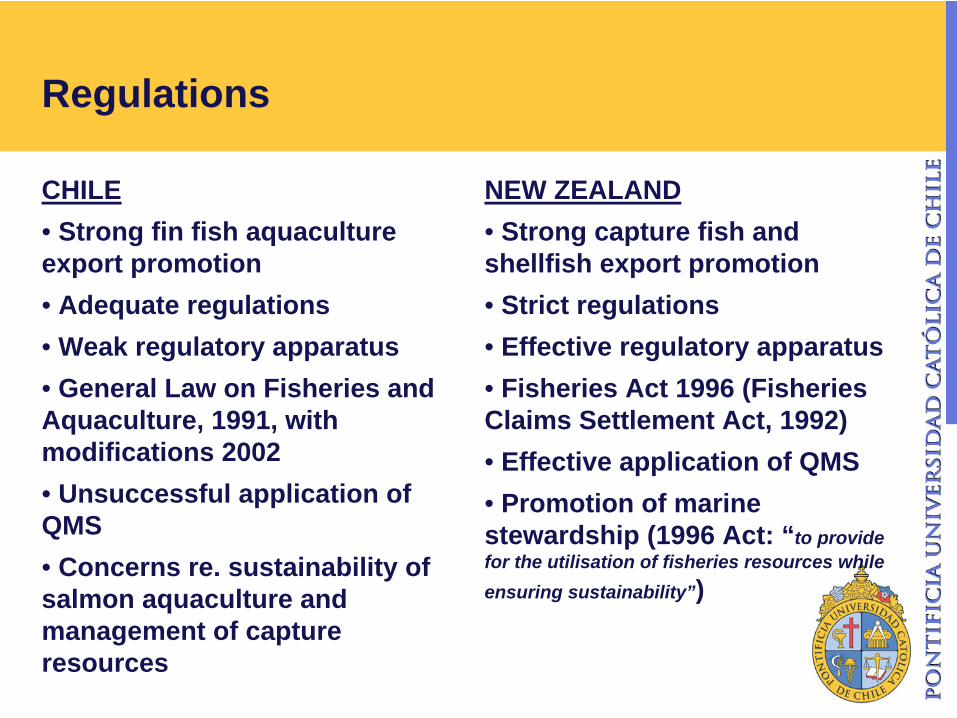
CHILE• Strong fin fish aquaculture export promotion• Adequate regulations• Weak regulatory apparatus• General Law on Fisheries and Aquaculture, 1991, with modifications 2002• Unsuccessful application of QMS• Concerns re. sustainability of salmon aquaculture and management of capture resources
NEW ZEALAND• Strong capture fish and shellfish export promotion• Strict regulations• Effective regulatory apparatus• Fisheries Act 1996 (Fisheries Claims Settlement Act, 1992)• Effective application of QMS• Promotion of marine stewardship (1996 Act: “to provide for the utilisation of fisheries resources while ensuring sustainability”)
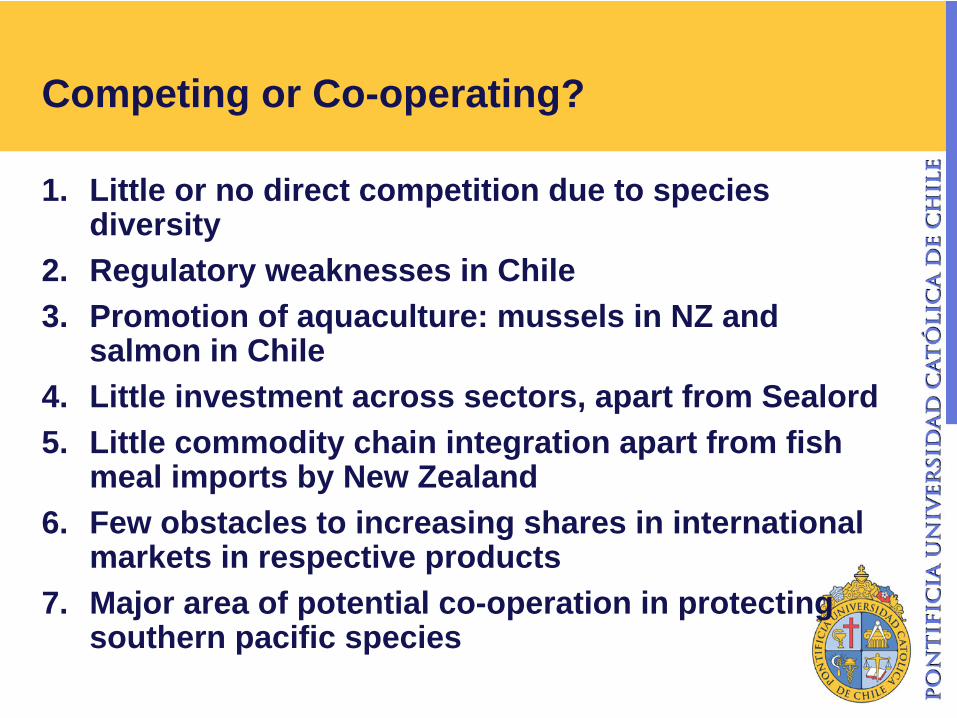
Competing or Co-operating?
1. Little or no direct competition due to species diversity
2. Regulatory weaknesses in Chile3. Promotion of aquaculture: mussels in NZ and
salmon in Chile4. Little investment across sectors, apart from Sealord5. Little commodity chain integration apart from fish
meal imports by New Zealand6. Few obstacles to increasing shares in international
markets in respective products7. Major area of potential co-operation in protecting