Census 2000 meas- ured a population of 281.4 million, 31.1 million (or 11.1 percent) of whom were foreign born. 1 Individuals from Latin America represented 52 percent, Asia 26 percent, Europe 16 percent, and other areas of the world 6.0 percent of the foreign-born popula- tion. This report, part of a series that pres- ents population and housing data collected by Census 2000, describes the distribu- tion of the foreign- born population in the United States, regions, states, counties, and places with popula- tions of 100,000 or more. 2 The concept and measurement of the foreign-born population and its characteristics have evolved across several censuses. Nativity is determined by U.S. citizenship status and place of birth (see Figure 1). The Census Bureau considers anyone who is not born a U.S. citizen to be for- eign born. Conversely, natives are those born in the United States, Puerto Rico, or a U.S. Island Area, or born abroad of a U.S. citizen parent. 3 Because a person may be born outside the United States and be a U.S. citizen at birth (i.e., they were born abroad to a U.S. citizen par- ent), information on place of birth cannot U S C E N S U S B U R E A U Helping You Make Informed Decisions U.S. Department of Commerce Economics and Statistics Administration U.S. CENSUS BUREAU Issued December 2003 C2KBR-34 The Foreign-Born Population: 2000 Census 2000 Brief By Nolan Malone Kaari F. Baluja Joseph M. Costanzo Cynthia J. Davis 1 The estimates in this report are based on responses from a sample of the population. As with all surveys, estimates may vary from the actual val- ues because of sampling variation or other factors. All statements made in this report have undergone statistical testing and are significant at the 90-per- cent confidence level unless otherwise noted. 2 The text of this report discusses data for the United States, including the 50 states and the District of Columbia. Data for the Commonwealth of Puerto Rico are shown in Tables 1 and 4, and Figure 4. Source: U.S. Census Bureau, Census 2000 questionnaire. Figure 1. Reproduction of the Questions on Place of Birth, Citizenship Status, and Year of Entry From Census 2000 Year Where was this person born? 12 In the United States — Print name of state. Outside the United States — Print name of foreign country, or Puerto Rico, Guam, etc. Is this person a CITIZEN of the United States? 13 Yes, born in the United States Skip to 15a Yes, born in Puerto Rico, Guam, the U.S. Virgin Islands, or Northern Marianas Yes, born abroad of American parent or parents Yes, a U.S. citizen by naturalization No, not a citizen of the United States When did this person come to live in the United States? Print numbers in boxes. 14 3 The U.S. Island Areas include U.S. Virgin Islands, Guam, American Samoa, and the Commonwealth of the Northern Mariana Islands.
Transcript
Census 2000 meas-ured a population of 281.4 million, 31.1 million (or 11.1 percent) of whomwere foreign born.1
Individuals from LatinAmerica represented52 percent, Asia 26 percent, Europe 16 percent, and otherareas of the world 6.0 percent of the foreign-born popula-tion. This report, partof a series that pres-ents population andhousing data collectedby Census 2000,describes the distribu-tion of the foreign-born population in theUnited States, regions,states, counties, andplaces with popula-tions of 100,000 ormore.2
The concept andmeasurement ofthe foreign-bornpopulation and itscharacteristicshave evolvedacross several censuses.
Nativity is determined by U.S. citizenshipstatus and place of birth (see Figure 1).
The Census Bureau considers anyonewho is not born a U.S. citizen to be for-eign born. Conversely, natives are thoseborn in the United States, Puerto Rico, ora U.S. Island Area, or born abroad of aU.S. citizen parent.3 Because a personmay be born outside the United Statesand be a U.S. citizen at birth (i.e., theywere born abroad to a U.S. citizen par-ent), information on place of birth cannot
U S C E N S U S B U R E A UHelping You Make Informed Decisions
U.S.Department of CommerceEconomics and Statistics Administration
U.S. CENSUS BUREAU
Issued December 2003
C2KBR-34
The Foreign-Born Population: 2000Census 2000 Brief
By Nolan MaloneKaari F. BalujaJoseph M. CostanzoCynthia J. Davis
1 The estimates in this report are based onresponses from a sample of the population. As withall surveys, estimates may vary from the actual val-ues because of sampling variation or other factors.All statements made in this report have undergonestatistical testing and are significant at the 90-per-cent confidence level unless otherwise noted.
2 The text of this report discusses data for theUnited States, including the 50 states and the Districtof Columbia. Data for the Commonwealth of PuertoRico are shown in Tables 1 and 4, and Figure 4.
Source: U.S. Census Bureau, Census 2000 questionnaire.
Figure 1.
Reproduction of the Questions on Place of Birth, Citizenship Status, and Year of Entry From Census 2000
Year
Where was this person born?12
In the United States — Print name of state.
Outside the United States — Print name of foreigncountry, or Puerto Rico, Guam, etc.
Is this person a CITIZEN of the United States?13
Yes, born in the United States Skip to 15aYes, born in Puerto Rico, Guam, the U.S. Virgin Islands,or Northern MarianasYes, born abroad of American parent or parentsYes, a U.S. citizen by naturalizationNo, not a citizen of the United States
When did this person come to live in theUnited States? Print numbers in boxes.
14
3 The U.S. Island Areas include U.S. Virgin Islands,Guam, American Samoa, and the Commonwealth ofthe Northern Mariana Islands.
2 U.S. Census Bureau
be used alone to determinewhether an individual is native orforeign born and must be used inconjunction with information oncitizenship status.
Information on nativity and the for-eign-born population is used byresearchers, federal agencies, andpolicy makers for many purposes,including determination of eligibili-ty for certain government pro-grams, examination of trends innet international migration, andanalysis of the changing composi-tion of the U.S. population.
In the 1820 and 1830 decennialcensuses, enumerators were askedto “note” individuals who werealiens (foreigners not naturalized),although no specific questions oncitizenship status were asked. In1890, explicit measures of citizen-ship status were added to the cen-sus and have remained with somevariations except in 1960.
Questions concerning an individ-ual’s place of birth have appearedin the decennial censuses since1850.4 From 1870 to 1970,parental nativity (place of birth ofthe individual’s father and mother)was also asked. Census 2000asked, “Where was this personborn?,” asking for the name of thestate for those born within theUnited States or the country namefor those born elsewhere.5
In many decennial censuses, anadditional question asked the yearin which a person born outside theUnited States (whether native orforeign born) came to live in theUnited States.6
Census 2000 asked, “Is this persona citizen of the United States?”Answers to this question catego-rized respondents into various citi-zenship groups based on the man-ner in which U.S. citizenship wasobtained (for example, born in theU.S., Puerto Rico, or a U.S. IslandArea; or born abroad to a U.S. citi-zen parent), or into a residual non-citizen group.7
The foreign-bornpopulation in the UnitedStates increased by morethan half between 1990and 2000.
Between 1990 and 2000, the for-eign-born population increased by57 percent, from 19.8 million to31.1 million, compared with anincrease of 9.3 percent for thenative population and 13 percentfor the total U.S. population (seeTable 1). The foreign born whowere naturalized citizens of theUnited States increased by 56 per-cent (from 8.0 million to 12.5 mil-lion), compared with an increase of58 percent for those who were notU.S. citizens (from 11.8 million to18.6 million).
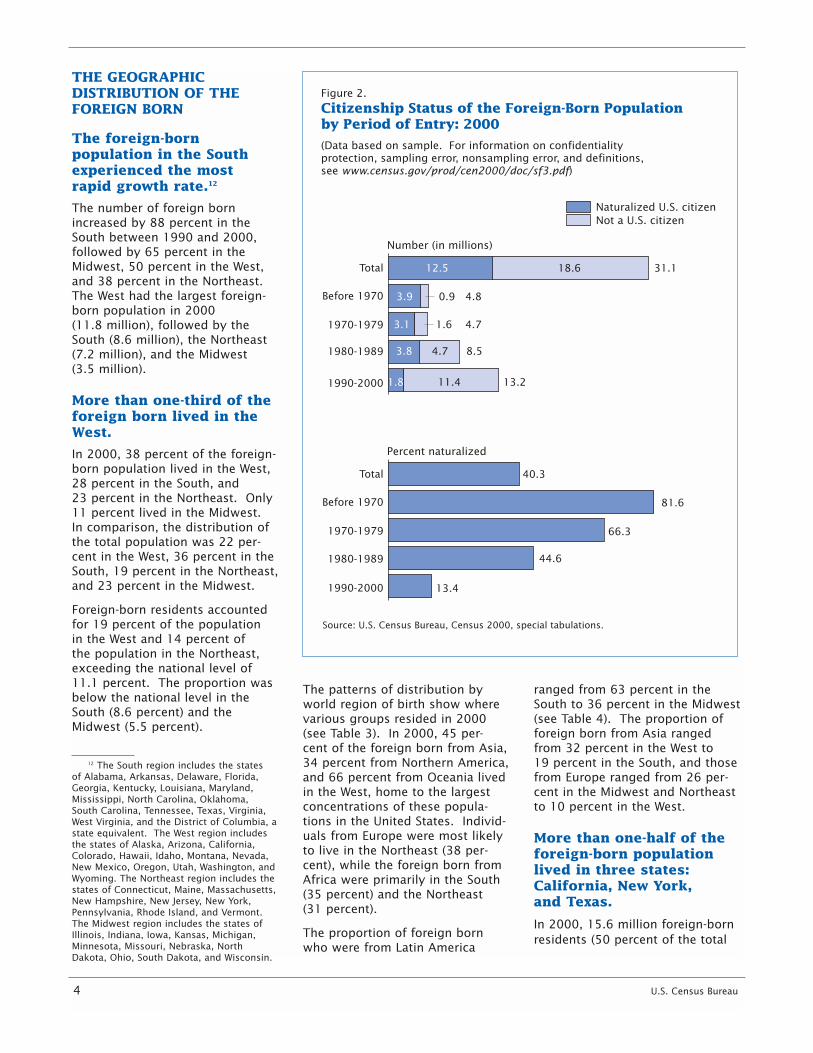
In 2000, 40.3 percent of the for-eign born were naturalized U.S. citizens, down slightly from 40.5 percent in 1990. The per-centage naturalized varied by peri-od of entry: while 82 percent ofthe foreign born who entered theUnited States prior to 1970 werenaturalized U.S. citizens in 2000,only 13 percent of those whoentered in 1990 or later were (see Figure 2).8
Over half of the foreign-born population were fromLatin America.
In 2000, over 16 million foreignborn were from Latin America, representing 52 percent of thetotal foreign-born population (seeFigure 3).9 Of the foreign bornfrom Latin America, 11.2 millionpeople (36 percent of all foreignborn) were from Central America(including Mexico), 3.0 million people (10 percent) from theCaribbean, and 1.9 million people(6.2 percent) from South America.
The foreign born from Asia andEurope accounted for 26 percent(8.2 million) and 16 percent (4.9 million) of the total foreign-born population, respectively. Theforeign born from Africa, NorthernAmerica, and Oceania each com-posed 3 percent or less of the total foreign-born population.10
Foreign born from Mexico accounted for 9.2 million people,or 30 percent of the total U.S. for-eign-born population (see Table 2),making Mexico the leading countryof birth. China (1.5 million) andthe Philippines (1.4 million) werethe next largest sources, providing 4.9 percent and 4.4 percent of thetotal foreign born, respectively.11
7 No information about dual citizenship,citizenship other than U.S., or legal (migrant)status is collected in the decennial census.
8 The naturalization process requires thatthe foreign-born applicant reside continuous-ly in the United States for 5 years (or less forspecial categories of migrants) followingadmission as a lawful permanent resident.Therefore, most of the foreign born whoarrived between 1995 and 2000 are not yeteligible to become U.S. citizens, resulting ina lower overall percentage naturalized of the foreign born who arrived in the last 10 years.
9 Latin America encompasses CentralAmerica (including Mexico), the Caribbean,and South America.
10 The Northern America region includesthe foreign countries of Canada, Bermuda,Greenland, and St. Pierre and Miquelon. TheOceania region includes Australia, NewZealand, and island countries in Melanesia,Micronesia, and Polynesia.
11 China includes those who respondedChina, Hong Kong, Taiwan, and the ParacelIslands.
4 For further discussion of the evolutionof place of birth, year of entry, and citizen-ship questions in the decennial census, seeGauthier, Jason G., 2002, Measuring America:The Decennial Censuses From 1790 to 2000,POL/02-MA, U.S. Census Bureau, Washington,DC.
5 Although a foreign-born respondentmay indicate a place of birth that is moreprecise than a foreign country of birth (e.g.,Bavaria), this information is categorizedunder the country name and is neither tabu-lated nor shown in such detail in U.S. CensusBureau data products.
6 Questions on period of entry appearedfrom 1890 to 1930 and from 1970 to 2000in various forms.
U.S. Census Bureau 3
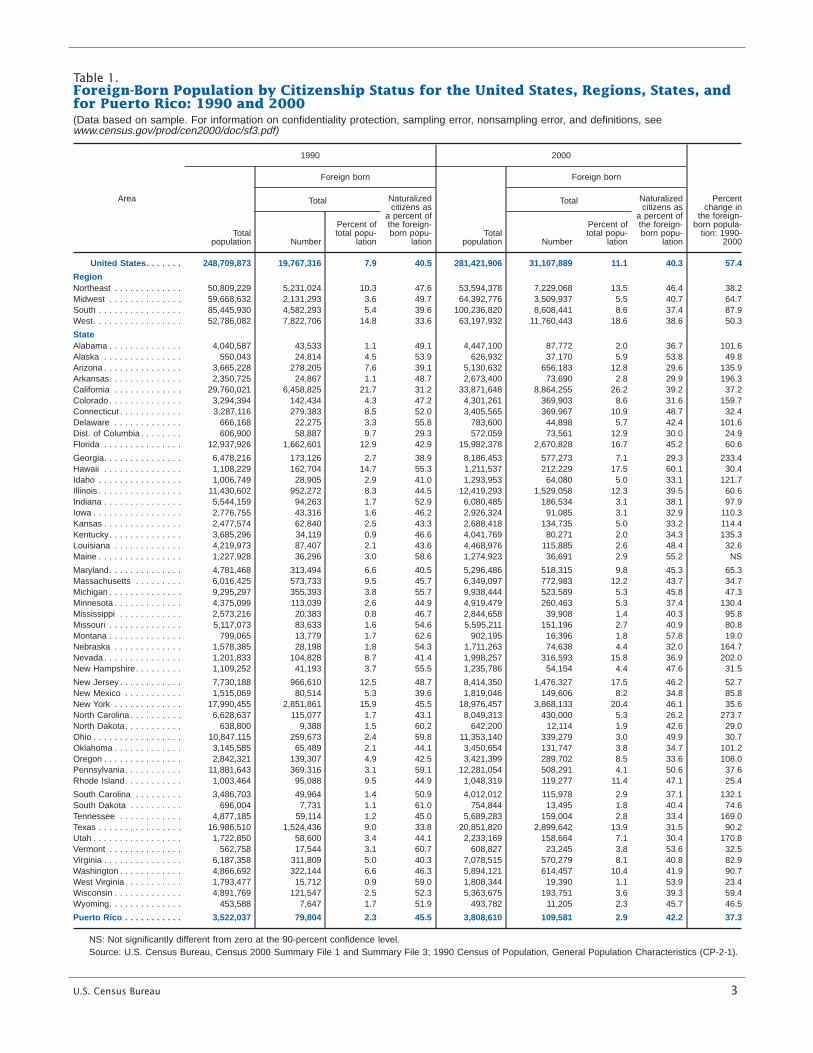
Table 1.Foreign-Born Population by Citizenship Status for the United States, Regions, States, andfor Puerto Rico: 1990 and 2000(Data based on sample. For information on confidentiality protection, sampling error, nonsampling error, and definitions, seewww.census.gov/prod/cen2000/doc/sf3.pdf)
Area
1990 2000
Percentchange in
the foreign-born popula-
tion: 1990-2000
Totalpopulation
Foreign born
Totalpopulation
Foreign born
Total Naturalizedcitizens as
a percent ofthe foreign-born popu-
lation
Total Naturalizedcitizens as
a percent ofthe foreign-born popu-
lationNumber
Percent oftotal popu-
lation Number
Percent oftotal popu-
lation
United States. . . . . . . 248,709,873 19,767,316 7.9 40.5 281,421,906 31,107,889 11.1 40.3 57.4
NS: Not significantly different from zero at the 90-percent confidence level.Source: U.S. Census Bureau, Census 2000 Summary File 1 and Summary File 3; 1990 Census of Population, General Population Characteristics (CP-2-1).
THE GEOGRAPHICDISTRIBUTION OF THEFOREIGN BORN
The foreign-bornpopulation in the Southexperienced the most rapid growth rate.12
The number of foreign bornincreased by 88 percent in theSouth between 1990 and 2000,followed by 65 percent in theMidwest, 50 percent in the West,and 38 percent in the Northeast.The West had the largest foreign-born population in 2000 (11.8 million), followed by theSouth (8.6 million), the Northeast (7.2 million), and the Midwest (3.5 million).
More than one-third of theforeign born lived in theWest.
In 2000, 38 percent of the foreign-born population lived in the West,28 percent in the South, and 23 percent in the Northeast. Only11 percent lived in the Midwest.In comparison, the distribution ofthe total population was 22 per-cent in the West, 36 percent in theSouth, 19 percent in the Northeast,and 23 percent in the Midwest.
Foreign-born residents accountedfor 19 percent of the population in the West and 14 percent of the population in the Northeast,exceeding the national level of11.1 percent. The proportion wasbelow the national level in theSouth (8.6 percent) and theMidwest (5.5 percent).
The patterns of distribution byworld region of birth show wherevarious groups resided in 2000(see Table 3). In 2000, 45 per-cent of the foreign born from Asia, 34 percent from Northern America,and 66 percent from Oceania livedin the West, home to the largestconcentrations of these popula-tions in the United States. Individ-uals from Europe were most likelyto live in the Northeast (38 per-cent), while the foreign born fromAfrica were primarily in the South(35 percent) and the Northeast (31 percent).
The proportion of foreign bornwho were from Latin America
ranged from 63 percent in theSouth to 36 percent in the Midwest(see Table 4). The proportion offoreign born from Asia rangedfrom 32 percent in the West to 19 percent in the South, and thosefrom Europe ranged from 26 per-cent in the Midwest and Northeastto 10 percent in the West.
More than one-half of theforeign-born populationlived in three states:California, New York, and Texas.
In 2000, 15.6 million foreign-bornresidents (50 percent of the total
4 U.S. Census Bureau
Figure 2.
Citizenship Status of the Foreign-Born Population by Period of Entry: 2000
(Data based on sample. For information on confidentiality protection, sampling error, nonsampling error, and definitions, see www.census.gov/prod/cen2000/doc/sf3.pdf)
Naturalized U.S. citizenNot a U.S. citizen
1990-2000
1980-1989
1970-1979
Before 1970
Total 12.5
3.8
18.6
0.9
4.7
1.6
31.1
4.8
8.5
3.9
3.1
13.2 1.8 11.4
Number (in millions)
Source: U.S. Census Bureau, Census 2000, special tabulations.
1990-2000
1980-1989
1970-1979
Before 1970
Total 40.3
81.6
44.6
13.4
Percent naturalized
66.3
4.7
12 The South region includes the states of Alabama, Arkansas, Delaware, Florida,Georgia, Kentucky, Louisiana, Maryland,Mississippi, North Carolina, Oklahoma, South Carolina, Tennessee, Texas, Virginia,West Virginia, and the District of Columbia, astate equivalent. The West region includesthe states of Alaska, Arizona, California,Colorado, Hawaii, Idaho, Montana, Nevada,New Mexico, Oregon, Utah, Washington, andWyoming. The Northeast region includes thestates of Connecticut, Maine, Massachusetts,New Hampshire, New Jersey, New York,Pennsylvania, Rhode Island, and Vermont.The Midwest region includes the states ofIllinois, Indiana, Iowa, Kansas, Michigan,Minnesota, Missouri, Nebraska, NorthDakota, Ohio, South Dakota, and Wisconsin.
U.S. Census Bureau 5
foreign born) lived in these threestates, and 21.3 million foreign-born residents (68 percent) lived inthe six states with foreign-bornpopulations of 1.0 million or more:California, Florida, Illinois, NewJersey, New York, and Texas. Incontrast, these six states werehome to 39 percent of all U.S. resi-dents in 2000. The foreign born inCalifornia accounted for 8.9 million(29 percent of the total), followedby New York with 3.9 million (12 percent), and Texas with 2.9 million (9.3 percent). The foreign-born population rangedfrom 500,000 up to 1 million in 8 states and from 100,000 up to500,000 in 19 states. The for-eign born numbered fewer than100,000 in the 17 remaining statesand the District of Columbia.
The foreign born in NorthCarolina, Georgia, andNevada grew by 200percent or more.
From 1990 to 2000, the foreignborn increased by 200 percent or more in three states: NorthCarolina, 274 percent; Georgia,233 percent; and Nevada, 202 per-cent.13 In 16 states, this groupgrew by 100 percent to 199 per-cent; in 12 states by 57 percent(the national average) to 100 per-cent, and by less than 57 percentin the remaining 19 states and theDistrict of Columbia. The onlygrowth rate below 10 percentoccurred in Maine (1.1 percent).
The foreign bornaccounted for over one-quarter of the populationin California.
The foreign born represented 26 percent of the population inCalifornia in 2000, the highest pro-portion in any state. The percent-age also surpassed the nationalaverage (11.1 percent) in nine
Figure 3.Percent Distribution of the Foreign-Born Population by World Region of Birth: 2000
Note: Adds to 99.9 percent due to rounding. Source: U.S. Census Bureau, Census 2000, Summary File 3.
Central America 36.0
Caribbean 9.5
AFRICA 2.8
ASIA 26.4
South America 6.2
(Data based on sample. For information on confidentiality protection, sampling error, nonsampling error, and definitions, see www.census.gov/prod/cen2000/doc/sf3.pdf)
OCEANIA 0.5
EUROPE 15.8
NORTHERN AMERICA 2.7
LATIN AMERICA 51.7
Table 2.Top Ten Countries of Birth of the Foreign-BornPopulation: 2000(Data based on sample. For information on confidentiality protection, sampling error,nonsampling error, and definitions, see www.census.gov/prod/cen2000/doc/sf3.pdf)
Country of birthNumber
Percent offoreign-born
population90-percent confidence
interval on number
Total foreign born . . . . . 31,107,889 100.0 31,080,801 - 31,134,977
Top ten countries . . . . . . . . . 18,157,587 58.4 18,143,429 - 18,171,745
All other countries . . . . . . . . 12,950,302 41.6 12,936,144 - 12,964,460
1 Includes those who responded China, Hong Kong, Taiwan, and the Paracel Islands.2 The estimated foreign-born population from Cuba does not statistically differ from that of Korea.3 Includes those who responded Korea, North Korea, and South Korea.4 The estimated foreign-born population from Canada does not statistically differ from that of
El Salvador.
Source: U.S. Census Bureau, Census 2000, Summary File 3.13 Although the point estimate for the
increase in the foreign-born population inArkansas (196 percent) appears to be lessthan 200 percent, no statistical differenceexists between the two percentages.
other states and the District ofColumbia: New York (20 percent),New Jersey and Hawaii (18 percenteach), Florida (17 percent), Nevada(16 percent), Texas (14 percent),the District of Columbia andArizona (13 percent each), andIllinois and Massachusetts (12 percent each).
In 2000, 36 percent of the foreignborn from Asia, 31 percent fromLatin America, 17 percent fromNorthern America, and 40 percentfrom Oceania resided in California,accounting for the highest propor-tions of people from each of theseregions of birth. Eighteen percentof the foreign born from Europeand 13 percent from Africa lived in New York.
The foreign born from LatinAmerica, Asia, and Europe wereconcentrated in different states.The foreign born from LatinAmerica constituted over 70 per-cent of the foreign-born popula-tions in four states: Arizona (72 percent), Florida (73 percent),New Mexico (77 percent), andTexas (75 percent). Those fromAsia accounted for 40 percent or more of the foreign-born
population in six states: Alaska (51 percent), Hawaii (83 percent),Michigan (40 percent), Minnesota(40 percent), Virginia (41 percent),and West Virginia (43 percent).Those from Europe composed over 35 percent in five states:Connecticut (38 percent), Montana(40 percent), Ohio (39 percent),Pennsylvania (36 percent), andVermont (39 percent).
The foreign born who were natu-ralized U.S. citizens (40 percentnationally) outnumbered thosewho were not U.S. citizens in onlyseven states: Alaska, Hawaii,Maine, Montana, Pennsylvania,Vermont, and West Virginia. Theproportion naturalized ranged from60 percent in Hawaii to 26 percentin North Carolina.
High concentrations of the foreign born lived incounties in traditional“gateway” areas of theUnited States.
In 2000, the percentage foreign-born was at or above the nationalaverage (11.1 percent) in only 199of the 3,141 counties (and countyequivalents) in the United States.Many of these counties are in
traditional receiving areas forimmigrants: southwestern borderstates (California to Texas) and theNew York City and Miami metropol-itan areas. Additional areas withhigh concentrations of the foreign-born population included thePacific Northwest and theWashington, DC metropolitan area.
The foreign born were the majorityof the population in only one U.S.county: Miami-Dade County,Florida, which was home to 1.1 million foreign born (51 percent of the county’s population).
The foreign born represented 20 percent or more in 60 addition-al counties, some of which are farfrom the “gateway” areas notedearlier: Clark County, Idaho;Seward County, Finney County and Ford County, Kansas; FranklinCounty and Adams County,Washington; and Aleutians West Census Area, Alaska.
The proportion foreign-bornranged from 11.1 percent (thenational average) to 19.9 percentof the population in 138 counties,from 7.5 percent to 11.0 percent in141 counties, and from 3.0 percent
6 U.S. Census Bureau
Table 3.Foreign-Born Population by World Region of Birth for the United States and Regions: 2000(Data based on sample. For information on confidentiality protection, sampling error, nonsampling error, and definitions, seewww.census.gov/prod/cen2000/doc/sf3.pdf)
Area
Totalforeign-
born popu-lation1 Europe Asia Africa Oceania
NorthernAmerica2
Latin America
Total MexicoOther Latin
America
NUMBER
United States . . . 31,107,573 4,915,557 8,226,254 881,300 168,046 829,442 16,086,974 9,177,487 6,909,487
1 Does not include the foreign-born population ‘‘born at sea’’.2 The region Northern America includes the foreign countries of Canada, Bermuda, Greenland, and St. Pierre and Miquelon.
Source: U.S. Census Bureau, Census 2000, Summary File 3.
U.S. Census Bureau 7
Table 4.Percent Distribution of the Foreign-Born Population by World Region of Birth for theUnited States, Regions, States, and Puerto Rico: 2000(Data based on sample. For information on confidentiality protection, sampling error, nonsampling error, and definitions, seewww.census.gov/prod/cen2000/doc/sf3.pdf)
AreaTotal foreign-born popula-
tion1
Percent distribution
Europe Asia Africa OceaniaNorthernAmerica2
Latin America
Total MexicoOther Latin
America
United States. . . . . . . 31,107,573 15.8 26.4 2.8 0.5 2.7 51.7 29.5 22.2
1 Does not include the foreign-born population ‘‘born at sea.’’2 The region Northern America includes the foreign countries of Canada, Bermuda, Greenland, and St. Pierre and Miquelon.Source: U.S. Census Bureau, Census 2000, Summary File 3.
8U
.S. Cen
sus Bu
reau
14.0 to 26.2
11.1 to 13.9
4.5 to 11.0
1.1 to 4.4
The Foreign-BornPopulation: 2000
Source: U.S. Census Bureau, Census 2000 SummaryFile 3. American Factfinder at factfinder.census.govprovides census data and mapping tools.
Percent foreignborn by state
20.0 to 50.9
11.1 to 19.9
7.5 to 11.0
3.0 to 7.4
Less than 3.0
U.S. percent 11.1
U.S. percent 11.1
(Data based on sample. For information on confidentiality protection, sampling error, nonsampling error, and definitions, see www.census.gov/prod/cen2000/doc/sf3.pdf)
Figure 4.
0 100 Miles0 100 Miles0 100 Miles
0 100 Miles
Percent foreignborn by county
to 7.4 percent in 680 counties.The remaining 2,121 counties,where the foreign born accountedfor less than 3.0 percent of thepopulation, were concentrated inthe Midwest and in several statesin the South (Kentucky, Tennessee,Alabama, and Mississippi).
More than 3 million foreignborn lived in Los AngelesCounty, California.
In 2000, four counties encom-passed 22 percent of the total U.S. foreign-born population: LosAngeles County, California (3.4 mil-lion); Miami-Dade County, Florida(1.1 million); Cook County, Illinois(1.1 million); and Queens County,New York (1.0 million).14
The foreign-born population num-bered from 100,000 to 1.0 millionin 56 counties, from 10,000 to99,999 in 224 counties, from1,000 to 9,999 in 789 counties,and from 100 to 999 in 1,409counties. It was below 100 in 659 counties.
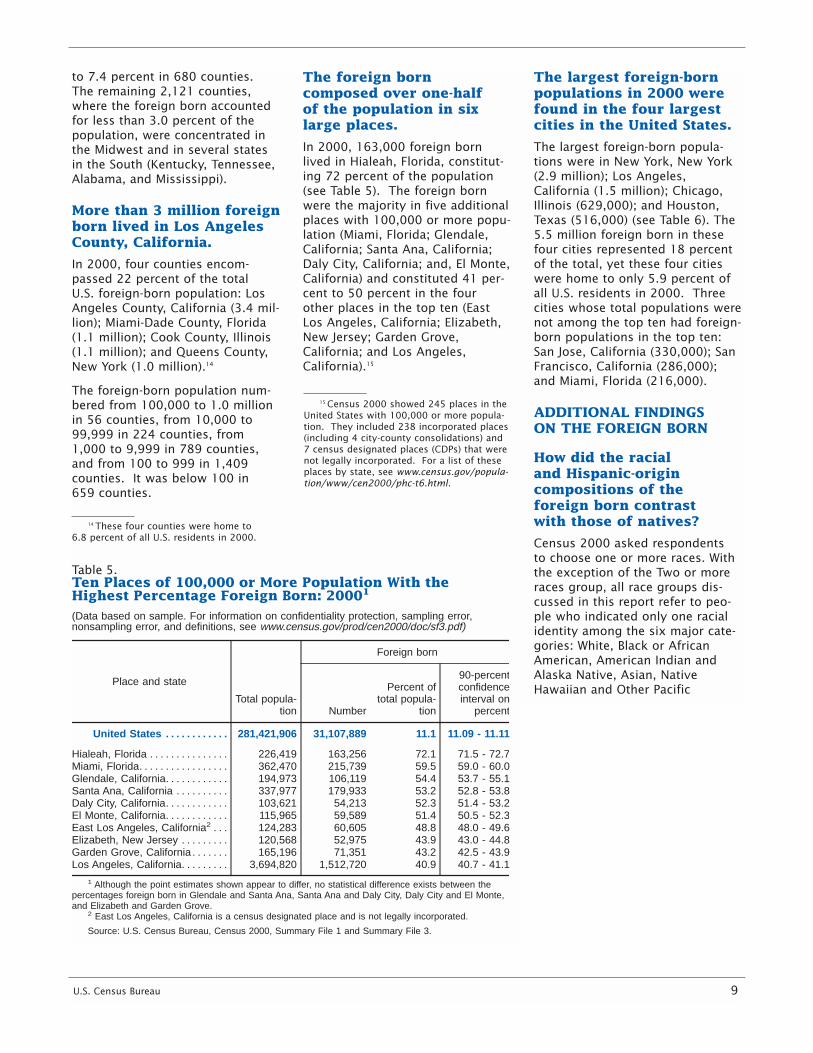
The foreign borncomposed over one-half of the population in sixlarge places.
In 2000, 163,000 foreign bornlived in Hialeah, Florida, constitut-ing 72 percent of the population(see Table 5). The foreign bornwere the majority in five additionalplaces with 100,000 or more popu-lation (Miami, Florida; Glendale,California; Santa Ana, California;Daly City, California; and, El Monte,California) and constituted 41 per-cent to 50 percent in the fourother places in the top ten (EastLos Angeles, California; Elizabeth,New Jersey; Garden Grove,California; and Los Angeles,California).15
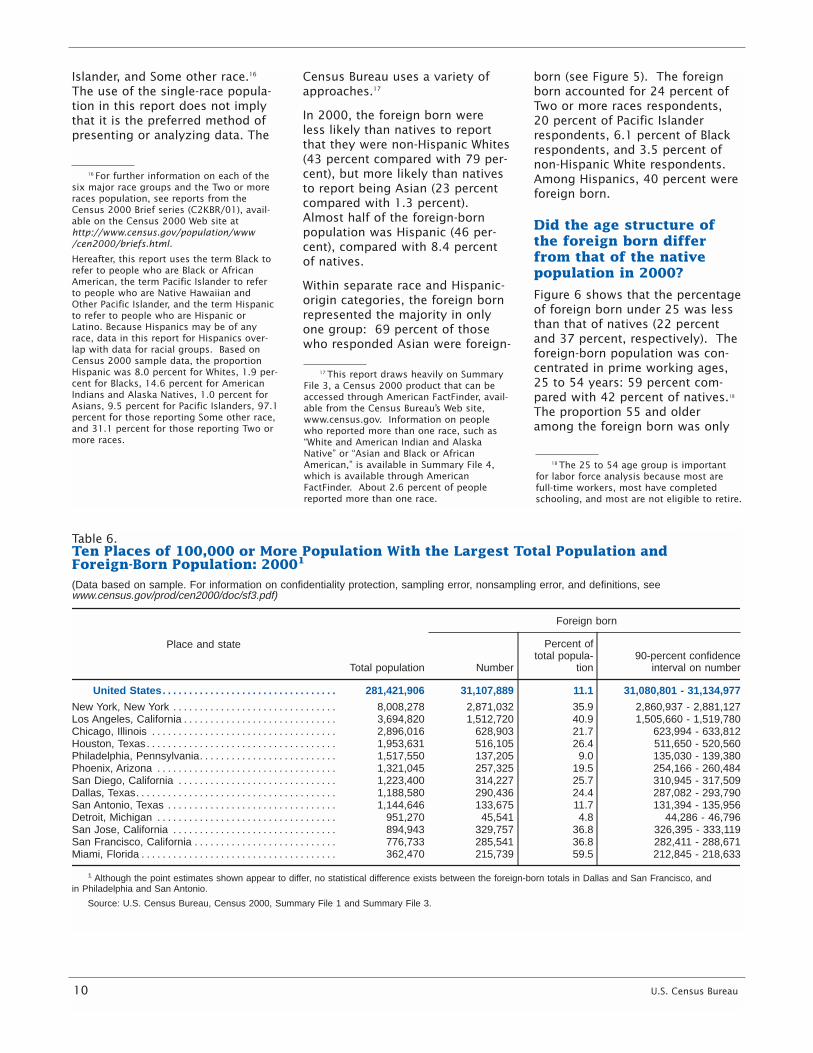
The largest foreign-bornpopulations in 2000 werefound in the four largestcities in the United States.
The largest foreign-born popula-tions were in New York, New York(2.9 million); Los Angeles,California (1.5 million); Chicago,Illinois (629,000); and Houston,Texas (516,000) (see Table 6). The5.5 million foreign born in thesefour cities represented 18 percentof the total, yet these four citieswere home to only 5.9 percent ofall U.S. residents in 2000. Threecities whose total populations werenot among the top ten had foreign-born populations in the top ten:San Jose, California (330,000); SanFrancisco, California (286,000);and Miami, Florida (216,000).
ADDITIONAL FINDINGS ON THE FOREIGN BORN
How did the racial and Hispanic-origincompositions of theforeign born contrast with those of natives?
Census 2000 asked respondents to choose one or more races. Withthe exception of the Two or moreraces group, all race groups dis-cussed in this report refer to peo-ple who indicated only one racialidentity among the six major cate-gories: White, Black or AfricanAmerican, American Indian andAlaska Native, Asian, NativeHawaiian and Other Pacific
U.S. Census Bureau 9
15 Census 2000 showed 245 places in theUnited States with 100,000 or more popula-tion. They included 238 incorporated places(including 4 city-county consolidations) and7 census designated places (CDPs) that werenot legally incorporated. For a list of theseplaces by state, see www.census.gov/popula-tion/www/cen2000/phc-t6.html.
Table 5.Ten Places of 100,000 or More Population With theHighest Percentage Foreign Born: 20001
(Data based on sample. For information on confidentiality protection, sampling error,nonsampling error, and definitions, see www.census.gov/prod/cen2000/doc/sf3.pdf)
Place and state
Total popula-tion
Foreign born
Number
Percent oftotal popula-
tion
90-percentconfidenceinterval on
percent
United States . . . . . . . . . . . . 281,421,906 31,107,889 11.1 11.09 - 11.11
1 Although the point estimates shown appear to differ, no statistical difference exists between thepercentages foreign born in Glendale and Santa Ana, Santa Ana and Daly City, Daly City and El Monte,and Elizabeth and Garden Grove.
2 East Los Angeles, California is a census designated place and is not legally incorporated.
Source: U.S. Census Bureau, Census 2000, Summary File 1 and Summary File 3.
14 These four counties were home to 6.8 percent of all U.S. residents in 2000.
Islander, and Some other race.16
The use of the single-race popula-tion in this report does not implythat it is the preferred method ofpresenting or analyzing data. The
Census Bureau uses a variety ofapproaches.17
In 2000, the foreign born were less likely than natives to reportthat they were non-Hispanic Whites(43 percent compared with 79 per-cent), but more likely than nativesto report being Asian (23 percentcompared with 1.3 percent).Almost half of the foreign-bornpopulation was Hispanic (46 per-cent), compared with 8.4 percentof natives.
Within separate race and Hispanic-origin categories, the foreign bornrepresented the majority in onlyone group: 69 percent of thosewho responded Asian were foreign-
born (see Figure 5). The foreignborn accounted for 24 percent ofTwo or more races respondents, 20 percent of Pacific Islanderrespondents, 6.1 percent of Blackrespondents, and 3.5 percent ofnon-Hispanic White respondents.Among Hispanics, 40 percent wereforeign born.
Did the age structure ofthe foreign born differfrom that of the nativepopulation in 2000?
Figure 6 shows that the percentageof foreign born under 25 was lessthan that of natives (22 percentand 37 percent, respectively). Theforeign-born population was con-centrated in prime working ages,25 to 54 years: 59 percent com-pared with 42 percent of natives.18
The proportion 55 and olderamong the foreign born was only
10 U.S. Census Bureau
Table 6.Ten Places of 100,000 or More Population With the Largest Total Population andForeign-Born Population: 20001
(Data based on sample. For information on confidentiality protection, sampling error, nonsampling error, and definitions, seewww.census.gov/prod/cen2000/doc/sf3.pdf)
1 Although the point estimates shown appear to differ, no statistical difference exists between the foreign-born totals in Dallas and San Francisco, andin Philadelphia and San Antonio.
Source: U.S. Census Bureau, Census 2000, Summary File 1 and Summary File 3.
17 This report draws heavily on SummaryFile 3, a Census 2000 product that can beaccessed through American FactFinder, avail-able from the Census Bureau’s Web site,www.census.gov. Information on peoplewho reported more than one race, such as“White and American Indian and AlaskaNative” or “Asian and Black or AfricanAmerican,” is available in Summary File 4,which is available through AmericanFactFinder. About 2.6 percent of peoplereported more than one race.
18 The 25 to 54 age group is importantfor labor force analysis because most arefull-time workers, most have completedschooling, and most are not eligible to retire.
16 For further information on each of thesix major race groups and the Two or moreraces population, see reports from theCensus 2000 Brief series (C2KBR/01), avail-able on the Census 2000 Web site athttp://www.census.gov/population/www/cen2000/briefs.html.
Hereafter, this report uses the term Black torefer to people who are Black or AfricanAmerican, the term Pacific Islander to referto people who are Native Hawaiian andOther Pacific Islander, and the term Hispanicto refer to people who are Hispanic orLatino. Because Hispanics may be of anyrace, data in this report for Hispanics over-lap with data for racial groups. Based onCensus 2000 sample data, the proportionHispanic was 8.0 percent for Whites, 1.9 per-cent for Blacks, 14.6 percent for AmericanIndians and Alaska Natives, 1.0 percent forAsians, 9.5 percent for Pacific Islanders, 97.1percent for those reporting Some other race,and 31.1 percent for those reporting Two ormore races.
slightly smaller than that of natives(20 percent and 21 percent,respectively).
ABOUT CENSUS 2000
Why did Census 2000 ask about place of birth,citizenship status, and year of entry?
The questions on place of birth,citizenship status, and year ofentry provide essential data forsetting and evaluating U.S. immi-gration policies and laws and formonitoring civil rights compliance.For example, under the RefugeeEducation Assistance Act, thesedata are used to allocate funds topublic and private nonprofit organ-izations that provide employmentresources aimed at making foreign-born residents economically self-sufficient. Knowing the character-istics of migrants, particularly theircitizenship status, length of resi-dence, and employment status,helps legislators and others under-stand how different migrantgroups are integrated into society.
ACCURACY OF THE ESTIMATES
The data contained in this reportare based on the sample of house-holds who responded to theCensus 2000 long form.Nationally, approximately one out of every six housing units was included in this sample. As aresult, the sample estimates maydiffer somewhat from the 100-per-cent figures that would have beenobtained if all housing units, peo-ple within those housing units, andpeople living in group quarters hadbeen enumerated using the samequestionnaires, instructions, enu-merators, and so forth. The sam-ple estimates also differ from thevalues that would have beenobtained from different samples ofhousing units, and hence of peopleliving in those housing units, andpeople living in group quarters.The deviation of a sample estimatefrom the average of all possiblesamples is called the samplingerror.
In addition to the variability thatarises from the sampling proce-dures, both sample data and 100-percent data are subject tononsampling error. Nonsamplingerror may be introduced duringany of the various complex opera-tions used to collect and processdata. Such errors may include:not enumerating every householdor every person in the population,failing to obtain all required infor-mation from the respondents,obtaining incorrect or inconsistentinformation, and recording infor-mation incorrectly. In addition,errors can occur during the fieldreview of the enumerators’ work,during clerical handling of the cen-sus questionnaires, or during theelectronic processing of the ques-tionnaires.
While it is impossible to completelyeliminate error from an operationas large and complex as the decen-nial census, the Census Bureau
attempts to control the sources ofsuch error during the data collec-tion and processing operations.The primary sources of error andthe programs instituted to controlerror in Census 2000 are describedin detail in Summary File 3Technical Documentation underChapter 8, “Accuracy of the Data,”located at www.census.gov/prod/cen2000/doc/sf3.pdf.
Nonsampling error may affect the data in two ways: (1) errorsthat are introduced randomly willincrease the variability of the data and, therefore, should bereflected in the standard errors;and (2) errors that tend to be con-sistent in one direction will biasboth sample and 100-percent datain that direction. For example, ifrespondents consistently tend to underreport their incomes, then the resulting estimates of households or families byincome category will tend to be
U.S. Census Bureau 11
Figure 5.
Percent Foreign Born for the Population by Race and Hispanic Origin: 2000
Source: U.S. Census Bureau, Census 2000, special tabulations.
(Data based on sample. For information on confidentiality protection, sampling error, nonsampling error, and definitions, see www.census.gov/prod/cen2000/doc/sf3.pdf)
White alone, notHispanic or Latino
Hispanic or Latino(of any race)
Two or more races
Some other race alone
Native Hawaiian andOther Pacific Islander alone
Asian alone
American Indian andAlaska Native alone
Black or AfricanAmerican alone
White alone
Total Population
40.2
11.1
6.3
6.1
5.4
68.9
19.9
43.4
23.5
3.5
understated for the higher incomecategories and overstated for thelower income categories. Suchbiases are not reflected in the standard errors.
All statements in this Census 2000Brief have undergone statisticaltesting and all comparisons aresignificant at the 90-percent confi-dence level, unless otherwisenoted. The estimates in tables,maps, and other figures may varyfrom actual values due to samplingand nonsampling errors. As aresult, estimates in one categoryused to summarize statistics in the maps and figures may not besignificantly different from esti-mates assigned to a different cate-
gory. Further information on theaccuracy of the data is located atwww.census.gov/prod/cen2000/doc/sf3.pdf. For further informa-tion on the computation and use of standard errors, contact theDecennial Statistical StudiesDivision at 301-763-4242.
FOR MORE INFORMATION
The Census 2000 Summary File 3data are available from theAmerican Factfinder on the Internet(factfinder.census.gov). They werereleased on a state-by-state basisduring 2002. For information on confidentiality protection, nonsampling error, sampling error, and definitions, also see
www.census.gov/prod/cen2000/doc/sf3.pdf or contact theCustomer Services Center at 301-763-INFO (4636).
Information on population andhousing topics is presented in theCensus 2000 Brief series, locatedon the Census Bureau’s Web site atwww.census.gov/population/www/cen2000/briefs.html. This seriespresents information on race,Hispanic origin, age, sex, house-hold type, housing tenure, andsocial, economic, and housingcharacteristics, such as ancestry,income, and housing costs.
0-4
5-9
10-14
15-19
20-24
25-29
30-34
35-39
40-44
45-49
50-54
55-59
60-64
65-69
70-74
75-79
80-84
85+
Age
0-4
5-9
10-14
15-19
20-24
25-29
30-34
35-39
40-44
45-49
50-54
55-59
60-64
65-69
70-74
75-79
80-84
85+
AgeMale Female Male Female
1 Each bar represents the percent of the population (foreign-born or native) who were in the specified age-sex group.Source: U.S. Census Bureau, Census 2000, special tabulations.
(In percent)1
Foreign Born Native
0.4
0.5
0.9
1.1
1.4
1.8
2.2
3.2
4.0
5.1
5.8
6.0
5.8
4.8
3.0
1.9
1.2
0.6 0.6
1.2
1.8
2.5
3.9
5.2
5.5
5.6
5.0
4.1
3.4
2.6
2.3
1.9
1.7
1.3
0.7
0.9 0.4
0.7
1.1
1.4
1.6
1.8
2.3
3.0
3.5
3.9
3.9
3.3
3.2
3.3
3.7
4.0
4.1
3.8
1.1
1.2
1.6
1.8
1.8
2.0
2.4
3.1
3.6
4.0
3.9
3.4
3.2
3.2
3.5
3.8
3.9
3.6
Figure 6.Age and Sex by Nativity: 2000(Data based on sample. For information on confidentiality protection, sampling error, nonsampling error, and definitions, see www.census.gov/prod/cen2000/doc/sf3.pdf)