Page 1
The freshwater tidal wetland Liberty Island, CA was botha source and sink of inorganic and organic materialto the San Francisco Estuary
P. W. Lehman • S. Mayr • L. Mecum •
C. Enright
Received: 24 February 2009 / Accepted: 12 October 2009
� Springer Science+Business Media B.V. 2009
Abstract It is hypothesized that perennial freshwater
tidal wetland habitat exports inorganic and organic
material needed to support the estuarine food web and
to create favorable habitat for aquatic organisms in San
Francisco Estuary. It is also hypothesized that most of
the material flux in this river-dominated region is
controlled by river flow. The production and export of
material by Liberty Island were measured and com-
pared using discrete monthly and continuous (15 min)
measurements of a suite of inorganic and organic
materials and flow between 2004 and 2005. Seasonal
material flux was estimated from monthly discrete data
for inorganic nutrients, suspended solids and salts,
organic carbon and nitrogen and phytoplankton and
zooplankton group carbon and chlorophyll a and
pheophytin pigment. Estimates of material flux from
monthly values were compared with measured daily
material flux values for chlorophyll a concentration,
salt and suspended solids obtained from continuous
measurements (15 min) using YSI water quality
sondes. Phytoplankton carbon produced within the
wetland was estimated by in situ primary productivity.
Most inorganic and organic materials were exported
from the wetland on an annual basis, but the magnitude
and direction varied seasonally. Dissolved inorganic
nutrients such as nitrate, soluble phosphorus, total
phosphorus and silica as well as total suspended solids
were exported in the summer while total and dissolved
organic carbon were exported in the winter. Salts like
chloride and bromide were exported in the fall.
Chlorophyll a and pheophytin were exported in the
fall and associated with diatom and cyanobacteria
carbon. Mesozooplankton carbon was dominated by
calanoid copepods and exported most of the year
except summer. Continuous sampling revealed high
hourly and daily variation in chlorophyll a, salt and
total suspended solids flux due to high frequency
changes in concentration and tidal flow. In fact, tidal
flow rather than river discharge was responsible for
90% or more of the material flux of the wetland. These
studies indicate that freshwater tidal wetlands can be a
source of inorganic and organic material but the export
of material is highly variable spatially and temporally,
varies most closely with tidal flow and requires high
frequency measurements of both tidal flow and
material concentration for accurate estimates.
Keywords Freshwater tidal wetland �Material flux � Phytoplankton � Zooplankton �Tide � Estuary
P. W. Lehman (&) � C. Enright
Division of Environmental Services, California
Department of Water Resources, 3500 Industrial Blvd,
West Sacramento, CA 95691, USA
e-mail: [email protected]
S. Mayr
Central District, CA Department of Water Resources,
3500 Industrial Blvd, West Sacramento, CA 95691, USA
L. Mecum
CA Department of Fish and Game, 4001 N. Wilson Way,
Stockton, CA 95205, USA
123
Aquat Ecol
DOI 10.1007/s10452-009-9295-y
Page 2
Introduction
The outwelling hypothesis suggests salt marshes and
estuaries are sources of inorganic and organic material
needed for food web production in adjacent marine or
coastal aquatic habitats (Odum and de la Cruz 1967).
This concept also applies to freshwater wetlands where
floodplains and shallow water wetlands are thought to
enhance riverine production through the export of
inorganic and organic material (Junk et al. 1989).
Nutrients are often released within wetlands through
decomposition processes. Silica needed for phyto-
plankton growth in the Schelede River estuary was
released from organic matter decomposition in adja-
cent wetlands (Struyf et al. 2005). Similarly, phos-
phorus needed for wetland vegetation was released by
decomposition of leaf litter in Australian wetlands
(Qui et al. 2002). Dissolved organic carbon and
nitrogen export is also high in freshwater wetlands
where processes such as denitrification occur (Bou-
chard 2007; Arrigoni et al. 2008). In fact, organic
carbon is an important product of wetlands. In the
mangrove wetlands of the Everglades, dissolved
organic carbon can comprise over 80% of the carbon
exported (Romigh et al. 2006) and in the Rhone River
organic matter export was 5–6 times greater than the
amount imported (Chauvelon 1998). Other processes
in wetlands release nutrients stored in sediments such
as the translocation of phosphorus from the sediments
into the water column by plant uptake (Noe and
Childers 2007).
Wetlands can also be a sink for nutrients such as
nitrogen and phosphorus due to sedimentation,
absorption, decomposition and vegetation uptake
(Saunders and Kalff 2001). Only 6% of the nitrogen
and 4% of the phosphorus imported into the drainage
area was exported to Vaccares lagoon on the Rhone
River (Chauvelon 1998). Inorganic salts such as
chloride and sulfate are often stored in wetlands
(Kang et al. 1998). Particulate carbon is stored in
wetlands within the aquatic organisms such as
phytoplankton and zooplankton. Phytoplankton car-
bon storage in freshwater tidal wetlands is usually
due to enhanced primary productivity associated with
a high euphotic zone to mixed depth ratio (Heip et al.
1995) and accumulation of phytoplankton cells due to
high residence time (Hein et al. 1999).
Because of their impact on inorganic and organic
material, wetlands are commonly used to improve
water quality of point and non-point source pollutants
(Mitsch et al. 2000). Plant uptake, sediment absorption
and decomposition processes remove high levels of
nutrients such as nitrogen and phosphorus from
receiving water (Kang et al. 1998). By passing the
water through the Mai Po Marshes, it was possible to
remove 83% of the ammonium nitrogen and 45% of
the soluble phosphorus from sewage waste water
before it entered the Shenzhen River in Hong Kong
(Lau and Chu 2000). In the Everglades, passing the
water through freshwater marshes also decreased the
ionic concentration and removed sodium and chloride
salts (Flora and Rosendahl 1982). Dissolved organic
matter in wetlands also affected the bioavailability of
heavy metals such as copper (Brooks et al. 2007).
Some of the improvement of water quality due to
wetlands is simply due to storage. In the Patuxent
River Estuary, nutrient loss in tidal marshes was
attributed to storage in the sediment, water column and
biota (Boynton et al. 2008). Wetland vegetation
further facilitates nutrient removal by enhancing the
sedimentation (Morse et al. 2004).
Research in salt marsh and estuarine habitats
demonstrated that material flux is highly variable
and varies with climate, geomorphology, hydrology,
biochemistry, wind, tide, material concentration and
biological material cycling (Childers et al. 2000).
Long-term material exchange for 10 wetlands along
the Hudson River varied in both direction and
magnitude and was generally not related to any
specific variable (Arrigoni et al. 2008). In contrast,
intertidal emergent vegetation was a key factor
controlling the variation of material flux in the Cooper
River estuary, NC (McKellar et al. 2007). Tidal range
was also an important factor affecting the variability
of material flux in the Everglades (Romigh et al.
2006). This variability can operate at very small scales
as in San Francisco Estuary (SFE) where chlorophyll
a flux was influenced by the coincident timing of
daylight hours and ebb tide (Lucas et al. 2006).
Modeling studies suggest freshwater tidal wetlands
are sources of inorganic and organic material in SFE
(Jassby and Cloern 2000). Modeling results were
supported by field research in the Yolo Bypass
floodplain where approximately 14–37% of the total,
diatom and green algal carbon and wide diameter cells
were exported to the estuary downstream (Lehman
et al. 2008). Sequential peaks of chlorophyll a
concentration in the Yolo Bypass floodplain and the
Aquat Ecol
123
Page 3
adjacent Sacramento River further supported the
transfer of carbon from the floodplain to the river
(Schemel et al. 2004). Flux measurements at Mildred
Island, a flooded island in the SFE delta region,
confirmed the export of chlorophyll a and sediment
from freshwater tidal wetland habitat to adjacent river
channels during the spring and summer (Lopez et al.
2006). No information is available on the annual flux of
inorganic and organic material from perennial fresh-
water tidal wetlands in SFE. It is hypothesized that
these wetlands could enhance the export of nutrients
and organic matter needed for food web production in
SFE (Brown 2003). The export of organic carbon from
wetlands may be critical for riverine food webs that use
this organic matter to support secondary production
(Deegan et al. 2000; Keckeis et al. 2003).
The purpose of this study is to address the
hypothesis that Liberty Island is a source of inorganic
and organic matter to the lower Sacramento River
and that the flux in the wetland is primarily due to
river flow. This information will provide valuable
insight into the potential contribution of freshwater
perennial tidal wetlands to estuarine fishery produc-
tion and environmental factors that control this
contribution. Such information is needed for fishery
management in SFE where a long-term decline in
production at all trophic levels since the 1970s
coupled with a recent decline in of zooplankton and
threatened and endangered fish species since 2000
has caused concerns about the health of the estuary
(Kimmerer 2004; Sommer et al. 2007).
Methods
Study area
Liberty Island wetland is a 21 km2 freshwater peren-
nial tidal wetland that was created by a levee failure in
1998. A system of levees separates this wetland from
surrounding mixed use farmland, seasonal and peren-
nial wetlands, the Sacramento River on the south, Shag
Slough on the west and the Yolo Bypass toe drain on
the east (Fig. 1). The upper third of the wetland
consists of two shallow ponds (Upper and Lower
Beaver Pond) that contain emergent vegetation and are
hydraulically connected to Main Pond, a large open
water pond which drains into the Sacramento River.
Main Pond remains wet all year and is\1 m at low tide
at the northern end and gradually increases in depth
toward the southern end where it is 20 m deep. The
depth of Main Pond also decreases west to east from
1.5–3 to 0.3–2 m.
The flow of water in Liberty Island is controlled by
exchange with the adjacent river channels at numer-
ous breaks in the levees and a semi-diurnal tide.
Average daily discharge in the Sacramento River was
variable over the study period and ranged from -64
to 257 m3 s-1, but the average net daily discharge
was small at 0.5 m3 s-1.
Field sampling
Inorganic and organic material concentration among
seasons were measured from discrete water samples
Main pond
Upper Beaver pond
Lower Beaver pond
Shag Slough
Sacramento River
Cache Creek
north
south
east
west
38.29
-121.68
N
Continuous monitors
1 km
California
Fig. 1 Aerial photograph of Liberty Island indicating the
location of discrete (dot) and continuous (square) sampling
stations
Aquat Ecol
123
Page 4
collected monthly at four stations located in the north,
south, east and west of Main Pond between February
2004 and June 2005 for a total of 16 sampling days
(Fig. 1). Water samples were collected from just
below the surface using a van Dorn water sampler.
Replicate water samples for measurement of chloro-
phyll a and pheophytin concentration were filtered
through a Millipore APFF glass fiber filter, treated
with 1 ml of saturated magnesium carbonate solution
as a preservative, and the filter was frozen until
spectrophotometric analysis (APHA 1998). A pre-
combusted Millipore APFF glass fiber filter was also
used to filter water for dissolved organic carbon
analysis (APHA 1998). Water for measurement of
dissolved inorganic materials including soluble reac-
tive phosphorus, nitrate, ammonium, silica, chloride
and bromide was filtered through a HA nucleopore
filter, and the filtrate was either frozen or kept at 4�C
until analysis (US EPA 1983; USGS 1985). Unfil-
tered water for total suspended solids, volatile
suspended solids, total organic carbon, total nitrogen
(Kjeldahl) and total phosphorus was kept at 4�C until
analysis (APHA 1998).
Water for phytoplankton identification and enu-
meration was placed in a 50 ml amber glass bottle
and preserved with 1 ml of Lugol’s solution. Phyto-
plankton cells of at least 6 lm in diameter were
identified, sized and enumerated at 7009 using the
inverted microscope technique (Utermohl 1958). The
biomass of these cells was computed from cell
volumes based on cell dimensions applied to simple
geometric shapes (Menden-Deuer and Lessard 2000).
The internal carbon production and respiration in the
lower pond were measured by the dissolved oxygen
light and dark bottle technique from bottles incubated
for 24 h near the surface in Main Pond (Lehman
2007).
Mesozooplankton were collected at each station by
3 min horizontal tows of a 0.5 m diameter plankton
net fitted with 150 lm mesh netting. Animals were
immediately dyed and preserved in 10% buffered
formalin with Rose Bengal Dye. Species identifica-
tion and enumeration were conducted using a
dissecting scope. Mesozooplankton were collected
for a total of six sampling days over the study.
Chlorophyll a fluorescence, specific conductance,
turbidity as NTU, pH, water temperature and dis-
solved oxygen were also measured at 15-min inter-
vals with three Yellow Springs Instrument (YSI)
6600 water quality sondes between June 2004 and
August 2006. The sondes were placed horizontally
across the center of Main Pond at fixed stations
separated by 1.57 and 0.89 km between the western
and central, and eastern and central sondes, respec-
tively (Fig. 1).
Hydrodynamic measurements
Main Pond is virtually a lake with small openings due
to breaks in the surrounding levee. Because there was
no practical way to calculate the flow at each
opening, the total flow from the pond was calculated
from the change in water volume estimated by from
total area and depth. Because the flow computation
only required the relative change in water level, not
absolute values, the average change in depth was
determined from two pressure transducers within YSI
6600 water quality sondes that were located in the
southern portion of the Main Pond. It was assumed
that 90% of the land was flooded during high tide,
and 85% of the land was flooded during low tide. A
three-point moving average was applied to the
calculated flow to reduce the short-term fluctuation.
Hourly flow data was available between June 2004
and June 2005.
Estimates of flow using this method are not
reliable during periods of very high flow when water
levels over top the levees, causing sheet flow across
the wetland that prevents an accurate estimate of
water depth. During these conditions, flow across
Liberty Island was influenced by overland flow from
Yolo Bypass upstream. Such conditions occurred
over an 11-day period between January 3 and 13,
2005.
Analysis
Seasonal flux of inorganic and organic material was
estimated from the sum of monthly flux values
calculated from hourly flow data multiplied times the
single material concentration measured for each
month. Estimates of seasonal flux from continuous
measurements of chlorophyll a, total suspended
solids and salt concentration were calculated from
the sum of the tidally averaged advective and
dispersive flux computed from hourly flow and
material concentration. Advective flow is the average
Aquat Ecol
123
Page 5
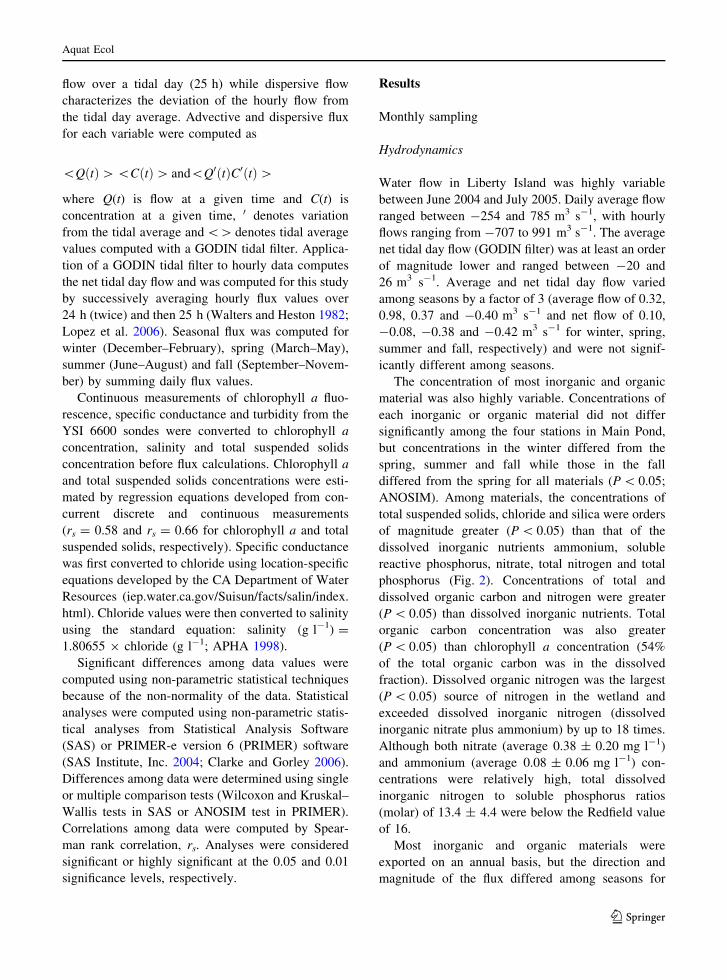
flow over a tidal day (25 h) while dispersive flow
characterizes the deviation of the hourly flow from
the tidal day average. Advective and dispersive flux
for each variable were computed as
\QðtÞ[ \CðtÞ[ and\Q0ðtÞC0ðtÞ[
where Q(t) is flow at a given time and C(t) is
concentration at a given time, 0 denotes variation
from the tidal average and \[ denotes tidal average
values computed with a GODIN tidal filter. Applica-
tion of a GODIN tidal filter to hourly data computes
the net tidal day flow and was computed for this study
by successively averaging hourly flux values over
24 h (twice) and then 25 h (Walters and Heston 1982;
Lopez et al. 2006). Seasonal flux was computed for
winter (December–February), spring (March–May),
summer (June–August) and fall (September–Novem-
ber) by summing daily flux values.
Continuous measurements of chlorophyll a fluo-
rescence, specific conductance and turbidity from the
YSI 6600 sondes were converted to chlorophyll a
concentration, salinity and total suspended solids
concentration before flux calculations. Chlorophyll a
and total suspended solids concentrations were esti-
mated by regression equations developed from con-
current discrete and continuous measurements
(rs = 0.58 and rs = 0.66 for chlorophyll a and total
suspended solids, respectively). Specific conductance
was first converted to chloride using location-specific
equations developed by the CA Department of Water
Resources (iep.water.ca.gov/Suisun/facts/salin/index.
html). Chloride values were then converted to salinity
using the standard equation: salinity (g l-1) =
1.80655 9 chloride (g l-1; APHA 1998).
Significant differences among data values were
computed using non-parametric statistical techniques
because of the non-normality of the data. Statistical
analyses were computed using non-parametric statis-
tical analyses from Statistical Analysis Software
(SAS) or PRIMER-e version 6 (PRIMER) software
(SAS Institute, Inc. 2004; Clarke and Gorley 2006).
Differences among data were determined using single
or multiple comparison tests (Wilcoxon and Kruskal–
Wallis tests in SAS or ANOSIM test in PRIMER).
Correlations among data were computed by Spear-
man rank correlation, rs. Analyses were considered
significant or highly significant at the 0.05 and 0.01
significance levels, respectively.
Results
Monthly sampling
Hydrodynamics
Water flow in Liberty Island was highly variable
between June 2004 and July 2005. Daily average flow
ranged between -254 and 785 m3 s-1, with hourly
flows ranging from -707 to 991 m3 s-1. The average
net tidal day flow (GODIN filter) was at least an order
of magnitude lower and ranged between -20 and
26 m3 s-1. Average and net tidal day flow varied
among seasons by a factor of 3 (average flow of 0.32,
0.98, 0.37 and -0.40 m3 s-1 and net flow of 0.10,
-0.08, -0.38 and -0.42 m3 s-1 for winter, spring,
summer and fall, respectively) and were not signif-
icantly different among seasons.
The concentration of most inorganic and organic
material was also highly variable. Concentrations of
each inorganic or organic material did not differ
significantly among the four stations in Main Pond,
but concentrations in the winter differed from the
spring, summer and fall while those in the fall
differed from the spring for all materials (P \ 0.05;
ANOSIM). Among materials, the concentrations of
total suspended solids, chloride and silica were orders
of magnitude greater (P \ 0.05) than that of the
dissolved inorganic nutrients ammonium, soluble
reactive phosphorus, nitrate, total nitrogen and total
phosphorus (Fig. 2). Concentrations of total and
dissolved organic carbon and nitrogen were greater
(P \ 0.05) than dissolved inorganic nutrients. Total
organic carbon concentration was also greater
(P \ 0.05) than chlorophyll a concentration (54%
of the total organic carbon was in the dissolved
fraction). Dissolved organic nitrogen was the largest
(P \ 0.05) source of nitrogen in the wetland and
exceeded dissolved inorganic nitrogen (dissolved
inorganic nitrate plus ammonium) by up to 18 times.
Although both nitrate (average 0.38 ± 0.20 mg l-1)
and ammonium (average 0.08 ± 0.06 mg l-1) con-
centrations were relatively high, total dissolved
inorganic nitrogen to soluble phosphorus ratios
(molar) of 13.4 ± 4.4 were below the Redfield value
of 16.
Most inorganic and organic materials were
exported on an annual basis, but the direction and
magnitude of the flux differed among seasons for
Aquat Ecol
123
Page 6
each material. Among inorganic materials, total
phosphorus, soluble phosphorus, silica, total nitrogen
and total suspended solids were exported annually
while nitrate, ammonium, chloride and bromide salts
were stored (Table 1). Among seasons, inorganic
material flux during the winter usually differed from
other seasons, but the direction of the flux varied
among materials. More total phosphorus was
exported in the summer and fall than the winter and
contrasted with soluble phosphorus which was
exported in the winter. Both nitrate and ammonium
were exported in the summer and stored in the winter
and fall. This contrasted with total nitrogen which
was exported in the winter. Silica was exported in all
seasons, but more was exported in the summer and
fall. Total suspended solids were exported in the
summer and fall while salts like chloride and bromide
were only exported in the fall.
Organic material was exported on an annual basis
with most of the export in the winter, summer and fall
(Table 1). Among organic materials, chlorophyll a
and pheophytin were exported in the fall and stored in
the spring. Chlorophyll a and pheophytin did not vary
0
0.2
0.4
0.6
0.8
1
variable
mg
l-1
0
20
40
60
80
100
nh4 br SRP no3 DON TKN TP
DOC VSS chla 1 phaeo cl silica TSS TOC
variable
mg
l-1
Fig. 2 Monthly average (horizontal line), median (diamond),
75 and 25% percentiles (box) and range (lines) for the
concentration of organic and inorganic materials measured
for four stations in Main Pond between February 2004 and June
2005; n = 64
Table 1 Average and standard deviation of inorganic and organic material flux (season)-1 for Liberty Island between June 2004 and
July 2005, n = 44
Winter (1) Spring (2) Summer (3) Fall (4) Annual Sign.
Chlorophyll a -1 ± 3 18 ± 3 -0.5 ± 4 -20 ± 7 -3 ± 16 4 & 1,2,3
Pheophytin -3 ± 1 0.4 ± 2 -2 ± 3 -9 ± 2 -1 ± 4 4 & 2,3
Total P -3 ± 181 -69 ± 159 -124 ± 155 -56 ± 73 -251 ± 50 1 & 3,4
Soluble P -56 ± 34 -11 ± 52 -119 ± 88 -61 ± 21 -247 ± 44 1 & 2,3,4
Bromide 69 ± 9 166 ± 13 31 ± 36 -57 ± 7 209 ± 93 1 & 2,3,4; 2 & 4
Nitrate 83 ± 201 -18 ± 132 -120 ± 415 476 ± 122 420 ± 261 3 & 1,2,4; 4 & 1
Ammonium 151 ± 123 20 ± 90 -369 ± 154 223 ± 65 24 ± 264 1 & 2,3,4; 3 & 4
Dissolved organic nitrogen 288 ± 291 65 ± 222 -2,287 ± 259 71 ± 293 -1,863 ± 1,218 1 & 2,3,4; 4 &
2,3
Total Kjeldahl nitrogen -1,778 ± 604 771 ± 298 -711 ± 310 -375 ± 334 -2,094 ± 1,050 1 & 2,3
Dissolved organic
carbon 9 102-74 ± 10 192 ± 19 -29 ± 16 -8 ± 7 -91 ± 39 1 & 2,3,4; 2 & 3
Chloride 9 102 92 ± 65 523 ± 102 66 ± 75 -87 ± 11 595 ± 262 1 & 2,3,4; 2 & 4
Volatile solids 9 102 -133 ± 53 143 ± 108 -200 ± 192 -181 ± 55 -372 ± 160 2 & 3,4
Silica 9 102 -211 ± 34 -4 ± 16 -489 ± 84 -320 ± 10 -1,023 ± 203 1 & 3,4
Total organic carbon 9 102 -223 ± 82 -16 ± 78 -13 ± 33 -24 ± 26 -275 ± 103 1 & 2,3; 2 & 3
Suspended solids 9 102 -482 ± 207 672 ± 482 -1,645 ± 807 -1,838 ± 1,412 -3,294 ± 1,163 2 & 3,4
Positive values indicate material storage while negative values indicate material export. Significant differences between seasons at
the 0.05 level or higher are separated by a & sign
Aquat Ecol
123
Page 7
with total organic carbon which was exported in all
seasons, primarily the winter. Dissolved organic
carbon was also exported in most seasons, except
the spring. Unlike dissolved organic carbon, dis-
solved organic nitrogen was exported in the summer,
but both were stored in the spring.
Inorganic and organic material export during the
winter may be underestimated due to the absence of
reliable flow values between January 3 and 13 when
water flowed overland from Yolo Bypass upstream.
Similar material concentrations in January for Liberty
Island and Yolo Bypass suggest that the material flux
was probably influenced more by advective flow than
material concentration for chlorophyll a, ammonium,
nitrate, soluble P, silica, total suspended solids or
total organic carbon (2.55 ± 0.85 lg l-1, 0.07 ± 0.03
mg l-1, 0.42 ± 0.04 mg l-1, 0.10 ± 0.00 mg l-1,
16.65 ± 0.75 mg l-1, 33.50 ± 7.94 mg l-1and 11 ±
4.26 mg l-1 for Liberty Island, respectively and
2.78 ± 0.26 lg l-1, 0.04 ± 0.01 mg l-1, 0.34 ± 0.01
mg l-1, 0.09 ± 0.00 mg l-1, 15.20 ± 0.00 mg l-1,
36.5 ± 10.61 mg l-1, 6.90 ± 0.00 mg l-1 for Yolo
Bypass, respectively).
The phytoplankton carbon in Main Pond was
primarily composed of diatoms, green algae and
chrysophytes (Fig. 3). The amount of carbon in
theses three phytoplankton groups was similar among
stations except that there were more (P \ 0.05)
diatoms at station 4 than station 3 and more
(P \ 0.05) miscellaneous flagellates at station 3 than
1 or 2. The amount of carbon in these three
phytoplankton groups combined was also greater
(P \ 0.01) than cryptophyte, cyanobacteria, dinofla-
gellate and miscellaneous flagellate carbon. Among
seasons, there was more total phytoplankton carbon
in the spring than the winter, diatoms in the summer
and fall (P \ 0.01), green algae in the summer and
fall (P \ 0.01) and chrysophytes in the summer
(P \ 0.05).
Average flux values suggest total phytoplankton
carbon was exported in winter and spring and stored in
the summer and fall. However, because the monthly
variation was large, the flux was not significantly
different among seasons (mean and standard deviation
of -7,185 ± 55,523, -8,193 ± 22,169, 6,175 ±
31,640 and 10,016 ± 45,026 g carbon (season)-1 for
winter, spring, summer and fall, respectively). Among
phytoplankton groups, diatoms, green algae and
chrysophytes comprised a greater percentage
(P \ 0.01) of the daily total carbon flux than cyano-
bacteria, miscellaneous flagellates, cryptophytes and
dinoflagellates for all seasons (Fig. 4). At optimum
growth rates, in situ phytoplankton growth could
contribute an additional 3,487 kg C day-1 (range
334 kg C day-1 to 13,433 kg C day-1) to the carbon
flux in Main Pond; equivalent to 293 lg l-1 day-1.
Carbon production was associated with an average
maximum growth potential of 50 ± 34 mg C (mg
chlorophyll a)-1 day-1.
Most of the mesozooplankton carbon in Main
Pond was composed of calanoid copepods (Fig. 5).
0
1
2
3
4
5
6
diat
om
gree
n al
gae
chry
soph
yte
cryp
toph
yte
cyan
obac
teria
dino
flage
llate
mis
c
flage
llate
phytoplankton group
log
carb
on u
g l -1
Fig. 3 Monthly average (horizontal line), median (diamond),
75 and 25% percentiles (box) and range (lines) for carbon
among phytoplankton groups from four stations in Main Pond
between February 2004 and June 2005, n = 64
0%
10%
20%
30%
40%
50%
60%
70%
80%
90%
100%
winter spring summer fallseason
perc
enta
ge
diatom green algae chrysophyte
cyanobacteria misc flagellate
Fig. 4 Percentage contribution of phytoplankton groups to the
carbon flux for Main Pond between July 2004 and June 2005,
n = 44
Aquat Ecol
123
Page 8
Calanoid copepod carbon was an order of magnitude
greater (P \ 0.01) than cladocera or cyclopoid cope-
pod carbon and two orders of magnitude greater than
rotifer or harpacticoid carbon. Neither mesozoo-
plankton carbon nor the associated carbon flux was
significantly different among the four stations in
Main Pond. Total mesozooplankton carbon export
was the greatest (P \ 0.05) in the fall (-8 ± 2,
-31 ± 13, 29 ± 11 and -83 ± 34 kg C (season)-1
for winter, spring, summer and fall, respectively). For
most mesozooplankton groups, carbon was exported
in the winter, spring and fall (P \ 0.01; Fig. 6); only
rotifer carbon was exported in the summer. Calanoid
copepod carbon comprised 90% or more of the
mesozooplankton carbon flux except in winter when
cladocera and cyclopoid carbon were high (93%).
Calanoid carbon flux was the greatest (P \ 0.01) in
the fall and differed somewhat from cladocera carbon
flux which was the greatest (P \ 0.01) in the fall and
winter and cyclopoid copepod carbon flux which was
the greatest (P \ 0.01) in the winter. Rotifer and
harpacticoid carbon flux varied little over the seasons
with similarly high (P \ 0.01) rotifer carbon flux in
0
1
2
3
4
5
6
cala
noid
s
clad
ocer
ans
cycl
opoi
ds
rotif
ers
harp
actic
oids
zooplankton
log
carb
on µ
g m
-3
Fig. 5 Monthly average (horizontal line), median (diamond),
75 and 25% percentiles (box) and range (lines) carbon among
mesozooplankton groups measured at four stations in Main
Pond between February 2004 and June 2005, n = 64
-100
-50
0
50
100
winter spring summer fall
calanoid cladoceracyclopoid rotiferharpactacoid
carb
on k
g (s
easo
n)-1
Fig. 6 Monthly average and 75 and 25% percentiles for
zooplankton carbon flux among zooplankton groups for four
stations in Main Pond between July 2004 and June 2005,
n = 24. Positive flux values indicate storage and negative flux
values indicate export
0
5
10
15
20
µg
l -1
5
10
15
20
25
30
degr
ee ° C
water temperature
3
6
9
12
15
mg
l -1
dissolved oxygen
7
8
9pH
-log
(H+)
0
0.1
0.2
0.3
ppt
salinity
0
50
100
150
200
Jul-04 Jan-05 Jul-05 Jan-06 Jul-06
mg
l -1
date
suspended solids
chlorophyll a
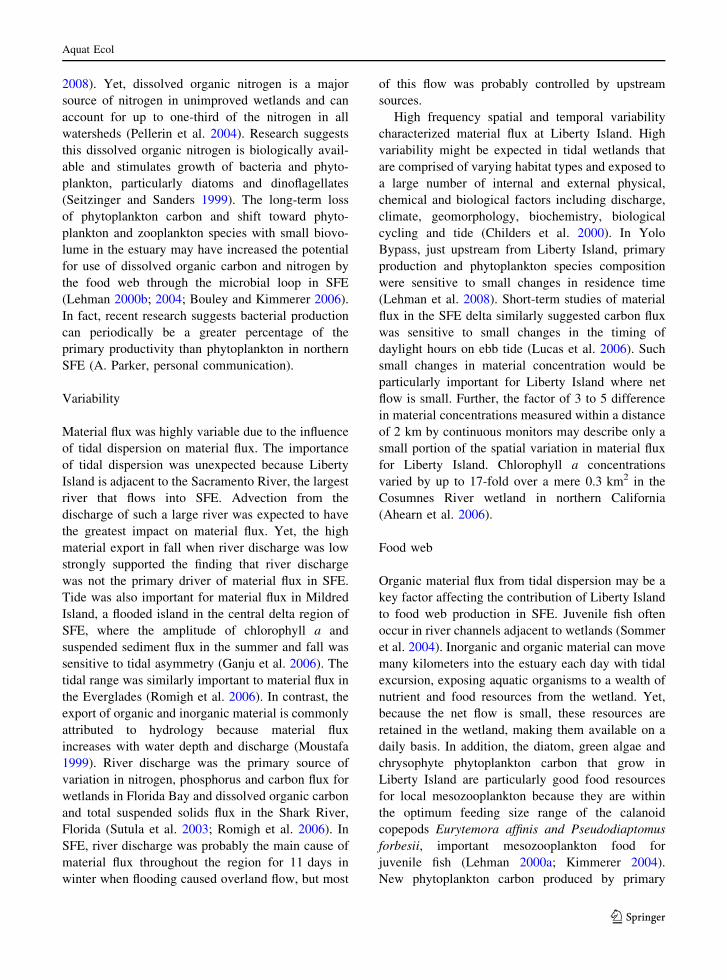
Fig. 7 Daily average chlorophyll a concentration, salinity,
water temperature, pH, dissolved oxygen concentration and
total suspended solids concentration measured at 15-min
intervals for three stations across Main Pond between July
2004 and August 2006, n = 2,337
Aquat Ecol
123
Page 9
the winter, summer and fall. Harpacticoid carbon flux
was similar in all seasons.
Continuous sampling
High variability in the daily average water temper-
ature, salinity, pH and dissolved oxygen, chlorophyll
a and total suspended solids concentration suggested
that both environmental conditions and the concen-
tration of inorganic and organic material changed
rapidly on a daily basis in Main Pond (Fig. 7). Over
the year, water temperature, dissolved oxygen con-
centration, pH, salinity, total suspended solids and
chlorophyll a concentration varied by a factor of
3–33 with coefficients of variation that ranged from 2
to 69.
The daily flux of chlorophyll a, salt and total
suspended solids computed from hourly material
concentration and flow was also highly variable. Over
the year, daily values varied by a factor of 2–3 with
the direction of flux dominated by negative values
(Fig. 8). For 59–68% of the days, chlorophyll a, salt
and total suspended solids flux were negative. Among
seasons, continuous data indicated total suspended
solids were exported in the spring, summer and fall
(P \ 0.01, ANOSIM) while salt was exported in the
spring (P \ 0.01, ANOSIM). The flux of these
materials contrasted with the chlorophyll a concen-
tration which was stored in all seasons, with greater
(P \ 0.01, ANOSIM) storage in the spring and
summer than the fall or winter.
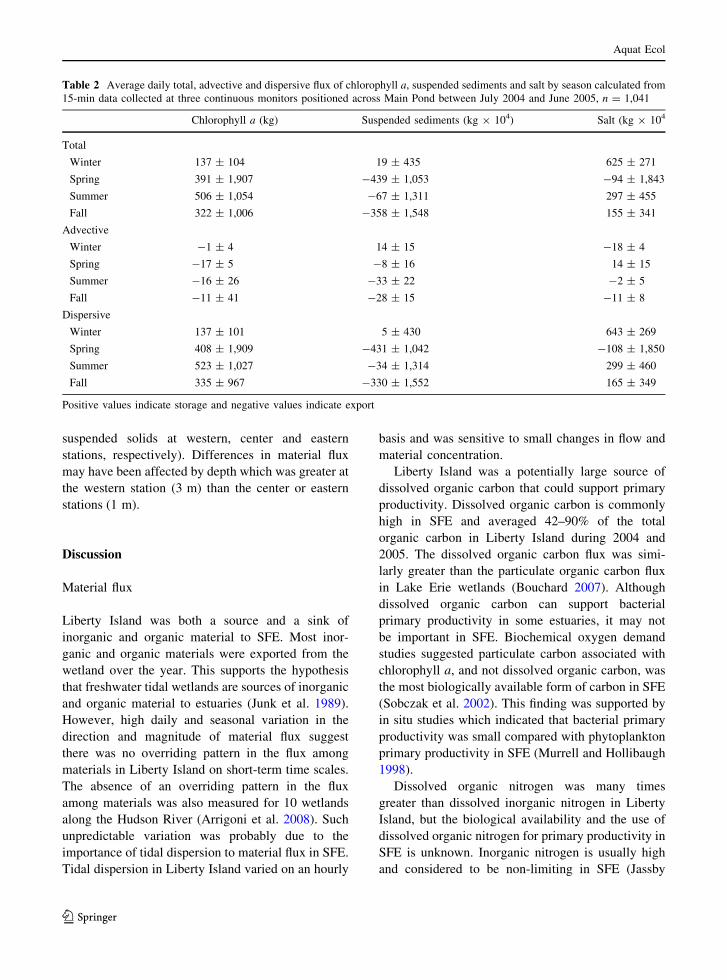
Over 90% of the total material flux of chlorophyll
a, total suspended solids and salt were due to tidal
dispersion (Table 2). Because dispersive flux com-
prised such a large percentage of the total flux, it
varied in the same fashion as total flux over the
seasons. In contrast, the direction and magnitude of
the advective flux often differed from that of either
the total or dispersive flux. Advective flux was
greatest (P \ 0.01, ANOSIM) in the spring or
summer than the fall and winter for chlorophyll a
concentration, the summer for total suspended solids
and the winter and spring for salt.
Differences in the direction and magnitude of
material flux estimates between continuous and
discrete monthly monitoring programs were due to
the strong contribution of dispersive flux to the total
flux. However, the similar direction and magnitude of
material flux computed from a single monthly
concentration and hourly flow compared with mate-
rial flux computed from hourly concentration and
hourly advective flow suggest the estimates of
material flux from monthly values and hourly flow
were good estimates of advective flux.
High frequency data also suggested material flux
varied at small spatial scales. Chlorophyll a, salinity
and total suspended solids flux differed (P \ 0.01;
ANOSIM) among the three continuous stations and
was 3 to 5 times greater at the western than the center or
eastern station (3.1 9 103, 1.2 9 103 and -1.6 9 103
kg year-1 for chlorophyll a; 4.3 9 107, -0.8 9 107
and -0.5 9 107 kg year-1 for salinity and -4.8 9
107, 3.6 9 107 and -1.3 9 107 kg year-1 for total
salt
-400
-200
0
200
400
600
kg d
ay -1
x 1
0 3
suspended solids
-400
-200
0
200
400
600
g da
y -1
flow
-3000
-2000
-1000
0
1000
2000
July-04 Oct-04 Feb-05 May-05
date
m3 s
-1
chlorophyll a
-40
-20
0
20
40
kg d
ay -1
Fig. 8 Daily average total flux of chlorophyll a concentration,
salinity and suspended sediments computed from 15-min
measurements of water quality conditions and flow at three
stations across Main Pond between July 2004 and June 2005,
n = 1,041
Aquat Ecol
123
Page 10
suspended solids at western, center and eastern
stations, respectively). Differences in material flux
may have been affected by depth which was greater at
the western station (3 m) than the center or eastern
stations (1 m).
Discussion
Material flux
Liberty Island was both a source and a sink of
inorganic and organic material to SFE. Most inor-
ganic and organic materials were exported from the
wetland over the year. This supports the hypothesis
that freshwater tidal wetlands are sources of inorganic
and organic material to estuaries (Junk et al. 1989).
However, high daily and seasonal variation in the
direction and magnitude of material flux suggest
there was no overriding pattern in the flux among
materials in Liberty Island on short-term time scales.
The absence of an overriding pattern in the flux
among materials was also measured for 10 wetlands
along the Hudson River (Arrigoni et al. 2008). Such
unpredictable variation was probably due to the
importance of tidal dispersion to material flux in SFE.
Tidal dispersion in Liberty Island varied on an hourly
basis and was sensitive to small changes in flow and
material concentration.
Liberty Island was a potentially large source of
dissolved organic carbon that could support primary
productivity. Dissolved organic carbon is commonly
high in SFE and averaged 42–90% of the total
organic carbon in Liberty Island during 2004 and
2005. The dissolved organic carbon flux was simi-
larly greater than the particulate organic carbon flux
in Lake Erie wetlands (Bouchard 2007). Although
dissolved organic carbon can support bacterial
primary productivity in some estuaries, it may not
be important in SFE. Biochemical oxygen demand
studies suggested particulate carbon associated with
chlorophyll a, and not dissolved organic carbon, was
the most biologically available form of carbon in SFE
(Sobczak et al. 2002). This finding was supported by
in situ studies which indicated that bacterial primary
productivity was small compared with phytoplankton
primary productivity in SFE (Murrell and Hollibaugh
1998).
Dissolved organic nitrogen was many times
greater than dissolved inorganic nitrogen in Liberty
Island, but the biological availability and the use of
dissolved organic nitrogen for primary productivity in
SFE is unknown. Inorganic nitrogen is usually high
and considered to be non-limiting in SFE (Jassby
Table 2 Average daily total, advective and dispersive flux of chlorophyll a, suspended sediments and salt by season calculated from
15-min data collected at three continuous monitors positioned across Main Pond between July 2004 and June 2005, n = 1,041
Chlorophyll a (kg) Suspended sediments (kg 9 104) Salt (kg 9 104
Total
Winter 137 ± 104 19 ± 435 625 ± 271
Spring 391 ± 1,907 -439 ± 1,053 -94 ± 1,843
Summer 506 ± 1,054 -67 ± 1,311 297 ± 455
Fall 322 ± 1,006 -358 ± 1,548 155 ± 341
Advective
Winter -1 ± 4 14 ± 15 -18 ± 4
Spring -17 ± 5 -8 ± 16 14 ± 15
Summer -16 ± 26 -33 ± 22 -2 ± 5
Fall -11 ± 41 -28 ± 15 -11 ± 8
Dispersive
Winter 137 ± 101 5 ± 430 643 ± 269
Spring 408 ± 1,909 -431 ± 1,042 -108 ± 1,850
Summer 523 ± 1,027 -34 ± 1,314 299 ± 460
Fall 335 ± 967 -330 ± 1,552 165 ± 349
Positive values indicate storage and negative values indicate export
Aquat Ecol
123
Page 11
2008). Yet, dissolved organic nitrogen is a major
source of nitrogen in unimproved wetlands and can
account for up to one-third of the nitrogen in all
watersheds (Pellerin et al. 2004). Research suggests
this dissolved organic nitrogen is biologically avail-
able and stimulates growth of bacteria and phyto-
plankton, particularly diatoms and dinoflagellates
(Seitzinger and Sanders 1999). The long-term loss
of phytoplankton carbon and shift toward phyto-
plankton and zooplankton species with small biovo-
lume in the estuary may have increased the potential
for use of dissolved organic carbon and nitrogen by
the food web through the microbial loop in SFE
(Lehman 2000b; 2004; Bouley and Kimmerer 2006).
In fact, recent research suggests bacterial production
can periodically be a greater percentage of the
primary productivity than phytoplankton in northern
SFE (A. Parker, personal communication).
Variability
Material flux was highly variable due to the influence
of tidal dispersion on material flux. The importance
of tidal dispersion was unexpected because Liberty
Island is adjacent to the Sacramento River, the largest
river that flows into SFE. Advection from the
discharge of such a large river was expected to have
the greatest impact on material flux. Yet, the high
material export in fall when river discharge was low
strongly supported the finding that river discharge
was not the primary driver of material flux in SFE.
Tide was also important for material flux in Mildred
Island, a flooded island in the central delta region of
SFE, where the amplitude of chlorophyll a and
suspended sediment flux in the summer and fall was
sensitive to tidal asymmetry (Ganju et al. 2006). The
tidal range was similarly important to material flux in
the Everglades (Romigh et al. 2006). In contrast, the
export of organic and inorganic material is commonly
attributed to hydrology because material flux
increases with water depth and discharge (Moustafa
1999). River discharge was the primary source of
variation in nitrogen, phosphorus and carbon flux for
wetlands in Florida Bay and dissolved organic carbon
and total suspended solids flux in the Shark River,
Florida (Sutula et al. 2003; Romigh et al. 2006). In
SFE, river discharge was probably the main cause of
material flux throughout the region for 11 days in
winter when flooding caused overland flow, but most
of this flow was probably controlled by upstream
sources.
High frequency spatial and temporal variability
characterized material flux at Liberty Island. High
variability might be expected in tidal wetlands that
are comprised of varying habitat types and exposed to
a large number of internal and external physical,
chemical and biological factors including discharge,
climate, geomorphology, biochemistry, biological
cycling and tide (Childers et al. 2000). In Yolo
Bypass, just upstream from Liberty Island, primary
production and phytoplankton species composition
were sensitive to small changes in residence time
(Lehman et al. 2008). Short-term studies of material
flux in the SFE delta similarly suggested carbon flux
was sensitive to small changes in the timing of
daylight hours on ebb tide (Lucas et al. 2006). Such
small changes in material concentration would be
particularly important for Liberty Island where net
flow is small. Further, the factor of 3 to 5 difference
in material concentrations measured within a distance
of 2 km by continuous monitors may describe only a
small portion of the spatial variation in material flux
for Liberty Island. Chlorophyll a concentrations
varied by up to 17-fold over a mere 0.3 km2 in the
Cosumnes River wetland in northern California
(Ahearn et al. 2006).
Food web
Organic material flux from tidal dispersion may be a
key factor affecting the contribution of Liberty Island
to food web production in SFE. Juvenile fish often
occur in river channels adjacent to wetlands (Sommer
et al. 2004). Inorganic and organic material can move
many kilometers into the estuary each day with tidal
excursion, exposing aquatic organisms to a wealth of
nutrient and food resources from the wetland. Yet,
because the net flow is small, these resources are
retained in the wetland, making them available on a
daily basis. In addition, the diatom, green algae and
chrysophyte phytoplankton carbon that grow in
Liberty Island are particularly good food resources
for local mesozooplankton because they are within
the optimum feeding size range of the calanoid
copepods Eurytemora affinis and Pseudodiaptomus
forbesii, important mesozooplankton food for
juvenile fish (Lehman 2000a; Kimmerer 2004).
New phytoplankton carbon produced by primary
Aquat Ecol
123
Page 12
productivity in the wetland during spring could
further enhance the phytoplankton food available
for mesozooplankton growth. Similarly, high net
phytoplankton growth rate and abundant diatom and
green algae carbon in the spring characterized the
Yolo Bypass floodplain immediately upstream of
Liberty Island where the abundance of juvenile native
fish in the spring is attributed to the presence of
abundant phytoplankton and zooplankton food
resources (Sommer et al. 2004; Lehman et al. 2008).
Management implications
Understanding the storage, export and tidal disper-
sion of inorganic and organic materials at Liberty
Island may be important for development of habitat
needed to enhance the fishery production in SFE. The
export of total suspended solids and salt from Liberty
Island in the winter and spring may provide salts and
sediment needed for optimum fish habitat. Juvenile
fish occur in freshwater tidal wetlands in late winter
and early spring before they move downstream into
the estuary (Sommer et al. 2004). Some fish, includ-
ing the endangered delta smelt, occur in the lower
Sacramento River near Liberty Island where salinity
and turbidity are thought to be more favorable for
growth and survival (Nobriga et al. 2008).
Management of the retention and export of organic
carbon sources that includes consideration of both
tide and river discharge may increase the food
resources available in the wetland to support the
aquatic food web. Wetland management needs to
achieve a balance between the daily dispersion of
material from the wetland into the estuary with the
tide, sufficient residence time to allow accumulation
and growth of organisms at the base of the food web
and material recycling and flow needed to export
inorganic and organic material into the estuary at
critical times for the fishery.
High intra-annual variability suggests that a full
understanding of this material flux requires measure-
ment over long interannual time scales. The material
flux in Liberty Island during 2004 and 2005 represents
a small fraction of the potential variability in material
flux of the wetland over time. The Sacramento River
discharge alone varies by at least a factor of 5 over
two decades due to climatic change in California
which is characterized by periods of wet and dry
conditions. These conditions affect physical, chemical
and biological factors in the estuary and are expected
to become more extreme with climate change (Leh-
man 2000b; California Department of Water
Resources 2006). Organic material flux, including
phytoplankton, zooplankton and benthic species may
also vary over time due to climate change and the
exotic species invasions which characterize SFE
(Lopez et al. 2006; Cohen and Carlton 1995).
Acknowledgments This study was funded by a California
Bay-Delta Authority (CALFED) Restoration grant #2000-F06.
Significant assistance with sampling and analysis was
contributed by the California Department of Water Resources
Division of Environmental Services and Central District staff
particularly M. Dempsey, L. Brenn, E. Santos, R. Breuer and
K. Marr.
References
Ahearn DS, Viers JH, Mount JF, Dahlgren RA (2006) Priming
the productivity pump: flood pulse driven trends in sus-
pended algal biomass distribution across a restored
floodplain. Freshw Biol 51:1417–1433
American Public Health Association, American Water Works
Association and Water Environment Association (APHA)
(1998) Standard methods for the examination of water and
wastewater, 20th edn. American Public Health Associa-
tion, Washington DC
Arrigoni A, Findlay S, Fischer D, Tockner K (2008) Predicting
carbon and nutrient transformations in tidal freshwater
wetlands of the Hudson River. Ecosystems 11:790–802
Bouchard V (2007) Export of organic matter from a coastal
freshwater wetland to Lake Erie: an extension of the
outwelling hypothesis. Aquat Ecol 41:1–7
Bouley P, Kimmerer WJ (2006) Ecology of a highly abundant,
introduced cyclopoid copepod in a temperate estuary. Mar
Ecol Prog Ser 324:219–228
Boynton WR, Hagy JD, Cornwell JC, Kemp WM, Greene SM,
Owens MS, Baker JE, Larsen RK (2008) Nutrient budgets
and management actions in the Patuxent River Estuary,
Maryland. Estuar Coasts 31:623–651
Brooks ML, Meyer JS, McKnight DM (2007) Photooxidation
of wetland and riverine dissolved organic matter: altered
copper complexation and organic composition. Hydrobi-
ologia 579:95–113
Brown LR (2003) Will tidal wetland restoration enhance
populations of native fishes? San Franc Estuary Water-
shed Sci 1(1). (article 2)
California Department of Water Resources (2006) Progress on
incorporating climate change into planning and manage-
ment of california water resources. California Department
of Water Resources, Sacramento, CA, 94236
Chauvelon P (1998) Wetland managed for agriculture as an
interface between the Rhone River and the Vaccares
Lagoon (Camargue, France): transfers of water and
nutrients. Hydrobiologia 373–374:181–191
Aquat Ecol
123
Page 13
Childers DL, Day JW Jr, McKellar HN Jr (2000) Twenty more
years of marsh and estuarine flux studies: revisiting Nixon
(1980). In: Weinstein MP, Kreeger DA (eds) Concepts
and controversies in tidal marsh ecology. Kluwer,
Dordrecht, pp 391–424
Clarke KR, Gorley RN (2006) PRIMER v6: user manual/
tutorial. PRIMER-E, Plymouth
Cohen AN, Carlton JT (1995) Indigenous aquatic species in a
United States estuary: study of the biological invasions of
the San Francisco Bay and Delta. United States Fish and
Wildlife Service, Washington D.C. and the National Sea
Grant College Program, Connecticut Sea Grant
Deegan CA, Hughes JE, Roundtree RA (2000) Salt marsh
ecosystem support of marine transient species. In: Wein-
stein MP, Kreeger DA (eds) Concepts and controversies in
tidal marsh ecology. Kluwer, Dordrecht, pp 333–365
Flora MD, Rosendahl PC (1982) Historical changes in the
conductivity and ionic characteristics of the source water
for the Shark River Slough, Everglades National Park,
Florida, USA. Hydrobiol 97:249–254
Ganju NK, Schoellhamer DH, Bergamaschi BA (2006) Sus-
pended sediment fluxes in a tidal wetland: measurement,
controlling factors and error analysis. Estuaries 28:
812–822
Hein T, Heiler G, Pennetzdorfer D, Riedler P, Schagerl M,
Schiemer F (1999) The Danube Restoration Project:
functional aspects and planktonic productivity in the
floodplain system. Regul Rivers Res Manag 15:259–270
Heip CHR, Goosen NK, Herman PMJ, Kromkamp J, Middel-
burg JJ, Soetaert K (1995) Production and consumption of
biological particles in temperate tidal estuaries. Oceanogr
Mar Biol Annu Rev 33:1–149
Jassby AD (2008) Phytoplankton in the Upper San Francisco
Estuary: recent biomass trends, their causes and their
trophic significance. San Franc Estuary Watershed Sci
6(1). (article 2)
Jassby AD, Cloern JE (2000) Organic matter sources and
rehabilitation of the Sacramento-San Joaquin Delta (Cal-
ifornia, USA). Aquat Conserv Mar Freshw Ecosyst
10:323–352
Junk WJ, Bayley PB, Sparks RE (1989) The flood-pulse con-
cept in river-floodplain systems. In: Dodge DP (ed) Pro-
ceedings of the international large river symposium. Can
Spec Pub Fish Aquat Sci 106:110–127
Kang H, Freeman C, Lee D, Mitsch WJ (1998) Enzyme
activities in constructed wetlands: implication for water
quality amelioration. Hydrobiol 368:231–235
Keckeis S, Baranyi C, Hein T, Holarek C, Riedler P, Schiemer
F (2003) The significance of zooplankton grazing in a
floodplain system of the River Danube. J Plankton Res
25:243–253
Kimmerer WJ (2004) Open water processes of San Francisco
Estuary: From physical forcing to biological responses.
San Franc Estuary Watershed Sci 2 (1). (article 1)
Lau SSS, Chu LM (2000) Nutrient and faecal contamination
and retention in wetland enclosures (gei wais) in the Mai
Po Marshes, Hong Kong. Hydrobiologia 431:81–92
Lehman PW (2000a) Phytoplankton biomass, cell diameter and
species composition in the low salinity zone of northern
San Francisco Bay Estuary. Estuaries 23:216–230
Lehman PW (2000b) The influence of climate on phyto-
plankton community biomass in San Francisco Bay
estuary. Limnol Oceanogr 45:580–590
Lehman PW (2004) The influence of climate on mechanistic
pathways that affect lower food web production in
northern San Francisco Bay estuary. Estuaries 27:312–325
Lehman PW (2007) The influence of phytoplankton commu-
nity composition on primary productivity along the riv-
erine to freshwater tidal continuum in the San Joaquin
River, California. Estuar Coasts 30:82–93
Lehman PW, Sommer T, Rivard L (2008) Phytoplankton pri-
mary productivity, respiration, chlorophyll a and species
composition in the Yolo Bypass floodplain, California.
Aquat Ecol 42:363–378
Lopez CB, Cloern JE, Schraga TS, Little AJ, Lucas LV,
Thompson JK, Burau JR (2006) Ecological values of
shallow-water habitats: implications for the restoration of
disturbed ecosystems. Ecosystems 9:422–440
Lucas LV, Sereno DM, Burau JR, Schraga TS, Lopez CB,
Stacey MT, Parchevsky KV, Parchevsky VP (2006) In-
tradaily variability of water quality in a shallow tidal
lagoon: mechanisms and implications. Estuar Coasts
29:711–730
McKellar HN, Tufford DL, Alford MC, Saroprayogi P, Kelley
BJ, Morris JT (2007) Tidal nitrogen exchanges across a
freshwater wetland succession gradient in the upper
Cooper River, South Carolina. Estuar Coasts 30:989–1006
Menden-Deuer S, Lessard EJ (2000) Carbon to volume rela-
tionships for dinoflagellates, diatoms and other protest
plankton. Limnol Oceanogr 45:569–579
Mitsch WJ, Horne AJ, Nairn RW (2000) Nitrogen and phos-
phorus retention in wetlands—ecological approaches to
solving excess nutrient problems. Ecol Eng 14:1–7
Morse JL, Megonigal JP, Walbridge MR (2004) Sediment
nutrient accumulation and nutrient availability in two tidal
freshwater marshes along the Mattaponi river, Virginia,
USA. Biogeochemistry 69:175–206
Moustafa MZ (1999) Nutrient retention dynamics of the Ever-
glades Nutrient Removal Project. Wetlands 19:689–704
Murrell M, Hollibaugh T (1998) Microzooplankton grazing in
San Francisco Bay measured by the dilution method.
Aquat Microb Ecol 15:53–63
Nobriga ML, Sommer TR, Feyrer F, Fleming K (2008) Long-
term trends in summertime habitat suitability for delta
smelt (Hypomesus transpacificus). San Franc Estuary
Watershed Sci 6(1). (article 1)
Noe GB, Childers DL (2007) Phosphorus budgets in Ever-
glades wetland ecosystems: the effects of hydrology and
nutrient enrichment. Wetl Ecol Manag 15:189–205
Odum EP, de la Cruz AA (1967) Particulate organic dtritus in a
Georgia salt marsh-estuarine ecosystem. In: Lauff GH
(ed) Estuaries. Publ Am Assoc Adv Sci 83: 333–388
Pellerin BA, Wollheim WM, Hopkinson CS, McDowell WH,
Williams MR, Vo’’ro’’smarty CJ, Daley ML (2004) Role
of wetlands and developed land use on dissolved organic
nitrogen concentrations and DON/TDN in northeastern
US rivers and streams. Limnol Oceanogr 49:910–918
Qui S, McCombe AJ, Bell RW (2002) Phosphorus-leaching
from litterfall in wetland catchments of the Swan Coastal
Plain, southwestern Australia. Hydrobiologia 472:95–105
Aquat Ecol
123
Page 14
Romigh MM, Davis SE, Rivera-Monroy VH, Twilley RR
(2006) Flux of organic carbon in a riverine mangrove
wetland in the Florida Coastal Everglades. Hydrobiologia
569:505–516
SAS Institute, Inc (2004) SAS/STAT user’s guide, version 8.
SAS Institute Inc., SAS Campus Drive, Cary, North
Carolina, USA
Saunders DL, Kalff J (2001) Nitrogen retention in wetlands,
lakes and rivers. Hydrobiologia 443:205–212
Schemel LE, Sommer TR, Muller-Solger AB, Harrell WC
(2004) Hydrologic variability, water chemistry, and phy-
toplankton biomass in a large floodplain of the Sacra-
mento River, CA, USA. Hydrobiologia 513:129–139
Seitzinger SP, Sanders RW (1999) Atmospheric inputs of
dissolved organic nitrogen stimulate estuarine bacteria
and phytoplankton. Limnol Oceanogr 44:721–730
Sobczak WV, Cloern JE, Jassby AD, Muller-Solger AB (2002)
Bioavailability of organic matter in a highly disturbed
estuary: the role of detrital and algal resources. Proc Natl
Acad Sci USA 99:8101–8105
Sommer TR, Harrell WC, Kurth R, Feyrer F, Zeug SC,
O’Leary G (2004) Ecological patterns of early life stages
of fishes in a large river-floodplain of the San Francisco
estuary. Am Fish Soc Symp 39:111–123
Sommer TR, Armor C, Baxter R, Breuer R, Brown L, Chot-
kowski M, Culberson S, Feyrer F, Gingras M, Herbold B,
Kimmerer W, Mueller-Solger A, Nobriga M, Souza K
(2007) The collapse of pelagic fishes in the upper San
Francisco estuary. Fisheries 32:270–277
Struyf E, Van Damme S, Gribsholt B, Meire P (2005) Fresh-
water marshes as dissolved silica recyclers in an estuarine
environment (Schelede estuary, Belgium). Hydrobiologia
540:69–77
Sutula MA, Perez BC, Reyes E, Childers DL, Davis S, Day JW
Jr, Rudnick D, Sklar F (2003) Factors affecting spatial and
temporal variability in material exchange between the
Southern Everglades wetlands and Florida Bay (USA).
Estuar Coast Shelf Sci 57:757–781
United States Environmental Protection Agency (US EPA)
(1983) Methods for chemical analysis of water and
wastes. Technical report EPA-600/4-79-020. United
States Environmental Protection Agency, Washington,
DC
United States Geological Survey (USGS) (1985) Methods for
determination of inorganic substances in water and fluvial
sediments. Open file report 85-495
Utermohl H (1958) Zur Vervollkommung der quantitativen
Phytoplankton-methodik. Mitteilungen Internationale
Vereinigung for Theoretische und Angewandte Limnolo-
gie 9:1–38
Walters RA, Heston C (1982) Removing tidal-period variations
from time-series data using low-pass digital filters. J Phys
Oceanogr 12:112–115
Aquat Ecol
123