23
THE GASB 34 REPORTING GUIDELINES FOR GOVERNMENT FINANCIAL STATEMENTS A Civic Federation Issue Brief Prepared By The Civic Federation August 2004

THE GASB 34 REPORTING GUIDELINES FOR GOVERNMENT
FINANCIAL STATEMENTS
A Civic Federation Issue Brief
Prepared By The Civic Federation
August 2004

2
OVERVIEW ................................................................................................................................ 3 THE SIGNIFICANCE OF THE NEW REPORTING GUIDELINES........................................ 3 Current Fund-Based Financial Statements: Useful but Incomplete............................................. 4 The Change: More Comprehensive Financial Statements........................................................... 4 HIGHLIGHTS OF THE REPORTING MODEL........................................................................ 5 Management's Discussion and Analysis ...................................................................................... 6 Basic Financial Statements .......................................................................................................... 6
Government-Wide Financial Statements ................................................................................ 6 Key Features of the Government-Wide Statements................................................................ 7 The Statement of Net Assets................................................................................................... 7 The Statement of Activities .................................................................................................. 10 Infrastructure Asset Reporting.............................................................................................. 12 Fund-Based Financial Statements: Reporting by Major Fund.............................................. 14 Enhanced Budget to Actual Comparisons ............................................................................ 15
GLOSSARY OF SELECTED TERMS..................................................................................... 16 APPENDIX 1: STATE OF ILLINOIS ...................................................................................... 17
State of Illinois FY2003 Statement of Net Assets ................................................................ 17 State of Illinois FY2003 Statement of Activities.................................................................. 19
APPENDIX 2: COOK COUNTY.............................................................................................. 21
Cook County FY2002 Statement of Net Assets ................................................................... 21 Cook County FY2002 Statement of Activities ..................................................................... 22

3
OVERVIEW The Governmental Accounting Standards Board (GASB) issued new guidelines in 1999 that fundamentally change the way state and local governments report their finances. For the first time, governments’ audited financial statements contain information about the full cost of providing public services, including infrastructure. The Civic Federation supported the adoption of these guidelines in GASB’s Statement Number 34 and provided commentary on them through representation on the Governmental Accounting Standards Advisory Committee in 1999.1 This Issue Brief describes how the new financial statements differ from traditional fund-based statements, explains some of the features of the new statements and provides illustrations from the City of Chicago, Cook County and the State of Illinois. The new reporting guidelines become effective in three phases:
• Governments with total annual revenues of $100 million or more in the first fiscal year ending after June 15, 1999, will prepare the new financial statements no later than June 15, 2002;
• Governments with total annual revenues of between $10 million and $100 million will begin no later June 15,2003;
• Governments with total annual revenues below $10 million will begin no later than June 15, 2004.
Some of the Illinois governments that have complied with the requirements of GASB 34 to date include the State of Illinois, the City of Chicago, Cook County, the Chicago Public Schools, the Chicago Park District and the Metropolitan Water Reclamation District. The Governmental Accounting Standards Board (GASB) is the private, nonprofit body responsible for establishing accounting and financial reporting standards for the more than 84,000 state and local governments in the United States (not including the federal government). State and local governments are required to follow GASB standards in order to obtain unqualified audit opinions from their auditors. THE SIGNIFICANCE OF THE NEW REPORTING GUIDELINES Why should anyone care about governmental financial reporting? Because policymakers and citizens have a right to know the full cost of all services provided by state and local governments, whether costs are being shifted from current to future generations, whether government's financial condition has improved or deteriorated, and how much is being spent on infrastructure costs. In short, policymakers and citizens are entitled to a comprehensive accounting of public funds that will help them make informed decisions about government expenditures and appropriate levels of taxation. That information is not readily available in traditional fund-based financial statements, because they are too disaggregated to provide an
1 Roland Calia, Civic Federation Research Director, served on the Governmental Accounting Standards Advisory Committee representing the Governmental Research Association.

4
overall picture of the government's finances. Traditional statements have a narrow short-term focus and are incomplete because they lack information about capital assets. These problems are addressed with the implementation of GASB's new reporting guidelines. Current Fund-Based Financial Statements: Useful but Incomplete Governmental financial statements currently are organized by funds. Fund-based reporting ensures comparability of information over time, offers a level of detail important to many users, and helps hold governments accountable for using resources in accord with legal and budgetary requirements. For these reasons, governments are still required to prepare fund-based statements under the new reporting guidelines. However, fund-based financial statements are unsuitable for assessing the government as a whole. A government may have anywhere from 2 to 200 or more funds. Thus, even the most experienced users can have difficulty trying to synthesize the information or comprehend how a government's over-all financial position has changed from the previous year.
Understanding the "big picture" in fund-based financial statements is also difficult because fund accounting for general governmental activities, such as police protection, focuses on short-term resources such as cash and investments and short-term liabilities rather than long-term resources and liabilities.
To track these services, governments employ modified accrual accounting, which reports only the revenues received and the cost paid for services provided in the current year or soon thereafter. However, governments use full accrual accounting (the method utilized in the private sector) for business-type activities (such as airports) that charge a fee for services. They also use full accrual accounting to report fiduciary activities (such as a pension fund) in which governments act as agents for outside parties. While the modified accrual accounting method permits government officials to demonstrate how well they are managing public funds in the short-term, it does not allow users to understand a government's total financial condition in the long-term. Traditional government financial statements do not provide any information about the costs of constructing and maintaining infrastructure assets, such as bridges, roads, buildings, and sewers. This is true despite the fact that state and local governments invest as much as $150 billion annually in the construction, improvement and rehabilitation of capital assets, including infrastructure assets. This figure represents more than 10% of every dollar spent by those governments. Private sector firms and nonprofit organizations, in contrast, include capital assets and the cost of using them over time in their financial statements. The Change: More Comprehensive Financial Statements The new reporting rules address many of the shortcomings of traditional financial reporting. They require annual financial statements to be more accessible and contain comprehensive information that can be used to assess a government's long-term, total financial condition. Under the new rules, governments continue to provide information for major funds. However, they now also provide government-wide statements that are prepared using full accrual accounting.

5
The government-wide statements look at government from an economic perspective, which views government as a single economic unit, not just a collection of separate funds. They use a single basis of accounting - full accrual - so that all revenues and all expenses in a fiscal year are reported. That includes all measurable assets and liabilities, both short-term and long-term, financial and capital, whether they support governmental activities or fee-for-service activities. For the first time, financial statements report information about all capital assets, including infrastructure assets like roads and bridges. The government-wide statements give users the information they need to answer the following questions:
• What is the full cost of the services provided by government? • Does the government have sufficient resources to meet future obligations? • Does the government have a surplus or deficit? • Is the government’s overall debt increasing, placing a burden on future taxpayers? • How much does the government spend to maintain roads and bridges? • Are a government’s recreational facilities self-supporting or do they require funding from
general taxes? • Is a government paying for police patrols with money collected from utility customers?
In sum, the new reporting guidelines provide better information to help policymakers and the public better determine their taxing and spending priorities. HIGHLIGHTS OF THE REPORTING MODEL The following sections describe some of the most significant changes in the new financial reporting rules. Under the new reporting guidelines, governments preparing their financial statements in accordance with Generally Accepted Accounting Principles (GAAP) must present: • Basic Financial Statements, which include Government-Wide Financial Statements, Fund
Financial Statements and Notes to the Financial Statements. • Required Supplementary Information (RSI), which consists of the Management's
Discussion and Analysis preceding the Basic Financial Statements and additional information following the Notes. RSI also includes comparative information from a government’s originally adopted budget, final modified budget and actual results.2
2 Dean Michael Mead. An Analyst’s Guide to Government Financial Statements. (Norwalk: Governmental Accounting Standards Board, 2001), pp. 1-2.

6
Management's Discussion and Analysis The Management's Discussion and Analysis (MD&A) is intended to be a “plain English” presentation of a government's overall financial condition. It introduces the basic financial statements. The purpose of the MD&A is to help users readily determine whether a government's finances have improved or deteriorated since the previous year. It discusses the reasons for significant changes from the previous year, rather than just listing the amounts or percentages of change. Some of the important information included in the MD&A is listed below: • An introduction to the financial statements and how they relate to each other. • A comparison of current year finances to the prior year based on government-wide financial
information about assets, liabilities, revenues and expenditures. • An explanation of any significant variations between original and final budget amounts. • A description of capital asset and long- term debt activity during the year, including a
discussion of commitments made for capital expenditures. • A discussion of any known facts, decisions or conditions that can be expected to have an
impact on the government’s future financial position, such as changes in tax or employment bases.
Basic Financial Statements The basic financial statements consist of government-wide financial statements and fund-based financial statements as well as the notes to the financial statements. The following section describes key features of the new government-wide financial statements and an important change in the way the fund-based statements classify and report major and nonmajor funds. Government-Wide Financial Statements The government-wide financial statements provide a comprehensive overview of a state or local government's finances in one place for the first time. They include information about the full cost of providing services to citizens each year. This is possible because the statements are prepared using the full accrual basis of accounting, the same approach used by the private sector, and because all of the government's activities are reported together rather than spread among a variety of different funds. Full accrual accounting recognizes revenues and expenses when they occur. All government activities are reported, including not just current assets and liabilities, but also infrastructure assets and long-term liabilities. The information generated in financial statements using full accrual accounting helps users more readily assess: • Whether a government's financial position has improved or deteriorated as a result of the
year's operations,

7
• Whether the cost of services currently delivered is being paid today, or shifted to future years or generations,
• The extent to which programs or activities were supported by taxes or user fees, and • How much a government has invested in infrastructure assets such as roads and bridges. The new statements also help users by identifying "special and extraordinary" events that make a government's financial position look better than it really is, such as one-shot revenue infusions, transfers, shifts of payments or receipts from one fiscal year to the next, and borrowing to fund operations. Key Features of the Government-Wide Statements The government-wide financial statements distinguish between the governmental and business-type activities of the primary government. They do not include fiduciary activities, in which the government acts as a trustee for outside parties, such as employee retirement systems, because the resources belonging to those activities are not available to be used by the government to provide services. Governmental system activities include most of the services usually associated with government, such as public works, sanitation, or police protection. Business-type activities are those operations for which fees are charged, including water and sewer systems. Together, governmental and business-type activities make up the "primary government." The financial statements also distinguish between the activities of the primary government and its component units by reporting each in separate columns. Component units are legally separate entities for which the elected leaders of the primary government are financially responsible, e.g., a forest preserve district or a landfill. The government-wide statements consist of a statement of net assets and a statement of activities. Each is briefly described and illustrated below. The Statement of Net Assets The Statement of Net Assets permits users to quickly determine whether a government's financial situation has improved or declined by focusing attention on the net assets remaining at year-end. Net assets are the difference between a government's assets (what it owns) and its liabilities (what it owes). This statement is similar to the Balance Sheet or Statement of Financial Position that private sector organizations produce. Therefore, the Statement contains three sections: Assets, Liabilities and Net Assets. Comparing assets with liabilities informs judgments about the government's capacity to pay its debts when they come due. In the Statement of Net Assets, assets are reported in order of liquidity, or how quickly an asset can be converted to cash. Current assets, which will be used or converted to cash within a one-year period, are listed first. In addition to cash on hand, they include investments and receivables. The reporting of noncurrent assets, which will be liquidated at some time beyond
8
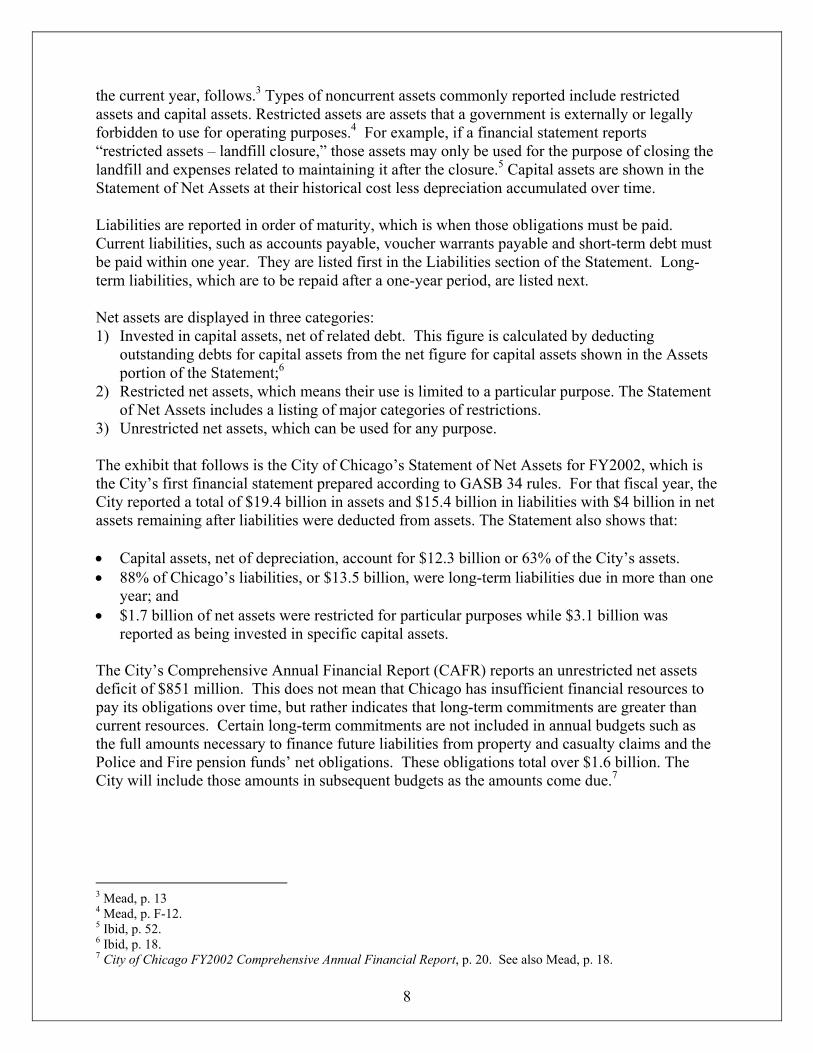
the current year, follows.3 Types of noncurrent assets commonly reported include restricted assets and capital assets. Restricted assets are assets that a government is externally or legally forbidden to use for operating purposes.4 For example, if a financial statement reports “restricted assets – landfill closure,” those assets may only be used for the purpose of closing the landfill and expenses related to maintaining it after the closure.5 Capital assets are shown in the Statement of Net Assets at their historical cost less depreciation accumulated over time. Liabilities are reported in order of maturity, which is when those obligations must be paid. Current liabilities, such as accounts payable, voucher warrants payable and short-term debt must be paid within one year. They are listed first in the Liabilities section of the Statement. Long-term liabilities, which are to be repaid after a one-year period, are listed next. Net assets are displayed in three categories: 1) Invested in capital assets, net of related debt. This figure is calculated by deducting
outstanding debts for capital assets from the net figure for capital assets shown in the Assets portion of the Statement;6
2) Restricted net assets, which means their use is limited to a particular purpose. The Statement of Net Assets includes a listing of major categories of restrictions.
3) Unrestricted net assets, which can be used for any purpose. The exhibit that follows is the City of Chicago’s Statement of Net Assets for FY2002, which is the City’s first financial statement prepared according to GASB 34 rules. For that fiscal year, the City reported a total of $19.4 billion in assets and $15.4 billion in liabilities with $4 billion in net assets remaining after liabilities were deducted from assets. The Statement also shows that: • Capital assets, net of depreciation, account for $12.3 billion or 63% of the City’s assets. • 88% of Chicago’s liabilities, or $13.5 billion, were long-term liabilities due in more than one
year; and • $1.7 billion of net assets were restricted for particular purposes while $3.1 billion was
reported as being invested in specific capital assets. The City’s Comprehensive Annual Financial Report (CAFR) reports an unrestricted net assets deficit of $851 million. This does not mean that Chicago has insufficient financial resources to pay its obligations over time, but rather indicates that long-term commitments are greater than current resources. Certain long-term commitments are not included in annual budgets such as the full amounts necessary to finance future liabilities from property and casualty claims and the Police and Fire pension funds’ net obligations. These obligations total over $1.6 billion. The City will include those amounts in subsequent budgets as the amounts come due.7
3 Mead, p. 13 4 Mead, p. F-12. 5 Ibid, p. 52. 6 Ibid, p. 18. 7 City of Chicago FY2002 Comprehensive Annual Financial Report, p. 20. See also Mead, p. 18.

9
Governmental Business-typeActivities Activities Total
ASSETS Cash and Cash Equivalents 838,303$ 152,297$ 990,600$ Investments 833,533$ 3,199$ 836,732$ Cash & Investments with Escrow Agent 297,811$ -$ 297,811$ Receivables (net of allowances) Property Tax 839,098$ -$ 839,098$ Accounts 508,843$ 127,683$ 636,526$ Internal Balances 32,140$ (32,140)$ -$ Inventories 22,827$ 17,997$ 40,824$ Restricted Assets: -$ Cash & Cash Equivalents -$ 1,167,655$ 1,167,655$ Investments -$ 1,251,723$ 1,251,723$ Other Assets 685,480$ 357,099$ 1,042,579$ Capital Assets (Note 2): -$ Land, Improvements, Art & Construction in Progress 1,384,977$ 1,053,574$ 2,438,551$ Other Capital Assets, Net of Depreciation 4,446,226$ 5,447,524$ 9,893,750$ Total Capital Assets 5,831,203$ 6,501,098$ 12,332,301$ Total Assets 9,889,238$ 9,546,611$ 19,435,849$
LIABILITIES Voucher Warrants Payable 417,186$ 251,280$ 668,466$ Short-term Debt 13,312$ -$ 13,312$ Accrued Interest 79,072$ 145,497$ 224,569$ Accrued & Other Liabilities 241,726$ 111,733$ 353,459$ Deferred Revenue 203,739$ 38,233$ 241,972$ Long-Term Liabilities: Due Within One Year 280,225$ 73,675$ 353,900$ Due in More than One Year 7,064,982$ 6,488,699$ 13,553,681$ Total Liabilities 8,300,242$ 7,109,117$ 15,409,359$
NET ASSETSInvested in capital assets, net of related debt 1,418,685$ 1,744,719$ 3,163,404$ Restricted for: Capital Projects 32,543$ 208,253$ 240,796$ Debt Service 802,126$ 28,569$ 830,695$ Federal, State & Local Grants 23,590$ -$ 23,590$ Other Purposes 139,428$ 479,882$ 619,310$ Unrestricted (Deficit) (827,376)$ (23,929)$ (851,305)$ Total Net Assets 1,588,996$ 2,437,494$ 4,026,490$
Primary Government
CITY OF CHICAGOSTATEMENT OF NET ASSETS
FOR THE YEAR ENDING DECEMBER 31, 2002(Amounts are in Thousands of Dollars)
10
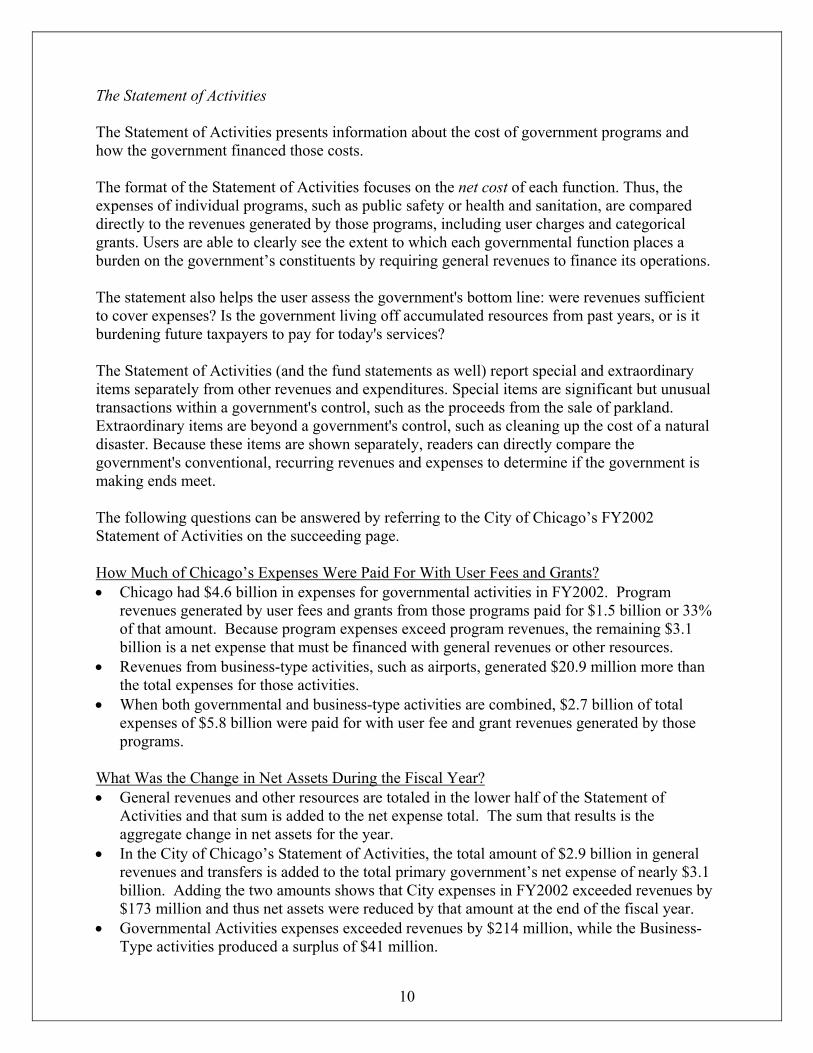
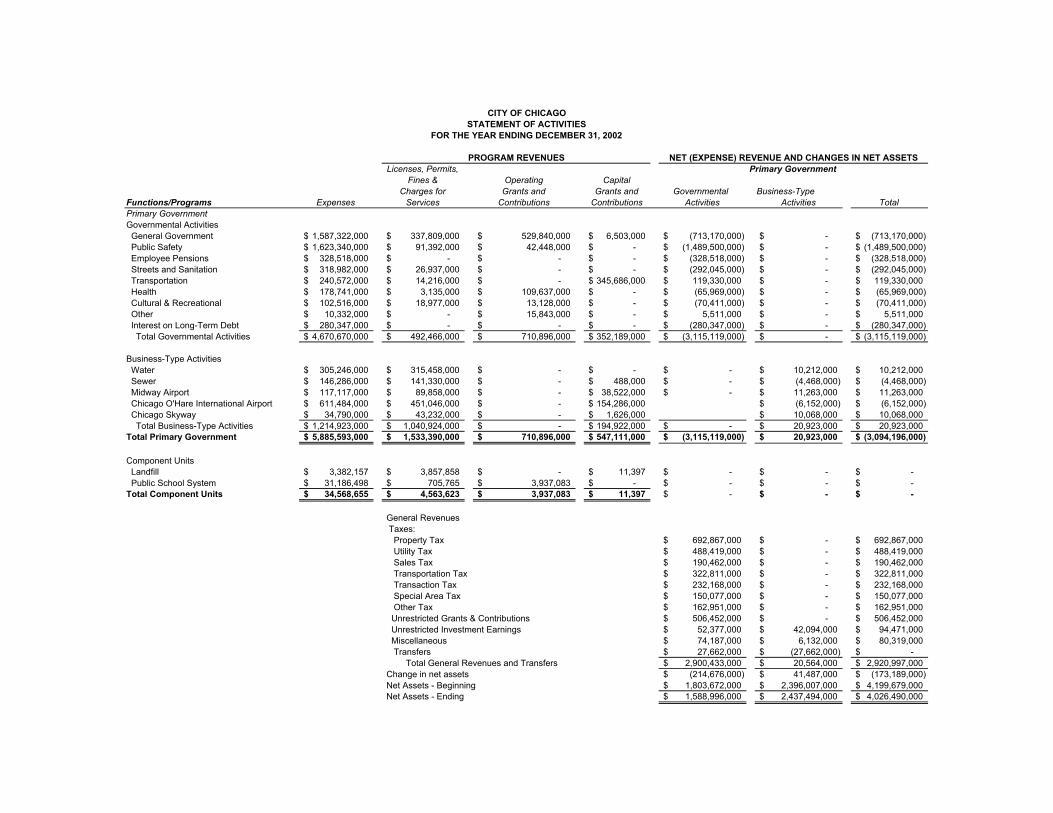
The Statement of Activities The Statement of Activities presents information about the cost of government programs and how the government financed those costs. The format of the Statement of Activities focuses on the net cost of each function. Thus, the expenses of individual programs, such as public safety or health and sanitation, are compared directly to the revenues generated by those programs, including user charges and categorical grants. Users are able to clearly see the extent to which each governmental function places a burden on the government’s constituents by requiring general revenues to finance its operations. The statement also helps the user assess the government's bottom line: were revenues sufficient to cover expenses? Is the government living off accumulated resources from past years, or is it burdening future taxpayers to pay for today's services? The Statement of Activities (and the fund statements as well) report special and extraordinary items separately from other revenues and expenditures. Special items are significant but unusual transactions within a government's control, such as the proceeds from the sale of parkland. Extraordinary items are beyond a government's control, such as cleaning up the cost of a natural disaster. Because these items are shown separately, readers can directly compare the government's conventional, recurring revenues and expenses to determine if the government is making ends meet. The following questions can be answered by referring to the City of Chicago’s FY2002 Statement of Activities on the succeeding page. How Much of Chicago’s Expenses Were Paid For With User Fees and Grants? • Chicago had $4.6 billion in expenses for governmental activities in FY2002. Program
revenues generated by user fees and grants from those programs paid for $1.5 billion or 33% of that amount. Because program expenses exceed program revenues, the remaining $3.1 billion is a net expense that must be financed with general revenues or other resources.
• Revenues from business-type activities, such as airports, generated $20.9 million more than the total expenses for those activities.
• When both governmental and business-type activities are combined, $2.7 billion of total expenses of $5.8 billion were paid for with user fee and grant revenues generated by those programs.
What Was the Change in Net Assets During the Fiscal Year? • General revenues and other resources are totaled in the lower half of the Statement of
Activities and that sum is added to the net expense total. The sum that results is the aggregate change in net assets for the year.
• In the City of Chicago’s Statement of Activities, the total amount of $2.9 billion in general revenues and transfers is added to the total primary government’s net expense of nearly $3.1 billion. Adding the two amounts shows that City expenses in FY2002 exceeded revenues by $173 million and thus net assets were reduced by that amount at the end of the fiscal year.
• Governmental Activities expenses exceeded revenues by $214 million, while the Business-Type activities produced a surplus of $41 million.
Licenses, Permits,Fines & Operating Capital
Charges for Grants and Grants and Governmental Business-TypeFunctions/Programs Expenses Services Contributions Contributions Activities Activities TotalPrimary GovernmentGovernmental Activities General Government 1,587,322,000$ 337,809,000$ 529,840,000$ 6,503,000$ (713,170,000)$ -$ (713,170,000)$ Public Safety 1,623,340,000$ 91,392,000$ 42,448,000$ -$ (1,489,500,000)$ -$ (1,489,500,000)$ Employee Pensions 328,518,000$ -$ -$ -$ (328,518,000)$ -$ (328,518,000)$ Streets and Sanitation 318,982,000$ 26,937,000$ -$ -$ (292,045,000)$ -$ (292,045,000)$ Transportation 240,572,000$ 14,216,000$ -$ 345,686,000$ 119,330,000$ -$ 119,330,000$ Health 178,741,000$ 3,135,000$ 109,637,000$ -$ (65,969,000)$ -$ (65,969,000)$ Cultural & Recreational 102,516,000$ 18,977,000$ 13,128,000$ -$ (70,411,000)$ -$ (70,411,000)$ Other 10,332,000$ -$ 15,843,000$ -$ 5,511,000$ -$ 5,511,000$ Interest on Long-Term Debt 280,347,000$ -$ -$ -$ (280,347,000)$ -$ (280,347,000)$ Total Governmental Activities 4,670,670,000$ 492,466,000$ 710,896,000$ 352,189,000$ (3,115,119,000)$ -$ (3,115,119,000)$
Business-Type Activities Water 305,246,000$ 315,458,000$ -$ -$ -$ 10,212,000$ 10,212,000$ Sewer 146,286,000$ 141,330,000$ -$ 488,000$ -$ (4,468,000)$ (4,468,000)$ Midway Airport 117,117,000$ 89,858,000$ -$ 38,522,000$ -$ 11,263,000$ 11,263,000$ Chicago O'Hare International Airport 611,484,000$ 451,046,000$ -$ 154,286,000$ (6,152,000)$ (6,152,000)$ Chicago Skyway 34,790,000$ 43,232,000$ -$ 1,626,000$ 10,068,000$ 10,068,000$ Total Business-Type Activities 1,214,923,000$ 1,040,924,000$ -$ 194,922,000$ -$ 20,923,000$ 20,923,000$ Total Primary Government 5,885,593,000$ 1,533,390,000$ 710,896,000$ 547,111,000$ (3,115,119,000)$ 20,923,000$ (3,094,196,000)$
Component Units Landfill 3,382,157$ 3,857,858$ -$ 11,397$ -$ -$ -$ Public School System 31,186,498$ 705,765$ 3,937,083$ -$ -$ -$ -$ Total Component Units 34,568,655$ 4,563,623$ 3,937,083$ 11,397$ -$ -$ -$
General Revenues Taxes: Property Tax 692,867,000$ -$ 692,867,000$ Utility Tax 488,419,000$ -$ 488,419,000$ Sales Tax 190,462,000$ -$ 190,462,000$ Transportation Tax 322,811,000$ -$ 322,811,000$ Transaction Tax 232,168,000$ -$ 232,168,000$ Special Area Tax 150,077,000$ -$ 150,077,000$ Other Tax 162,951,000$ -$ 162,951,000$ Unrestricted Grants & Contributions 506,452,000$ -$ 506,452,000$ Unrestricted Investment Earnings 52,377,000$ 42,094,000$ 94,471,000$ Miscellaneous 74,187,000$ 6,132,000$ 80,319,000$ Transfers 27,662,000$ (27,662,000)$ -$ Total General Revenues and Transfers 2,900,433,000$ 20,564,000$ 2,920,997,000$ Change in net assets (214,676,000)$ 41,487,000$ (173,189,000)$ Net Assets - Beginning 1,803,672,000$ 2,396,007,000$ 4,199,679,000$ Net Assets - Ending 1,588,996,000$ 2,437,494,000$ 4,026,490,000$
NET (EXPENSE) REVENUE AND CHANGES IN NET ASSETSPrimary Government
CITY OF CHICAGOSTATEMENT OF ACTIVITIES
FOR THE YEAR ENDING DECEMBER 31, 2002
PROGRAM REVENUES

12
Infrastructure Asset Reporting One of the most significant features of government-wide financial statements is the first-time inclusion of information about all capital assets. “Capital assets” include all general governmental infrastructure assets, such as roads, bridges and sewer systems. Traditional annual financial statements provide no information about this enormous category of assets. There are two different ways that governments can provide information about their capital assets: 1) historical cost depreciation or 2) condition assessment. The historical cost depreciation method requires governments to calculate the historical or original cost of the existing major infrastructure assets that were constructed, purchased or renovated since the first fiscal year ending after June 30, 1980. This figure is reported on the Statement of Activities. At a minimum, the government can assess the historical cost of their infrastructure over a 25-year period and then allocate those costs over the useful lives of the assets by reporting annual depreciation expenses in the Statement of Activities. The second method of presenting capital asset information involves evaluating and reporting on the condition of those assets. Governments that can provide documentation that they are maintaining and preserving their infrastructure at an established condition level may report their maintenance and preservation expenses in lieu of depreciation. If governments choose the condition assessment option, they are required to disclose the following information: • The assessed physical condition of infrastructure assets. Assessments must be performed at
least every 3 years. The results of at least the three most recent condition assessments must be disclosed.
• Descriptions of the criteria the government uses to measure and report asset conditions and the intended condition level.
• A comparison between the annual dollar amount estimated to be required to maintain and preserve the assets at the condition level established by the government and the actual expenses for at least 5 years.
• Explanations of factors affecting trends in the disclosed information. Governments opting to report maintenance and preservation information make those disclosures in the required supplementary information (RSI) section of the annual financial report. In its financial statements, Chicago defines capital assets as “assets, or a network of assets with an initial cost of more than $5,000 and an estimated useful life in excess of two years.”8 These assets are recorded at historical cost or the estimated historical cost of when they are either purchased or constructed. Infrastructure is depreciated using a straight-line formula, which spreads depreciation evenly over the life of an asset. The City uses the following estimates to calculate the useful life of capital assets.
8 City of Chicago FY2002 Comprehensive Annual Financial Report, Note 1(d)(6), p. 51.

13
EstimatedCapital Asset Useful LifeUtility Plant 25-100 yearsUtility Structures and Improvements 50-100 yearsBuildings and Improvements 5-40 yearsAirport runways, aprons, tunnels, taxiways, etc. 5-40 yearsBridge Infrastructure 10-50 yearsLighting Infrastructure 25 yearsStreet Infrastructure 10-25 yearsTransit Infrastructure 10-40 yearsEquipment (vehicle, office, computer) 4-33 years
Source: FY2002 City of Chicago CAFR, p. 51.
CITY OF CHICAGO DEPRECIATION SCHEDULE
The next exhibit shows the City of Chicago’s disclosure of information about its capital assets in its FY2002 Comprehensive Annual Financial Report. In that year, the City reported that the value of its land, buildings, machinery, infrastructure and other improvements totaled $12.3 billion at the end of 2002. This represented an increase of $854 million between January 1 and December 31, 2002. Over $2.4 billion was reported in non-depreciable assets for both Governmental and Business-Type Activities. These include land, construction in progress and works of art.9 All capital assets were depreciated during FY2002 in the amount of $4.3 billion. Approximately $1.6 billion in “Additions” are shown in the exhibit. These represent the purchase or construction of new assets or improvements to existing assets.10 Disposals and transfers reflect the removal of costs and depreciation associated with assets sold or eliminated.
9 Land is always recorded in financial statements at cost. 10 Mead, p. 58.

14
DisposalsBalance and Balance
January 1, 2002 Additions Transfers December 31, 2002Governmental Activities:Capital Assets, not being depreciatedLand 1,166,906$ 28,624$ -$ 1,195,530$ Works of art, historical collections 7,640$ 739$ -$ 8,379$ Construction in Progress 268,047$ 492,590$ (579,569)$ 181,068$ Total Capital Assets, not being depreciated 1,442,593$ 521,953$ (579,569)$ 1,384,977$
Capital assets, being depreciated:Buildings & Other Improvements 1,123,304$ 70,029$ -$ 1,193,333$ Machinery and Equipment 671,056$ 73,942$ (8,804)$ 736,194$ Infrastructure 4,075,703$ 555,621$ -$ 4,631,324$ Total Capital assets, being depreciated 5,870,063$ 699,592$ (8,804)$ 6,560,851$
Less accumulated depreciation for:Buildings & Other Improvements 290,070$ 30,985$ -$ 321,055$ Machinery and Equipment 359,076$ 74,449$ (8,290)$ 425,235$ Infrastructure 1,199,993$ 168,342$ -$ 1,368,335$ Total accumulated depreciation 1,849,139$ 273,776$ (8,290)$ 2,114,625$
Total capital assets being depreciated, net 4,020,924$ 425,816$ (514)$ 4,446,226$
Total Governmental Activities 5,463,517$ 947,769$ (580,083)$ 5,831,203$
Business-Type ActivitiesCapital Assets, not being depreciatedLand 183,309$ 33,856$ -$ 217,165$ Construction in Progress 676,267$ 462,316$ (302,175)$ 836,408$ Total Capital Assets, not being depreciated 859,576$ 496,172$ (302,175)$ 1,053,573$
Capital assets, being depreciated:Buildings & Other Improvements 6,862,174$ 348,683$ 41,002$ 7,251,859$ Machinery and Equipment 329,371$ 26,990$ 46,251$ 402,612$ Total Capital assets, being depreciated 7,191,545$ 375,673$ 87,253$ 7,654,471$
Less accumulated depreciation for:Buildings & Other Improvements 1,868,364$ 146,533$ (884)$ 2,014,013$ Machinery and Equipment 168,246$ 25,083$ (396)$ 192,933$ Total accumulated depreciation 2,036,610$ 171,616$ (1,280)$ 2,206,946$
Total capital assets being depreciated, net 5,154,935$ 204,057$ 88,533$ 5,447,525$
Total Business-Type Activities 6,014,511$ 700,229$ (213,642)$ 6,501,098$
Capital Assets at December 31, 2002 11,478,028$ 1,647,998$ (793,725)$ 12,332,301$
CITY OF CHICAGODISCLOSURE OF INFORMATION ABOUT CAPITAL ASSETS (Note 6)
FOR THE YEAR ENDING DECEMBER 31, 2002(Dollars in Thousands)
Fund-Based Financial Statements: Reporting by Major Fund Fund-based information, which provides an important short-term measure of the revenues and expenditures of funds as well as individual fund performance, continues to be presented in the basic financial statements. However, the fund-based information is now presented by "major" fund, including the general fund.
Traditionally, fund information is reported in the aggregate by fund type. For example, individual governmental funds are classified into one of the four following fund types: general, special revenue, debt service or capital projects. Assets and liabilities are reported in the
15
financial statements in the aggregate for each fund type. This aggregation obscures the activities of individual funds, making it difficult for a user to assess a government's accountability for a major program, or a particular dedicated revenue. Now, users are able to track developments in an individual water and sewer fund or a road construction fund. Under the new rules, fund statements show separate columns for the general fund and other "major" governmental and enterprise funds. Major funds are defined to be those funds whose revenues, expenditures, assets or liabilities are at least 10% of the total for that fund category or type and at least 5% of the aggregate for all governmental and enterprise funds. Any other fund may be reported as a major fund if the government determines that the fund is particularly important to users. The remaining funds are classified as "nonmajor" funds and are aggregated in a separate column. However, governments that publish a CAFR display the nonmajor funds individually in the “combining” statements that follow the basic financial statements.
CITY OF CHICAGO MAJOR FUNDS Governmental Funds: General (Corporate) Fund Federal, State and Local Grants Fund Bond, Note, Redemption and Interest Fund Community Development and Improvement Projects Fund
Proprietary Funds (for Business-Type Activities): Water Fund Sewer Fund Chicago O'Hare International Airport Fund Midway Airport Fund
Enhanced Budget to Actual Comparisons Governments continue to provide information in their annual reports comparing final budget to accrual results for the general fund and for each major special revenue fund that has a legally adopted budget. However, for the first time, information also is provided about a government's originally adopted budget. Most governments revise their budgets over the course of a year. Including information about the original, final and actual budgets should help users to readily assess a government's ability to estimate and manage its general resources, as well as judge the government's budgetary compliance. The budgetary comparison schedule is disclosed in the required supplementary information (RSI) section of the financial statements. Another new feature on the Governmental Fund Balance Sheet and Statement of Revenues, Expenditures and Changes in Fund Balances is a "summary reconciliation." These reconciliations are presented in the financial statements to help users understand the relationship between how the fund-based and government-wide financial statements relate to one another.

GLOSSARY OF SELECTED TERMS Accrual Accounting. An accounting system that records revenues in the year in which they are earned (whether or not they have been received) and expenses in the year the resources are used. Asset. Anything of value an organization owns. Business-Type Activities. Government activities financed primarily by user fees and charges that operate and are financed like a private sector enterprise. Capital Assets. Buildings or equipment with useful lives of more than year. Fiduciary Activities. Activities in which a government acts as a trustee or agent for another entity, such as a pension fund. GASB Statement Number 34. GASB issues authoritative statements of accounting standards that are recognized under Rules of Conduct of the American Institute of Certified Public Accountants as the source of Generally Accepted Accounting Principles (GAAP). Statement Number 34 presents new reporting requirements for the audited financial statements prepared by state and local governments. Generally Accepted Accounting Principles (GAAP). The rules and conventions for preparing financial statements as established by GASB. In the audit function, auditors give opinions regarding whether or not financial statements contain errors and if they conform to GAAP Governmental Accounting Standards Board. The private, nonprofit body responsible for establishing accounting and financial reporting standards for state and local governments in the United States Government-Wide Statements. Financial statements that encompass all of a government’s activities that are prepared using the full accrual basis of accounting. Liability. Anything of value an organization owes. Management's Discussion and Analysis (MD&A). A “plain English” presentation of a government's overall financial condition that introduces the basic financial statements. Modified Accrual Accounting. An accounting system which reports only the revenues received and the cost paid for services provided in the current year or soon thereafter. Net Asset. Assets less Liabilities. Required Supplementary Information (RSI). Information that must accompany the Basic Financial Statements if a government’s financial statements are to be considered in accordance with generally accepted accounting principles. Statement of Activities. A financial statement that provides information about the net expenses of government and changes in net assets. Statement of Net Assets. A balance sheet that presents information about assets, liabilities and net assets.

17
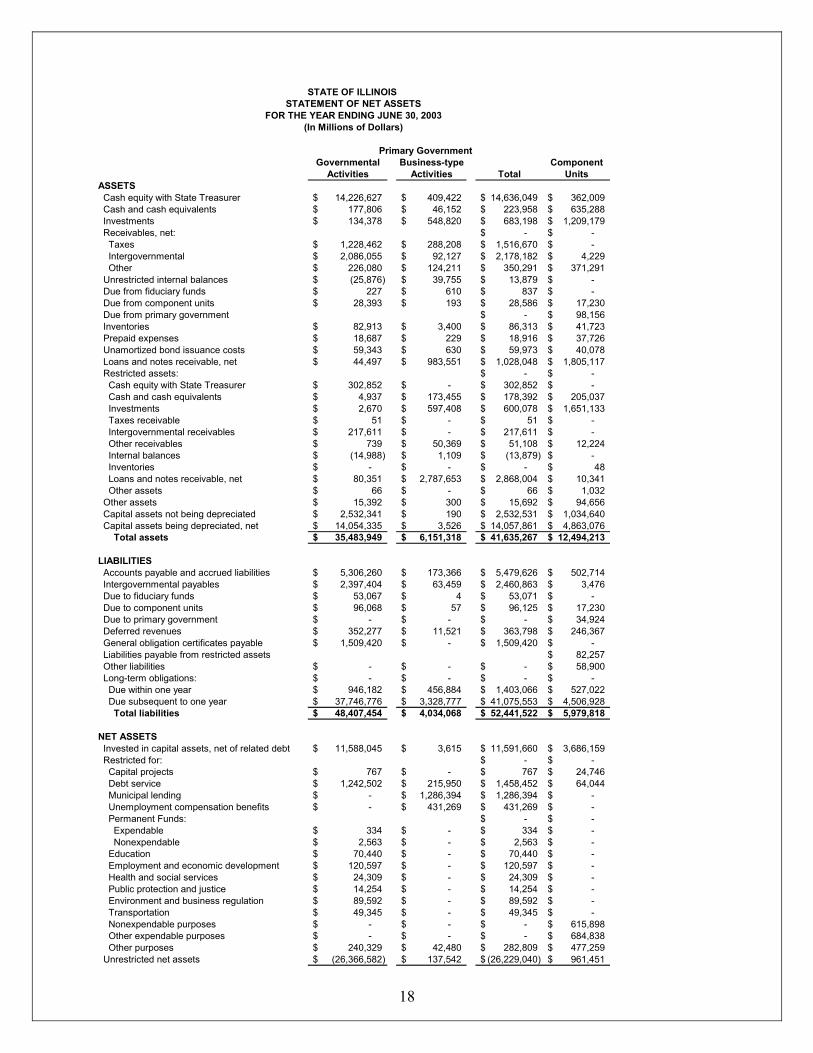
APPENDIX 1: STATE OF ILLINOIS State of Illinois FY2003 Statement of Net Assets The next two exhibits show the following information: 1. A summary comparison of the State of Illinois’s Statements of Net Assets for FY2002 and
FY2003 and 2. The full Statement of Net Assets for the State of Illinois for FY2003. • In FY2003, the State of Illinois reported a total of $41.6 billion in assets and $52.4 billion in
liabilities with a $10.8 billion deficit in net assets remaining after liabilities were deducted from assets.
• In the prior year, FY2002, the State reported $31 billion in assets and $36.9 billion in liabilities with a $5.9 billion deficit in net assets.
• Between FY2002 and FY2003, the State’s net assets declined by 45% or $4.9 billion. The full Statement also shows that: • 75% of the State’s liabilities, or $4.5 billion, were long-term liabilities due in more than one
year; and • The State’s component units reported a total of approximately $12.5 billion in assets and $5.9
billion in liabilities with $6.5 billion in net assets remaining after liabilities were deducted from assets.
Assets: 2003 2002 2003 2002 2003 2002 Current and other non-current assets 18,897$ 8,908$ 6,147$ 6,214$ 25,044$ 15,122$ Capital assets 16,587$ 15,943$ 4$ 4$ 16,591$ 15,947$ Total assets 35,484$ 24,851$ 6,151$ 6,218$ 41,635$ 31,069$
Liabilities: Other Liabilities 9,715$ 7,659$ 248$ 213$ 9,963$ 7,872$ Long-term Liabilities 38,693$ 26,049$ 3,786$ 3,064$ 42,479$ 29,113$ Total Liabilities 48,408$ 33,708$ 4,034$ 3,277$ 52,442$ 36,985$
Net assets: Invested in capital assets, net of related debt 11,588$ 11,138$ 4$ 4$ 11,592$ 11,142$ Restricted 1,855$ 1,597$ 1,976$ 2,891$ 3,831$ 4,488$ Unrestricted (26,367)$ (21,592)$ 137$ 46$ (26,230)$ (21,546)$ Total net assets (12,924)$ (8,857)$ 2,117$ 2,941$ (10,807)$ (5,916)$
STATE OF ILLINOIS NET ASSETS AS OF JUNE 30(In Millions of Dollars)
ActivitiesTotal PrimaryGovernment
Business-TypeActivities
Governmental
18
Governmental Business-type ComponentActivities Activities Total Units
ASSETS Cash equity with State Treasurer 14,226,627$ 409,422$ 14,636,049$ 362,009$ Cash and cash equivalents 177,806$ 46,152$ 223,958$ 635,288$ Investments 134,378$ 548,820$ 683,198$ 1,209,179$ Receivables, net: -$ -$ Taxes 1,228,462$ 288,208$ 1,516,670$ -$ Intergovernmental 2,086,055$ 92,127$ 2,178,182$ 4,229$ Other 226,080$ 124,211$ 350,291$ 371,291$ Unrestricted internal balances (25,876)$ 39,755$ 13,879$ -$ Due from fiduciary funds 227$ 610$ 837$ -$ Due from component units 28,393$ 193$ 28,586$ 17,230$ Due from primary government -$ 98,156$ Inventories 82,913$ 3,400$ 86,313$ 41,723$ Prepaid expenses 18,687$ 229$ 18,916$ 37,726$ Unamortized bond issuance costs 59,343$ 630$ 59,973$ 40,078$ Loans and notes receivable, net 44,497$ 983,551$ 1,028,048$ 1,805,117$ Restricted assets: -$ -$ Cash equity with State Treasurer 302,852$ -$ 302,852$ -$ Cash and cash equivalents 4,937$ 173,455$ 178,392$ 205,037$ Investments 2,670$ 597,408$ 600,078$ 1,651,133$ Taxes receivable 51$ -$ 51$ -$ Intergovernmental receivables 217,611$ -$ 217,611$ -$ Other receivables 739$ 50,369$ 51,108$ 12,224$ Internal balances (14,988)$ 1,109$ (13,879)$ -$ Inventories -$ -$ -$ 48$ Loans and notes receivable, net 80,351$ 2,787,653$ 2,868,004$ 10,341$ Other assets 66$ -$ 66$ 1,032$ Other assets 15,392$ 300$ 15,692$ 94,656$ Capital assets not being depreciated 2,532,341$ 190$ 2,532,531$ 1,034,640$ Capital assets being depreciated, net 14,054,335$ 3,526$ 14,057,861$ 4,863,076$ Total assets 35,483,949$ 6,151,318$ 41,635,267$ 12,494,213$
LIABILITIES Accounts payable and accrued liabilities 5,306,260$ 173,366$ 5,479,626$ 502,714$ Intergovernmental payables 2,397,404$ 63,459$ 2,460,863$ 3,476$ Due to fiduciary funds 53,067$ 4$ 53,071$ -$ Due to component units 96,068$ 57$ 96,125$ 17,230$ Due to primary government -$ -$ -$ 34,924$ Deferred revenues 352,277$ 11,521$ 363,798$ 246,367$ General obligation certificates payable 1,509,420$ -$ 1,509,420$ -$ Liabilities payable from restricted assets 82,257$ Other liabilities -$ -$ -$ 58,900$ Long-term obligations: -$ -$ -$ -$ Due within one year 946,182$ 456,884$ 1,403,066$ 527,022$ Due subsequent to one year 37,746,776$ 3,328,777$ 41,075,553$ 4,506,928$ Total liabilities 48,407,454$ 4,034,068$ 52,441,522$ 5,979,818$ NET ASSETS Invested in capital assets, net of related debt 11,588,045$ 3,615$ 11,591,660$ 3,686,159$ Restricted for: -$ -$ Capital projects 767$ -$ 767$ 24,746$ Debt service 1,242,502$ 215,950$ 1,458,452$ 64,044$ Municipal lending -$ 1,286,394$ 1,286,394$ -$ Unemployment compensation benefits -$ 431,269$ 431,269$ -$ Permanent Funds: -$ -$ Expendable 334$ -$ 334$ -$ Nonexpendable 2,563$ -$ 2,563$ -$ Education 70,440$ -$ 70,440$ -$ Employment and economic development 120,597$ -$ 120,597$ -$ Health and social services 24,309$ -$ 24,309$ -$ Public protection and justice 14,254$ -$ 14,254$ -$ Environment and business regulation 89,592$ -$ 89,592$ -$ Transportation 49,345$ -$ 49,345$ -$ Nonexpendable purposes -$ -$ -$ 615,898$ Other expendable purposes -$ -$ -$ 684,838$ Other purposes 240,329$ 42,480$ 282,809$ 477,259$ Unrestricted net assets (26,366,582)$ 137,542$ (26,229,040)$ 961,451$
Primary Government
STATE OF ILLINOIS STATEMENT OF NET ASSETS
FOR THE YEAR ENDING JUNE 30, 2003(In Millions of Dollars)

19
State of Illinois FY2003 Statement of Activities The following questions can be answered by referring to the State of Illinois FY2003 Statement of Activities. How Much of the State’s Expenses Were Paid For With User Fees and Grants? • The State of Illinois reported $43.1 billion in expenses for governmental activities in
FY2003. Program revenues generated by user fees and grants from those programs paid for $14.7 billion or 33% of that amount. Because program expenses exceed program revenues, the remaining $28.4 billion is a net expense that was financed with general revenues or other resources.
• Expenses for the State’s business-type activities, such as the lottery, were approximately $4.7 billion in FY2003. Revenues generated by those activities were over $4.3 billion. This means the $327 million difference between expenses and revenues was reported as a net expense, which was financed with non-program generated resources.
• When both governmental and business-type activities are combined, approximately $19.1 billion of total expenses of $47.8 billion were paid for with user fee and grant revenues generated by those programs. The remaining $28.7 billion were paid for with general revenues and other resources.
What Was the Change in the State’s Net Assets During the Fiscal Year? • General revenues and other resources are totaled in the lower half of the Statement of
Activities and that sum is added to the net expense total. The sum that results is the aggregate change in net assets for the year.
• In the State of Illinois FY2003 Statement of Activities, the total amount of approximately $23.7 billion in general revenues and transfers was added to the total primary government’s net expense of $28.7 billion. Adding the two amounts shows that State of Illinois expenses in FY2003 exceeded revenues by $4.9 billion and thus net assets were reduced by that amount at the end of the fiscal year.
• The Governmental Activities reported a deficit in net assets of $4.1 billion, while the Business-Type activities generated a deficit of $823 million.
• Total assets at the end of FY2003 were reported as -$12.9 billion, a $4.1 billion reduction from the beginning of the year amount of -$8.8 billion.
• Liabilities exceeded assets for Governmental and Business-Type activities by $5.8 billion of FY2003. By the end of the year, the deficit had increased to $10.8 billion.

Operating Capital
Charges for Grants and Grants and Governmental Business-Type Component Functions/Programs Expenses Services Contributions Contributions Activities Activities Total UnitsPrimary GovernmentGovernmental Activities Health and Social Services 16,071,805$ 96,670$ 9,329,672$ -$ (6,645,463)$ -$ (6,645,463)$ Education 12,621,510$ 2,306$ 1,727,578$ -$ (10,891,626)$ -$ (10,891,626)$ General Government 2,450,460$ 1,614,665$ 38,233$ -$ (797,562)$ -$ (797,562)$ Employment & Economic Developmen 1,311,068$ 24,983$ 485,481$ 49$ (800,555)$ -$ (800,555)$ Transportation 3,568,584$ 20,685$ 159,255$ 716,218$ (2,672,426)$ -$ (2,672,426)$ Public Protection & Justice 2,115,889$ 81,633$ 128,918$ -$ (1,905,338)$ -$ (1,905,338)$ Environment & Business Regulation 842,393$ 232,659$ 72,442$ 3,492$ (533,800)$ -$ (533,800)$ Intergovernmental 3,483,426$ -$ -$ -$ (3,483,426)$ -$ (3,483,426)$ Interest & Other Charges 672,707$ -$ -$ -$ (672,707)$ -$ (672,707)$ Total Governmental Activities 43,137,842$ 2,073,601$ 11,941,579$ 719,759$ (28,402,903)$ -$ (28,402,903)$
Business-Type Activities Unemployment Compensation Trust 3,054,290$ 2,009,704$ -$ -$ -$ (1,044,586)$ (1,044,586)$ Water Revolving 15,828$ 38,169$ 127,110$ -$ -$ 149,451$ 149,451$ Designated Account Purchase Program 112,153$ 91,748$ 28,497$ -$ -$ 8,092$ 8,092$ Insurance Programs 280,822$ 305,126$ -$ -$ -$ 24,304$ 24,304$ Lottery 1,054,094$ 1,589,846$ -$ -$ -$ 535,752$ 535,752$ Prepaid Tuition Program 25,825$ 13,615$ -$ -$ -$ (12,210)$ (12,210)$ Other 147,856$ 159,253$ -$ -$ -$ 11,397$ 11,397$ Total Business-Type Activities 4,690,868$ 4,207,461$ 155,607$ -$ -$ (327,800)$
Total Primary Government 47,828,710$ 6,281,062$ 12,097,186$ 719,759$ (28,730,703)$
Component Units Illinois Housing Development Authority 308,436$ 134,936$ 177,180$ -$ 3,680$ Toll Highway Authority 357,136$ 372,046$ -$ -$ 14,910$ Other Authorities 135,188$ 84,225$ 4,382$ -$ (46,581)$ Universities Illinois State University 312,382$ 157,001$ 25,881$ 467$ (129,033)$ Northern Illinois University 378,878$ 171,046$ 56,162$ 1,555$ (150,115)$ Southern Illinois University 735,457$ 304,084$ 81,993$ 12,832$ (336,548)$ University of Illinois 3,325,936$ 1,280,912$ 860,228$ 17,329$ (1,167,467)$ Other Universities 610,354$ 228,680$ 94,844$ 36$ (286,794)$ Total Component Units 6,163,767$ 2,732,930$ 1,300,670$ 32,219$ (2,097,948)$
General RevenuesTaxes: Income Taxes 8,390,241$ -$ 8,390,241$ -$ Sales Taxes 8,350,714$ -$ 8,350,714$ -$ Motor Fuel Taxes 1,325,748$ -$ 1,325,748$ -$ Public Utility Taxes 1,616,763$ -$ 1,616,763$ -$ Other Taxes 2,591,336$ -$ 2,591,336$ -$ Interest & Investment Income (Loss) 125,184$ 32,870$ 158,054$ 98,065$ Other Revenues 1,344,446$ 114$ 1,344,560$ 270,740$ Payments from State of Illinois -$ -$ -$ 2,066,885$ Additions to Permanent Endowments -$ -$ -$ 31,783$ Transfers 528,711$ (528,711)$ -$ -$ Total General Revenues and Transfers 24,273,143$ (495,727)$ 23,777,416$ 2,467,473$ Change in net assets (4,129,760)$ (823,527)$ (4,953,287)$ 369,525$ Net Assets - Beginning (8,793,745)$ 2,940,919$ (5,852,826)$ 6,144,870$ Net Assets - Ending (12,923,505)$ 2,117,392$ (10,806,113)$ 6,514,395$
Primary Government
STATE OF ILLINOISSTATEMENT OF ACTIVITIES
FOR THE YEAR ENDING JUNE 30, 2003
PROGRAM REVENUES NET (EXPENSE) REVENUE AND CHANGES IN NET ASSETS
(Expressed in Thousands)

21
APPENDIX 2: COOK COUNTY Cook County FY2002 Statement of Net Assets In FY2002, Cook County reported a total of $4.6 billion in assets and $3.4 billion in liabilities with $1.2 billion in net assets remaining after liabilities were deducted from assets. The Statement also shows that: • Fixed assets, net of depreciation, account for $2.2 billion or 47% of the County’s total assets. • 85% of Cook County’s liabilities, or $2.9 billion, were long-term liabilities due in more than
one year; and • $463.7 million of net assets were restricted for particular purposes while $799 million was
reported as being unrestricted.
Governmental Business-typeActivities Activities Total
ASSETSCash and Investments 857,066,640$ 265,072,591$ 1,122,139,231$ Cash and Investments with Trustees 196,318,795$ -$ 196,318,795$ Tax receivable 587,933,500$ 160,934,821$ 748,868,321$ Other assets 2,922,767$ 1,357,561$ 4,280,328$ Due from other governments 84,131,482$ 36,395,998$ 120,527,480$ Internal balances (759,000)$ 759,000$ -$ Loans receivable, net 27,799,335$ -$ 27,799,335$ Fixed assets, net of accumulated depreciation 1,520,089,089$ 694,406,146$ 2,214,495,235$ Pension asset 137,252,924$ -$ 137,252,924$ Deferred bond issuance costs 7,181,294$ -$ 7,181,294$ Patient accounts: -$ Net of allowances for uncollectible accounts - $656,868,779 -$ 94,295,774$ 94,295,774$ Third-party settlements -$ 11,730,573$ 11,730,573$ Inventories -$ 11,394,305$ 11,394,305$ Total assets 3,419,936,826$ 1,276,346,769$ 4,696,283,595$
LIABILITIESAccounts payable 96,497,403$ 29,776,032$ 126,273,435$ Accrued salaries payable 42,198,102$ 60,863,347$ 103,061,449$ Deferred revenue - property tax 37,321,253$ -$ 37,321,253$ Deferred revenue - other 17,913,423$ -$ 17,913,423$ Other liabilities 4,390,001$ 89,324,789$ 93,714,790$ Accrued interest 5,828,694$ -$ 5,828,694$ Non current liabilities -$ Due within one year 115,488,505$ -$ 115,488,505$ Due in more than one year 2,924,906,035$ 7,996,823$ 2,932,902,858$ Total liabilities 3,244,543,416$ 187,960,991$ 3,432,504,407$
NET ASSETSInvested in capital assets, net of debt (646,014,864)$ 694,406,146$ 48,391,282$ Restricted for: Debt service 272,784,861$ -$ 272,784,861$ Other restricted funds for specific purposes 137,252,924$ 5,274,739$ 142,527,663$ Unrestricted 411,280,489$ 388,704,893$ 799,985,382$ Total net assets 175,303,410$ 1,088,385,778$ 1,263,689,188$
Primary Government
COOK COUNTYSTATEMENT OF NET ASSETS
FOR THE YEAR ENDING NOVEMBER 30, 2002

22
Cook County FY2002 Statement of Activities The following questions can be answered by referring to the Cook County FY2002 Statement of Activities. How Much of Cook County’s Expenses Were Paid For With User Fees and Grants? • Cook County reported $1.8 billion in expenses for governmental activities in FY2002.
Program revenues generated by user fees and grants from those programs paid for $445 million or about 25% of that amount. Because program expenses exceed program revenues, the remaining $1.3 billion is a net expense that was financed with general revenues or other resources.
• Expenses for the County’s business-type activities, which were its health facilities, were approximately $869 million in FY2002. Revenues generated by those activities were $454 million. The $415 million difference between expenses and revenues was reported as a net expense, which was financed with non-program generated resources.
• When both governmental and business-type activities are combined, approximately $899 million of total expenses of nearly $2.7 billion were paid for with user fee and grant revenues generated by those programs. The remaining amount of approximately $1.8 billion was paid for with general revenues and other resources.
What Was the Change in the State’s Net Assets During the Fiscal Year? • General revenues and other resources are totaled in the lower half of the Statement of
Activities and that sum is added to the net expense total. The sum that results is the aggregate change in net assets for the year.
• In the Cook County 2002 Statement of Activities, the total amount of approximately $1.5 billion in general revenues and transfers was added to the total primary government’s net expense of $1.7 billion. Adding the two amounts shows that County expenses in FY2002 exceeded revenues by $213 million and thus net assets were reduced by that amount at the end of the fiscal year.
• Total assets at the end of FY2002 were reported as $1.2 billion, a $212 million reduction from the beginning of the year amount of $1.4 billion.
• In FY2002, the Governmental Activities reported a deficit in net assets of $280 million, while the Business-Type activities generated a surplus of $66.9 million.

Operating Capital
Charges for Grants and Grants and Governmental Business-TypeFunctions/Programs Expenses Services Contributions Contributions Activities Activities TotalPrimary GovernmentGovernmental Activities Government Management/Support Services 284,450,021$ 74,849,591$ 4,701,586$ -$ (204,898,844)$ -$ (204,898,844)$ Corrections 453,517,946$ 23,726,494$ 35,099,042$ 2,405,020$ (392,287,390)$ -$ (392,287,390)$ Courts 704,840,955$ 93,908,860$ 87,176,316$ 5,969,636$ (517,786,143)$ -$ (517,786,143)$ Control of Environment 50,292,707$ 12,993,794$ 25,302,989$ 157,113$ (11,838,811)$ -$ (11,838,811)$ Assessment & Collection of Taxes 59,336,498$ 39,014,159$ -$ -$ (20,322,339)$ -$ (20,322,339)$ Election 41,299,876$ -$ -$ -$ (41,299,876)$ -$ (41,299,876)$ Economic & Human Development 34,556,113$ -$ 37,182,914$ -$ 2,626,801$ -$ 2,626,801$ Transportation 59,172,233$ -$ 2,940,522$ -$ (56,231,711)$ -$ (56,231,711)$ Interest & Other Charges 127,089,106$ -$ -$ -$ (127,089,106)$ -$ (127,089,106)$ Total Governmental Activities 1,814,555,455$ 244,492,898$ 192,403,369$ 8,531,769$ (1,369,127,419)$ -$ (1,369,127,419)$
Business-Type Activities Health Facilities 869,467,512$ 432,382,261$ 21,993,166$ -$ -$ (415,092,085)$ (415,092,085)$ Total Business-Type Activities 869,467,512$ 432,382,261$ 21,993,166$ -$ -$ (415,092,085)$ (415,092,085)$ Total Primary Government 2,684,022,967$ 676,875,159$ 214,396,535$ 8,531,769$ (1,369,127,419)$ (415,092,085)$ (1,784,219,504)$
Component Units Chicago Zoological Society 49,845,000$ 31,976,000$ -$ 5,940,000$ -$ -$ -$ Chicago Horticultural Society 28,963,000$ 19,312,000$ 86,000$ 2,205,000$ -$ -$ -$ Emergency Telephone Systems 1,816,860$ 2,435,796$ 97,108$ -$ Total Component Units 80,624,860$ 53,723,796$ 183,108$ 8,145,000$ -$ -$ -$
General Revenues Taxes: Property Taxes 578,254,840$ 155,766,738$ 734,021,578$ Nonproperty Taxes: Personal Property Replacement Tax 29,807,190$ -$ 29,807,190$ County Sales Tax 213,758,854$ 61,538,872$ 275,297,726$ County Use Tax 54,484,115$ -$ 54,484,115$ State Income Tax 8,326,861$ -$ 8,326,861$ Alcohol Beverage Tax 25,467,066$ -$ 25,467,066$ Gasoline Tax 105,706,037$ -$ 105,706,037$ Cigarette Taxes 33,131,006$ 8,214,786$ 41,345,792$ Amusement Tax 13,802,069$ -$ 13,802,069$ Parking Tax 37,770,138$ -$ 37,770,138$ Motor Fuel & Other 107,106,193$ 107,106,193$ Other Nonproperty 20,493,696$ 20,493,696$ Total Nonproperty Taxes: 649,853,225$ 69,753,658$ 719,606,883$ Total Taxes: 1,228,108,065$ 225,520,396$ 1,453,628,461$
Miscellaneous Revenue 21,209,964$ -$ 21,209,964$ Investment Income (Loss) 21,300,210$ 2,612,064$ 23,912,274$ Lawsuit Settlement 44,578,557$ -$ 44,578,557$ Gain/Loss on Sale of Land (1,560,020)$ -$ (1,560,020)$ Restricted Gifts,Grants,Bequests -$ 22,257,925$ 22,257,925$ Transfers (64,400,920)$ 71,139,190$ 6,738,270$ Contributed Capital (160,554,564)$ 160,554,564$ -$ Total General Revenues and Transfers 1,088,681,292$ 482,084,139$ 1,570,765,431$ Change in net assets (280,446,127)$ 66,992,054$ (213,454,073)$ Net Assets - Beginning 455,839,537$ 1,021,393,724$ 1,477,233,261$ Net Assets - Ending 175,393,410$ 1,088,385,778$ 1,263,779,188$
Primary Government
COOK COUNTYSTATEMENT OF ACTIVITIES
FOR THE YEAR ENDING DECEMBER 31, 2002
PROGRAM REVENUES NET (EXPENSE) REVENUE AND CHANGES IN NET ASSETS


