The Hashemite Kingdom of Jordan Ministry of Health Non-Communicable Diseases Directorate National Registry of End Stage Renal Disease ( ESRD ) Annual Report 2012 www.moh.gov.jo Tel: 5678197 Fax: 5656489 Jordan
The Hashemite Kingdom of Jordan
Ministry of Health
Non-Communicable Diseases Directorate
National Registry of End Stage Renal Disease
( ESRD )
Annual Report 2012
www.moh.gov.jo
Tel: 5678197 Fax: 5656489
Jordan
The Hashemite Kingdom of Jordan
Ministry of Health
Non-Communicable Disease Directorate
National Registry of End Stage Renal Disease
( ESRD )
Annual Report 2012
Prepared by:
Dr. Mohammad Tarawneh Dr. Salem Al-Qaisi
His Majesty King Abdullah II

5
List of the team who participated in achieving this ESRD annual report:
Dr. Mohammad Salameh El-Lozi
Senior Consultant in Internal Medicine,
Nephrology and Transplantation. MRCP (UK). FRCP (London). FRCP (Glasgow),
Private sector and P.H.H.
Dr. khaled ali zayed
Nephrologist, MOH.
Dr.Elias Turk
Nephrologist, MOH.
Dr. Kamal Hassan Arkoub
Specialist in Community Medicine. MOH.

7
Foreword
8
Acknowledgement
The National ESRD Registry operates under the umbrella of the Ministry of Health; how-
ever, it works in cooperation with a large number of hospitals from all health sectors, Ne-
phrologists and Nurses working in dialysis units who provide the registry with valuable and
vital data required for success.
We would like to thank all those who cooperate with us, report and facilitate our work,
namely Nephrologists, Physicians, Nurses and staff of the Dialysis Units. The obvious sup-
port of focal points in all dialysis units is highly appreciated.
We would like to thank Mrs. Rasha Kokash for her effort in data entry of all ESRD Data to
special designed software for the Registry.
Special thanks to our focal points-head of renal units in all governmental, private , military
and university hospitals for the timely collection and submission of data to the registry. The
interaction between the Registry and the Jordan Society of Nephrology is very positive and
greatly appreciated.
The dedicated hard work during the process of data collection and data entry of the staff in
the registry is acknowledged.
We are very grateful to the World Health Organization for its support in preparing and pub-
lishing this report.
9
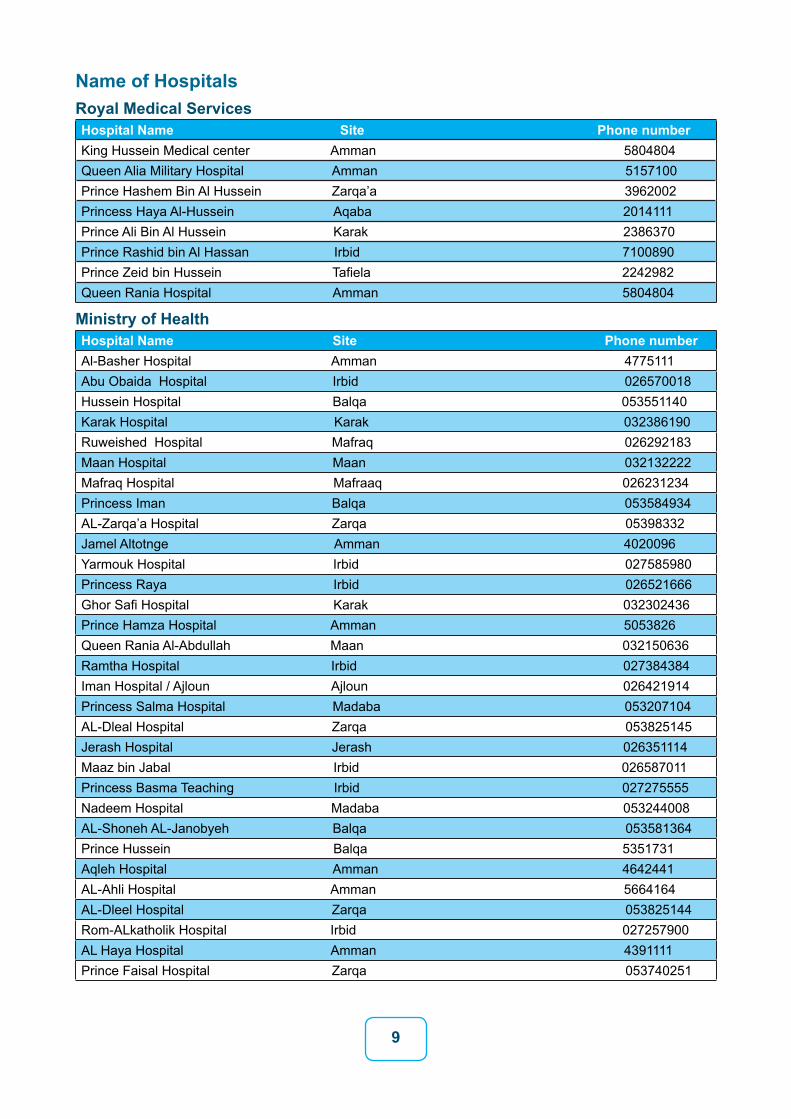
Name of HospitalsRoyal Medical Services Hospital Name Site Phone numberKing Hussein Medical center Amman 5804804Queen Alia Military Hospital Amman 5157100Prince Hashem Bin Al Hussein Zarqa’a 3962002Princess Haya Al-Hussein Aqaba 2014111Prince Ali Bin Al Hussein Karak 2386370Prince Rashid bin Al Hassan Irbid 7100890Prince Zeid bin Hussein Tafiela 2242982Queen Rania Hospital Amman 5804804
Ministry of Health Hospital Name Site Phone number Al-Basher Hospital Amman 4775111Abu Obaida Hospital Irbid 026570018Hussein Hospital Balqa 053551140Karak Hospital Karak 032386190Ruweished Hospital Mafraq 026292183Maan Hospital Maan 032132222Mafraq Hospital Mafraaq 026231234 Princess Iman Balqa 053584934AL-Zarqa’a Hospital Zarqa 05398332Jamel Altotnge Amman 4020096Yarmouk Hospital Irbid 027585980Princess Raya Irbid 026521666Ghor Safi Hospital Karak 032302436Prince Hamza Hospital Amman 5053826Queen Rania Al-Abdullah Maan 032150636Ramtha Hospital Irbid 027384384Iman Hospital / Ajloun Ajloun 026421914Princess Salma Hospital Madaba 053207104 AL-Dleal Hospital Zarqa 053825145Jerash Hospital Jerash 026351114Maaz bin Jabal Irbid 026587011Princess Basma Teaching Irbid 027275555Nadeem Hospital Madaba 053244008 AL-Shoneh AL-Janobyeh Balqa 053581364Prince Hussein Balqa 5351731Aqleh Hospital Amman 4642441AL-Ahli Hospital Amman 5664164AL-Dleel Hospital Zarqa 053825144 Rom-ALkatholik Hospital Irbid 027257900AL Haya Hospital Amman 4391111Prince Faisal Hospital Zarqa 053740251
10
University Hospitals
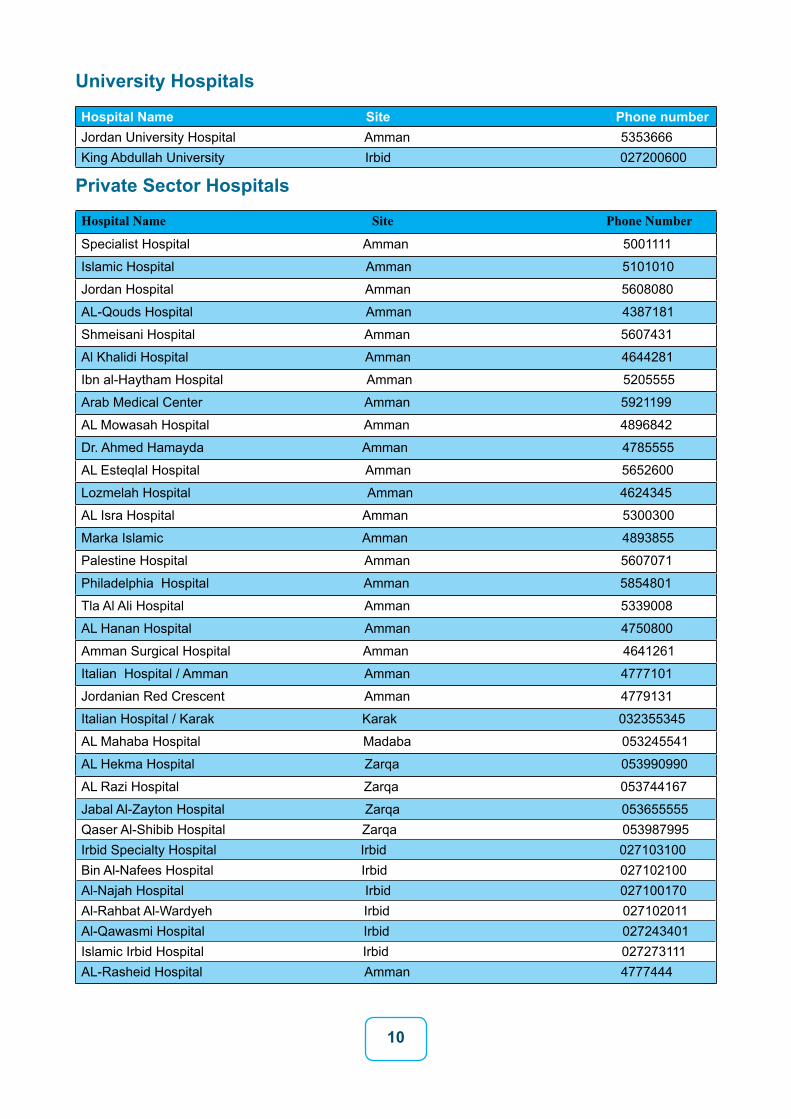
Hospital Name Site Phone numberJordan University Hospital Amman 5353666King Abdullah University Irbid 027200600
Private Sector Hospitals
Hospital Name Site Phone Number
Specialist Hospital Amman 5001111
Islamic Hospital Amman 5101010
Jordan Hospital Amman 5608080
AL-Qouds Hospital Amman 4387181
Shmeisani Hospital Amman 5607431
Al Khalidi Hospital Amman 4644281
Ibn al-Haytham Hospital Amman 5205555
Arab Medical Center Amman 5921199
AL Mowasah Hospital Amman 4896842
Dr. Ahmed Hamayda Amman 4785555
AL Esteqlal Hospital Amman 5652600
Lozmelah Hospital Amman 4624345
AL Isra Hospital Amman 5300300
Marka Islamic Amman 4893855
Palestine Hospital Amman 5607071
Philadelphia Hospital Amman 5854801
Tla Al Ali Hospital Amman 5339008
AL Hanan Hospital Amman 4750800
Amman Surgical Hospital Amman 4641261
Italian Hospital / Amman Amman 4777101
Jordanian Red Crescent Amman 4779131
Italian Hospital / Karak Karak 032355345
AL Mahaba Hospital Madaba 053245541
AL Hekma Hospital Zarqa 053990990
AL Razi Hospital Zarqa 053744167
Jabal Al-Zayton Hospital Zarqa 053655555Qaser Al-Shibib Hospital Zarqa 053987995Irbid Specialty Hospital Irbid 027103100Bin Al-Nafees Hospital Irbid 027102100Al-Najah Hospital Irbid 027100170Al-Rahbat Al-Wardyeh Irbid 027102011Al-Qawasmi Hospital Irbid 027243401Islamic Irbid Hospital Irbid 027273111 AL-Rasheid Hospital Amman 4777444
11
Table of Contents
pageList of Abbreviations 12
List of tables 13
List of Figures 14
Part One: 15
Introduction 17
Geography 18
Population 18
Jordan Renal Registry 26
Methodology 30
Part Two: 32
Dialysis Units in Jordan 32
Part Three: 34
ESRD Patients in Jordan 34
Number of prevalent ESRD patients in Jordan during (1992 - 2012) 34
Part Four 51
Incidence of ESRD Patients 51
Number of Incidence ESRD patients in Jordan during (2008-2012) 51
Part Five: 59
Pediatric ESRD 59
Part Six: 63
ESRD Mortality 63
Part seven: 65
ESRD patients among Non-Jordanians, 2012 65
References 68
12
List of Abbreviations
ESRD End Stage Renal Disease
MOH Ministry of Health
CDC Centers of Disease Control and Prevention
WHO World Health Organization
BRFSS Behavioral Risk Factors Surveillance System
NCD Noncommunicable disease
PHH Prince Hamza Hospital
DOS Department of Statistics (Jordan)
OR Odds ratios
BMI Body mass index
PS Private Sector
CKD Chronic Kidney Disease
GFR Glomerular Filtration Rate
RRT Renal Replacement Therapy
RMS Royal Medical Services
PPM Prevalence per Million Populations
ASIR Age Specific Incidence Rate
13
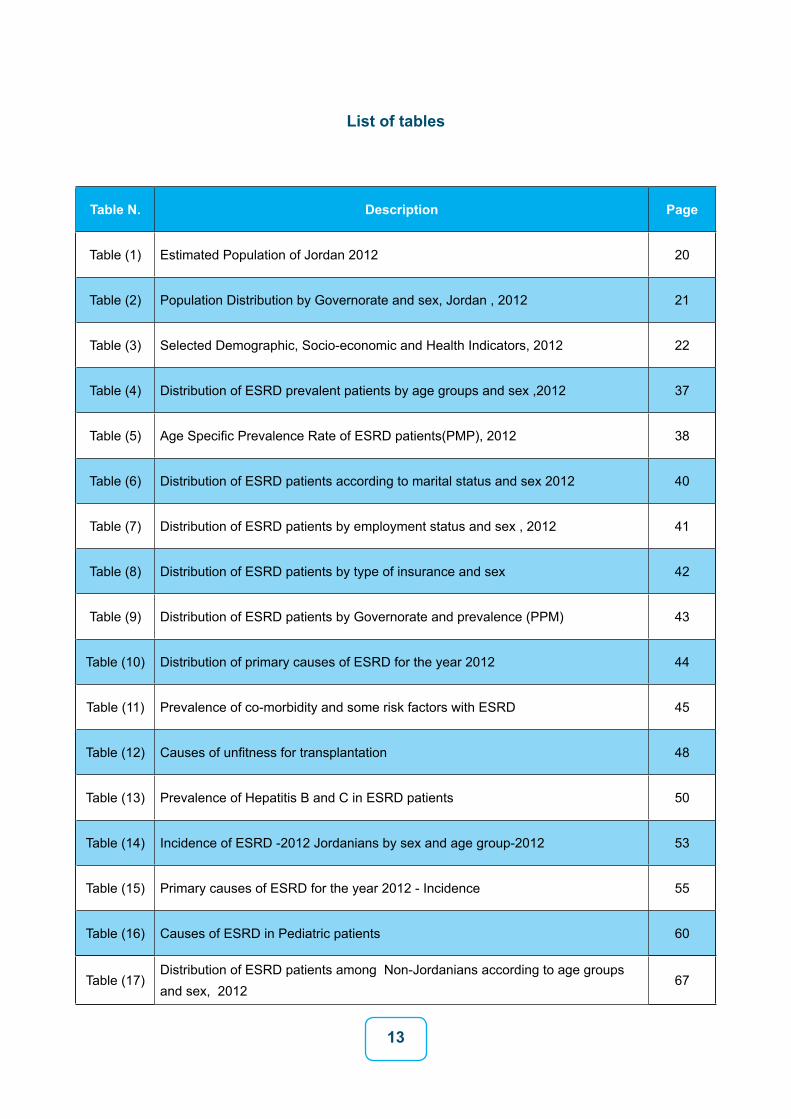
List of tables
Table N. Description Page
Table (1) Estimated Population of Jordan 2012 20
Table (2) Population Distribution by Governorate and sex, Jordan , 2012 21
Table (3) Selected Demographic, Socio-economic and Health Indicators, 2012 22
Table (4) Distribution of ESRD prevalent patients by age groups and sex ,2012 37
Table (5) Age Specific Prevalence Rate of ESRD patients(PMP), 2012 38
Table (6) Distribution of ESRD patients according to marital status and sex 2012 40
Table (7) Distribution of ESRD patients by employment status and sex , 2012 41
Table (8) Distribution of ESRD patients by type of insurance and sex 42
Table (9) Distribution of ESRD patients by Governorate and prevalence (PPM) 43
Table (10) Distribution of primary causes of ESRD for the year 2012 44
Table (11) Prevalence of co-morbidity and some risk factors with ESRD 45
Table (12) Causes of unfitness for transplantation 48
Table (13) Prevalence of Hepatitis B and C in ESRD patients 50
Table (14) Incidence of ESRD -2012 Jordanians by sex and age group-2012 53
Table (15) Primary causes of ESRD for the year 2012 - Incidence 55
Table (16) Causes of ESRD in Pediatric patients 60
Table (17)Distribution of ESRD patients among Non-Jordanians according to age groups and sex, 2012
67
14
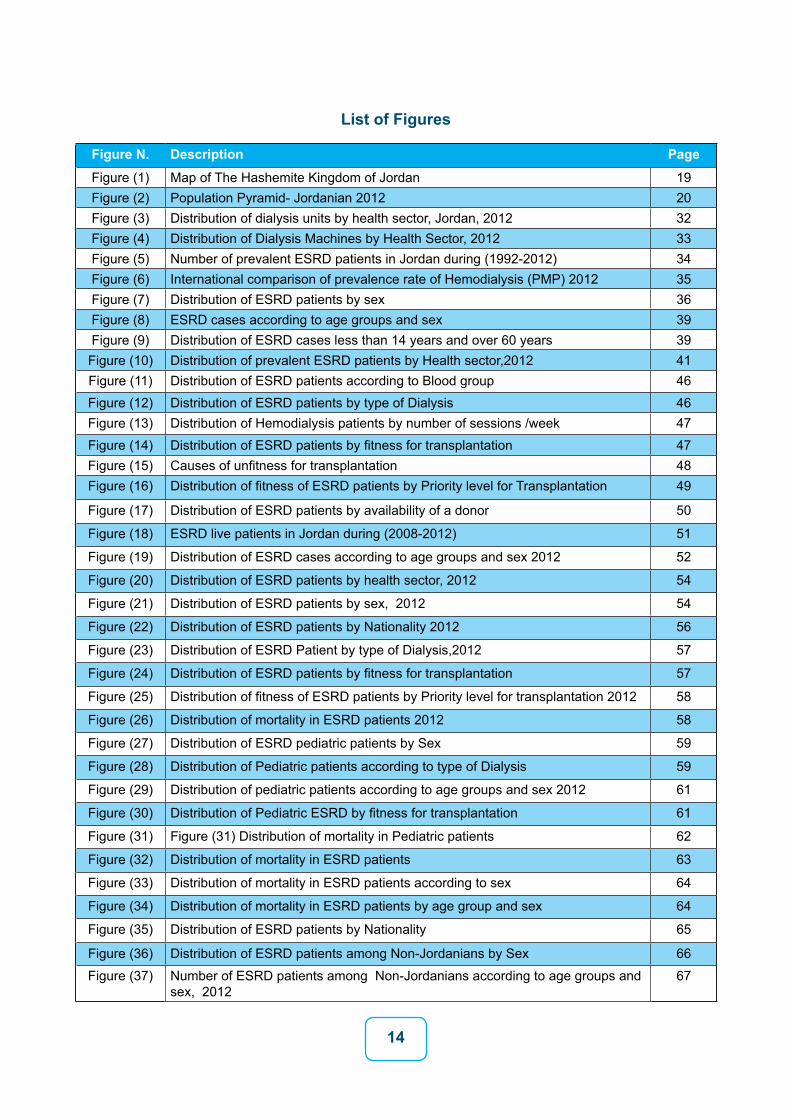
List of Figures
Figure N. Description Page
Figure (1) Map of The Hashemite Kingdom of Jordan 19Figure (2) Population Pyramid- Jordanian 2012 20Figure (3) Distribution of dialysis units by health sector, Jordan, 2012 32Figure (4) Distribution of Dialysis Machines by Health Sector, 2012 33Figure (5) Number of prevalent ESRD patients in Jordan during (1992-2012) 34Figure (6) International comparison of prevalence rate of Hemodialysis (PMP) 2012 35Figure (7) Distribution of ESRD patients by sex 36Figure (8) ESRD cases according to age groups and sex 39Figure (9) Distribution of ESRD cases less than 14 years and over 60 years 39
Figure (10) Distribution of prevalent ESRD patients by Health sector,2012 41Figure (11) Distribution of ESRD patients according to Blood group 46Figure (12) Distribution of ESRD patients by type of Dialysis 46Figure (13) Distribution of Hemodialysis patients by number of sessions /week 47Figure (14) Distribution of ESRD patients by fitness for transplantation 47Figure (15) Causes of unfitness for transplantation 48Figure (16) Distribution of fitness of ESRD patients by Priority level for Transplantation 49
Figure (17) Distribution of ESRD patients by availability of a donor 50
Figure (18) ESRD live patients in Jordan during (2008-2012) 51
Figure (19) Distribution of ESRD cases according to age groups and sex 2012 52
Figure (20) Distribution of ESRD patients by health sector, 2012 54
Figure (21) Distribution of ESRD patients by sex, 2012 54
Figure (22) Distribution of ESRD patients by Nationality 2012 56
Figure (23) Distribution of ESRD Patient by type of Dialysis,2012 57
Figure (24) Distribution of ESRD patients by fitness for transplantation 57
Figure (25) Distribution of fitness of ESRD patients by Priority level for transplantation 2012 58
Figure (26) Distribution of mortality in ESRD patients 2012 58
Figure (27) Distribution of ESRD pediatric patients by Sex 59
Figure (28) Distribution of Pediatric patients according to type of Dialysis 59
Figure (29) Distribution of pediatric patients according to age groups and sex 2012 61
Figure (30) Distribution of Pediatric ESRD by fitness for transplantation 61
Figure (31) Figure (31) Distribution of mortality in Pediatric patients 62
Figure (32) Distribution of mortality in ESRD patients 63
Figure (33) Distribution of mortality in ESRD patients according to sex 64
Figure (34) Distribution of mortality in ESRD patients by age group and sex 64
Figure (35) Distribution of ESRD patients by Nationality 65
Figure (36) Distribution of ESRD patients among Non-Jordanians by Sex 66
Figure (37) Number of ESRD patients among Non-Jordanians according to age groups and sex, 2012
67
15
Part one
Introduction
Geography
Population
Health Status
Jordan Renal Registry
Methodology

17
Part One
Introduction
ESRD remains one of the leading causes of morbidity and mortality in Jordan. As life ex-
pectancy increases in Jordan, the proportion of elderly population is expected to increase;
this will lead to higher prevalence of non-communicable diseases including renal diseases
that may lead eventually to ESRD, although chronic kidney disease sometimes results
from primary diseases of the kidneys themselves, diabetes and hypertension remained the
major causes of ESRD.
Chronic kidney disease could not be prevented in most circumstances, but screening and
control of chronic diseases mainly diabetes mellitus and hypertension will decrease the oc-
currence of renal complications of these diseases with resulting reduction of ESRD.
In the ESRD Registry we are collecting all data relevant for ESRD patients and create a
data base for the problem in Jordan, this enables us to determine the incidence, preva-
lence, epidemiologic characteristics of patients including age, sex, governorate; it also
enables us to determine mortality and burden of the disease in our country. The Registry
provides researchers and scientists with data that help in conducting further research on
ESRD, and present important data, figures and statistics for decision makers for the pro-
cess of planning and implementing preventive programs for ESRD.
With great pleasure we present our 5th annual ESRD report, including prevalence and
the incidence of ESRD in Jordan for the year 2012, reviewing the ongoing changes in the
ESRD Registry, using the data to give direction to renal-control planning and programs
in the fields of prevention, screening, treatment, and to monitor and evaluate the impact
of these programs. This report will help to understand the ESRD incidence in Jordan and
thus will enhance prevention and control efforts of the National Renal Registry Program.
The team involved in producing this report had made great efforts to present the
graphics and tables in a clear, very concise and user-friendly way hoping this will facilitate
their utilization and comprehension.
18
Geography
Jordan is located in the Middle East, between Latitudes 29-33 north and between
Longitudes 35-39 east, extending about 500 Kilometers from North to South, it is
bounded in the North by Syria, East by Iraq and Saudi Arabia, South also by Saudi Arabia and
West by Palestine Authority. The total surface area is 89318 Km2. ,75% is desert along the
Eastern part of the country. Mountains height ranged between 1100 – 1854 meters above
sea level. The Dead Sea area is the lowest area in the world and it is around 416 meter
below sea level.The climate of the country as a whole is moderate, there are four seasons. The
temperature ranged from 0°C in winter to 38°C in summer. Jordan is divided into three
regions (Middle, Northern and Southern) and twelve governorates.
Population
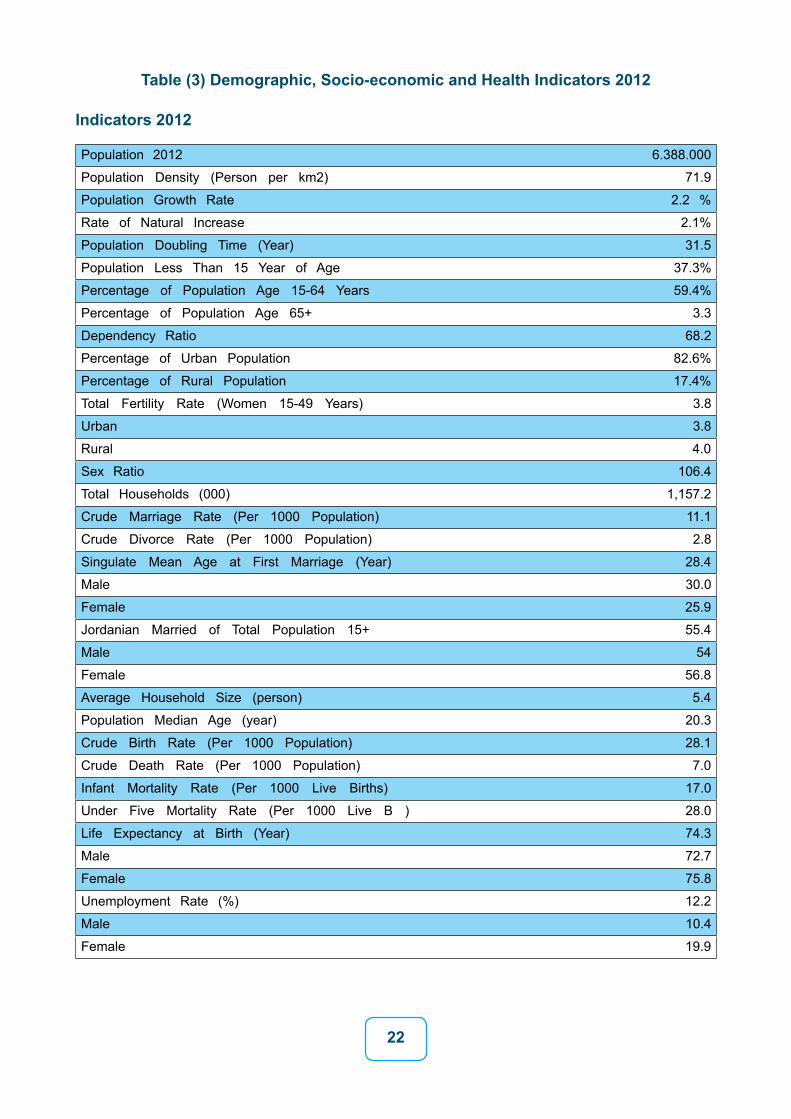
The estimated population of Jordan in mid-2012 was 6388000 millions. Including
3293000 males and 3095000 females (male: female ratio 1.1:1). (DOS, Jordan, 2012).
About 12.7% of the population were under the age of 5 years, 37.3% under the age of
15 years and 59.4% of the population at the age 15-64 years, only 3.31 % of the total
population above the age of 65(sex ratio of 1.01 male per 1 female in this age group).
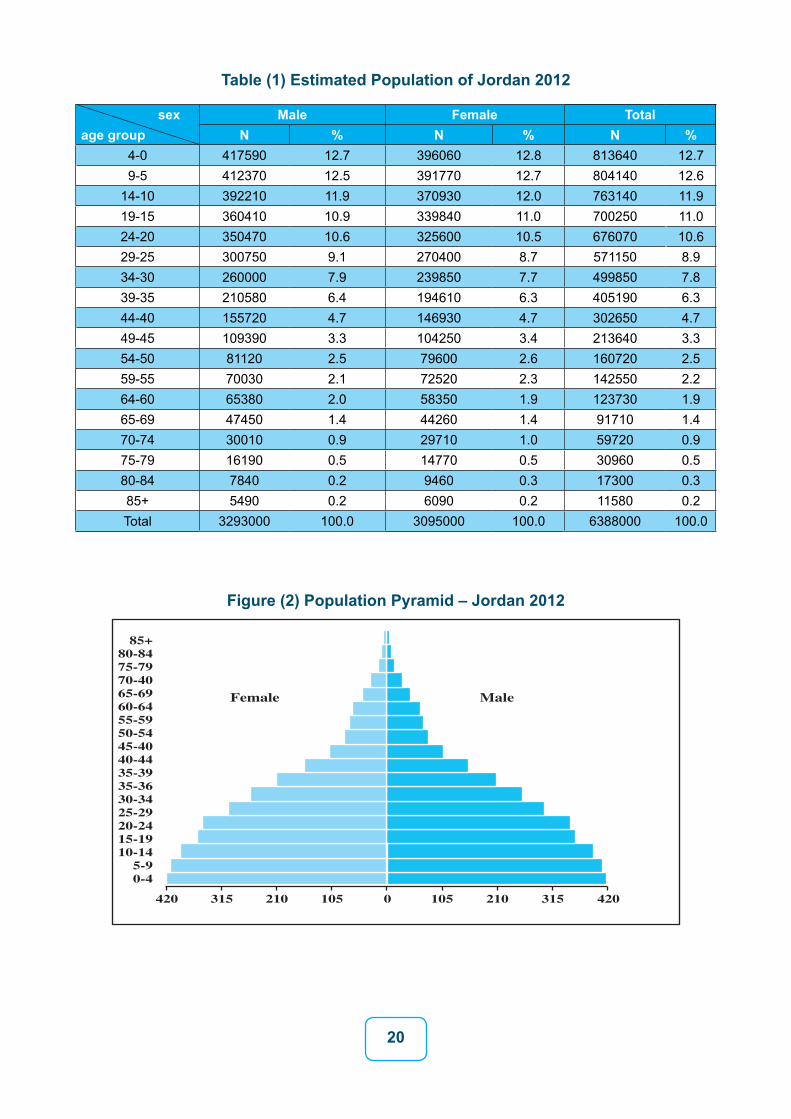
Table (1) and figure (2) show the age distribution of Jordan population, 2012 (Jordanian
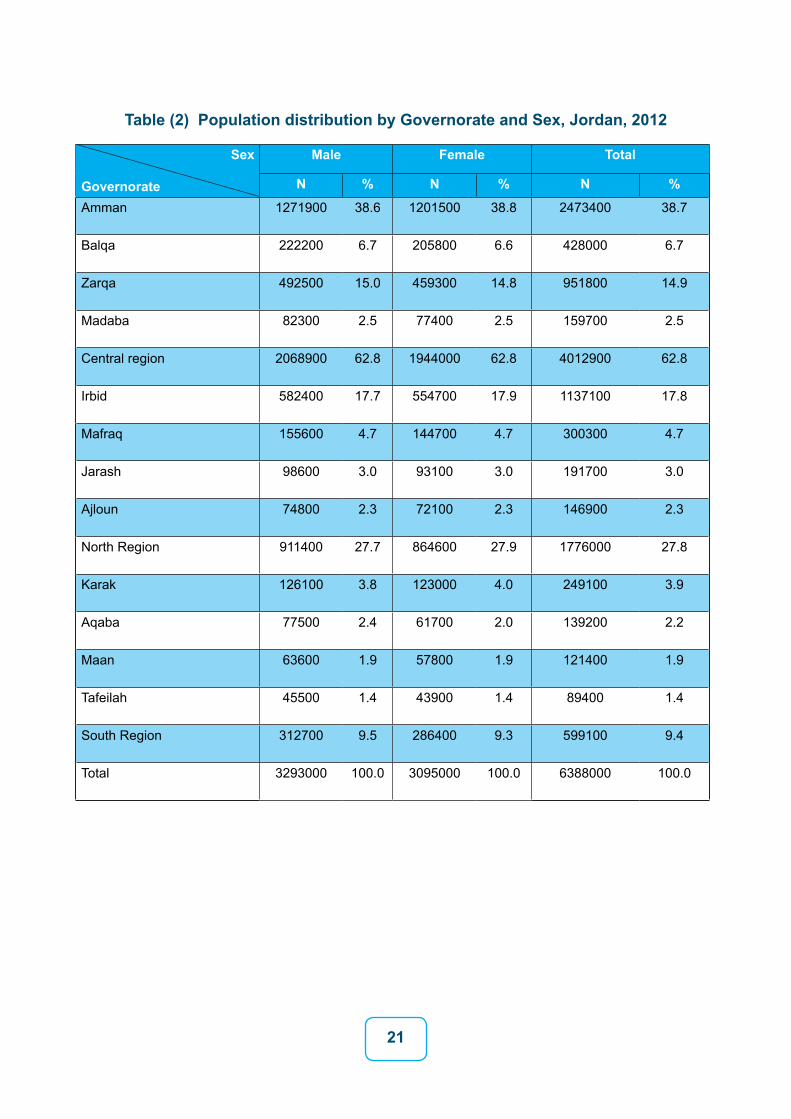
Population Pyramid ).Table (2) shows the population distribution by governorates and
gender, which is used to calculate incidence rates for different regions. Jordan divided into
three regions: each region consists of four governorates. The Central region (Amman,
Balqaa, Zarqa, and Madaba) constitutes about 62.8% of the total population withpopulation
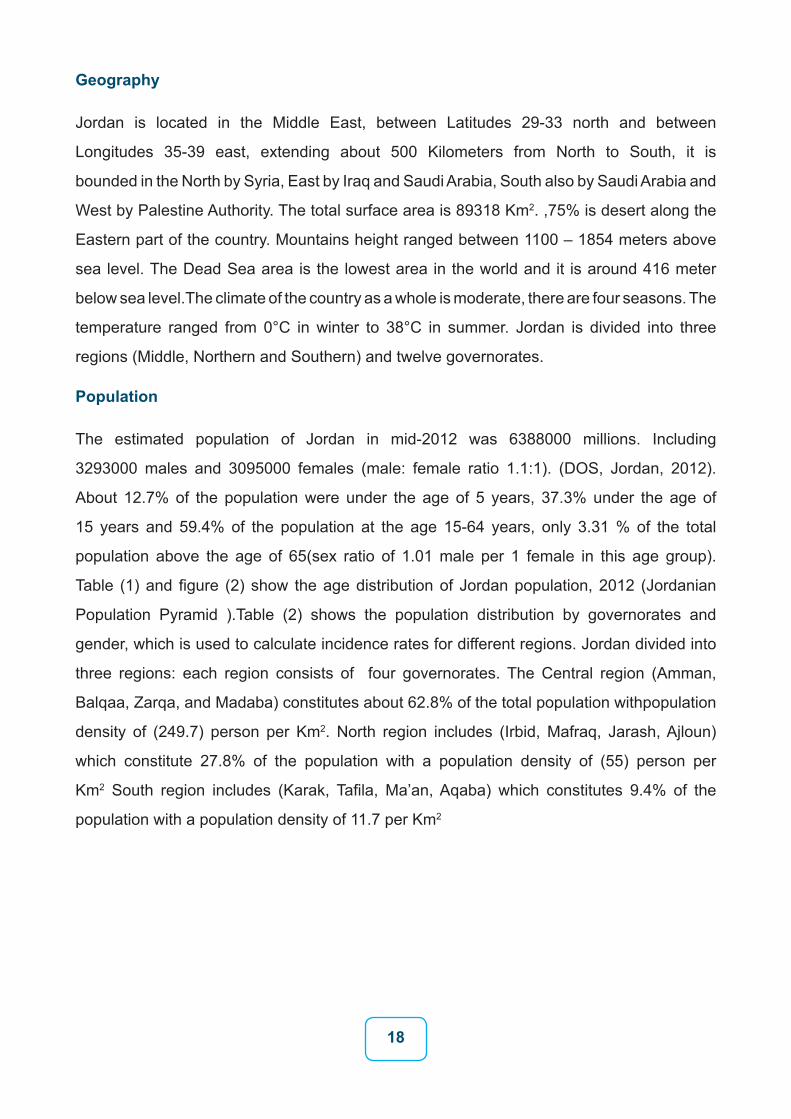
density of (249.7) person per Km2. North region includes (Irbid, Mafraq, Jarash, Ajloun)
which constitute 27.8% of the population with a population density of (55) person per
Km2 South region includes (Karak, Tafila, Ma’an, Aqaba) which constitutes 9.4% of the
population with a population density of 11.7 per Km2
19
Figure (1) Map of the Hashemite Kingdom of Jordan
20
Table (1) Estimated Population of Jordan 2012
sex age group
Male Female TotalN % N % N %
4-0 417590 12.7 396060 12.8 813640 12.79-5 412370 12.5 391770 12.7 804140 12.6
14-10 392210 11.9 370930 12.0 763140 11.919-15 360410 10.9 339840 11.0 700250 11.024-20 350470 10.6 325600 10.5 676070 10.629-25 300750 9.1 270400 8.7 571150 8.934-30 260000 7.9 239850 7.7 499850 7.839-35 210580 6.4 194610 6.3 405190 6.344-40 155720 4.7 146930 4.7 302650 4.749-45 109390 3.3 104250 3.4 213640 3.354-50 81120 2.5 79600 2.6 160720 2.559-55 70030 2.1 72520 2.3 142550 2.264-60 65380 2.0 58350 1.9 123730 1.965-69 47450 1.4 44260 1.4 91710 1.470-74 30010 0.9 29710 1.0 59720 0.975-79 16190 0.5 14770 0.5 30960 0.580-84 7840 0.2 9460 0.3 17300 0.385+ 5490 0.2 6090 0.2 11580 0.2Total 3293000 100.0 3095000 100.0 6388000 100.0
Figure (2) Population Pyramid – Jordan 2012
Female Male
85+80-8475-7970-4065-6960-6455-5950-5445-4040-4435-3935-3630-3425-2920-2415-1910-14
5-90-4
420 315 210 105 105 210 315 4200
21
Table (2) Population distribution by Governorate and Sex, Jordan, 2012
Sex
Governorate
Male Female Total
N % N % N %
Amman 1271900 38.6 1201500 38.8 2473400 38.7
Balqa 222200 6.7 205800 6.6 428000 6.7
Zarqa 492500 15.0 459300 14.8 951800 14.9
Madaba 82300 2.5 77400 2.5 159700 2.5
Central region 2068900 62.8 1944000 62.8 4012900 62.8
Irbid 582400 17.7 554700 17.9 1137100 17.8
Mafraq 155600 4.7 144700 4.7 300300 4.7
Jarash 98600 3.0 93100 3.0 191700 3.0
Ajloun 74800 2.3 72100 2.3 146900 2.3
North Region 911400 27.7 864600 27.9 1776000 27.8
Karak 126100 3.8 123000 4.0 249100 3.9
Aqaba 77500 2.4 61700 2.0 139200 2.2
Maan 63600 1.9 57800 1.9 121400 1.9
Tafeilah 45500 1.4 43900 1.4 89400 1.4
South Region 312700 9.5 286400 9.3 599100 9.4
Total 3293000 100.0 3095000 100.0 6388000 100.0
22
Table (3) Demographic, Socio-economic and Health Indicators 2012
Indicators 2012
Population 2012 6.388.000
Population Density (Person per km2) 71.9
Population Growth Rate 2.2 %
Rate of Natural Increase 2.1%
Population Doubling Time (Year) 31.5
Population Less Than 15 Year of Age 37.3%
Percentage of Population Age 15-64 Years 59.4%
Percentage of Population Age 65+ 3.3
Dependency Ratio 68.2
Percentage of Urban Population 82.6%
Percentage of Rural Population 17.4%
Total Fertility Rate (Women 15-49 Years) 3.8
Urban 3.8
Rural 4.0
Sex Ratio 106.4
Total Households (000) 1,157.2
Crude Marriage Rate (Per 1000 Population) 11.1
Crude Divorce Rate (Per 1000 Population) 2.8
Singulate Mean Age at First Marriage (Year) 28.4
Male 30.0
Female 25.9
Jordanian Married of Total Population 15+ 55.4
Male 54
Female 56.8
Average Household Size (person) 5.4
Population Median Age (year) 20.3
Crude Birth Rate (Per 1000 Population) 28.1
Crude Death Rate (Per 1000 Population) 7.0
Infant Mortality Rate (Per 1000 Live Births) 17.0
Under Five Mortality Rate (Per 1000 Live B ) 28.0
Life Expectancy at Birth (Year) 74.3
Male 72.7
Female 75.8
Unemployment Rate (%) 12.2
Male 10.4
Female 19.9
23
Health Status
Morbidity Data
Jordan is witnessing an epidemiologic transition, which is characterized by rapid decline in
mortality from infectious diseases coupled with an increase of non-communicable diseases
(NCDs). Unhealthy diet, Physical inactivity, obesity and smoking are major determinants
of NCDs and represent major risk factors for the development of cardiovascular diseases,
cancer and diabetes. According to epidemiologic surveys / Behavioral Risk Factors
Surveillance survey (BRFSS) which have been conducted by Ministry of Health over the
last few years; 2002, 2004 and 2007 among those aged 18 years and above revealed that
determinants and levels of risk factors for NCDs are rising.
The Behavioral Risk Factor Surveillance Survey, 2007 showed the following:
Diabetes represent major health problems; reported to affect more than 16% of adults,
impaired glucose tolerance (IGT) was found in an additional 24%, bringing the total
prevalence of glucose tolerance abnormalities to over 40 % for 18 years and above.
- The prevalence rate of hypertension was 25.6 %
- The prevalence rate of hypercholesterolemia was 36 %
- The prevalence rate of HDL-C (low level) was 33.8 %
- The prevalence rate of high LDL-C was 24.2 %
-The prevalence rate of high Triglyceride was 48.8 %
- The prevalence of overweight was 30.5%, (BMI 25-29.9 Kg/m2) and the prevalence of
obesity was 35.9 %,( BMI 30 Kg/m2 and more)
- Smoking is a major problem, with more than 49.6% of adult men and 5.7% of women
smoking regularly.
The last 15th annual report for the year 2010, JCR registered 6820 cancer cases, of these
4921 (72.2%) were among Jordanians and 1899 (27.8%) were among non-Jordanians.
24
The crude incidence rate of all cancers among Jordanians was 79.4 per 100,000 popula-
tions (74.0 for males and 85.1 for females). The male to female ratio was 0.92: 1.
The leading types of cancers among Jordanian in 2010 were as follows: most common
cancers in both sexes : Breast 978 cases (19.8% of total cases), colorectal 558 (11.9%),
lymphoma 382(7.9%), lung 3.79(7.8%); leukemia 218 (4.5%), prostate 218(4.5%), urinary
bladder 209 (4.3%), thyroid 175 (3.6%), central nervous system (CNS) 168 (3.5%) and
stomach 152 (3.1%).
Mortality data
It provides information on annual death rates of a population. It also provides information
on specific diseases in terms of clinical and public health perspectives. Major achievements
have been made during the last several decades. The Infant Mortality Rate (IMR) fell from
135 in 1960 to 17 deaths per 1,000 live births in 2012. This impressive decline occurred as a
result of focused maternal and child health activities, increased vaccination coverage rates,
improvements in education, birth spacing, sanitation and access to safe drinking water and
improvement of general conditions.
By law, all deaths must be registered in Jordan. However, registration is not universal and
death certification by cause is not completely accurate. According to Jordan Mortality Data in
2010, cardiovascular diseases accounted for about 36.6 % of deaths for both sexes. Cancer
was the second leading cause of death accounting for 15.6 % of total deaths, while injuries
were the third leading cause responsible for 9.7 % of total deaths.
While disease of genitourinary system constitute about 2.5% total death, 91% of them were
due to renal failure (acute and chronic renal failure) according to mortality report in 2010 is
369 patients.
25
When it is right, no one remembers.
But when it fails, all have to remember”
It is described as a small- sized, light-weighted, bean- shaped but a smart organ. Some
consider it as the secretary of the body as it deals with each inbox and outbox in the body.
Its dysfunction may affect the functions of other organs and systems. It may be affected
by dysfunctions of other organs and systems. When it fails, whether acutely or chronically,
this may manifest as multiple signs and symptoms relating to multiple systems in the body.
So the patient of kidney failure is considered as all patients in one. As a consequence, the
Nephrologists must also be all physicians in one.In the past Stewart Cameron said,” for
those who have chosen a career in Nephrology there can be no better basic moto than to
strive to be a person with some technical skill, a broad spectrum of scientific knowledge,
and with those personal characteristics of warmth and humanity that serve to cement the
science of medicine to the art of medicine.
Kidneys are the first and so far the only organs whose function can be replaced by a
machine. Kidney Failure can be acute, called Acute Kidney Injury (AKI) or chronic, called
Chronic Kidney Disease (CKD).When patients of Chronic Kidney Disease (CKD) have
reached stage 4 CKD i.e. Glomerular Filtration Rate (GFR) < 30 ml /min / 1.73 m2, ideally
they are under a Nephrologist care. Stage 5 CKD i.e. GFR is < 15ml/min /1.73 m2, is called
dialysis stage. Renal Replacement Therapy “RRT” means of dialysis and transplantation.
Worldwide, the machine of dialysis had served millions of ESRD patients.
26
Jordan Renal Registry
Historical development of Nephrology and dialysis
1840-Pierre Priory defined uremia
1861-Thomas Graham coined the term dialysis for the first time
1913- John Abel invented first dialysis apparatus, first animal dialysis was done.
1928- George Has –first human dialysis was done.
1943-Dr.Willem Kolff introduced Kolff rotating drum dialyzers.
1948-Waters and Beall –first successful human dialysis.
1950- Introduction of dialysis into clinical practice.
The subsequent successful development of a technique to create an adequate arterio
venous fistula in 1972 permitted the rapid growth of dialysis programs. Equipment has
been developed to faster home-care hemodialysis and chronic ambulatory peritoneal
dialysis. Technical advances in hemodialysis followed the use of bicarbonate dialysate, more
biocompatible membranes, membranes of higher porosity and ultra filtration.The
numbers of patients reaching to ESRD continue to increase annually, and this situation is
leading to challenge to the existing system of RRT. Causes of ESRD are multiple; the mos
common ones are diabetes mellitus and hypertension. Unless some form of RRT is available,
ESRD is eventually fatal. Mortality in patient with ESRD is high. However, the cost of RRT
represents a great social burden, due to the evolving health care environment, growing
elderly population, renewing and innovating healthcare technologies, increasing
expectations of the population and the dilemma of economic constraints. There should
always be a balance between the three key factors of a health care system: access to
healthcare, quality of health care and the cost.
In conclusion, ESRD is a growing disease all over the world, it is caused by many etiologies,
diagnosed by physicians, and must be cared by the Nephrologists.
27
Status of “Renal Replacement Therapy” in Jordan
Proudly speaking, Jordan is one of the first countries in the Middle East that early
started programs of dialysis and kidney transplantation. There are many renal dialysis units
all over the country, belonging to Ministry of Health, Royal Medical Services, University
hospitals and Private Sector. In addition, there are many kidney transplant centers in all sectors
dealing with the best medical care.
Jordan has approved to be one of the pioneer countries in Nephrology and its modalities.
Jordan achieved many in the field of nephrology like:
1968-the first dialysis was done at the Military Hospital “the Main Hospital” in Marka
area – Amman.
- The first dialysis machine used in Jordan was”TRAVENOL” machine type.
- The first kidney transplantation in Jordan was done on 18/05/1972 at the same
mainMilitary Hospital. It was the first to be done in the Middle East.
1981- The establishment of renal dialysis unit at Jordan university Hospital. The machine
type was REDY “Sorb system”. It was portable, moving to Khaldi and Islamic Hospitals.
1982- The first renal dialysis Unit was established in private sector, it was at Al-Khaldi Hos-
pital.
1984- The first kidney transplantation was done in private sector at Islamic Hospital, then at
Al- Khaldi Hospital.
2009- The first kidney transplantation in Jordanian public hospital was done at Prince
Hamza Hospital in October 2009 according to The Jordanian National Program Of Renal
Transplantation of the JMOH.
28
So dialysis was introduced in Jordan in 1968. Ever since, there has been a continuous
expansion of the dialysis centers in terms of the geographic coverage and capacity. The
economic prosperity helped building the services all over the country.
Modern hemodialysis machines were installed in the vast majority of units, which allowed
for the performance of bicarbonate dialysis, controlled ultrafiltration, and sodium profile
modeling. Also a wider choice of biocompatible dialyzers has become available during the
last few years.
Recently, there has been an emerging concern about the projection of the increasing
number of patients on dialysis and the future cost. Therefore, close observation of the
development of dialysis has been a demand of the Jordan center for organ transplantation.
preparing annual reports about all the modalities of RRT has become a demand activity.
National ESRD Registry, which is based on center and patient forms, is a useful tool
to assess the quality of dialysis services and activities used to improve the adequacy of
hemodialysis.
Jordan has had a growing number of persons developing CKD leading to ESRD. It is
important to have a national registry in order to define the cause of ESRD, and to be able to
perform (Inter) National comparisons in renal epidemiology.
Such a registry will monitor the causes, incidence, and prevalence of ESRD and any
emerging trend.
A national ESRD registry will allow the determination of the burden of disease as well as
planning and policy formulation in the health care sector.
29
National Registry of End Stage Renal Disease:
The National Registry of End Stage Renal Disease was created in May 3 rd, 2007
under the jurisdiction of the Ministry of Health by the order of his Excellency the Minister of
Health.
Objectives of the National Registry of End Stage Renal Disease:
• Establish a national database system about patients of ESRD.
• Determine the burden of that disease, on country basis.
• Determine governmental payment on dialysis.
• Provide data about patients and their suitability to be transplanted, on a basis
of priority.
• Stimulate beginning studies and researches about that disease.
• Improve facilities of diagnosis and treatment for those patients. Moreover,
train those dialysis technicians and national registry employees.
Action plan of National Registry of End Stage Renal Disease:
* Prepare special form for the notification of ESRD from all hospital and up
dated annually (annex).
* Training workshops for all focal point working in dialysis units about how to fill
this form and how and when to send it to the national registry through either
passive or active method of surveillance.
* Good Communication with all dialysis units in the hospitals from all sectors to
complete and improve documentation in this form.
* Collection of all data about ESRD patients and all renal dialysis units in
Jordan, through filling the prepared forms by dialysis technicians and
attending Nephrologists.
* Enter data about those patients and dialysis units into a computerized
software program.
* Analysis of the data, reporting the results and then delivering it to specialized
people to stratify and build special schedules about the of ESRD.
30
Methodology:
The National Registry of End Stage Renal Disease was created in 2007 and supported
by the Ministry of Health. It is a database-system that collects data and information about
almost all patients undergoing Renal Replacement Therapy (RRT), i.e. either dialysis
(hemodialysis and peritoneal dialysis) or Kidney transplantation.
This is the fifth national ESRD Registry report. Data were received from all (75) dialysis
units in Jordan. It is assumed that those undergoing treatment in these units are represent
the number of all ESRD cases , because all cases are treated on the expense of the
government and even the patients undergoing home peritoneal dialysis.
Data regarding ESRD patients who are receiving long term (RRT) during 2012 were
collected from all dialysis units in the hospitals and then analyzed using special software
statistical methods .
Two questionnaires (forms) for data collection from hospitals for based on literature review
and modified to be suitable for Jordan’s circumstances are used for data collection. The
first one is for the dialysis units: including number of beds, type of insurance of patient,
nationality (Annex).
The second form is for the patients. which include demographic, clinical data, source of
treating facility, follow up data and vital status of the patients and entered on special
software (Annex). Patients who did not use (RRT) and those who only received urgent
dialysis or died shortly afterwards (less than 90 days) were not included in the report
31
Methods of Data Collection:
Data was collected from all renal dialysis units in Jordan, through the following methods:
Two types of data collection were applied:
1- Passive Data Collection: in this system forms filled by dialysis unites technicians
and send to national renal registry - MOH/NCDs Directorate.
2- Active Data Collection: In this system the head of Renal Registry Unit visited the
dialysis units and fills the forms on the unit and complete all the variables from
medical record of those patients. This to ensure more complete and accurate data
All forms were reviewed at the Renal Registry Unit and filtered and checked for any
duplication and also document follow up data if the patient still alive or dead cause of death
date of last dialysis .
Data entered to special software designed for data of renal patients, Data analysis was
done by using statistical package for the social sciences SPSS version 17.0.
Incidence and prevalence calculations in this report are based on the estimation of the na-
tional population by Department of Statistics (DOS) 2012.
32
Part Two
Dialysis Units in Jordan
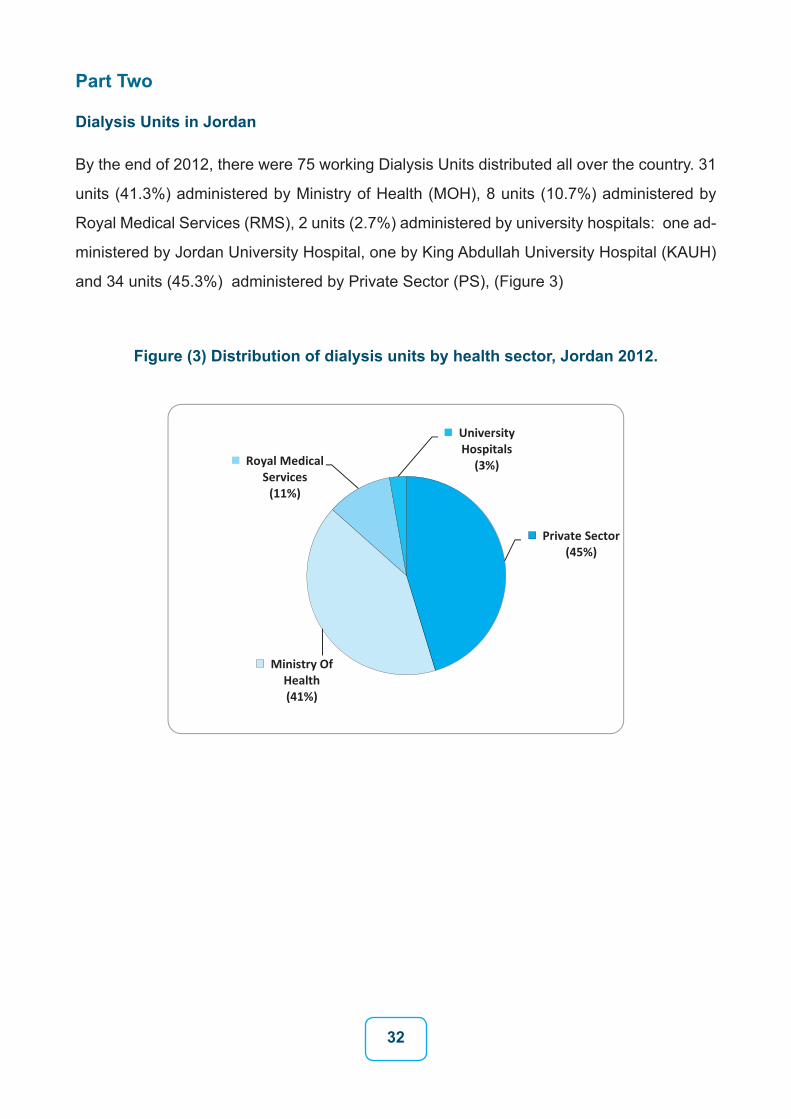
By the end of 2012, there were 75 working Dialysis Units distributed all over the country. 31
units (41.3%) administered by Ministry of Health (MOH), 8 units (10.7%) administered by
Royal Medical Services (RMS), 2 units (2.7%) administered by university hospitals: one ad-
ministered by Jordan University Hospital, one by King Abdullah University Hospital (KAUH)
and 34 units (45.3%) administered by Private Sector (PS), (Figure 3)
Figure (3) Distribution of dialysis units by health sector, Jordan 2012.
33
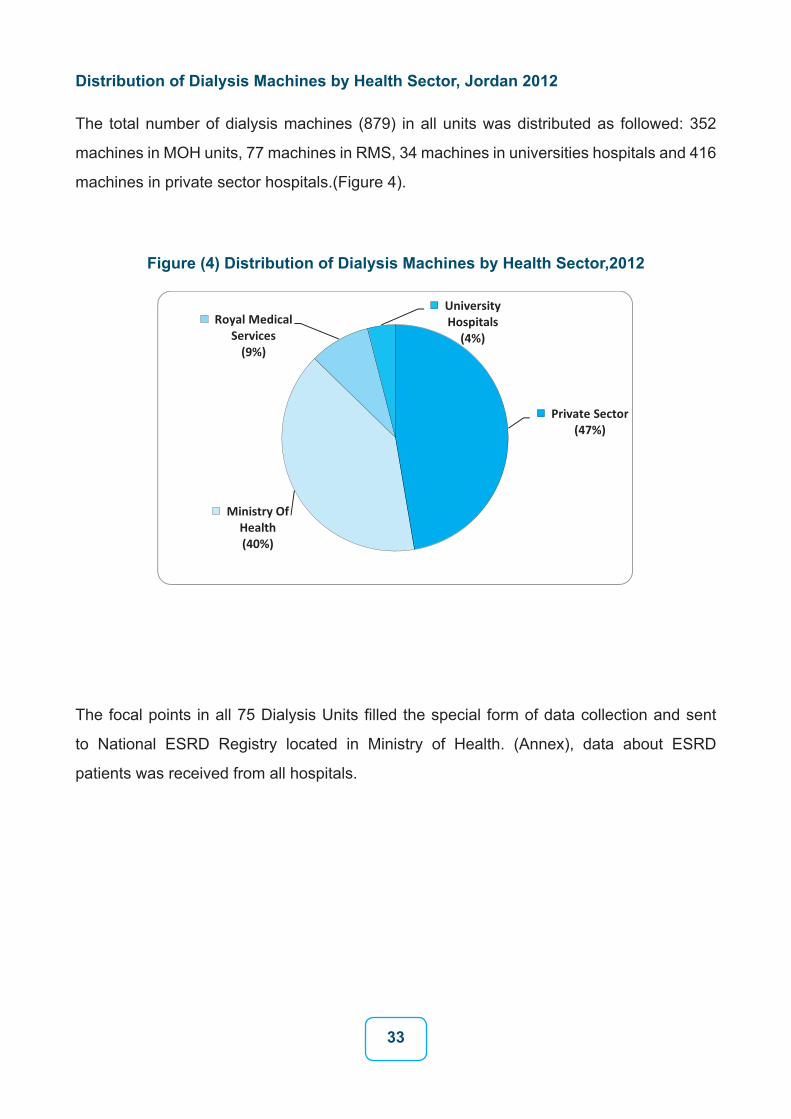
Distribution of Dialysis Machines by Health Sector, Jordan 2012
The total number of dialysis machines (879) in all units was distributed as followed: 352
machines in MOH units, 77 machines in RMS, 34 machines in universities hospitals and 416
machines in private sector hospitals.(Figure 4).
Figure (4) Distribution of Dialysis Machines by Health Sector,2012
The focal points in all 75 Dialysis Units filled the special form of data collection and sent
to National ESRD Registry located in Ministry of Health. (Annex), data about ESRD
patients was received from all hospitals.
34
Part three
ESRD patients in Jordan
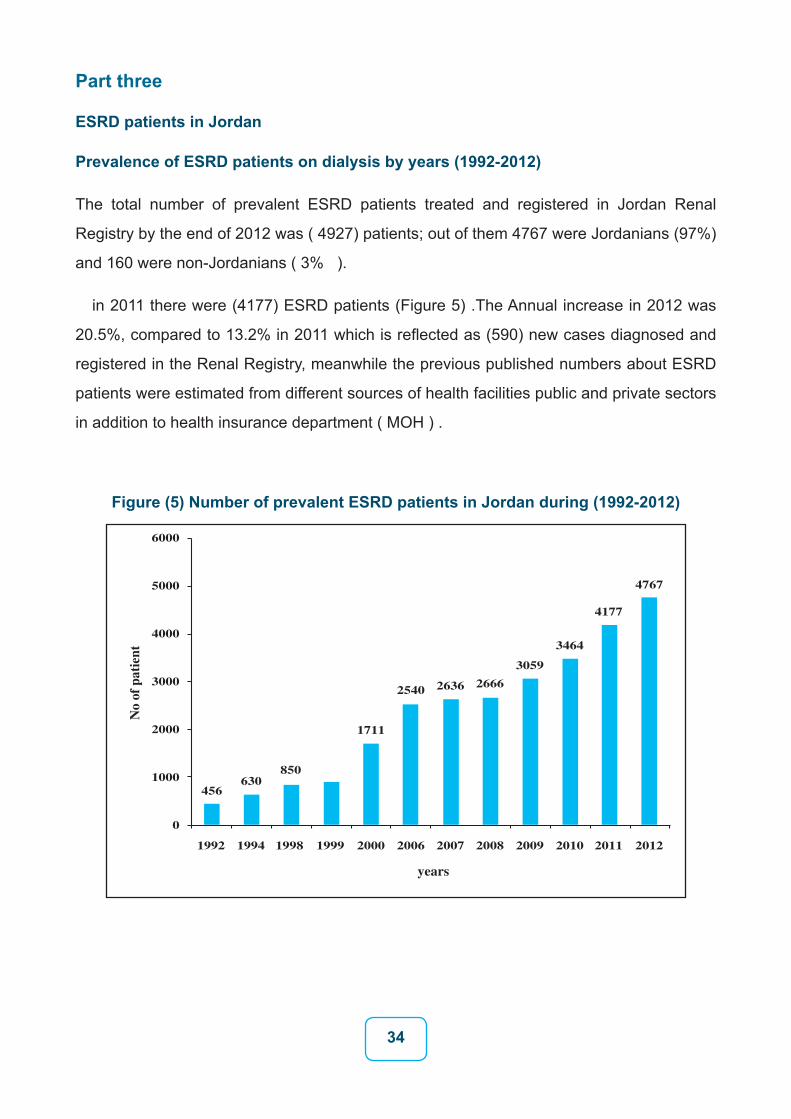
Prevalence of ESRD patients on dialysis by years (1992-2012)
The total number of prevalent ESRD patients treated and registered in Jordan Renal
Registry by the end of 2012 was ( 4927) patients; out of them 4767 were Jordanians (97%)
and 160 were non-Jordanians ( 3% ).
in 2011 there were (4177) ESRD patients (Figure 5) .The Annual increase in 2012 was
20.5%, compared to 13.2% in 2011 which is reflected as (590) new cases diagnosed and
registered in the Renal Registry, meanwhile the previous published numbers about ESRD
patients were estimated from different sources of health facilities public and private sectors
in addition to health insurance department ( MOH ) .
Figure (5) Number of prevalent ESRD patients in Jordan during (1992-2012)
6000
5000
4000
3000
2000
1000
0
1992
456630
850
1711
2540 2636 2666
3059
3464
4177
4767
1994 1998 1999 2000 2006 2007 2008 2009 2010 2011 2012
years
No
of p
atie
nt
35
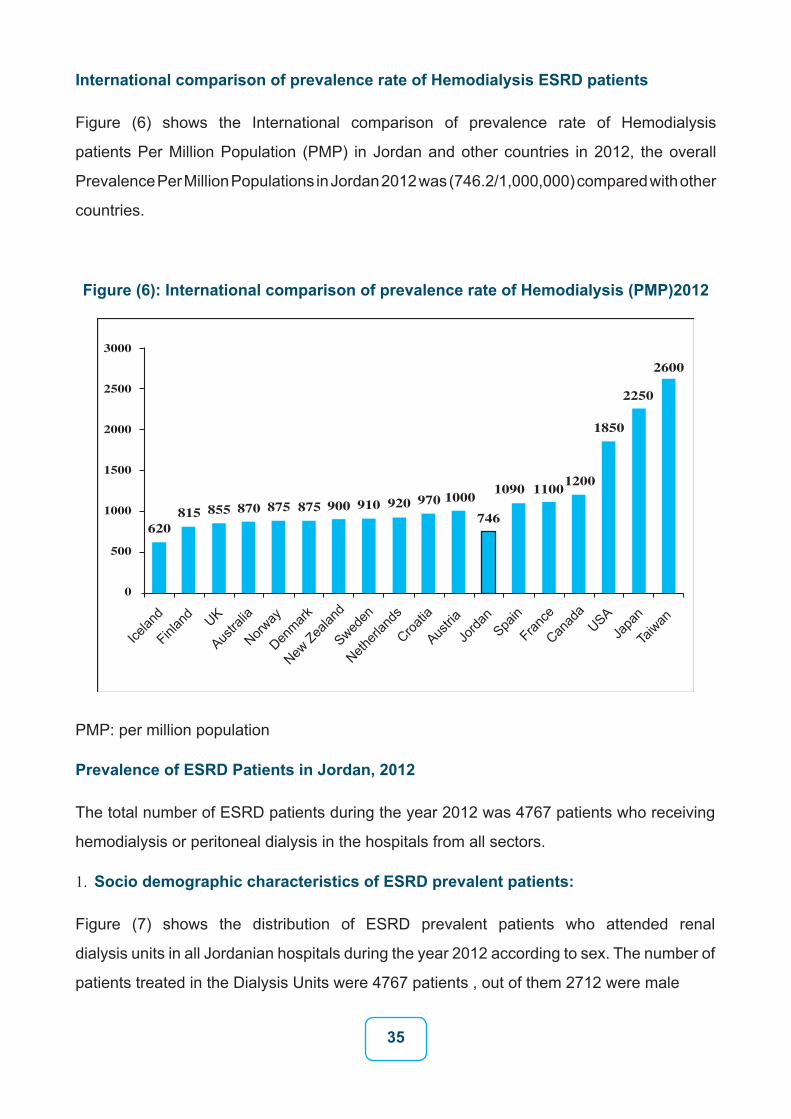
International comparison of prevalence rate of Hemodialysis ESRD patients
Figure (6) shows the International comparison of prevalence rate of Hemodialysis
patients Per Million Population (PMP) in Jordan and other countries in 2012, the overall
Prevalence Per Million Populations in Jordan 2012 was (746.2/1,000,000) compared with other
countries.
Figure (6): International comparison of prevalence rate of Hemodialysis (PMP)2012
3000
2500
2000
1500
1000
500
0
620815 855 870 875 875 900 910 920 970 1000
746
1090 11001200
1850
2250
2600
Icelan
d
Finlan
d
Austra
lia
Norway
Denmark
New Zea
land
Sweden
Netherl
ands
Croatia
Austria
Jorda
nSpa
in
France
Canad
aUSA
Japa
n
TaiwanUK
PMP: per million population
Prevalence of ESRD Patients in Jordan, 2012
The total number of ESRD patients during the year 2012 was 4767 patients who receiving
hemodialysis or peritoneal dialysis in the hospitals from all sectors.
1. Socio demographic characteristics of ESRD prevalent patients:
Figure (7) shows the distribution of ESRD prevalent patients who attended renal
dialysis units in all Jordanian hospitals during the year 2012 according to sex. The number of
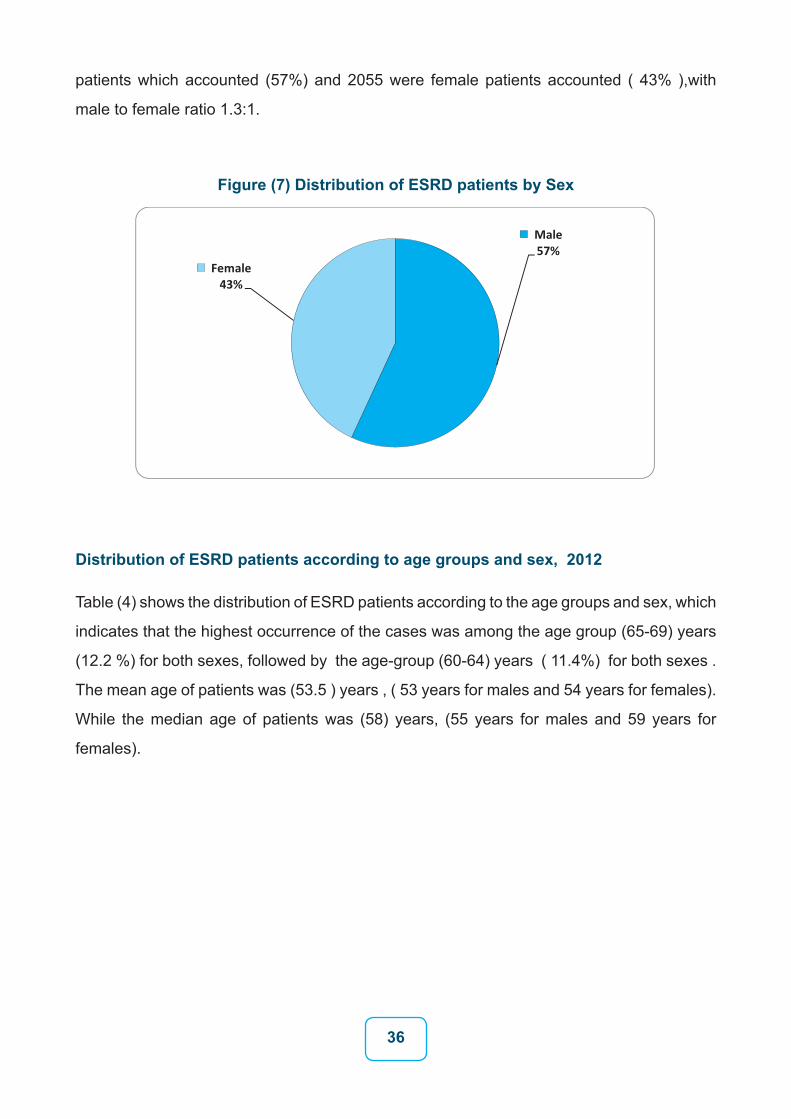
patients treated in the Dialysis Units were 4767 patients , out of them 2712 were male
36
patients which accounted (57%) and 2055 were female patients accounted ( 43% ),with
male to female ratio 1.3:1.
Figure (7) Distribution of ESRD patients by Sex
Distribution of ESRD patients according to age groups and sex, 2012
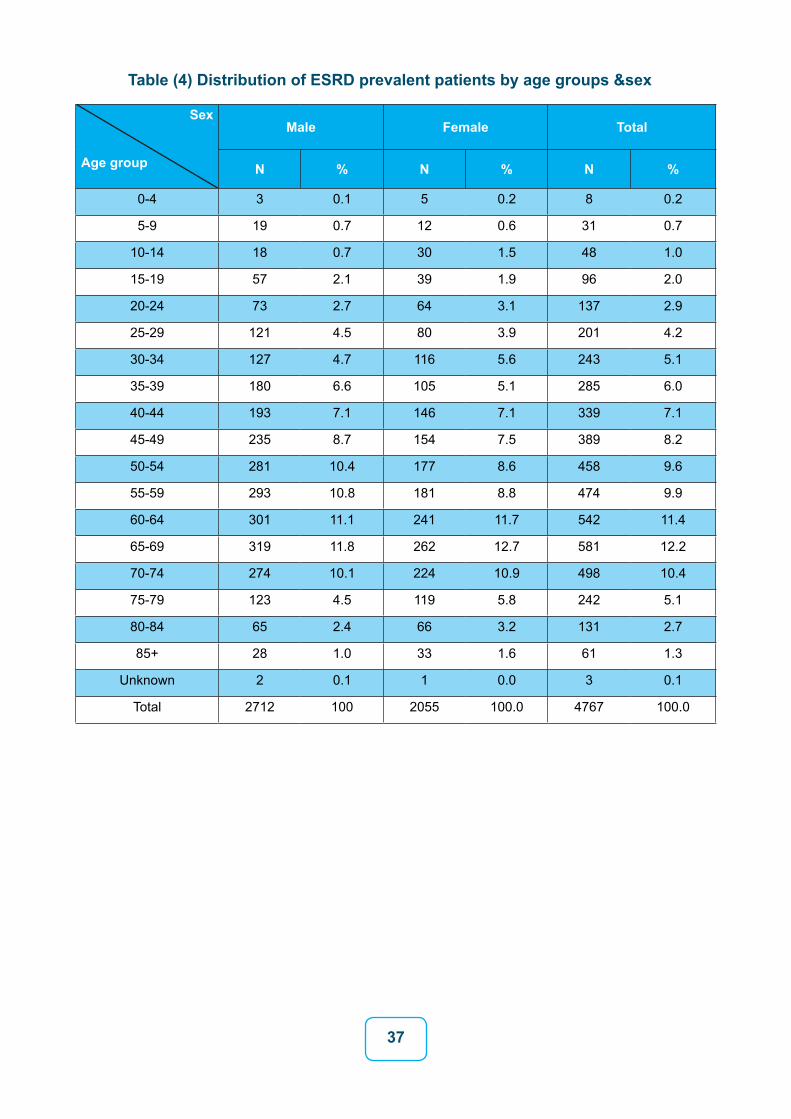
Table (4) shows the distribution of ESRD patients according to the age groups and sex, which
indicates that the highest occurrence of the cases was among the age group (65-69) years
(12.2 %) for both sexes, followed by the age-group (60-64) years ( 11.4%) for both sexes .
The mean age of patients was (53.5 ) years , ( 53 years for males and 54 years for females).
While the median age of patients was (58) years, (55 years for males and 59 years for
females).
37
Table (4) Distribution of ESRD prevalent patients by age groups &sex
Sex
Age group
Male Female Total
N % N % N %
0-4 3 0.1 5 0.2 8 0.2
5-9 19 0.7 12 0.6 31 0.7
10-14 18 0.7 30 1.5 48 1.0
15-19 57 2.1 39 1.9 96 2.0
20-24 73 2.7 64 3.1 137 2.9
25-29 121 4.5 80 3.9 201 4.2
30-34 127 4.7 116 5.6 243 5.1
35-39 180 6.6 105 5.1 285 6.0
40-44 193 7.1 146 7.1 339 7.1
45-49 235 8.7 154 7.5 389 8.2
50-54 281 10.4 177 8.6 458 9.6
55-59 293 10.8 181 8.8 474 9.9
60-64 301 11.1 241 11.7 542 11.4
65-69 319 11.8 262 12.7 581 12.2
70-74 274 10.1 224 10.9 498 10.4
75-79 123 4.5 119 5.8 242 5.1
80-84 65 2.4 66 3.2 131 2.7
85+ 28 1.0 33 1.6 61 1.3
Unknown 2 0.1 1 0.0 3 0.1
Total 2712 100 2055 100.0 4767 100.0
38
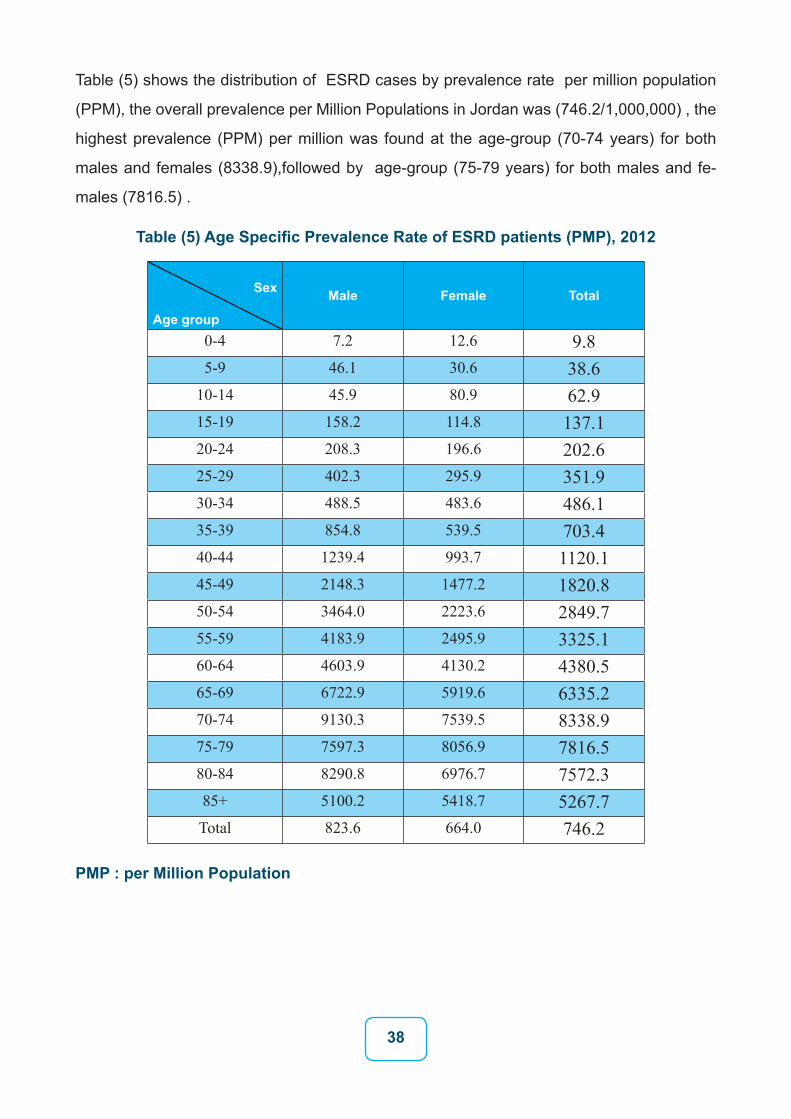
Table (5) shows the distribution of ESRD cases by prevalence rate per million population
(PPM), the overall prevalence per Million Populations in Jordan was (746.2/1,000,000) , the
highest prevalence (PPM) per million was found at the age-group (70-74 years) for both
males and females (8338.9),followed by age-group (75-79 years) for both males and fe-
males (7816.5) .
Table (5) Age Specific Prevalence Rate of ESRD patients (PMP), 2012
Sex
Age group
Male Female Total
0-4 7.2 12.6 9.85-9 46.1 30.6 38.6
10-14 45.9 80.9 62.915-19 158.2 114.8 137.120-24 208.3 196.6 202.625-29 402.3 295.9 351.930-34 488.5 483.6 486.135-39 854.8 539.5 703.440-44 1239.4 993.7 1120.145-49 2148.3 1477.2 1820.850-54 3464.0 2223.6 2849.755-59 4183.9 2495.9 3325.160-64 4603.9 4130.2 4380.565-69 6722.9 5919.6 6335.270-74 9130.3 7539.5 8338.975-79 7597.3 8056.9 7816.580-84 8290.8 6976.7 7572.385+ 5100.2 5418.7 5267.7Total 823.6 664.0 746.2
PMP : per Million Population
39
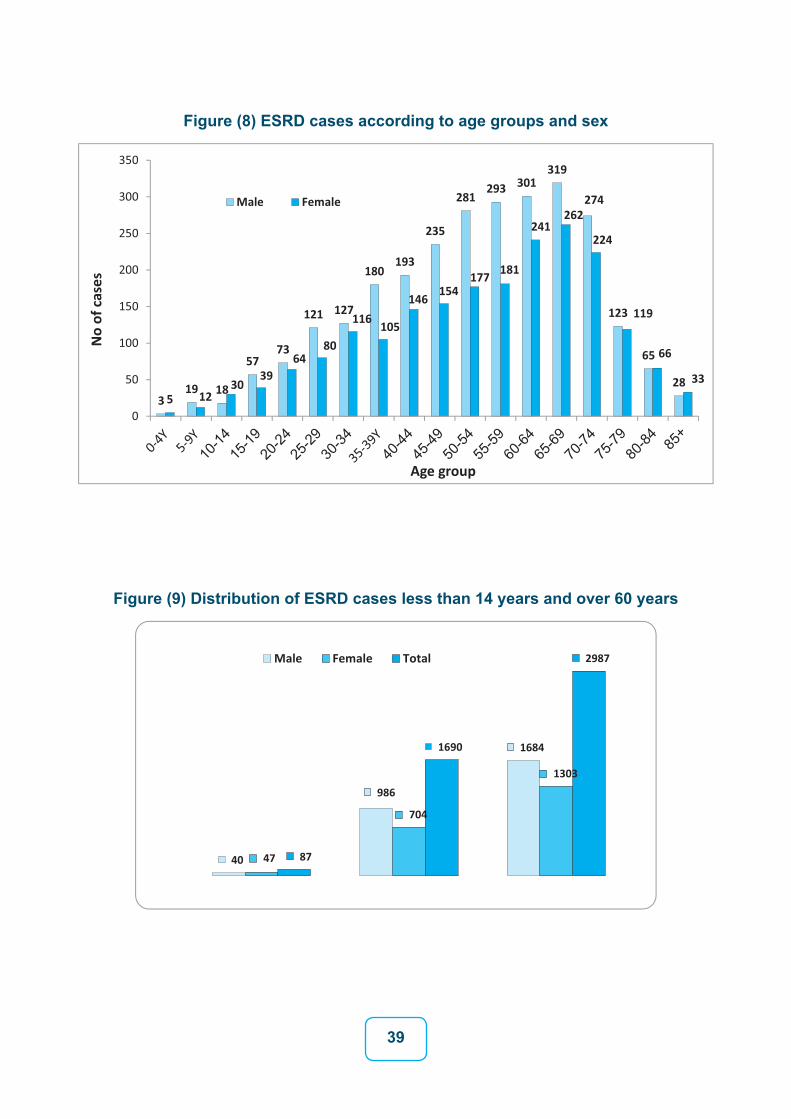
Figure (8) ESRD cases according to age groups and sex
Figure (9) Distribution of ESRD cases less than 14 years and over 60 years
40
Distribution of ESRD patients according to marital status and sex
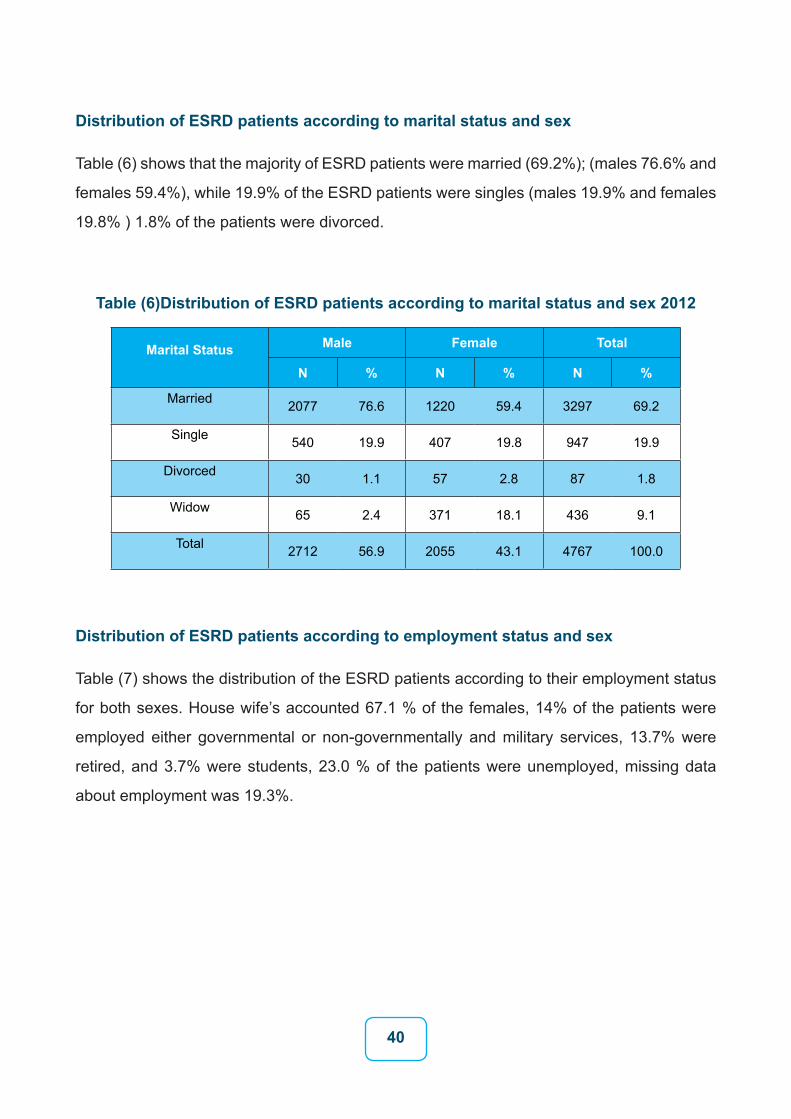
Table (6) shows that the majority of ESRD patients were married (69.2%); (males 76.6% and
females 59.4%), while 19.9% of the ESRD patients were singles (males 19.9% and females
19.8% ) 1.8% of the patients were divorced.
Table (6)Distribution of ESRD patients according to marital status and sex 2012
Marital Status Male Female Total
N % N % N %
Married 2077 76.6 1220 59.4 3297 69.2
Single 540 19.9 407 19.8 947 19.9
Divorced 30 1.1 57 2.8 87 1.8
Widow 65 2.4 371 18.1 436 9.1
Total 2712 56.9 2055 43.1 4767 100.0
Distribution of ESRD patients according to employment status and sex
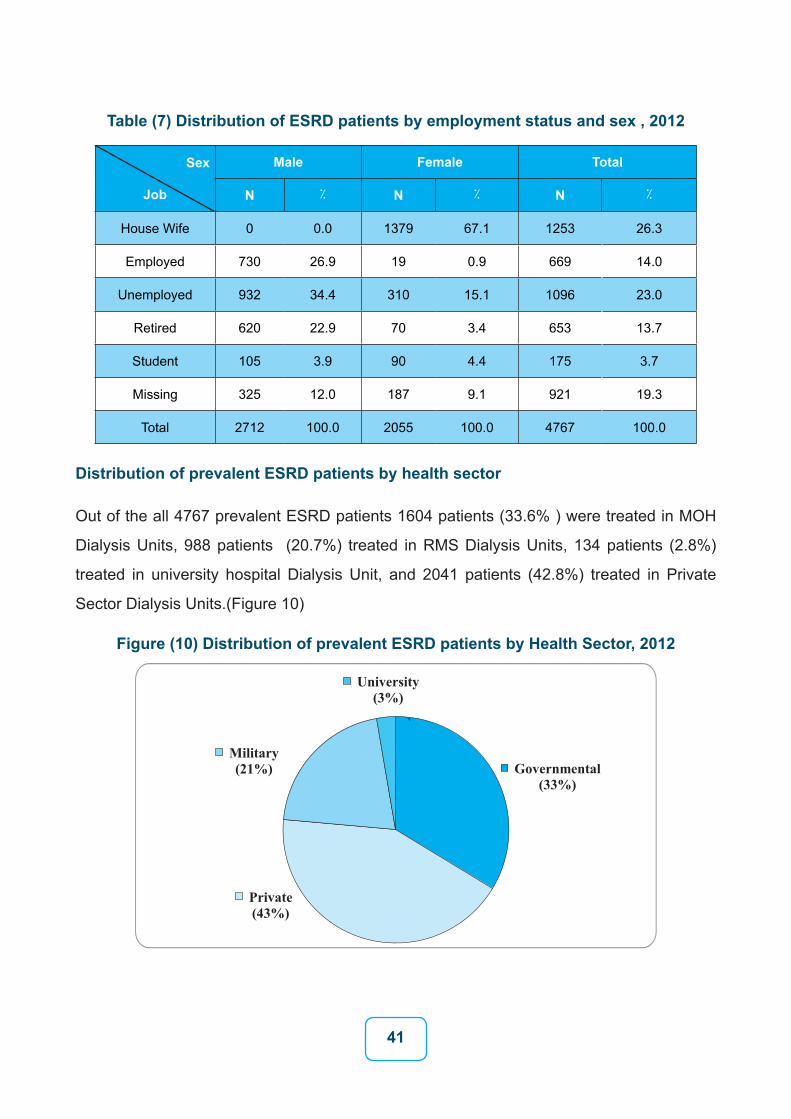
Table (7) shows the distribution of the ESRD patients according to their employment status
for both sexes. House wife’s accounted 67.1 % of the females, 14% of the patients were
employed either governmental or non-governmentally and military services, 13.7% were
retired, and 3.7% were students, 23.0 % of the patients were unemployed, missing data
about employment was 19.3%.
41
Table (7) Distribution of ESRD patients by employment status and sex , 2012
Sex
Job
Male Female Total
N % N % N %
House Wife 0 0.0 1379 67.1 1253 26.3
Employed 730 26.9 19 0.9 669 14.0
Unemployed 932 34.4 310 15.1 1096 23.0
Retired 620 22.9 70 3.4 653 13.7
Student 105 3.9 90 4.4 175 3.7
Missing 325 12.0 187 9.1 921 19.3
Total 2712 100.0 2055 100.0 4767 100.0
Distribution of prevalent ESRD patients by health sector
Out of the all 4767 prevalent ESRD patients 1604 patients (33.6% ) were treated in MOH
Dialysis Units, 988 patients (20.7%) treated in RMS Dialysis Units, 134 patients (2.8%)
treated in university hospital Dialysis Unit, and 2041 patients (42.8%) treated in Private
Sector Dialysis Units.(Figure 10)
Figure (10) Distribution of prevalent ESRD patients by Health Sector, 2012
`
42
Distribution of ESRD cases according to the type of insurance
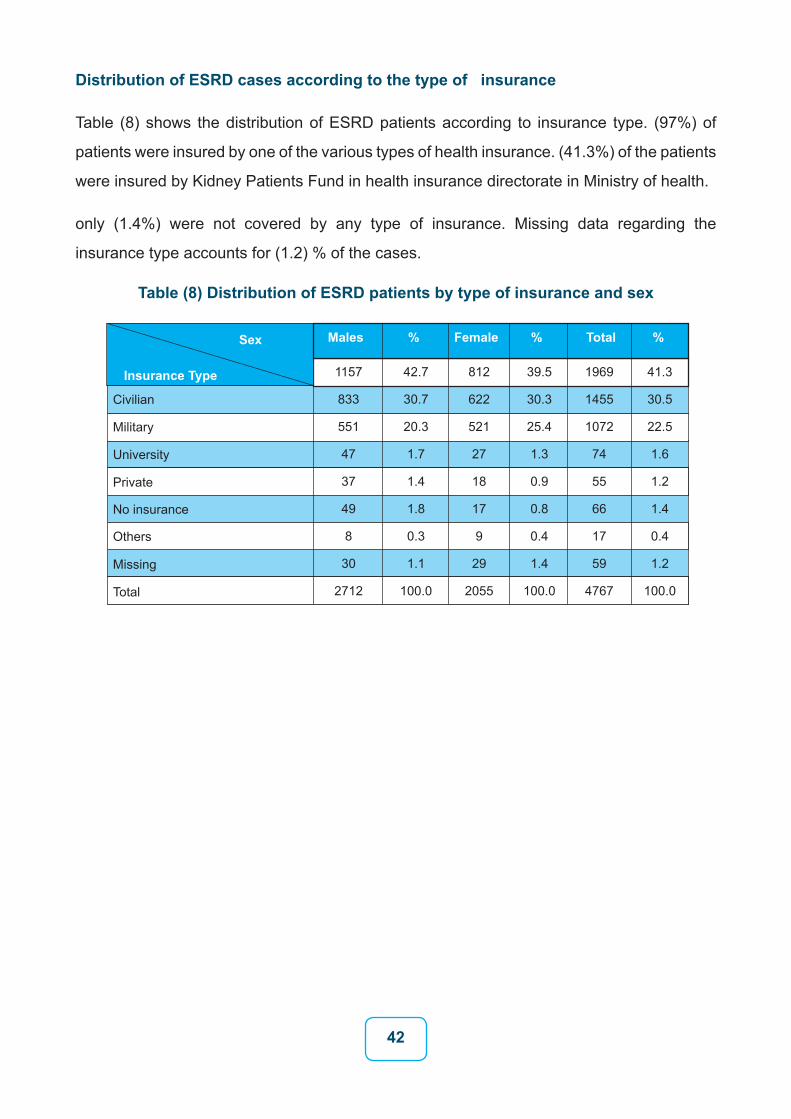
Table (8) shows the distribution of ESRD patients according to insurance type. (97%) of
patients were insured by one of the various types of health insurance. (41.3%) of the patients
were insured by Kidney Patients Fund in health insurance directorate in Ministry of health.
only (1.4%) were not covered by any type of insurance. Missing data regarding the
insurance type accounts for (1.2) % of the cases.
Table (8) Distribution of ESRD patients by type of insurance and sex
Insurance Type
Males
1157
833
551
47
37
49
8
30
2712
42.7
30.7
20.3
1.7
1.4
1.8
0.3
1.1
100.0
812
622
521
27
18
17
9
29
2055
39.5
30.3
25.4
1.3
0.9
0.8
0.4
1.4
100.0
1969
1455
1072
74
55
66
17
59
4767
41.3
30.5
22.5
1.6
1.2
1.4
0.4
1.2
100.0
% % %Female Total
Military
Civilian
University
Private
No insurance
Others
Missing
Total
Sex
43
Distribution of ESRD patients by Governorate
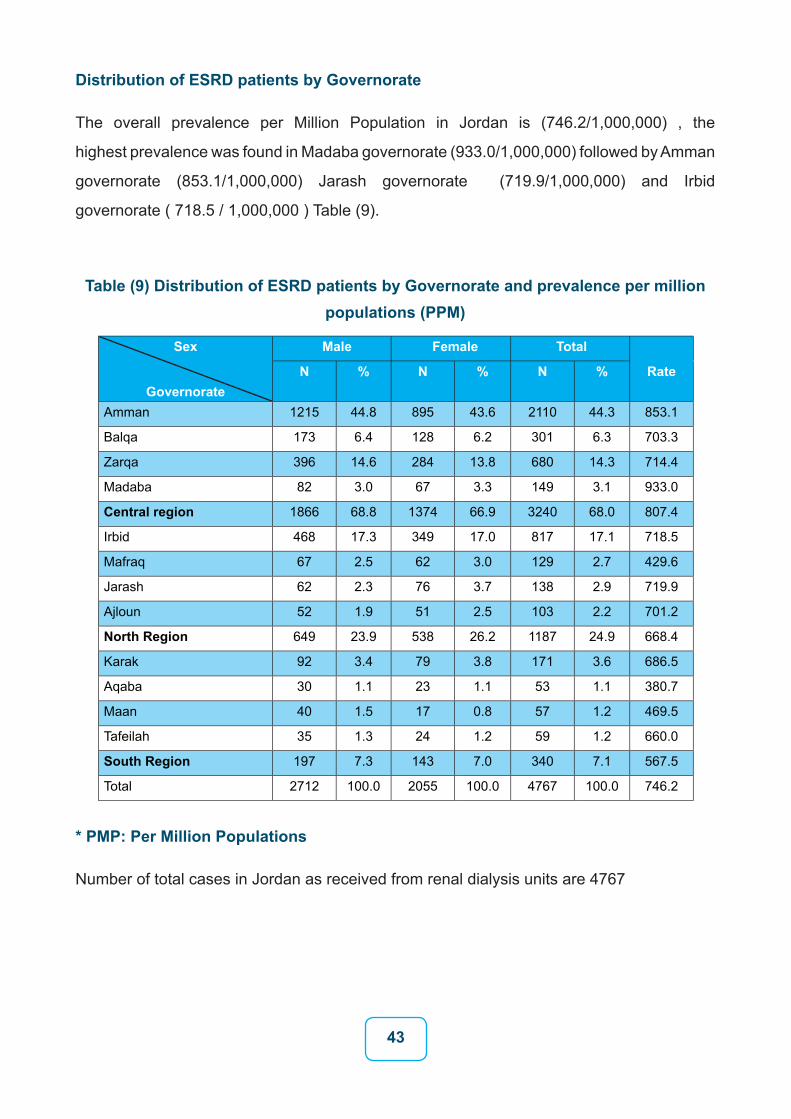
The overall prevalence per Million Population in Jordan is (746.2/1,000,000) , the
highest prevalence was found in Madaba governorate (933.0/1,000,000) followed by Amman
governorate (853.1/1,000,000) Jarash governorate (719.9/1,000,000) and Irbid
governorate ( 718.5 / 1,000,000 ) Table (9).
Table (9) Distribution of ESRD patients by Governorate and prevalence per million populations (PPM)
* PMP: Per Million Populations
Number of total cases in Jordan as received from renal dialysis units are 4767
44
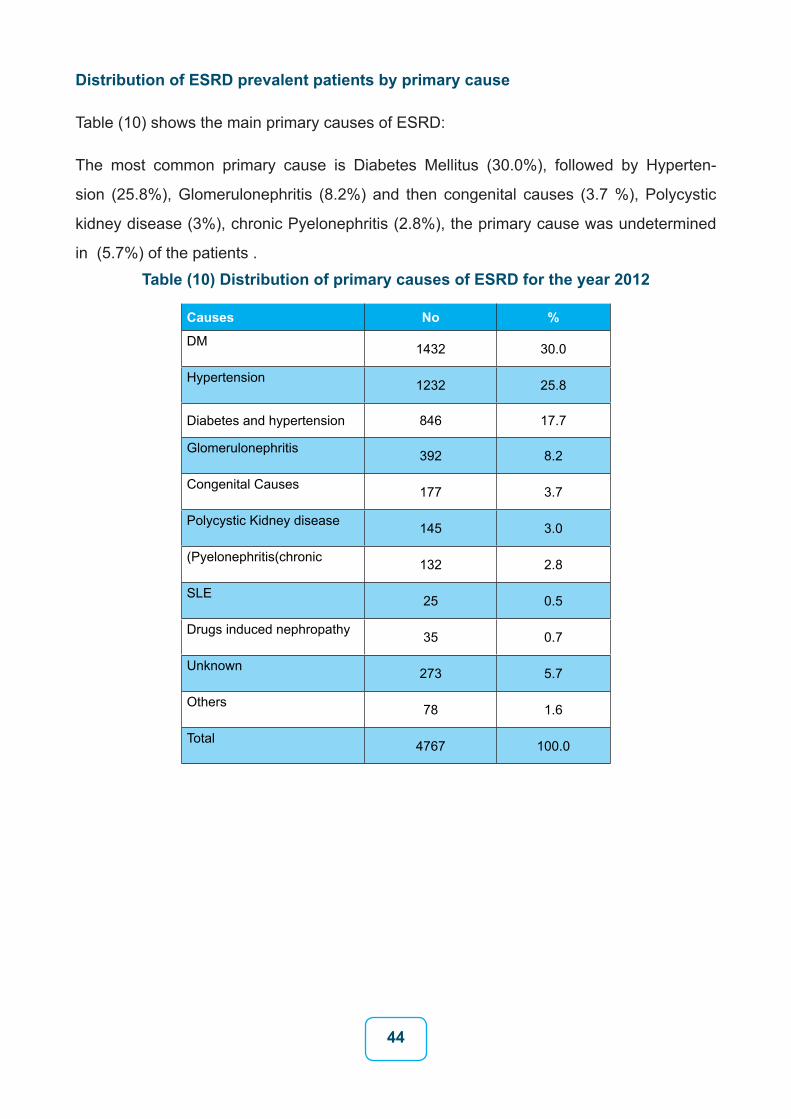
Distribution of ESRD prevalent patients by primary cause
Table (10) shows the main primary causes of ESRD:
The most common primary cause is Diabetes Mellitus (30.0%), followed by Hyperten-
sion (25.8%), Glomerulonephritis (8.2%) and then congenital causes (3.7 %), Polycystic
kidney disease (3%), chronic Pyelonephritis (2.8%), the primary cause was undetermined
in (5.7%) of the patients .
Table (10) Distribution of primary causes of ESRD for the year 2012
Causes No %
DM 1432 30.0
Hypertension 1232 25.8
Diabetes and hypertension 846 17.7
Glomerulonephritis 392 8.2
Congenital Causes 177 3.7
Polycystic Kidney disease 145 3.0
(Pyelonephritis(chronic 132 2.8
SLE 25 0.5
Drugs induced nephropathy 35 0.7
Unknown 273 5.7
Others 78 1.6
Total 4767 100.0
45
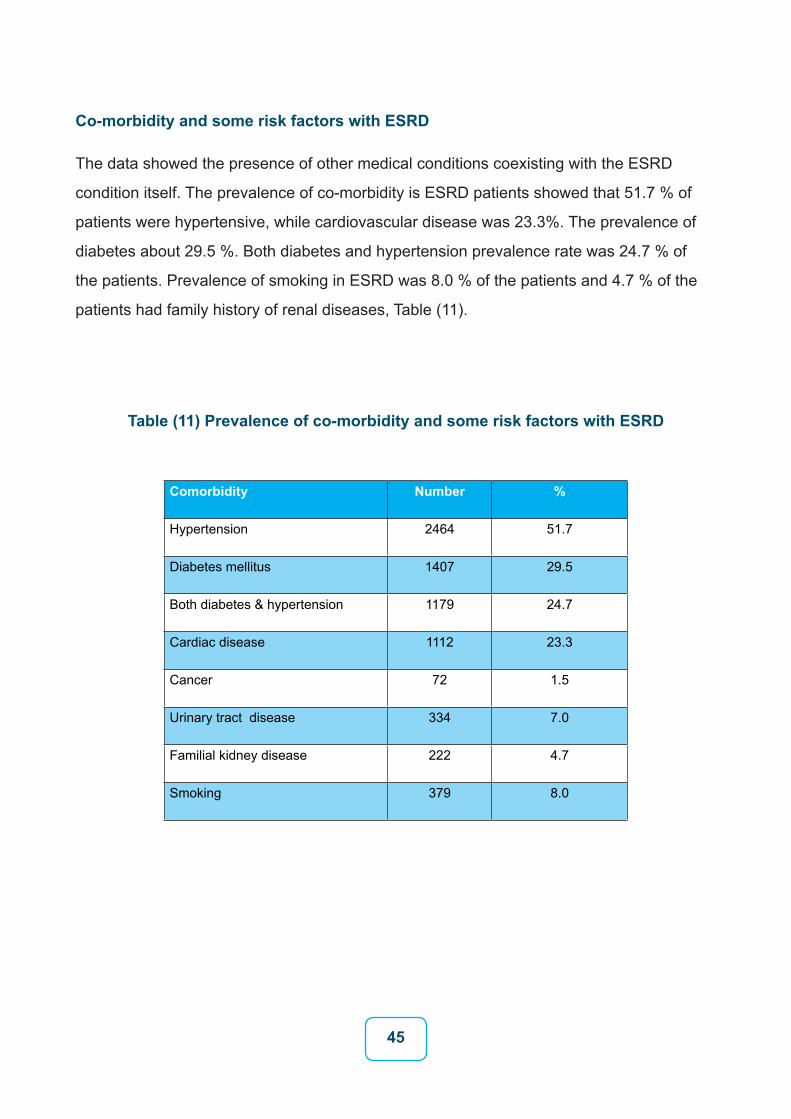
Co-morbidity and some risk factors with ESRD
The data showed the presence of other medical conditions coexisting with the ESRD
condition itself. The prevalence of co-morbidity is ESRD patients showed that 51.7 % of
patients were hypertensive, while cardiovascular disease was 23.3%. The prevalence of
diabetes about 29.5 %. Both diabetes and hypertension prevalence rate was 24.7 % of
the patients. Prevalence of smoking in ESRD was 8.0 % of the patients and 4.7 % of the
patients had family history of renal diseases, Table (11).
Table (11) Prevalence of co-morbidity and some risk factors with ESRD
Comorbidity Number %
Hypertension 2464 51.7
Diabetes mellitus 1407 29.5
Both diabetes & hypertension 1179 24.7
Cardiac disease 1112 23.3
Cancer 72 1.5
Urinary tract disease 334 7.0
Familial kidney disease 222 4.7
Smoking 379 8.0
46
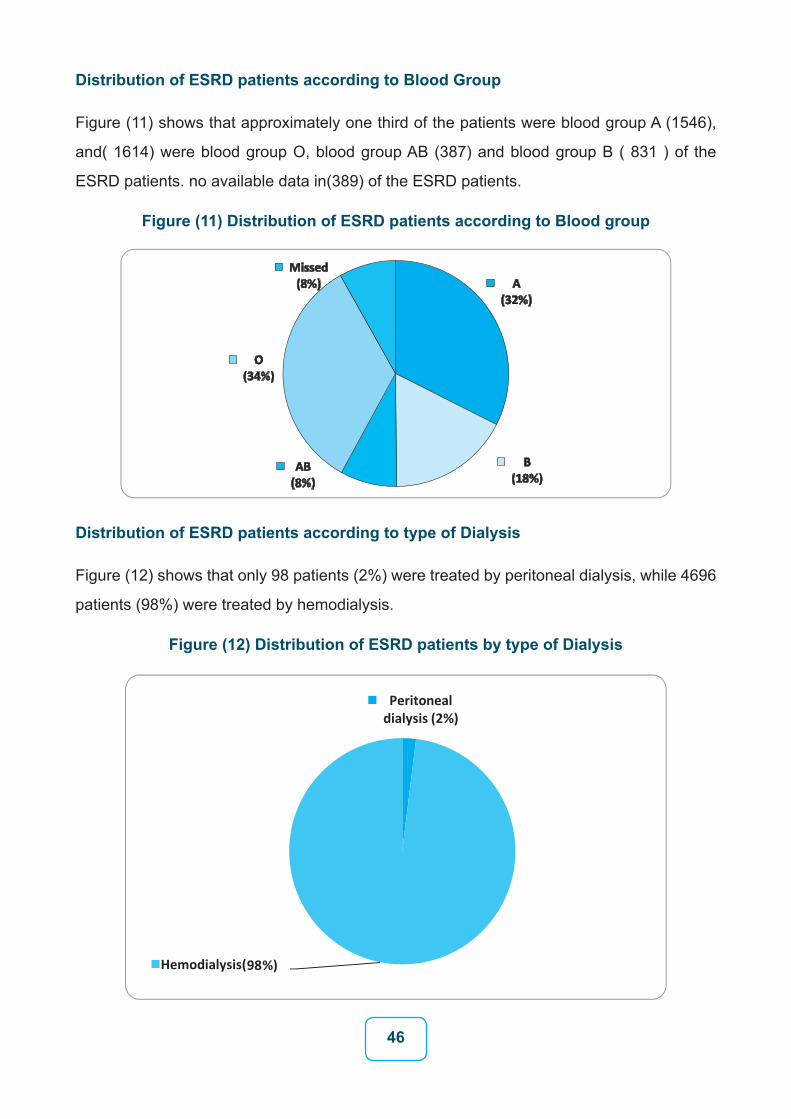
Distribution of ESRD patients according to Blood Group
Figure (11) shows that approximately one third of the patients were blood group A (1546),
and( 1614) were blood group O, blood group AB (387) and blood group B ( 831 ) of the
ESRD patients. no available data in(389) of the ESRD patients.
Figure (11) Distribution of ESRD patients according to Blood group
Distribution of ESRD patients according to type of Dialysis
Figure (12) shows that only 98 patients (2%) were treated by peritoneal dialysis, while 4696
patients (98%) were treated by hemodialysis.
Figure (12) Distribution of ESRD patients by type of Dialysis
47
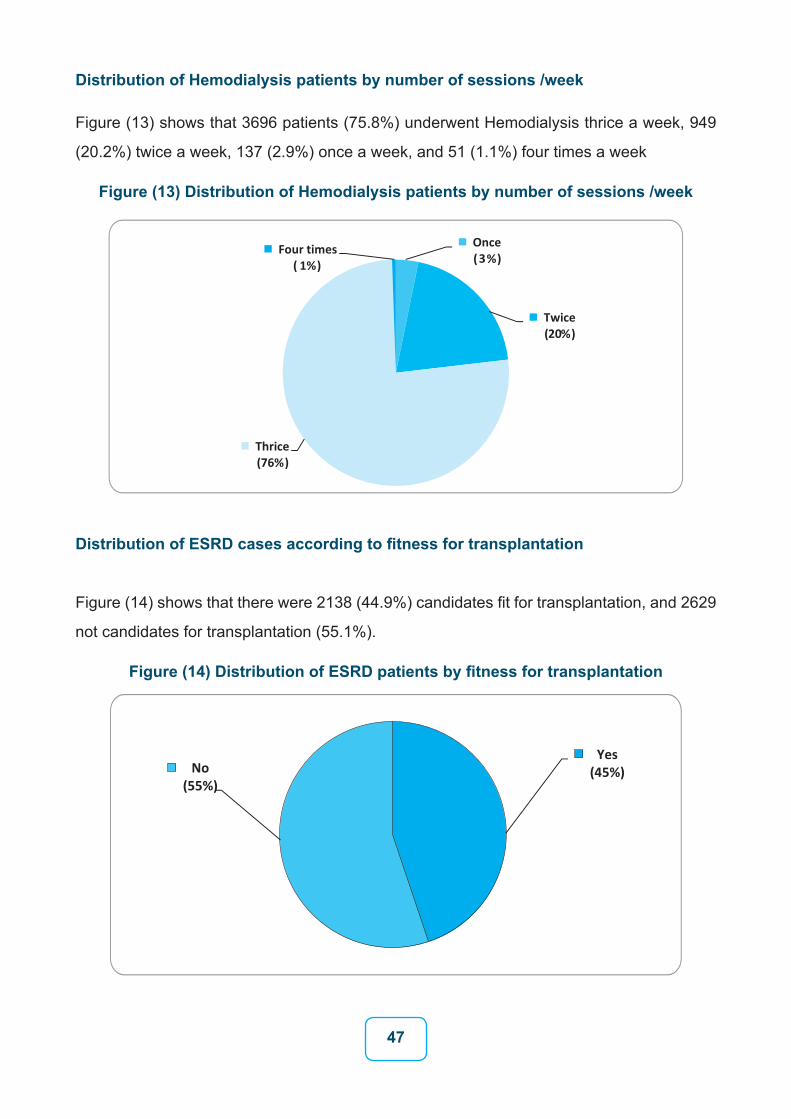
Distribution of Hemodialysis patients by number of sessions /week
Figure (13) shows that 3696 patients (75.8%) underwent Hemodialysis thrice a week, 949
(20.2%) twice a week, 137 (2.9%) once a week, and 51 (1.1%) four times a week
Figure (13) Distribution of Hemodialysis patients by number of sessions /week
Distribution of ESRD cases according to fitness for transplantation
Figure (14) shows that there were 2138 (44.9%) candidates fit for transplantation, and 2629
not candidates for transplantation (55.1%).
Figure (14) Distribution of ESRD patients by fitness for transplantation
48
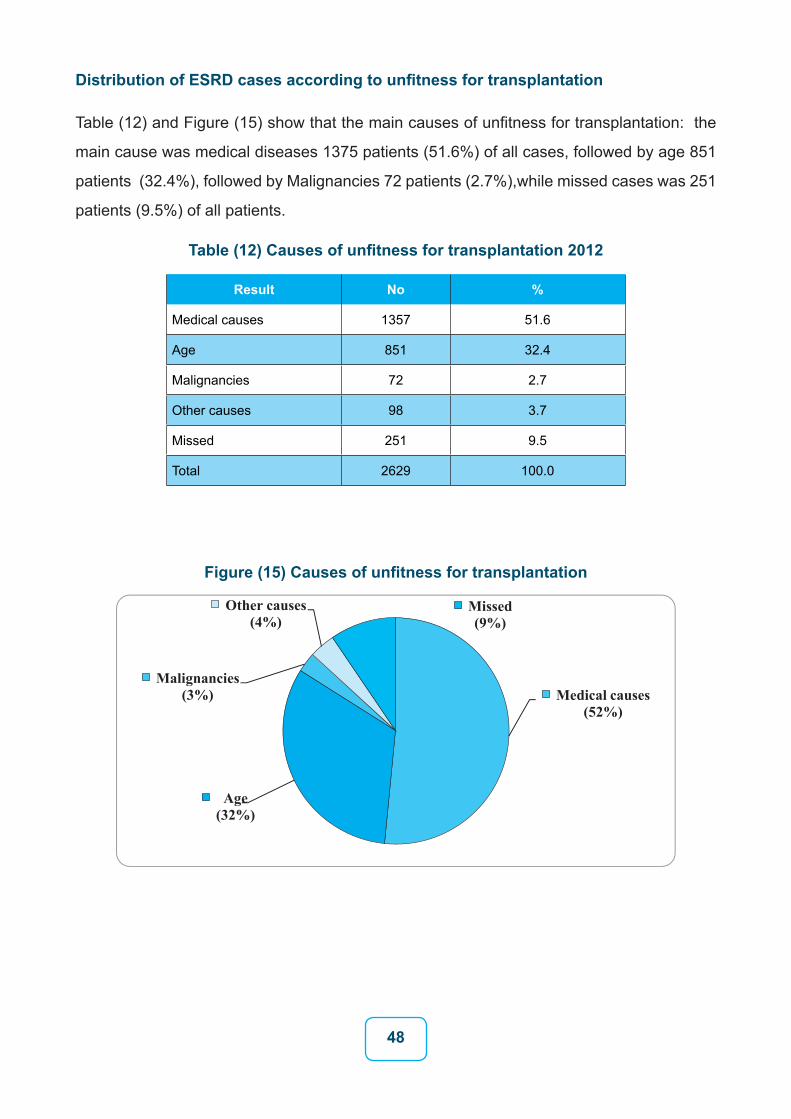
Distribution of ESRD cases according to unfitness for transplantation
Table (12) and Figure (15) show that the main causes of unfitness for transplantation: the
main cause was medical diseases 1375 patients (51.6%) of all cases, followed by age 851
patients (32.4%), followed by Malignancies 72 patients (2.7%),while missed cases was 251
patients (9.5%) of all patients.
Table (12) Causes of unfitness for transplantation 2012
Result No %
Medical causes 1357 51.6
Age 851 32.4
Malignancies 72 2.7
Other causes 98 3.7
Missed 251 9.5
Total 2629 100.0
Figure (15) Causes of unfitness for transplantation
49
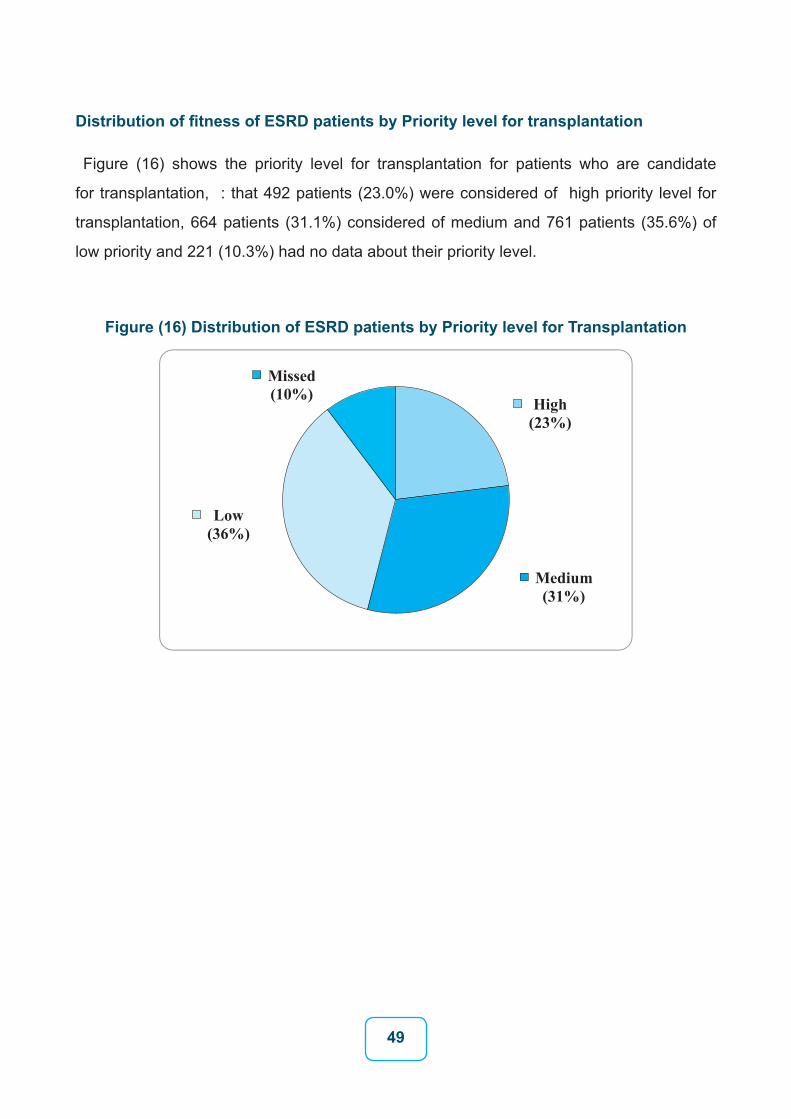
Distribution of fitness of ESRD patients by Priority level for transplantation
Figure (16) shows the priority level for transplantation for patients who are candidate
for transplantation, : that 492 patients (23.0%) were considered of high priority level for
transplantation, 664 patients (31.1%) considered of medium and 761 patients (35.6%) of
low priority and 221 (10.3%) had no data about their priority level.
Figure (16) Distribution of ESRD patients by Priority level for Transplantation
50
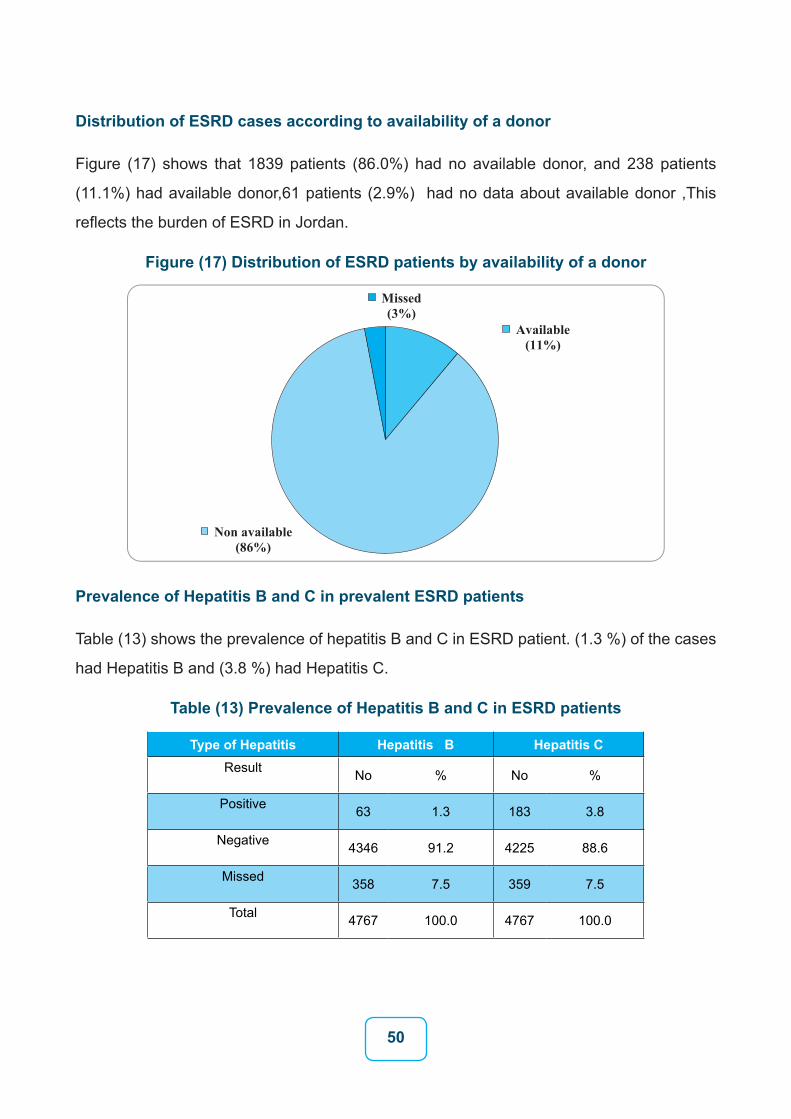
Distribution of ESRD cases according to availability of a donor
Figure (17) shows that 1839 patients (86.0%) had no available donor, and 238 patients
(11.1%) had available donor,61 patients (2.9%) had no data about available donor ,This
reflects the burden of ESRD in Jordan.
Figure (17) Distribution of ESRD patients by availability of a donor
Prevalence of Hepatitis B and C in prevalent ESRD patients
Table (13) shows the prevalence of hepatitis B and C in ESRD patient. (1.3 %) of the cases
had Hepatitis B and (3.8 %) had Hepatitis C.
Table (13) Prevalence of Hepatitis B and C in ESRD patients
Type of Hepatitis Hepatitis B Hepatitis CResult No % No %
Positive 63 1.3 183 3.8
Negative 4346 91.2 4225 88.6
Missed 358 7.5 359 7.5
Total 4767 100.0 4767 100.0
51
Part Four:
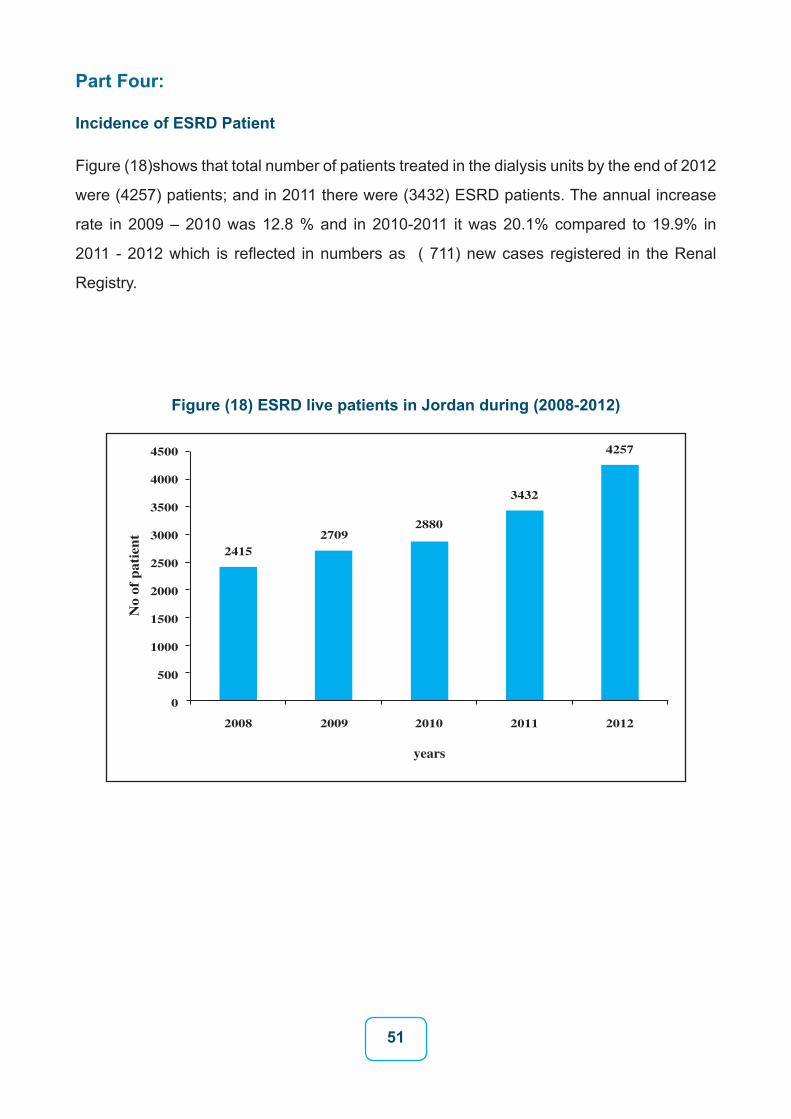
Incidence of ESRD Patient
Figure (18)shows that total number of patients treated in the dialysis units by the end of 2012
were (4257) patients; and in 2011 there were (3432) ESRD patients. The annual increase
rate in 2009 – 2010 was 12.8 % and in 2010-2011 it was 20.1% compared to 19.9% in
2011 - 2012 which is reflected in numbers as ( 711) new cases registered in the Renal
Registry.
Figure (18) ESRD live patients in Jordan during (2008-2012)
4500
4000
3500
3000
2500
2000
1500
1000
500
0
2415
2008 2009 2010
years
No
of p
atie
nt
2011 2012
27092880
3432
4257
52
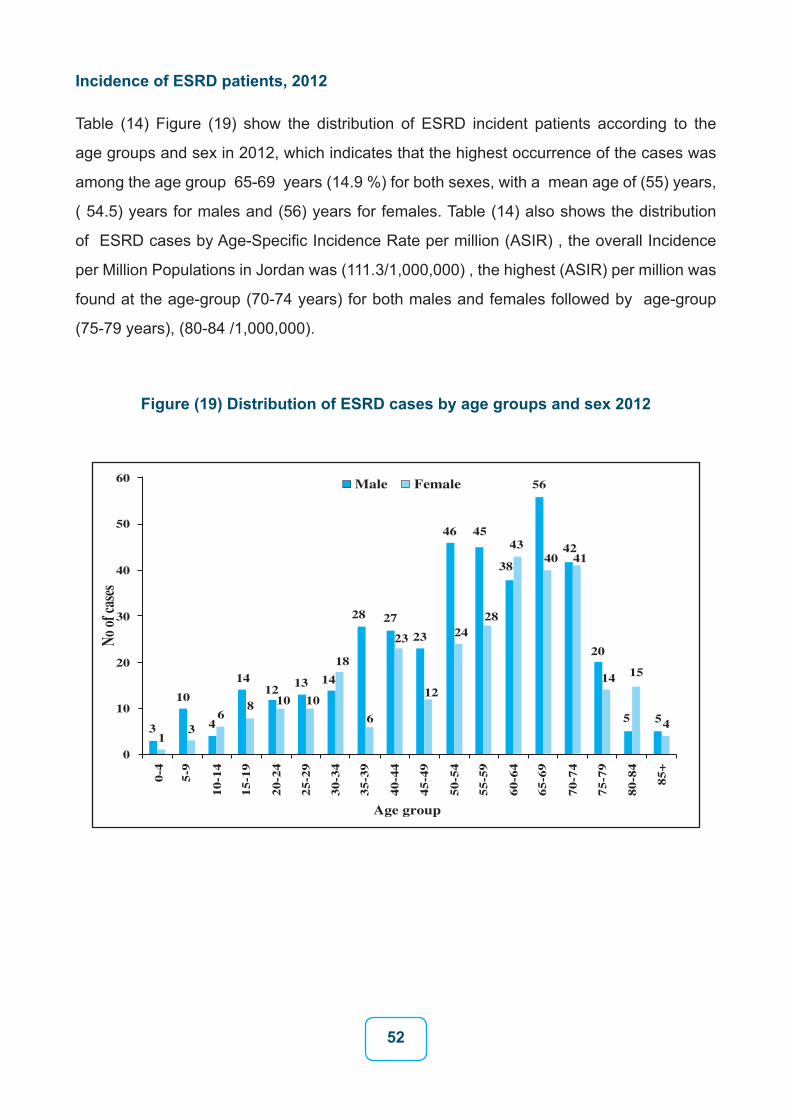
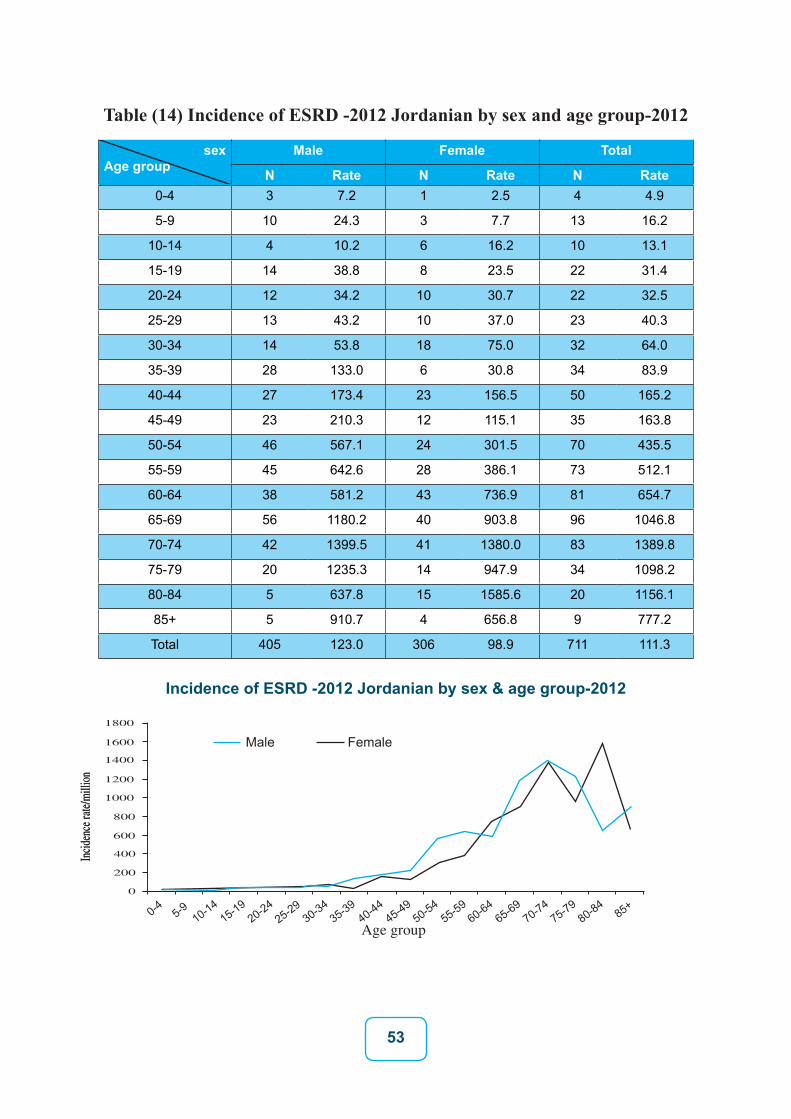
Incidence of ESRD patients, 2012
Table (14) Figure (19) show the distribution of ESRD incident patients according to the
age groups and sex in 2012, which indicates that the highest occurrence of the cases was
among the age group 65-69 years (14.9 %) for both sexes, with a mean age of (55) years,
( 54.5) years for males and (56) years for females. Table (14) also shows the distribution
of ESRD cases by Age-Specific Incidence Rate per million (ASIR) , the overall Incidence
per Million Populations in Jordan was (111.3/1,000,000) , the highest (ASIR) per million was
found at the age-group (70-74 years) for both males and females followed by age-group
(75-79 years), (80-84 /1,000,000).
Figure (19) Distribution of ESRD cases by age groups and sex 2012
Male Female
Age group
No of
case
s
60
50
40
30
20
10
0
31
0-4
10
3 46
14
8
5-9
10-1
4
15-1
9
1210
20-2
4
13
10
25-2
9
14
18
30-3
4
28 27
23 23
12
46
24
45
28
38
4340
56
4241
20
14 15
5 546
35-3
9
40-4
4
45-4
9
50-5
4
55-5
9
60-6
4
65-6
9
70-7
4
75-7
9
80-8
4
85+
53
Table (14) Incidence of ESRD -2012 Jordanian by sex and age group-2012
sex Age group
Male Female Total
N Rate N Rate N Rate0-4 3 7.2 1 2.5 4 4.9
5-9 10 24.3 3 7.7 13 16.2
10-14 4 10.2 6 16.2 10 13.1
15-19 14 38.8 8 23.5 22 31.4
20-24 12 34.2 10 30.7 22 32.5
25-29 13 43.2 10 37.0 23 40.3
30-34 14 53.8 18 75.0 32 64.0
35-39 28 133.0 6 30.8 34 83.9
40-44 27 173.4 23 156.5 50 165.2
45-49 23 210.3 12 115.1 35 163.8
50-54 46 567.1 24 301.5 70 435.5
55-59 45 642.6 28 386.1 73 512.1
60-64 38 581.2 43 736.9 81 654.7
65-69 56 1180.2 40 903.8 96 1046.8
70-74 42 1399.5 41 1380.0 83 1389.8
75-79 20 1235.3 14 947.9 34 1098.2
80-84 5 637.8 15 1585.6 20 1156.1
85+ 5 910.7 4 656.8 9 777.2
Total 405 123.0 306 98.9 711 111.3
Incidence of ESRD -2012 Jordanian by sex & age group-2012
Incid
ence
rate/
mill
ion
Incid
ence
rate/
mill
ion
0-4 5-910-14
15-1920-24
25-2930-34
35-3940-44
45-4950-54
55-5960-64
65-6970-74
75-7980-84
85+
1800
1600
1400
1200
1000
800
600
400
200
0
Female
Age group
Male
54
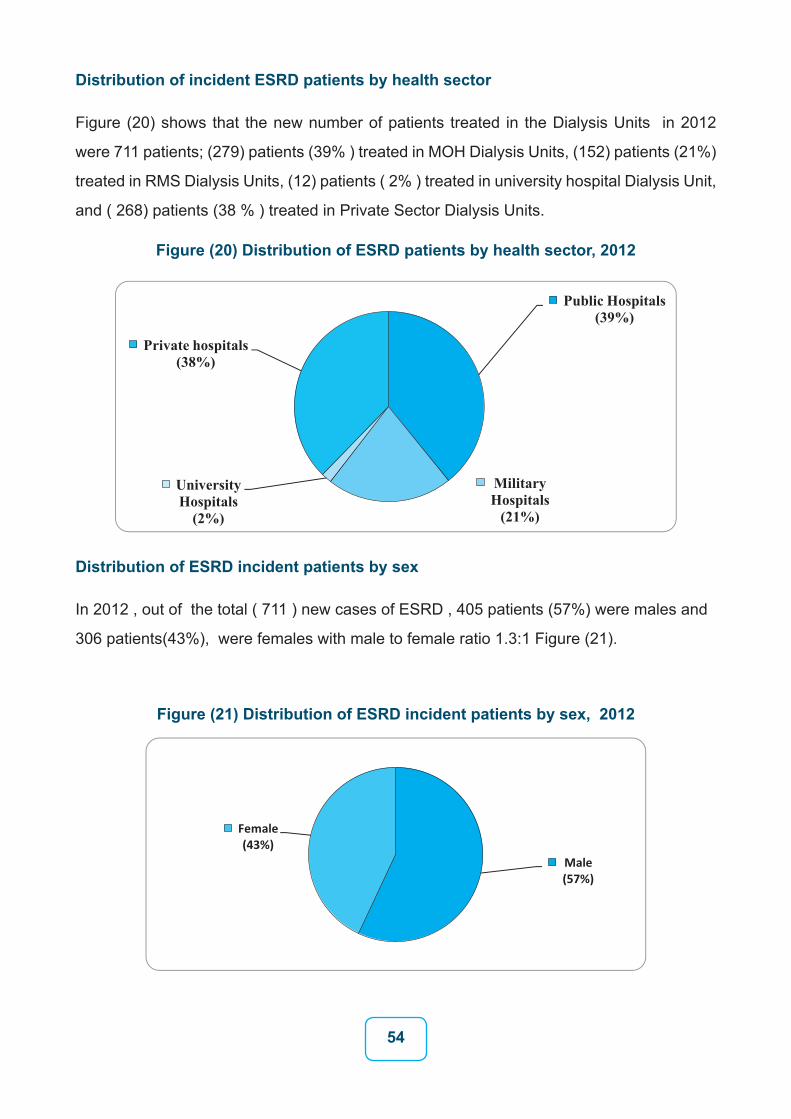
Distribution of incident ESRD patients by health sector
Figure (20) shows that the new number of patients treated in the Dialysis Units in 2012
were 711 patients; (279) patients (39% ) treated in MOH Dialysis Units, (152) patients (21%)
treated in RMS Dialysis Units, (12) patients ( 2% ) treated in university hospital Dialysis Unit,
and ( 268) patients (38 % ) treated in Private Sector Dialysis Units.
Figure (20) Distribution of ESRD patients by health sector, 2012
Distribution of ESRD incident patients by sex
In 2012 , out of the total ( 711 ) new cases of ESRD , 405 patients (57%) were males and
306 patients(43%), were females with male to female ratio 1.3:1 Figure (21).
Figure (21) Distribution of ESRD incident patients by sex, 2012
55
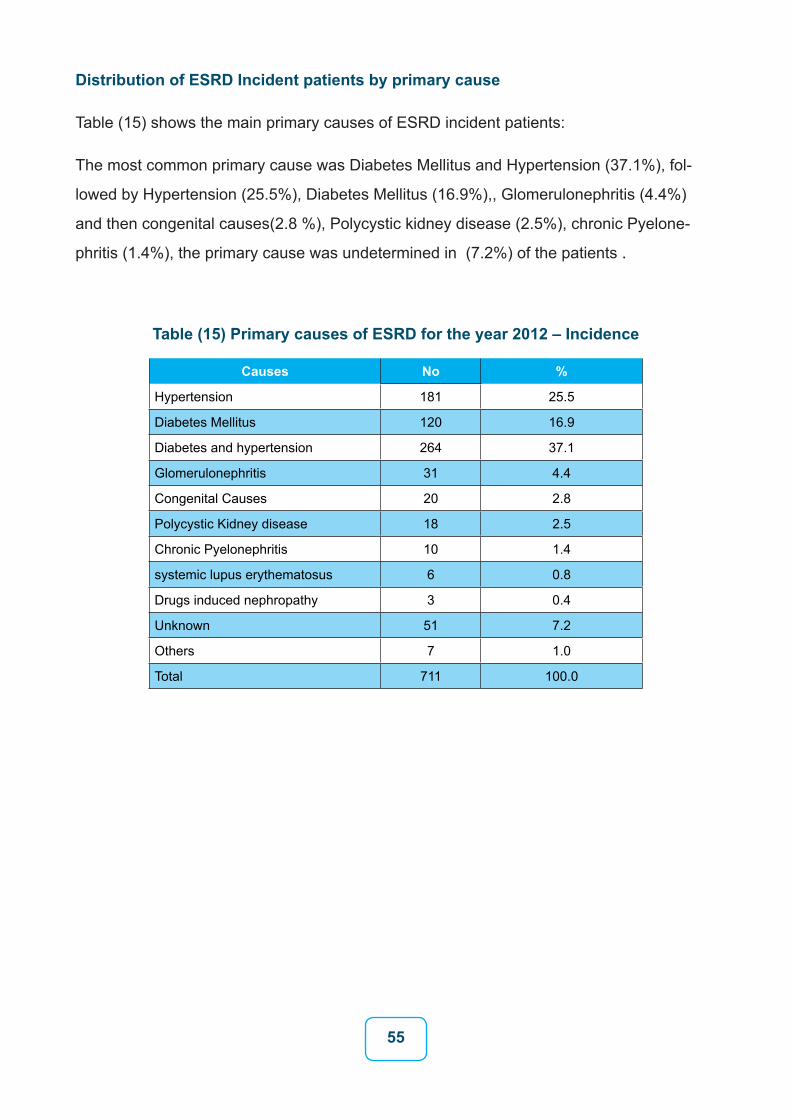
Distribution of ESRD Incident patients by primary cause
Table (15) shows the main primary causes of ESRD incident patients:
The most common primary cause was Diabetes Mellitus and Hypertension (37.1%), fol-
lowed by Hypertension (25.5%), Diabetes Mellitus (16.9%),, Glomerulonephritis (4.4%)
and then congenital causes(2.8 %), Polycystic kidney disease (2.5%), chronic Pyelone-
phritis (1.4%), the primary cause was undetermined in (7.2%) of the patients .
Table (15) Primary causes of ESRD for the year 2012 – Incidence
Causes No %
Hypertension 181 25.5
Diabetes Mellitus 120 16.9
Diabetes and hypertension 264 37.1
Glomerulonephritis 31 4.4
Congenital Causes 20 2.8
Polycystic Kidney disease 18 2.5
Chronic Pyelonephritis 10 1.4
systemic lupus erythematosus 6 0.8
Drugs induced nephropathy 3 0.4
Unknown 51 7.2
Others 7 1.0
Total 711 100.0
56
Primary causes of ESRD for the year 2012 - Incidence
CausesMale Female Total
N % N % No %
Diabetes Mellitus 67 16.5 53 17.3 120 16.9
Hypertension 103 25.4 78 25.5 181 25.5
Diabetes and hypertension 154 38.0 110 35.9 264 37.1
Glomerulonephritis 15 3.7 16 5.2 31 4.4
Congenital Causes 8 2.0 12 3.9 20 2.8
Polycystic Kidney disease 15 3.7 3 1.0 18 2.5
chronic Pyelonephritis 6 1.5 4 1.3 10 1.4
systemic lupus erythematosus 4 1.0 2 0.7 6 0.8
Drugs induced nephropathy 2 0.5 1 0.3 3 0.4
Neurogenic bladder 2 0.5 4 1.3 6 0.8
VUR 8 2.0 2 0.7 10 1.4
Unknown 18 4.4 19 6.2 37 5.2
Others 3 0.7 2 0.7 5 0.7
Total 405 100 306 100 711 100
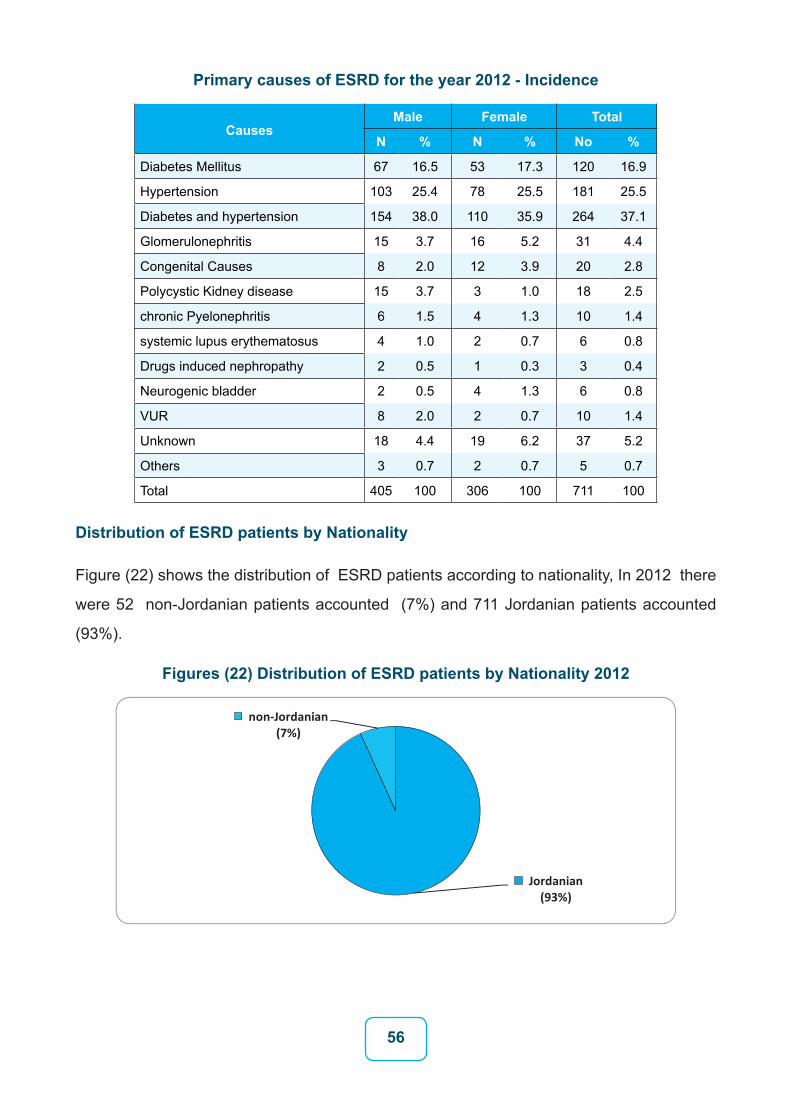
Distribution of ESRD patients by Nationality
Figure (22) shows the distribution of ESRD patients according to nationality, In 2012 there
were 52 non-Jordanian patients accounted (7%) and 711 Jordanian patients accounted
(93%).
Figures (22) Distribution of ESRD patients by Nationality 2012
57
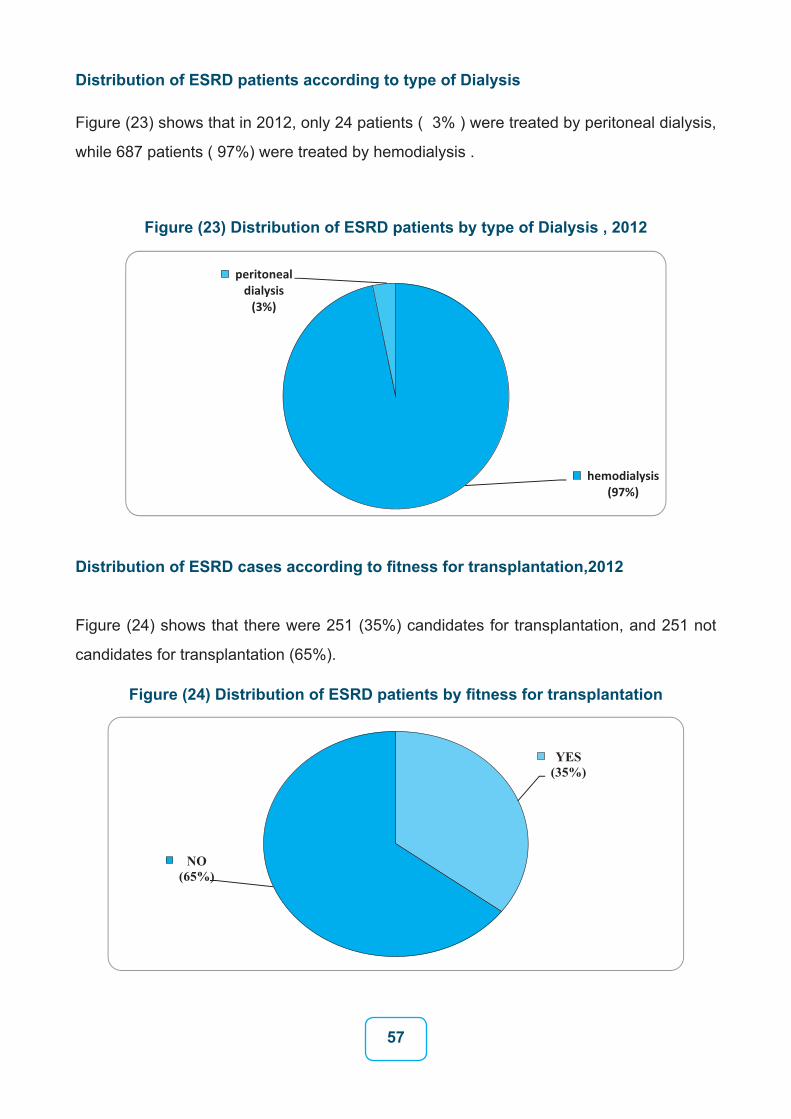
Distribution of ESRD patients according to type of Dialysis
Figure (23) shows that in 2012, only 24 patients ( 3% ) were treated by peritoneal dialysis,
while 687 patients ( 97%) were treated by hemodialysis .
Figure (23) Distribution of ESRD patients by type of Dialysis , 2012
Distribution of ESRD cases according to fitness for transplantation,2012
Figure (24) shows that there were 251 (35%) candidates for transplantation, and 251 not
candidates for transplantation (65%).
Figure (24) Distribution of ESRD patients by fitness for transplantation
58
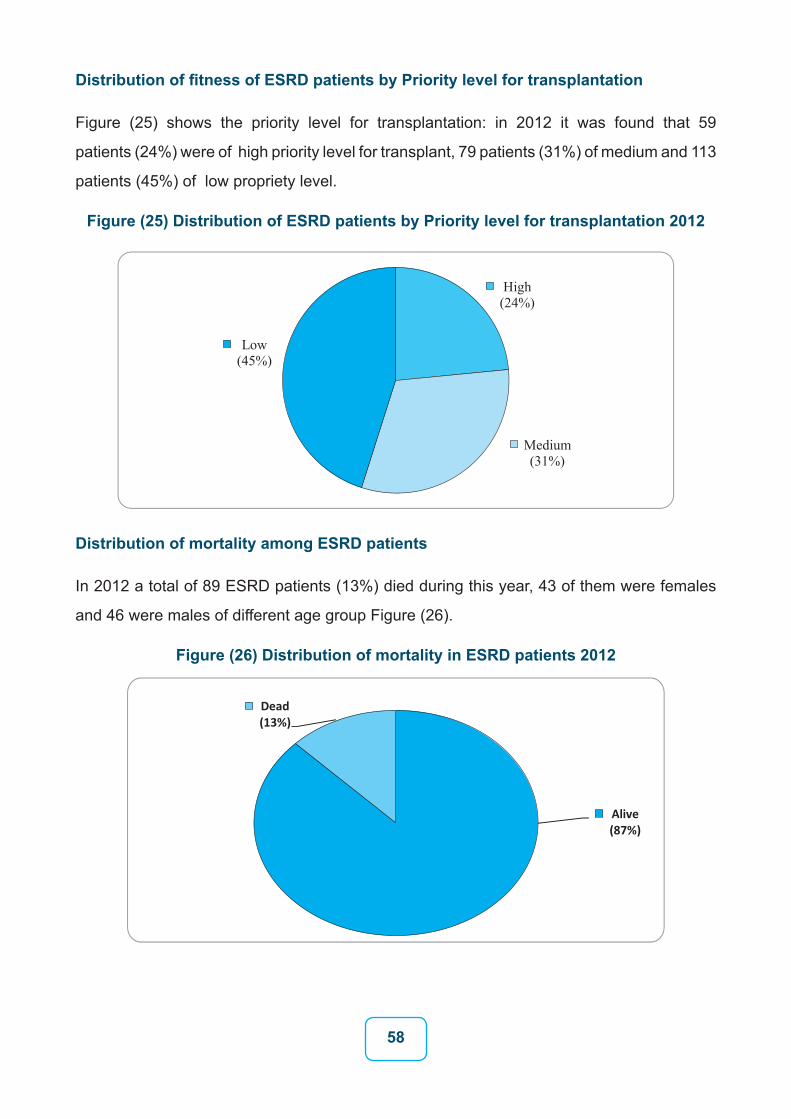
Distribution of fitness of ESRD patients by Priority level for transplantation
Figure (25) shows the priority level for transplantation: in 2012 it was found that 59
patients (24%) were of high priority level for transplant, 79 patients (31%) of medium and 113
patients (45%) of low propriety level.
Figure (25) Distribution of ESRD patients by Priority level for transplantation 2012
Distribution of mortality among ESRD patients
In 2012 a total of 89 ESRD patients (13%) died during this year, 43 of them were females
and 46 were males of different age group Figure (26).
Figure (26) Distribution of mortality in ESRD patients 2012
59
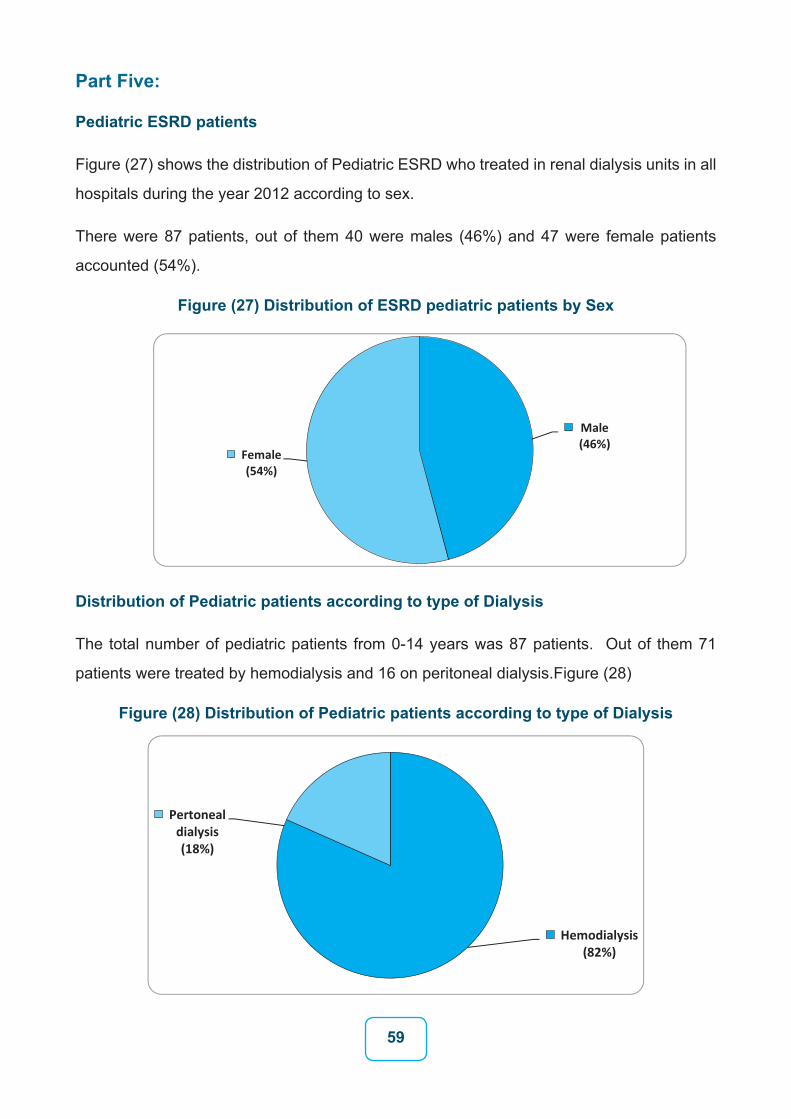
Part Five:
Pediatric ESRD patients
Figure (27) shows the distribution of Pediatric ESRD who treated in renal dialysis units in all
hospitals during the year 2012 according to sex.
There were 87 patients, out of them 40 were males (46%) and 47 were female patients
accounted (54%).
Figure (27) Distribution of ESRD pediatric patients by Sex
Distribution of Pediatric patients according to type of Dialysis
The total number of pediatric patients from 0-14 years was 87 patients. Out of them 71
patients were treated by hemodialysis and 16 on peritoneal dialysis.Figure (28)
Figure (28) Distribution of Pediatric patients according to type of Dialysis
60
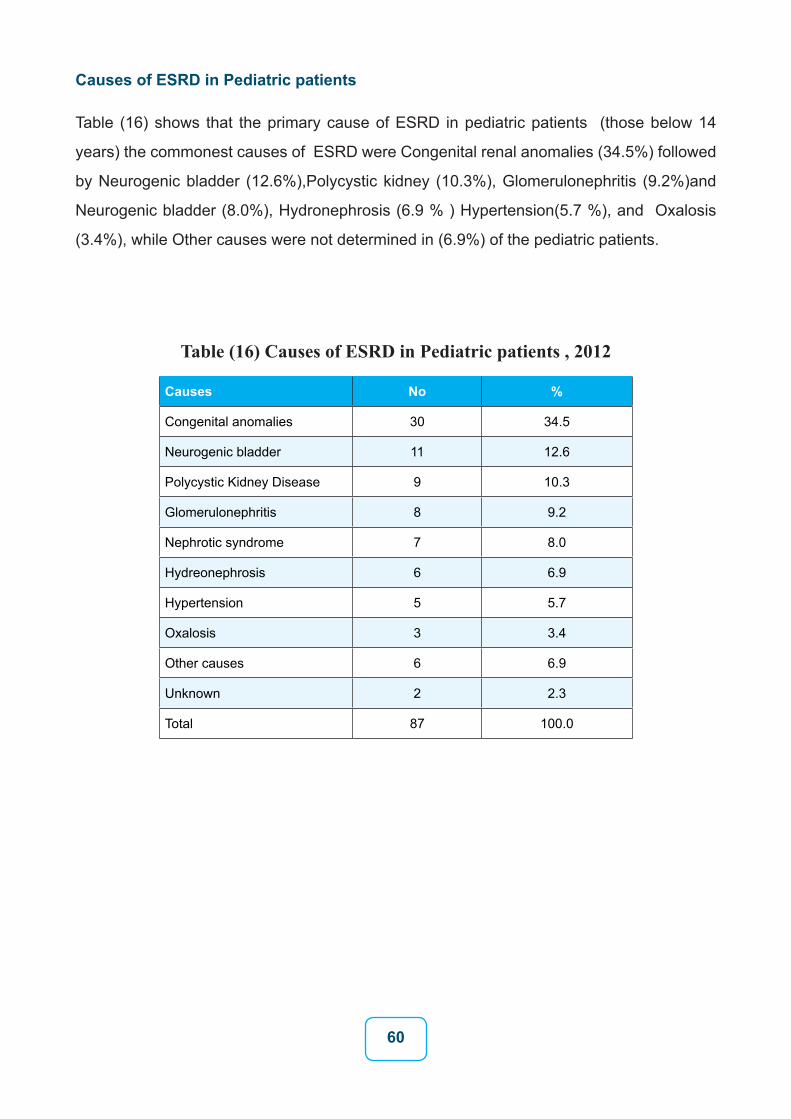
Causes of ESRD in Pediatric patients
Table (16) shows that the primary cause of ESRD in pediatric patients (those below 14
years) the commonest causes of ESRD were Congenital renal anomalies (34.5%) followed
by Neurogenic bladder (12.6%),Polycystic kidney (10.3%), Glomerulonephritis (9.2%)and
Neurogenic bladder (8.0%), Hydronephrosis (6.9 % ) Hypertension(5.7 %), and Oxalosis
(3.4%), while Other causes were not determined in (6.9%) of the pediatric patients.
Table (16) Causes of ESRD in Pediatric patients , 2012
Causes No %
Congenital anomalies 30 34.5
Neurogenic bladder 11 12.6
Polycystic Kidney Disease 9 10.3
Glomerulonephritis 8 9.2
Nephrotic syndrome 7 8.0
Hydreonephrosis 6 6.9
Hypertension 5 5.7
Oxalosis 3 3.4
Other causes 6 6.9
Unknown 2 2.3
Total 87 100.0
61
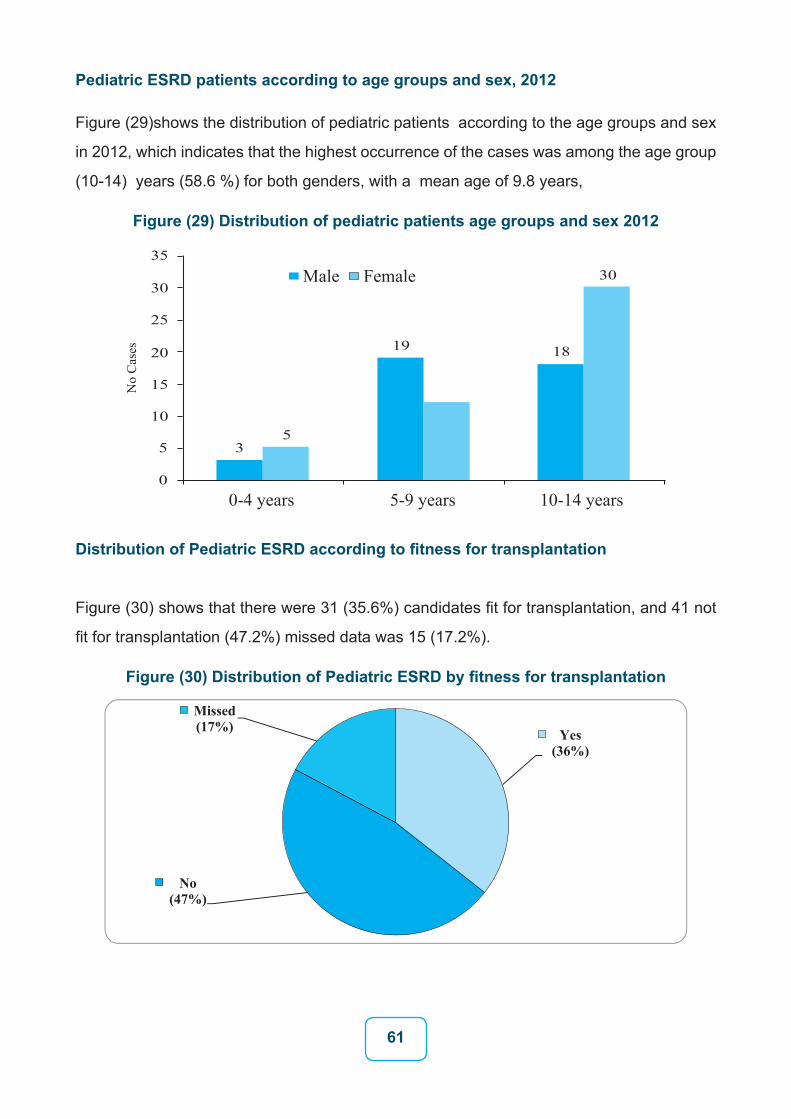
Pediatric ESRD patients according to age groups and sex, 2012
Figure (29)shows the distribution of pediatric patients according to the age groups and sex
in 2012, which indicates that the highest occurrence of the cases was among the age group
(10-14) years (58.6 %) for both genders, with a mean age of 9.8 years,
Figure (29) Distribution of pediatric patients age groups and sex 2012
Female
0-4 years 5-9 years 10-14 years
19
5
0
5
10
15
20
25
30
35
3
18
30Male
No
Cas
es
Distribution of Pediatric ESRD according to fitness for transplantation
Figure (30) shows that there were 31 (35.6%) candidates fit for transplantation, and 41 not
fit for transplantation (47.2%) missed data was 15 (17.2%).
Figure (30) Distribution of Pediatric ESRD by fitness for transplantation
62
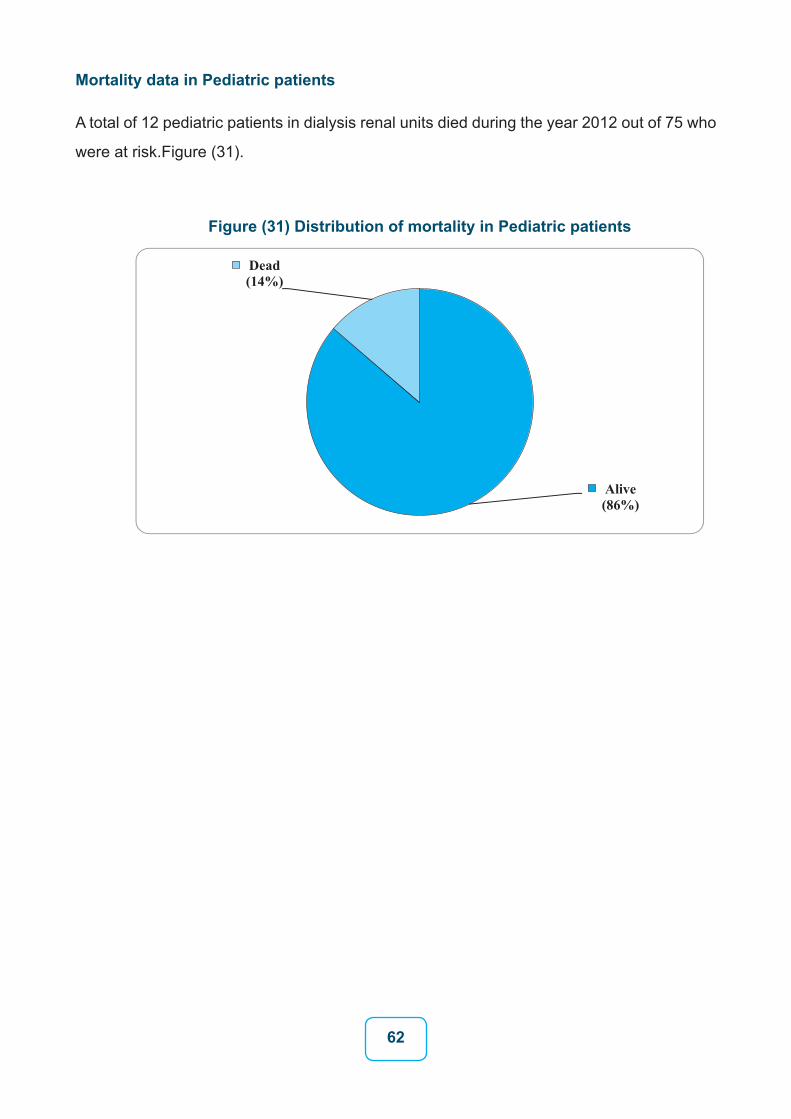
Mortality data in Pediatric patients
A total of 12 pediatric patients in dialysis renal units died during the year 2012 out of 75 who
were at risk.Figure (31).
Figure (31) Distribution of mortality in Pediatric patients
63
Part Six
ESRD Mortality
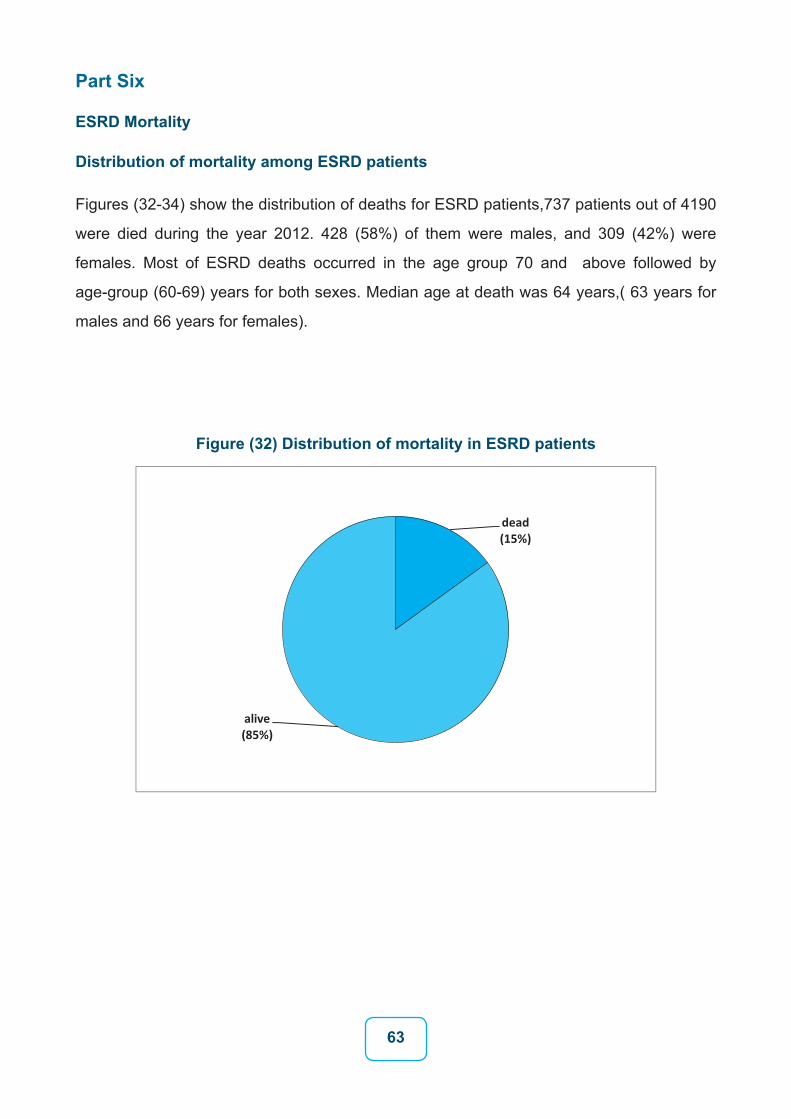
Distribution of mortality among ESRD patients
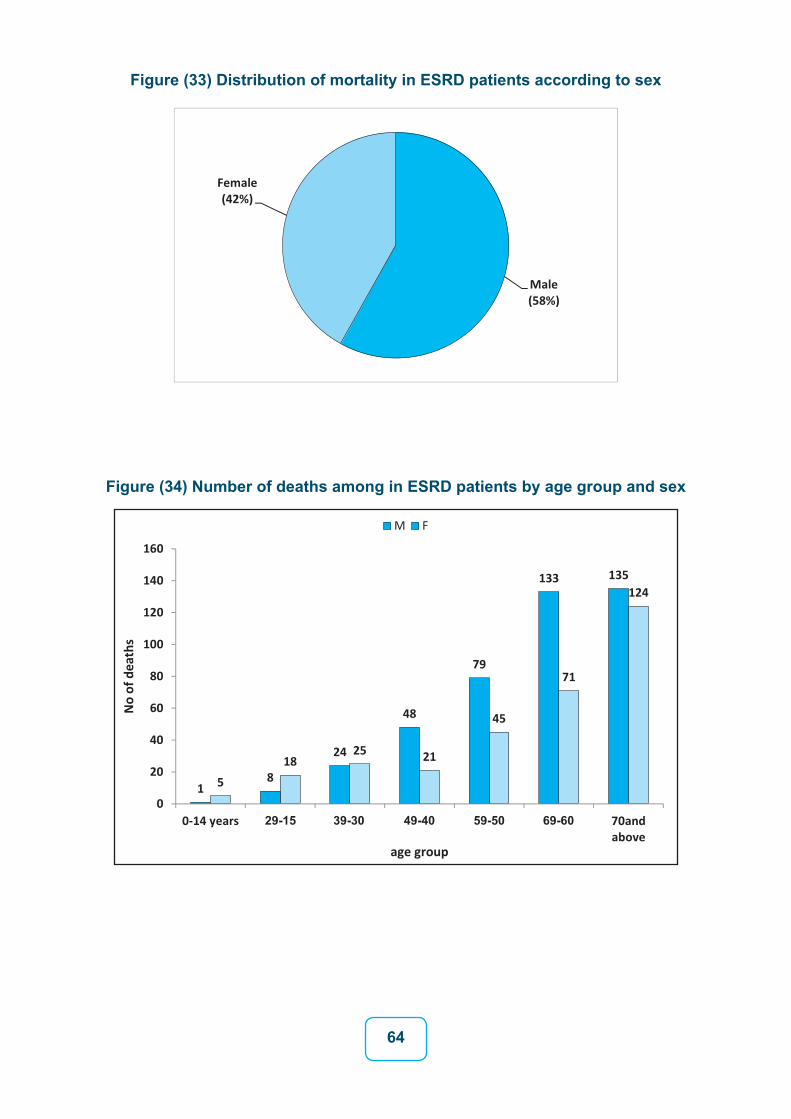
Figures (32-34) show the distribution of deaths for ESRD patients,737 patients out of 4190
were died during the year 2012. 428 (58%) of them were males, and 309 (42%) were
females. Most of ESRD deaths occurred in the age group 70 and above followed by
age-group (60-69) years for both sexes. Median age at death was 64 years,( 63 years for
males and 66 years for females).
Figure (32) Distribution of mortality in ESRD patients
64
Figure (33) Distribution of mortality in ESRD patients according to sex
Figure (34) Number of deaths among in ESRD patients by age group and sex
65
Part Seven
ESRD patients among Non-Jordanians, 2012
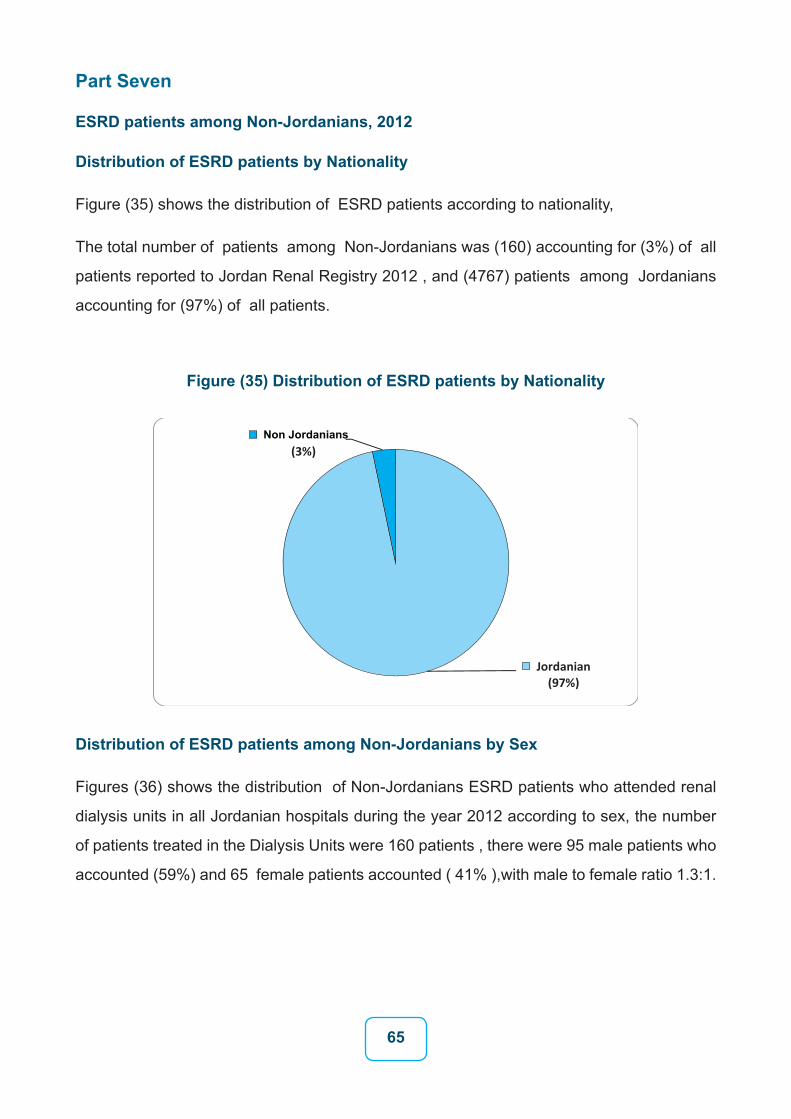
Distribution of ESRD patients by Nationality
Figure (35) shows the distribution of ESRD patients according to nationality,
The total number of patients among Non-Jordanians was (160) accounting for (3%) of all
patients reported to Jordan Renal Registry 2012 , and (4767) patients among Jordanians
accounting for (97%) of all patients.
Figure (35) Distribution of ESRD patients by Nationality
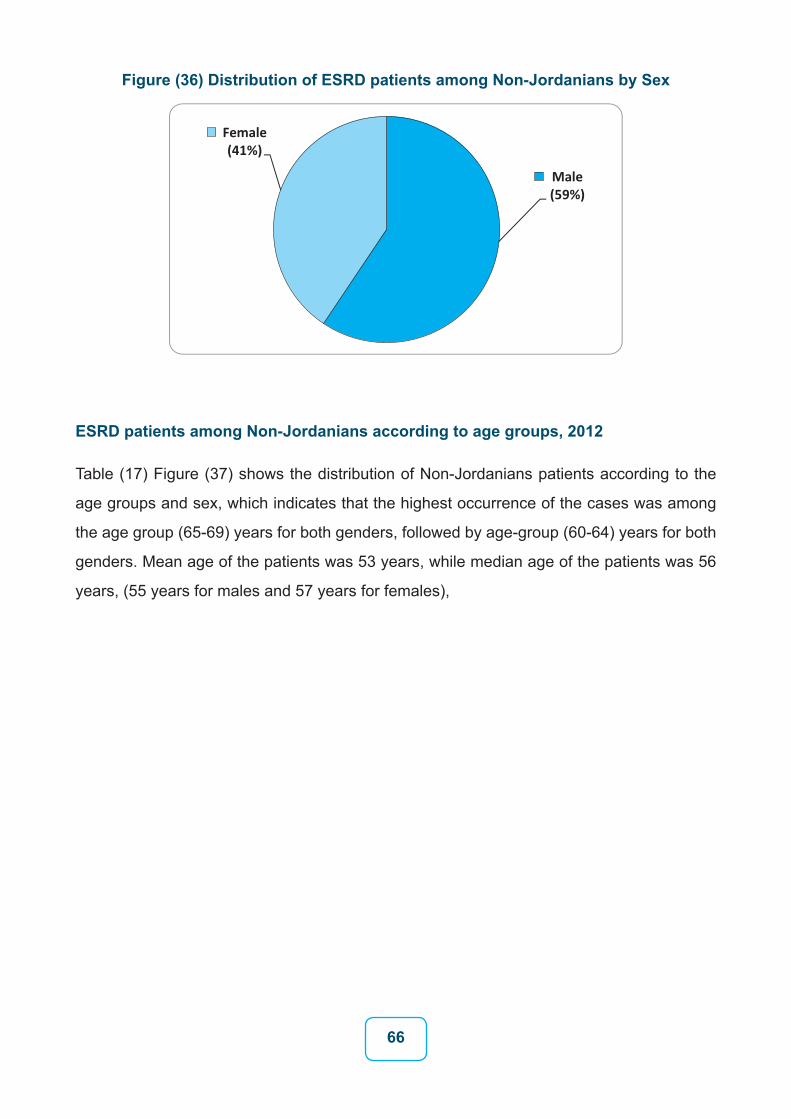
Distribution of ESRD patients among Non-Jordanians by Sex
Figures (36) shows the distribution of Non-Jordanians ESRD patients who attended renal
dialysis units in all Jordanian hospitals during the year 2012 according to sex, the number
of patients treated in the Dialysis Units were 160 patients , there were 95 male patients who
accounted (59%) and 65 female patients accounted ( 41% ),with male to female ratio 1.3:1.
66
Figure (36) Distribution of ESRD patients among Non-Jordanians by Sex
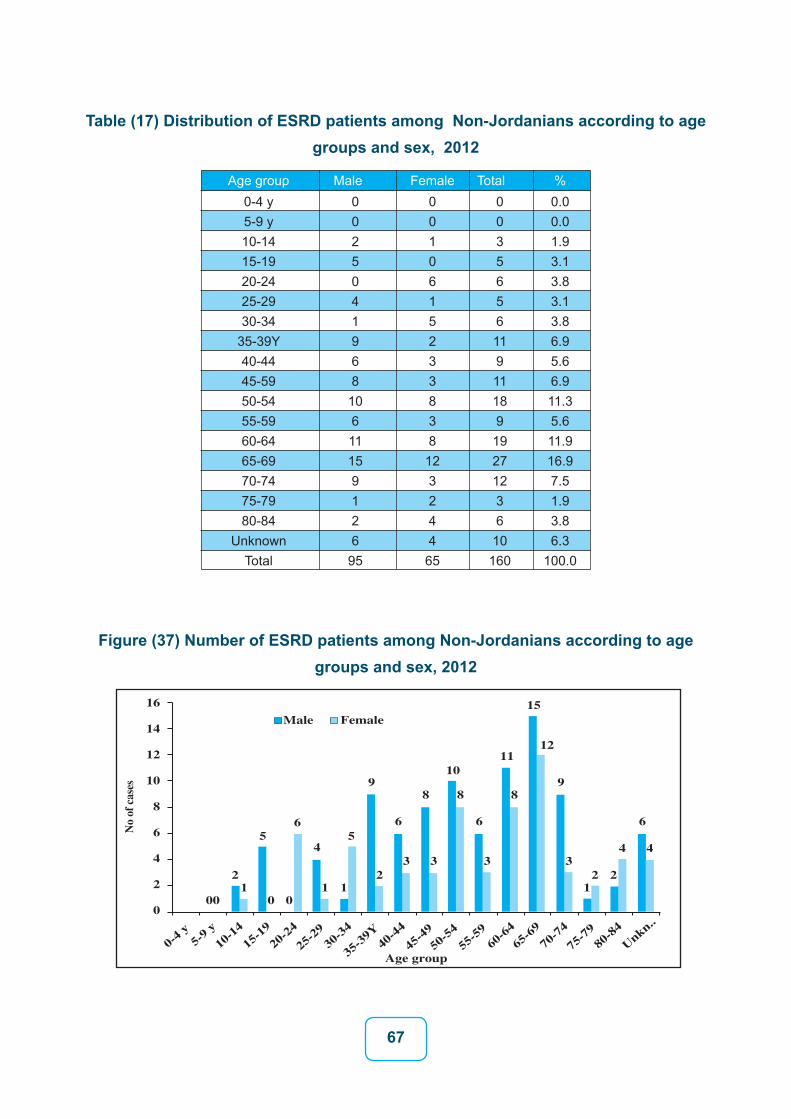
ESRD patients among Non-Jordanians according to age groups, 2012
Table (17) Figure (37) shows the distribution of Non-Jordanians patients according to the
age groups and sex, which indicates that the highest occurrence of the cases was among
the age group (65-69) years for both genders, followed by age-group (60-64) years for both
genders. Mean age of the patients was 53 years, while median age of the patients was 56
years, (55 years for males and 57 years for females),
67
Table (17) Distribution of ESRD patients among Non-Jordanians according to age groups and sex, 2012
Age group0-4 y5-9 y10-1415-1920-2425-2930-34
35-39Y40-4445-5950-5455-5960-6465-6970-7475-7980-84
UnknownTotal
00250419681061115912695
001061523383812324465
0035656119111891927123610160
0.00.01.93.13.83.13.86.95.66.911.35.611.916.97.51.93.86.3
100.0
Male Female Total %
Figure (37) Number of ESRD patients among Non-Jordanians according to age groups and sex, 2012
Male16
14
12
10
8
6
4
2
0
0-4
y5-
9 y
10-1
415
-19
20-2
4
25-2
930
-34
35-3
9Y40
-44
45-4
950
-54
55-5
960
-6465
-69
70-7
4
75-7
980
-84
Unkn..
00
21
5
0 0
6 6 6 6
8889
1011
15
12
9
4
1 1
5
23 3 3 3
12 2
4 4
Female
Age group
No
of c
ases
68
References 1- Annual Report, Jordan, 2012. Department of Statistics (DOS)
2- BRFSS Survey, 2007 Ministry of Health (MOH) Jordan.
3- Cancer incidence in Jordan, MOH, 2010.
4- Global Youth Tobacco Survey, Anti-Smoking Society Association, Jordan.
5- Mortality Data in Jordan, 2007, Ministry of Health, Jordan.
8
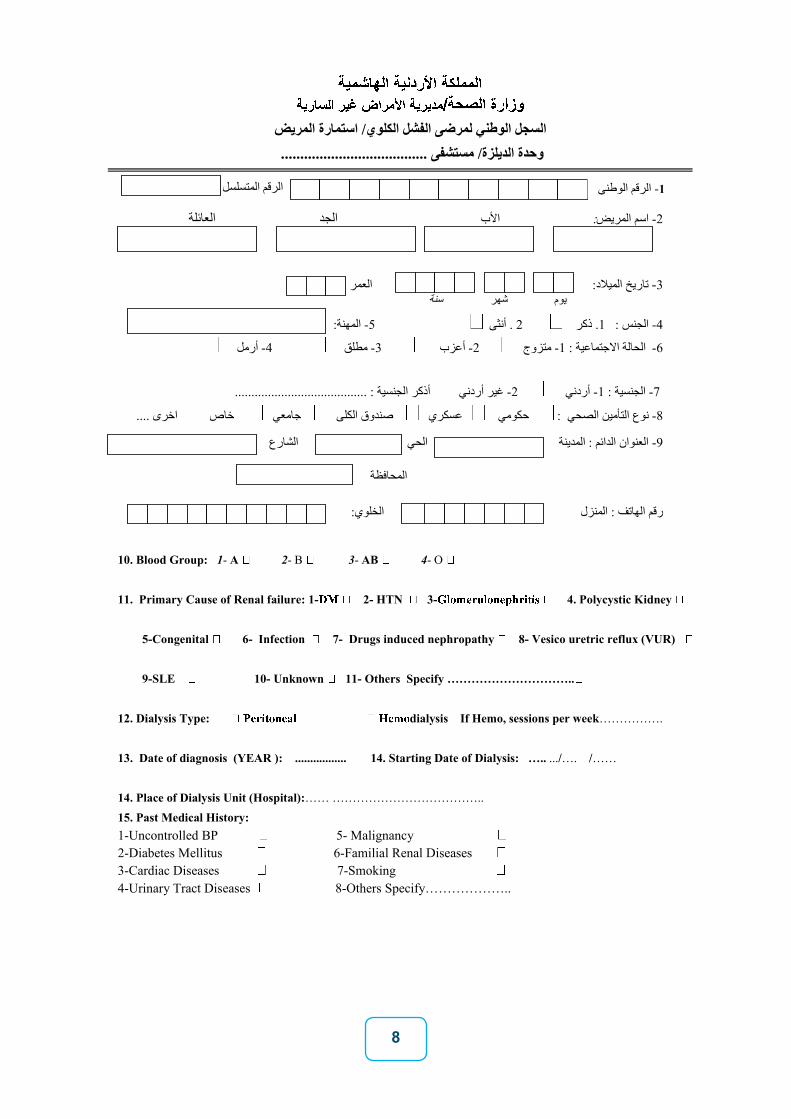
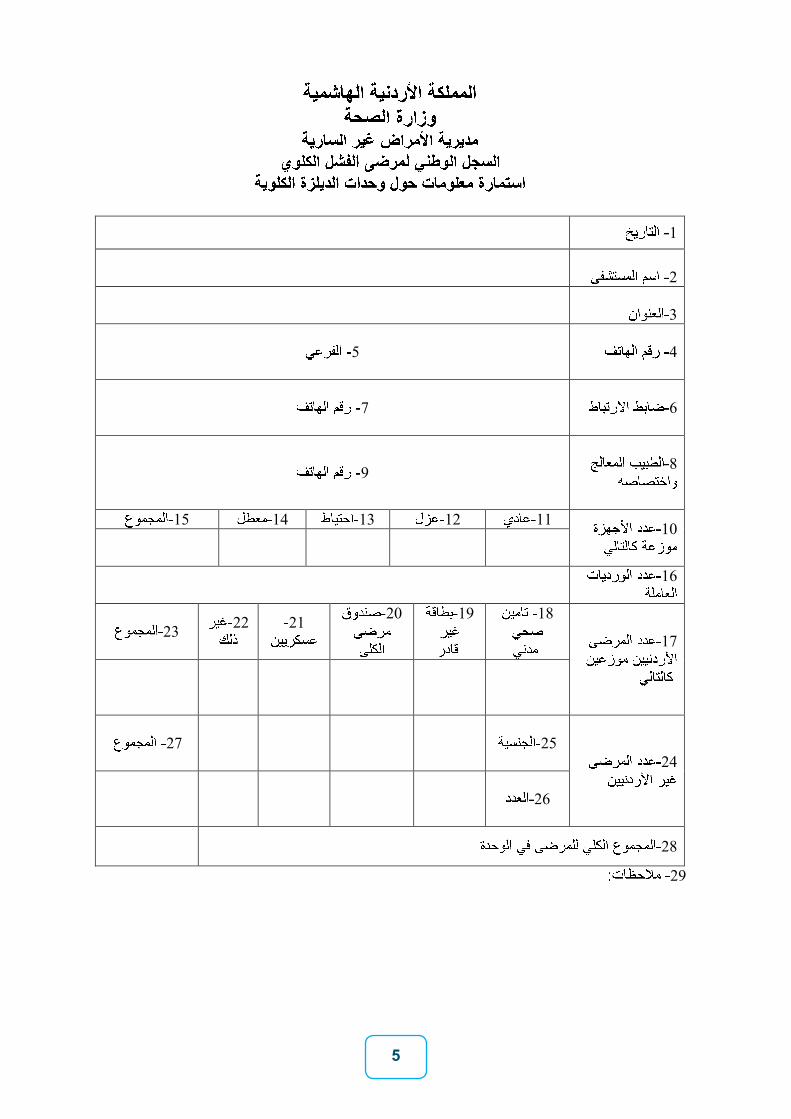
/ استمارة المريضلسجل الوطني لمرضى الفشل الكلويا وحدة الديلزة/ مستشفى ......................................
الرقم المتسلسل
العائلة الجد األب : اسم المريض -2
العمر ا : تاريخ الميالد -3
سنة شهر يوم
المهنة: -5 أنثى . 2 . ذكر 1 الجنس : -4
أرمل -4 مطلق -3 أعزب -2 متزوج -1الحالة االجتماعية : -6
الجنسية : ........................................ أذكر غير أردني -2 أردني -1الجنسية : -7
اخرى .... خاص جامعي صندوق الكلى عسكري حكومي : نوع التأمين الصحي -8
الحي الشارع العنوان الدائم : المدينة -9
:الخلوي : المنزل الهاتفرقم
10. Blood Group: 1- A 2- B 3- AB 4- O 11. Primary Cause of Renal failure: 1- 2- HTN 3- 4. Polycystic Kidney 5-Congenital 6- Infection 7- Drugs induced nephropathy 8- Vesico uretric reflux (VUR) 9-SLE 10- Unknown 11- Others Specify ………………………….. 12. Dialysis Type: dialysis If Hemo, sessions per week……………. 13. Date of diagnosis (YEAR ): ................. 14. Starting Date of Dialysis: ….. .../…. /…… 14. Place of Dialysis Unit (Hospital):…… ……………………………….. 15. Past Medical History: 1-Uncontrolled BP 5- Malignancy 2-Diabetes Mellitus 6-Familial Renal Diseases 3-Cardiac Diseases 7-Smoking 4-Urinary Tract Diseases 8-Others Specify………………..
الرقم الوطني -1
المحافظة
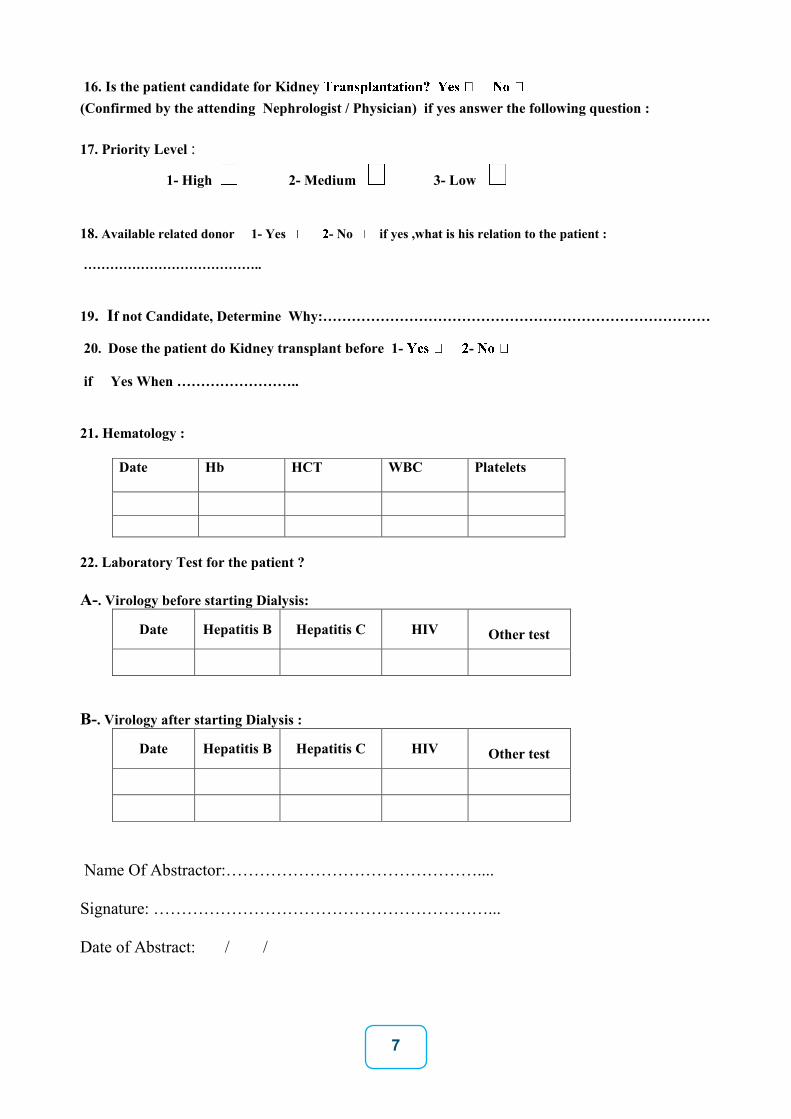
16. Is the patient candidate for Kidney (Confirmed by the attending Nephrologist / Physician) if yes answer the following question : 17. Priority Level :
1- High 2- Medium 3- Low
18. Available related donor 1- Yes - No if yes ,what is his relation to the patient : …………………………………..
19. If not Candidate, Determine Why:……………………………………………………………………… 20. Dose the patient do Kidney transplant before 1- - if Yes When …………………….. 21. Hematology :
Date
Hb HCT WBC Platelets
22. Laboratory Test for the patient ? A-. Virology before starting Dialysis:
Date Hepatitis B Hepatitis C HIV
Other test
B-. Virology after starting Dialysis :
Date Hepatitis B Hepatitis C HIV
Other test
Name Of Abstractor:……………………………………….... Signature: ……………………………………………………... Date of Abstract: / /
7
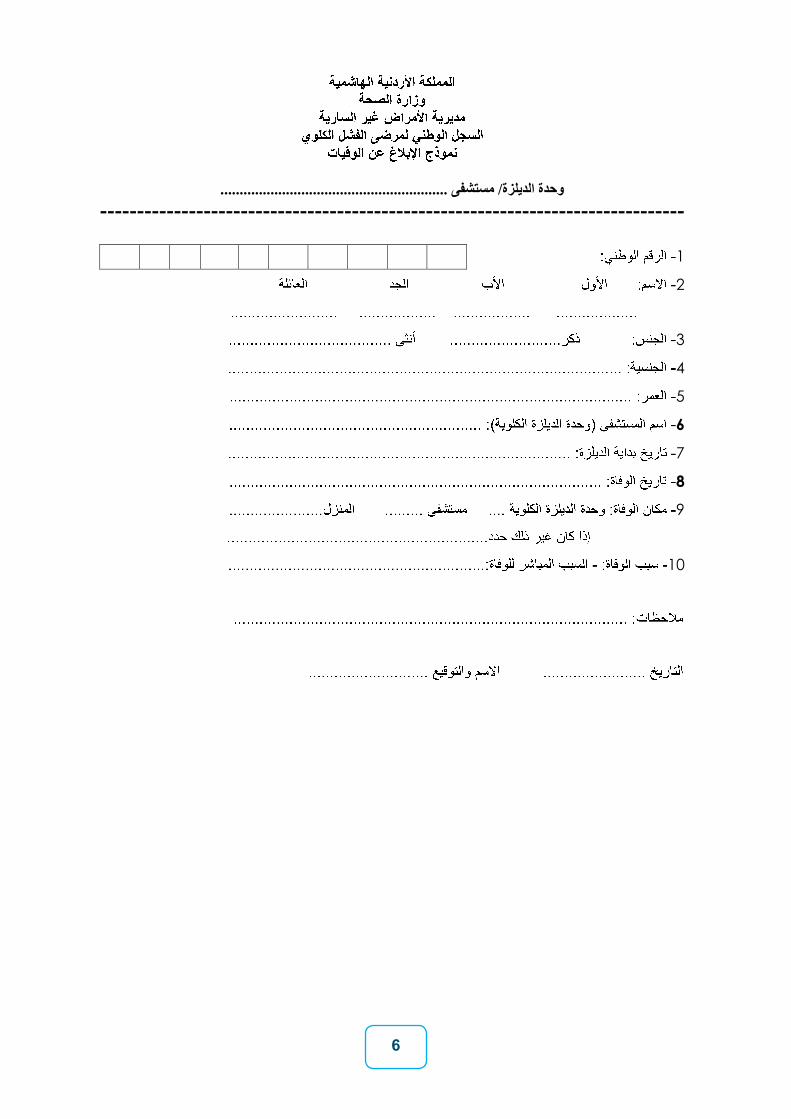
وحدة الديلزة/ مستشفى ...........................................................-------------------------------------------------------------------------------
1
2
3
4
5
6
7
8
9
11
6
1
2
3
4 5
6 7
8 9
111112131415
16
17
181921212223
242527
26
28
29
5
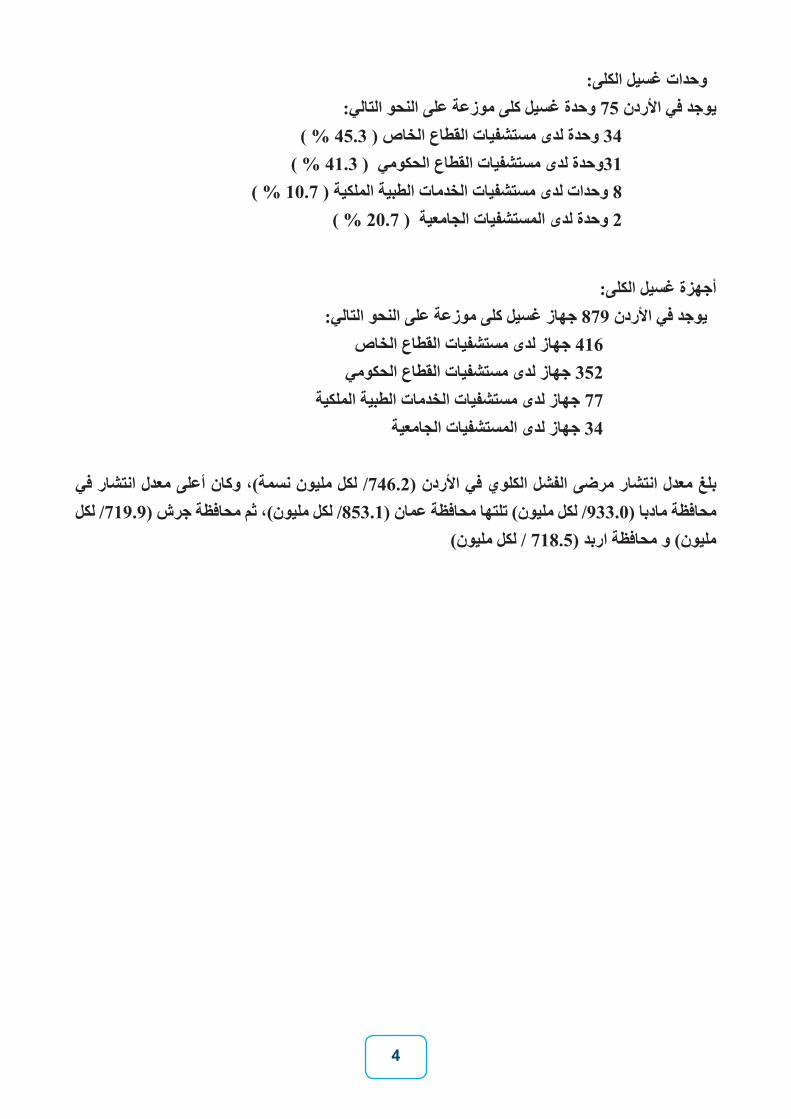
وحدات غسيل الكلى:يوجد في األردن 75 وحدة غسيل كلى موزعة على النحو التالي:
34 وحدة لدى مستشفيات القطاع الخاص ) 45.3 % )31وحدة لدى مستشفيات القطاع الحكومي ) 41.3 % )
8 وحدات لدى مستشفيات الخدمات الطبية الملكية ) 10.7 % ) 2 وحدة لدى المستشفيات الجامعية ) 20.7 % )
أجهزة غسيل الكلى: يوجد في األردن 879 جهاز غسيل كلى موزعة على النحو التالي:
416 جهاز لدى مستشفيات القطاع الخاص352 جهاز لدى مستشفيات القطاع الحكومي
77 جهاز لدى مستشفيات الخدمات الطبية الملكية34 جهاز لدى المستشفيات الجامعية
بلغ معدل انتشار مرضى الفشل الكلوي في األردن )746.2/ لكل مليون نسمة(، وكان أعلى معدل انتشار في محافظة مادبا )933.0/ لكل مليون( تلتها محافظة عمان )853.1/ لكل مليون(، ثم محافظة جرش )719.9/ لكل
مليون( و محافظة اربد )718.5 / لكل مليون(
4
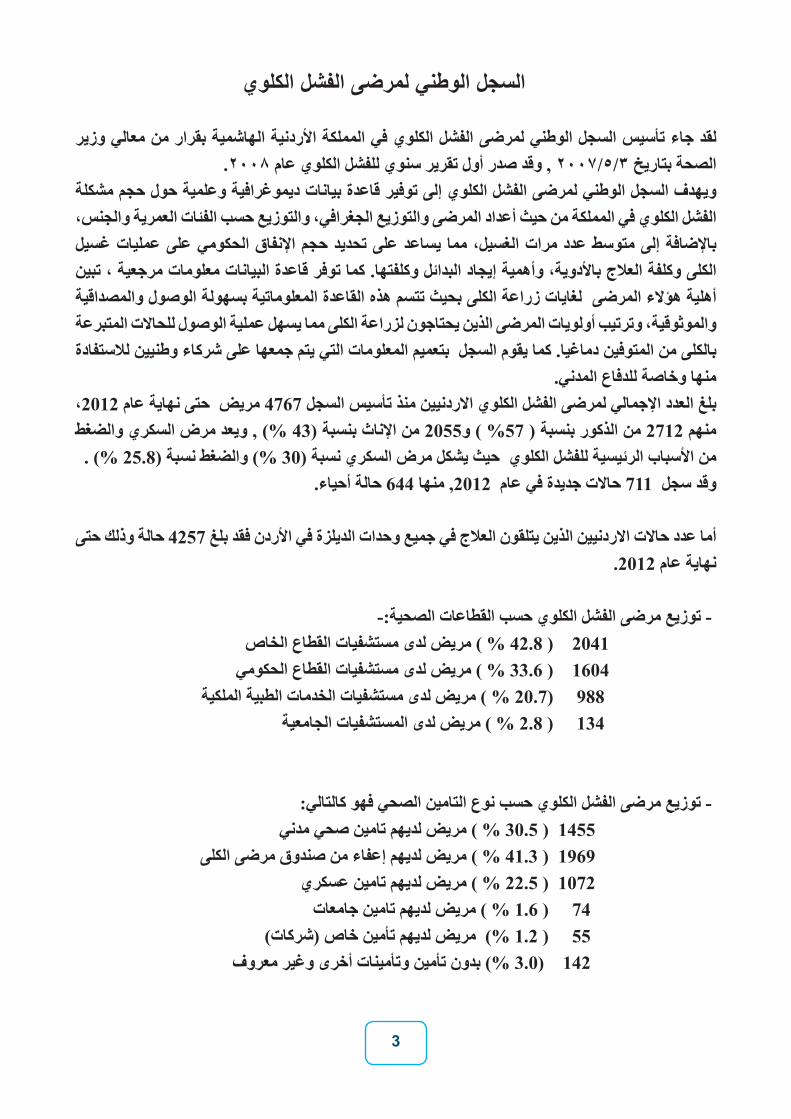
السجل الوطني لمرضى الفشل الكلوي
لقد جاء تأسيس السجل الوطني لمرضى الفشل الكلوي في المملكة األردنية الهاشمية بقرار من معالي وزير الصحة بتاريخ 2007/5/3 , وقد صدر أول تقرير سنوي للفشل الكلوي عام 2008.
ويهدف السجل الوطني لمرضى الفشل الكلوي إلى توفير قاعدة بيانات ديموغرافية وعلمية حول حجم مشكلة الفشل الكلوي في المملكة من حيث أعداد المرضى والتوزيع الجغرافي، والتوزيع حسب الفئات العمرية والجنس، غسيل عمليات على الحكومي اإلنفاق حجم تحديد على يساعد الغسيل، مما مرات عدد متوسط إلى باإلضافة الكلى وكلفة العالج باألدوية، وأهمية إيجاد البدائل وكلفتها. كما توفر قاعدة البيانات معلومات مرجعية ، تبين أهلية هؤالء المرضى لغايات زراعة الكلى بحيث تتسم هذه القاعدة المعلوماتية بسهولة الوصول والمصداقية والموثوقية، وترتيب أولويات المرضى الذين يحتاجون لزراعة الكلى مما يسهل عملية الوصول للحاالت المتبرعة بالكلى من المتوفين دماغيا. كما يقوم السجل بتعميم المعلومات التي يتم جمعها على شركاء وطنيين لالستفادة
منها وخاصة للدفاع المدني.بلغ العدد اإلجمالي لمرضى الفشل الكلوي االردنيين منذ تأسيس السجل 4767 مريض حتى نهاية عام 2012، منهم 2712 من الذكور بنسبة ( 57% ) و2055 من اإلناث بنسبة (43 %) , ويعد مرض السكري والضغط
من األسباب الرئيسية للفشل الكلوي حيث يشكل مرض السكري نسبة (30 %) والضغط نسبة (25.8 %) .وقد سجل 711 حاالت جديدة في عام 2012, منها 644 حالة أحياء.
أما عدد حاالت االردنيين الذين يتلقون العالج في جميع وحدات الديلزة في األردن فقد بلغ 4257 حالة وذلك حتى نهاية عام 2012.
- توزيع مرضى الفشل الكلوي حسب القطاعات الصحية:- 2041 ( 42.8 % ) مريض لدى مستشفيات القطاع الخاص
1604 ( 33.6 % ) مريض لدى مستشفيات القطاع الحكومي 988 (20.7 % ) مريض لدى مستشفيات الخدمات الطبية الملكية
134 ( 2.8 % ) مريض لدى المستشفيات الجامعية
- توزيع مرضى الفشل الكلوي حسب نوع التامين الصحي فهو كالتالي: 1455 ( 30.5 % ) مريض لديهم تامين صحي مدني
1969 ( 41.3 % ) مريض لديهم إعفاء من صندوق مرضى الكلى 1072 ( 22.5 % ) مريض لديهم تامين عسكري
74 ( 1.6 % ) مريض لديهم تامين جامعات 55 ( 1.2 %) مريض لديهم تأمين خاص (شركات)
142 (3.0 %) بدون تأمين وتأمينات أخرى وغير معروف
3

المملكة األردنية الهاشـمية
وزارة الصحة
مديرية األمراض غير السارية
السجل الوطني لمرضى الفشل الكلوي
وبائية الفشل الكلوي في األردن
لعام 2012
إعداد
الدكتور محمد الطراونة الدكتور سالم القيسي


