The hemodynamic effects of acute aortic regurgitation into a stiffened left ventricle resulting from chronic aortic stenosis Ikechukwu Okafor a , Vrishank Raghav a , Prem Midha a , Gautam Kumar, MD b , Ajit Yoganathan, PhD a,* a Georgia Institute of Technology, Atlanta, GA b Emory University Hospitals, Atlanta, GA Abstract Acute aortic regurgitation (AR) post chronic aortic stenosis is a prevalent phenomenon occurring in patients who undergo transcatheter aortic valve replacement (TAVR) surgery. The objective of this work was to characterize the effects of left ventricular diastolic stiffness (LVDS) and AR severity on LV performance. Three LVDS models were inserted into a physiological left heart simulator. AR severity was parametrically varied through 4 levels (ranging from trace to moderate) and compared to a competent aortic valve. Hemodynamic metrics such as average diastolic pressures (DP) and reduction in trans-mitral flow were measured. AR index was calculated as a function of AR severity and LVDS, and the work required to make up for lost volume due to AR was estimated. In the presence of trace AR, higher LVDS had up to a threefold reduction in trans-mitral flow (13% compared to 3.5%) and a significant increase in DP (two-fold). The AR index ranged from 42 to 16 (no AR to moderate AR), with stiffer LVs having lower values. To compensate for lost volume due to AR, the low, medium, and high LVDS models were found to require 5.1, 5.5, and 6.6 times more work, respectively. This work shows that the LVDS has a significant effect on the LV performance in the presence of AR. Therefore, the LVDS of potential TAVR patients should be assessed to gain an initial indication of their ability to tolerate post-procedural AR. New and Noteworthy This study has demonstrated the hemodynamic effects of acute aortic regurgitation (AR) on a left ventricle (LV) which has expe- rienced chronic aortic stenosis (AS). The LV diastolic stiffness resulting from chronic AS dramatically alters the LV’s ability to compensate for the lost volume due to AR. Keywords: aortic regurgitation, left ventricle diastolic stiffness, AR index, left heart simulator, transcatheter aortic valve replacement 1. Introduction The purpose of the aortic valve (AV) is to prevent the back- flow of blood into the left ventricle (LV) from the aorta. Im- pairment of this function results in retrograde flow from a high- pressure aorta into a lower pressure LV. This complication can result from a multitude of pathological events that can affect the valve primarily e.g. endocarditis, rheumatic disease or af- fect the ascending aorta primarily e.g. ankylosing spondylitis, idiopathic dilation of the aorta, Marfan syndrome, etc. (1, 2, 3). However, a new mechanism for aortic regurgitation (AR), com- monly known as paravalvular leak, stems from a relatively re- cent AV replacement technique - transcatheter aortic valve re- placement (TAVR). Though this minimally invasive surgical technique has many advantages for the treatment of high-risk and inoperable aortic stenosis (AS) patients, it usually results * Wallace H Coulter Department of Biomedical Engineering Georgia Institute of Technology and Emory University Technology Enterprise Park, Suite 200 387 Technology Circle, Atlanta, GA 30313 Email address: [email protected](Ajit Yoganathan, PhD) in trace to mild, and in some cases moderate, paravalvular AR (4, 5, 6, 7). This complication (paravalvular AR) has sig- nificant correlation to increased patient mortality (4, 5, 6, 7, 8). When compared to patients who have isolated AR, the 1-year mortality rate of mild AR patients with pre-existing AS is about 3 to 4 times higher (5, 8). The pre-existing isolated AS in TAVR patients has most likely resulted in an increase in the transvalvu- lar pressure gradient across the AV, eventually leading to my- ocardial hypertrophy. Myocardial stiffening impairs LV relax- ation during the diastolic phase of the cardiac cycle (9, 10). Compounding the pathological changes due to isolated chronic AS with the effects of AR compromises the LV’s ability to in- crease its end diastolic volume (EDV) effectively, hence the to- tal stroke volume (SV) and forward SV decrease (11, 12, 9). It is therefore suspected that this sudden change from pressure overload due to AS, to volume overload resulting from acute AR, affects patient survival. To gain deeper insight on the severity of AR post-chronic AS, Sinning et al. proposed a new metric to supplement what is clinically used for AR classification, the AR index (13). This novel metric utilizes the ratio of the pressure gradient across the AV during diastole to the peak systolic aortic pressure. Sin- Accepted Postprint submitted to American Journal of Physiology April 18, 2016
Transcript
The hemodynamic effects of acute aortic regurgitation into a stiffened left ventricleresulting from chronic aortic stenosis
aGeorgia Institute of Technology, Atlanta, GAbEmory University Hospitals, Atlanta, GA
Abstract
Acute aortic regurgitation (AR) post chronic aortic stenosis is a prevalent phenomenon occurring in patients who undergotranscatheter aortic valve replacement (TAVR) surgery. The objective of this work was to characterize the effects of left ventriculardiastolic stiffness (LVDS) and AR severity on LV performance. Three LVDS models were inserted into a physiological left heartsimulator. AR severity was parametrically varied through 4 levels (ranging from trace to moderate) and compared to a competentaortic valve. Hemodynamic metrics such as average diastolic pressures (DP) and reduction in trans-mitral flow were measured.AR index was calculated as a function of AR severity and LVDS, and the work required to make up for lost volume due to ARwas estimated. In the presence of trace AR, higher LVDS had up to a threefold reduction in trans-mitral flow (13% compared to3.5%) and a significant increase in DP (two-fold). The AR index ranged from 42 to 16 (no AR to moderate AR), with stiffer LVshaving lower values. To compensate for lost volume due to AR, the low, medium, and high LVDS models were found to require5.1, 5.5, and 6.6 times more work, respectively. This work shows that the LVDS has a significant effect on the LV performance inthe presence of AR. Therefore, the LVDS of potential TAVR patients should be assessed to gain an initial indication of their abilityto tolerate post-procedural AR.
New and NoteworthyThis study has demonstrated the hemodynamic effects of acute aortic regurgitation (AR) on a left ventricle (LV) which has expe-rienced chronic aortic stenosis (AS). The LV diastolic stiffness resulting from chronic AS dramatically alters the LV’s ability tocompensate for the lost volume due to AR.
Keywords: aortic regurgitation, left ventricle diastolic stiffness, AR index, left heart simulator, transcatheter aortic valvereplacement
1. Introduction
The purpose of the aortic valve (AV) is to prevent the back-flow of blood into the left ventricle (LV) from the aorta. Im-pairment of this function results in retrograde flow from a high-pressure aorta into a lower pressure LV. This complication canresult from a multitude of pathological events that can affectthe valve primarily e.g. endocarditis, rheumatic disease or af-fect the ascending aorta primarily e.g. ankylosing spondylitis,idiopathic dilation of the aorta, Marfan syndrome, etc. (1, 2, 3).However, a new mechanism for aortic regurgitation (AR), com-monly known as paravalvular leak, stems from a relatively re-cent AV replacement technique - transcatheter aortic valve re-placement (TAVR). Though this minimally invasive surgicaltechnique has many advantages for the treatment of high-riskand inoperable aortic stenosis (AS) patients, it usually results
∗Wallace H Coulter Department of Biomedical EngineeringGeorgia Institute of Technology and Emory UniversityTechnology Enterprise Park, Suite 200387 Technology Circle, Atlanta, GA 30313
in trace to mild, and in some cases moderate, paravalvularAR (4, 5, 6, 7). This complication (paravalvular AR) has sig-nificant correlation to increased patient mortality (4, 5, 6, 7, 8).
When compared to patients who have isolated AR, the 1-yearmortality rate of mild AR patients with pre-existing AS is about3 to 4 times higher (5, 8). The pre-existing isolated AS in TAVRpatients has most likely resulted in an increase in the transvalvu-lar pressure gradient across the AV, eventually leading to my-ocardial hypertrophy. Myocardial stiffening impairs LV relax-ation during the diastolic phase of the cardiac cycle (9, 10).Compounding the pathological changes due to isolated chronicAS with the effects of AR compromises the LV’s ability to in-crease its end diastolic volume (EDV) effectively, hence the to-tal stroke volume (SV) and forward SV decrease (11, 12, 9).It is therefore suspected that this sudden change from pressureoverload due to AS, to volume overload resulting from acuteAR, affects patient survival.
To gain deeper insight on the severity of AR post-chronicAS, Sinning et al. proposed a new metric to supplement whatis clinically used for AR classification, the AR index (13). Thisnovel metric utilizes the ratio of the pressure gradient acrossthe AV during diastole to the peak systolic aortic pressure. Sin-
Accepted Postprint submitted to American Journal of Physiology April 18, 2016
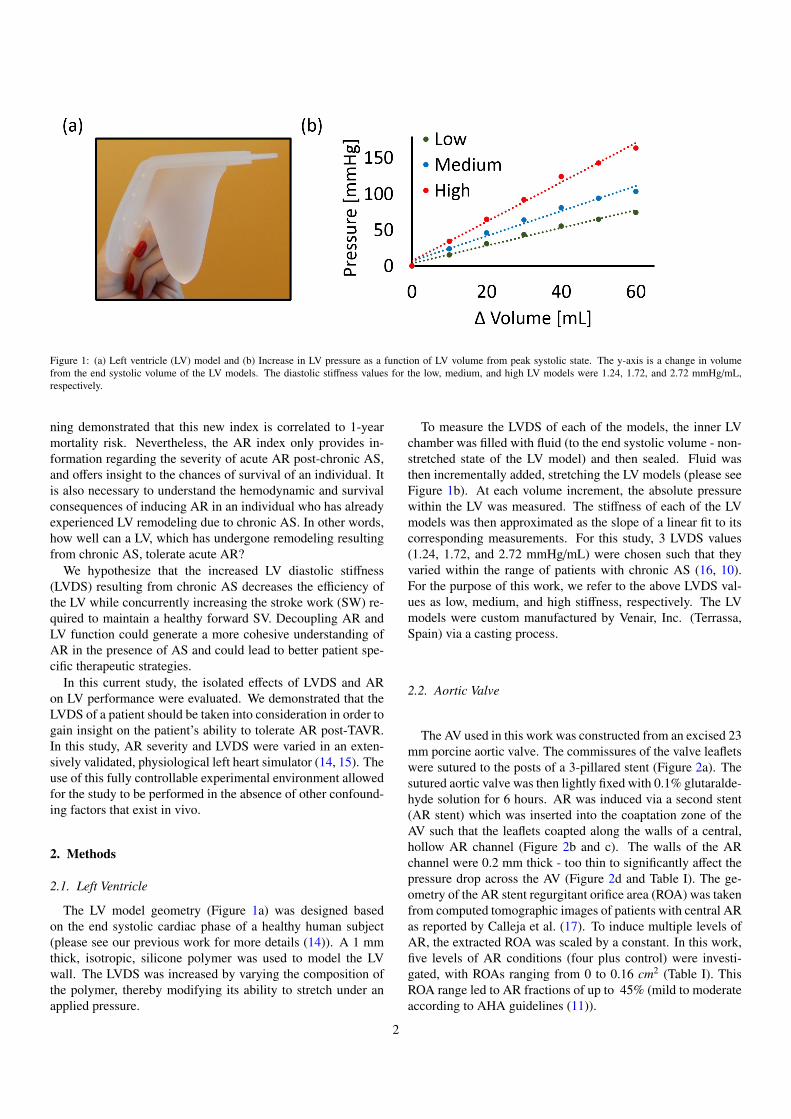
Figure 1: (a) Left ventricle (LV) model and (b) Increase in LV pressure as a function of LV volume from peak systolic state. The y-axis is a change in volumefrom the end systolic volume of the LV models. The diastolic stiffness values for the low, medium, and high LV models were 1.24, 1.72, and 2.72 mmHg/mL,respectively.
ning demonstrated that this new index is correlated to 1-yearmortality risk. Nevertheless, the AR index only provides in-formation regarding the severity of acute AR post-chronic AS,and offers insight to the chances of survival of an individual. Itis also necessary to understand the hemodynamic and survivalconsequences of inducing AR in an individual who has alreadyexperienced LV remodeling due to chronic AS. In other words,how well can a LV, which has undergone remodeling resultingfrom chronic AS, tolerate acute AR?
We hypothesize that the increased LV diastolic stiffness(LVDS) resulting from chronic AS decreases the efficiency ofthe LV while concurrently increasing the stroke work (SW) re-quired to maintain a healthy forward SV. Decoupling AR andLV function could generate a more cohesive understanding ofAR in the presence of AS and could lead to better patient spe-cific therapeutic strategies.
In this current study, the isolated effects of LVDS and ARon LV performance were evaluated. We demonstrated that theLVDS of a patient should be taken into consideration in order togain insight on the patient’s ability to tolerate AR post-TAVR.In this study, AR severity and LVDS were varied in an exten-sively validated, physiological left heart simulator (14, 15). Theuse of this fully controllable experimental environment allowedfor the study to be performed in the absence of other confound-ing factors that exist in vivo.
2. Methods
2.1. Left Ventricle
The LV model geometry (Figure 1a) was designed basedon the end systolic cardiac phase of a healthy human subject(please see our previous work for more details (14)). A 1 mmthick, isotropic, silicone polymer was used to model the LVwall. The LVDS was increased by varying the composition ofthe polymer, thereby modifying its ability to stretch under anapplied pressure.
To measure the LVDS of each of the models, the inner LVchamber was filled with fluid (to the end systolic volume - non-stretched state of the LV model) and then sealed. Fluid wasthen incrementally added, stretching the LV models (please seeFigure 1b). At each volume increment, the absolute pressurewithin the LV was measured. The stiffness of each of the LVmodels was then approximated as the slope of a linear fit to itscorresponding measurements. For this study, 3 LVDS values(1.24, 1.72, and 2.72 mmHg/mL) were chosen such that theyvaried within the range of patients with chronic AS (16, 10).For the purpose of this work, we refer to the above LVDS val-ues as low, medium, and high stiffness, respectively. The LVmodels were custom manufactured by Venair, Inc. (Terrassa,Spain) via a casting process.
2.2. Aortic Valve
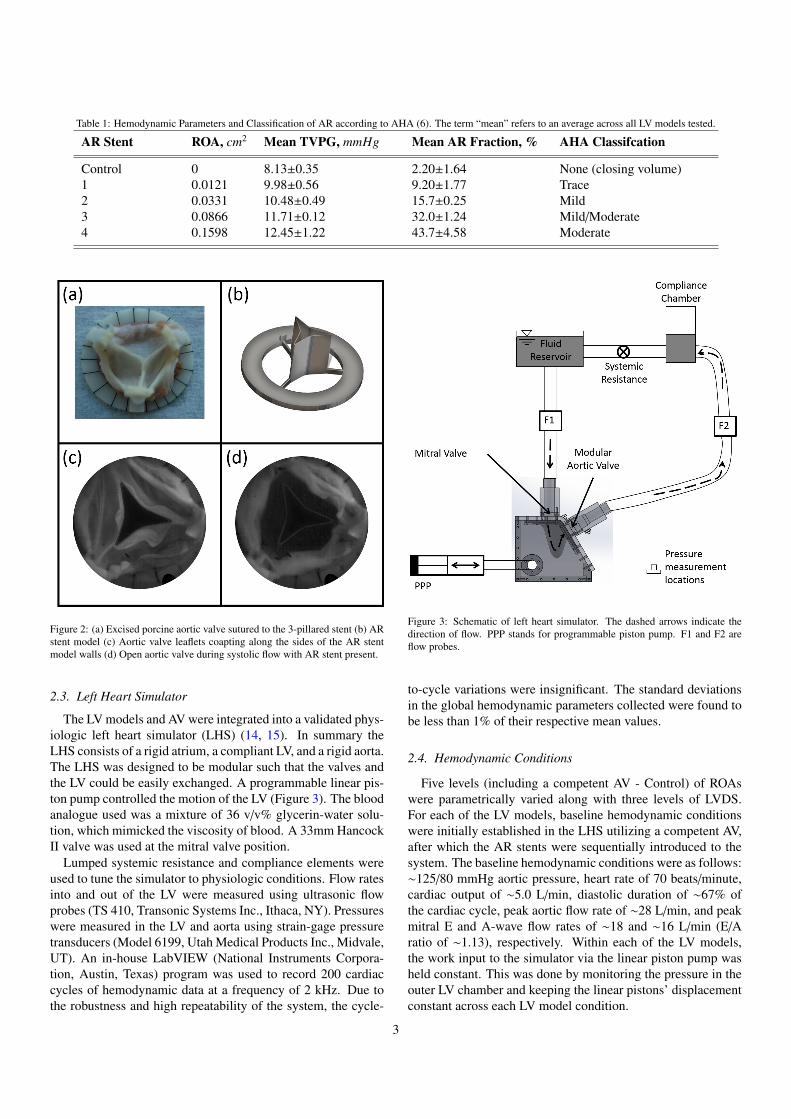
The AV used in this work was constructed from an excised 23mm porcine aortic valve. The commissures of the valve leafletswere sutured to the posts of a 3-pillared stent (Figure 2a). Thesutured aortic valve was then lightly fixed with 0.1% glutaralde-hyde solution for 6 hours. AR was induced via a second stent(AR stent) which was inserted into the coaptation zone of theAV such that the leaflets coapted along the walls of a central,hollow AR channel (Figure 2b and c). The walls of the ARchannel were 0.2 mm thick - too thin to significantly affect thepressure drop across the AV (Figure 2d and Table I). The ge-ometry of the AR stent regurgitant orifice area (ROA) was takenfrom computed tomographic images of patients with central ARas reported by Calleja et al. (17). To induce multiple levels ofAR, the extracted ROA was scaled by a constant. In this work,five levels of AR conditions (four plus control) were investi-gated, with ROAs ranging from 0 to 0.16 cm2 (Table I). ThisROA range led to AR fractions of up to 45% (mild to moderateaccording to AHA guidelines (11)).
2
Table 1: Hemodynamic Parameters and Classification of AR according to AHA (6). The term “mean” refers to an average across all LV models tested.
AR Stent ROA, cm2 Mean TVPG, mmHg Mean AR Fraction, % AHA Classifcation
Figure 2: (a) Excised porcine aortic valve sutured to the 3-pillared stent (b) ARstent model (c) Aortic valve leaflets coapting along the sides of the AR stentmodel walls (d) Open aortic valve during systolic flow with AR stent present.
2.3. Left Heart Simulator
The LV models and AV were integrated into a validated phys-iologic left heart simulator (LHS) (14, 15). In summary theLHS consists of a rigid atrium, a compliant LV, and a rigid aorta.The LHS was designed to be modular such that the valves andthe LV could be easily exchanged. A programmable linear pis-ton pump controlled the motion of the LV (Figure 3). The bloodanalogue used was a mixture of 36 v/v% glycerin-water solu-tion, which mimicked the viscosity of blood. A 33mm HancockII valve was used at the mitral valve position.
Lumped systemic resistance and compliance elements wereused to tune the simulator to physiologic conditions. Flow ratesinto and out of the LV were measured using ultrasonic flowprobes (TS 410, Transonic Systems Inc., Ithaca, NY). Pressureswere measured in the LV and aorta using strain-gage pressuretransducers (Model 6199, Utah Medical Products Inc., Midvale,UT). An in-house LabVIEW (National Instruments Corpora-tion, Austin, Texas) program was used to record 200 cardiaccycles of hemodynamic data at a frequency of 2 kHz. Due tothe robustness and high repeatability of the system, the cycle-
Figure 3: Schematic of left heart simulator. The dashed arrows indicate thedirection of flow. PPP stands for programmable piston pump. F1 and F2 areflow probes.
to-cycle variations were insignificant. The standard deviationsin the global hemodynamic parameters collected were found tobe less than 1% of their respective mean values.
2.4. Hemodynamic Conditions
Five levels (including a competent AV - Control) of ROAswere parametrically varied along with three levels of LVDS.For each of the LV models, baseline hemodynamic conditionswere initially established in the LHS utilizing a competent AV,after which the AR stents were sequentially introduced to thesystem. The baseline hemodynamic conditions were as follows:∼125/80 mmHg aortic pressure, heart rate of 70 beats/minute,cardiac output of ∼5.0 L/min, diastolic duration of ∼67% ofthe cardiac cycle, peak aortic flow rate of ∼28 L/min, and peakmitral E and A-wave flow rates of ∼18 and ∼16 L/min (E/Aratio of ∼1.13), respectively. Within each of the LV models,the work input to the simulator via the linear piston pump washeld constant. This was done by monitoring the pressure in theouter LV chamber and keeping the linear pistons’ displacementconstant across each LV model condition.
3
Figure 4: Representative mitral and aortic flow curves for all AR levels - LowLVDS model.
3. Results
3.1. Changes in LV Hemodynamics
For all LV models tested, AR severity increased with increas-ing ROA (ranging from none to moderate AR - Table I), lead-ing to a decrease in the effective CO. Figure 4 shows that thepeak aortic flow rate for all ROAs studied remained relativelyconstant at approximately 28 L/min. The LV filling rate viathe mitral valve (MV) was found to decrease during the E andA-waves as ROA increased. This decrease in LV filling ratewas more pronounced as LV diastolic stiffness increased. Fig-ure 5 shows a difference in the temporal integration of LV fill-ing curves via the MV of each experimental condition from itsrespective control case (no AR). It indicates the changes thatoccur in LV filling volume as LVDS increased. As the LVDSincreased by a factor of ∼2, the corresponding reductions in LVfilling volumes as AR was induced increased. This increasein the reduction of LV filling was more apparent for lower ARfractions.
Figure 5: Percent reduction in trans-mitral filling as a function of AR severityand LVDS. The legend represents LVDS.
Due to an increase in the back pressure from the aorta, theDP within the LV increased as ROA increased. The LVDP wasalso observed to increase as LVDS was increased as depicted inFigure 6. This rate of increase in LVDP as ROA increased wasfound to be similar across LV models.
Figure 6: Increase in LVDP as a functions of AR severity and LVDS. Thelegend represents the severity of LV stiffness.
3.2. AR Index
The AR index was calculated using Equation 1 below (13)
AR INDEX = 100 ×DBP − LVEDP
S BP(1)
where DBP is diastolic blood pressure in the aorta, LVEDP isthe left ventricular end diastolic pressure, and SBP is the sys-tolic blood pressure in the aorta. Figure 7 shows the changein the AR index as a function of AR severity and LVDS. Thevalues of AR index measured in the study ranged from approx-imately 42 to 16. As ROA increased, the AR index decreased.In the same fashion, it was observed that as LVDS increased,the AR index decreased. The reduction in AR index as a func-tion of ROA was quantitatively similar when comparing all LVmodels studied.
3.3. Additional Stroke Work Requirement
To determine how much more work the LV would have togenerate to make up for the lost volume during AR, for eachROA, the SV was increased such that the effective cardiac out-put was increased back to the original 5.0 L/min. For each ofthose cases, the SW was calculated using Equation 2 below:
S W =
∮C
PdV (2)
where P and V are the pressure and volume in the LV model,respectively, and C indicates that the integration was performedover the closed pressure-volume loop.
Figure 8 illustrates the percent additional SW required bythe LV to maintain a CO of 5.0 L/min as a function of ROAfor each of the LV models. Each individual plot is the per-centage difference from its respective baseline (with no ROA).Hence, an additional SW requirement of 10% indicates a 110%energy requirement was necessary, for that specific LV model,to maintain an effective cardiac output of 5.0 L/min. A linearregression analysis was performed with a goodness of fit, R2.The slope of the regression describes the fold change in workneeded per cm2 of ROA. It was found that as LVDS increased,
4
Figure 7: AR index as a function of AR severity and LVDS. The horizontal line represents the cutoff value for survival at 1 year as determined by Sinning et al. (13).The legend represents the severity of LVDS. The numbers above each individual bar are the aortic systolic/diastolic pressures in mmHg.
Figure 8: Percent additional SW required to increase the cardiac output back to5.0 L/min as a function of AR severity.
the slope of the linear regression increased. The slopes fromFigure 8 revealed that for the low, medium, and high diastolicstiffness models, the LV would need to work 5.1, 5.5, and 6.6times harder, respectively, per square-centimeter of ROA.
4. Discussion
In this study, we quantitatively evaluated the effects of LVDSon LV performance in the presence of AR. For each of the dif-ferent levels of LVDS, AR was parametrically varied from noneto moderate AR. The AR index was used as a metric to estimateAR tolerance by the LV as it has previously been shown to cor-relate strongly to high mortality (13).
Before the TAVR procedure is carried out, improved pre-procedural data have the potential to determine a patient’s abil-ity to tolerate different levels of AR. This becomes increasinglyimportant as TAVR indications expand towards lower risk pa-tients (18). From previous studies, we understand that for pa-tients to tolerate AR, the LV must be able to compensate for theextra volume returning from the aorta (19, 20, 21, 22, 9). Inthe case of patients with preexisting chronic AS, this compen-satory mechanism is diminished (9). It is, therefore, importantto estimate the LVDS pre-surgery, to gain an indication of howmuch AR the LV may tolerate. Furthermore, there is a need tounderstand the physiology of the LV performance as a functionof AR severity and LVDS.
In this study, we observed a decrease in trans-mitral flowas AR increased and this effect was exacerbated as the LVDSincreased. Furthermore, the rate of filling of the LV alsodecreased with increasing LVDS. This observed phenomenonwas due to the rate of equalization of pressures between theleft atrium and LV as a function of cardiac cycle diastolictime (23, 24). The increase in the rate of pressure equaliza-tion is affected by the LVs myocardium’s ability to stretch dur-ing both passive and active filling (24, 25). As the regurgitantflow from the aorta is forced into the LV, the lack of myocardialdiastolic compliance prevents the LV from stretching to accom-modate the extra volume, hence raising the LVDP (Figures 5
5
and 6) (26). This increase in LVDP is an increase in the preloadwhich the atrial pressure must then overcome in order for ade-quate LV filling via the mitral valve to occur.
The values of AR index measured in the study ranged fromapproximately 42 to 16. Figure 6 shows an increase in theLVDP as LVDS was increased. In Figure 7, we clearly ob-serve that higher LVDS decreased the AR index. Sinning etal. correlated this index to survival of TAVR patients with ARand showed statistical evidence that a cutoff value of 25 wasoptimal for survival one year post-surgery (13). Based on thisvalue, Figure 7 shows that for the highest LVDS, even trace ARwas sufficient to push the AR index close to the threshold. Ev-ery other AR severity case for this LV model fell below thiscutoff value. For the low LVDS case, the AR index was abovethe cutoff until the AR severity was at a moderate level, whereit fell just below the threshold. These results emphasize the ef-fectiveness of LVDS as a metric to evaluate the AR toleranceof patients prior to aortic valve replacement. They indicate thatpatients with low LVDS could have a higher tolerance to post-intervention AR.
From the definition of the AR index (Equation 1), either alarge numerator (DBP - LVEDP) or a small denominator (SBP)is preferred - both would lead to higher AR index values (13).The reduction of the difference between DBP in the aorta andthe LVEDP results from AR, as the pressures in the aorta de-creases due to blood leaking into the LV (9). Simultaneously,the LVDP increases as the LV chamber is no longer sealedoff from the much greater systemic pressures. This increasein LVDP is further intensified as LVDS increases (27). Onthe other hand, a lower SBP can be obtained by reducing thesystemic resistance (or pressure). However, unlike acute AR,during chronic AR, the LV attempts to remodel such that it isable to push out the lost volume resulting from the backflow ofblood. This inherently raises the SBP, and hence, lowers the ARindex. It is therefore, important to note that the AR index is onlya complementary parameter to be used to assess AR severity.
Finally, to gain an idea of the extra workload imposed on theLV as a result of AR severity, Figure 8 depicts the percent ad-ditional SW required as a function of ROA for each of the LVmodels studied. In basic terms, the LV SW is a multiplication ofpressure and volume. Again, as the change in volumes acrossall the LV models were similar, the only parameter which af-fected the calculated SW was the difference in pressures. Theresults show that the LV model with the highest LVDS has towork approximately 30% harder than the lowest stiffness modelin the presence of AR. We speculate that this difference is toogreat for the LV to compensate for, which could be the rea-son why mild/moderate AR post-TAVR results in high mortal-ity (28, 29, 18, 30, 7).
5. Limitations
While the results of this study have important clinical im-plications, a few limitations need to be noted. Firstly, the LVmodels used in this work were isotropic in nature, meaningthey were idealized and uniform in terms of LVDS and geom-etry. Secondly, this study was conducted using an idealized
in vitro simulator, which does not contain the multiple diseaseconfounders, which exist in patients undergoing the TAVR pro-cedure. However, an in vitro model such as this allows for fullycontrolled parametric studies to be performed, ensuring that thedifferences being observed are only a result of the altered pa-rameter. Thirdly, central AR (not paravalvular) was modeledin this study; however, the metrics analyzed resulted from bulkhemodynamic parameters. Therefore, the results observed inthis study should hold true for paravalvular AR as well. Finally,although this work focuses on the effect of LVDS and AR on LVperformance, it should be noted that other factors, such as resid-ual prosthesis stenosis, cardiac output, LV size, etc., influencehow well the patient might tolerate AR post AS.
6. Conclusions
This work has provided, in an in vitro model, evidence thatLVDS affects the hemodynamic severity of AR. It was shownthat increased LVDS substantially increases the SW require-ment to maintain a forward SV of 70 mL/beat in the presenceof AR. The results presented suggest that a TAVR patient’sLVDS significantly impacts their ability to compensate for post-procedural AR, and has potential to predict TAVR patient out-comes. Within the limitations of this study, these findings sug-gest that pre-operative measurement of LVDS could potentiallybe used to augment patient-specific assessment of TAVR risk.An investigation of this work using animal models would lendmore insight to its generalization towards humans.
7. Acknowledgments
The authors would like to thank Venair (Terrassa-Barcelona,Spain) for the production of the silicone LV models used in thiswork, and Procter Gamble for providing the glycerin. The workat the Cardiovascular Fluid Mechanics Laboratory at the Geor-gia Institute of Technology was funded through discretionaryfunds available to the Principal Investigator, such as the Wal-lace H. Coulter Endowed Chair.
References
[1] Raffi Bekeredjian and Paul A Grayburn. Valvular heart disease: aorticregurgitation. Circulation, 112(1):125–34, jul 2005.
[2] R O Bonow, E Lakatos, B J Maron, and S E Epstein. Serial long-termassessment of the natural history of asymptomatic patients with chronicaortic regurgitation and normal left ventricular systolic function. Circu-lation, 84(4):1625–1635, 1991.
[3] Maurice Enriquez-Sarano and A Jamil Tajik. Aortic regurgitation. NewEngland Journal of Medicine, 351(15):1539–1546, 2004.
[4] Philippe Genereux, John G Webb, Lars G Svensson, Susheel K Kodali,Lowell F Satler, William F Fearon, Charles J Davidson, Andrew C Eisen-hauer, Raj R Makkar, Geoffrey W Bergman, Vasilis Babaliaros, Joseph EBavaria, Omaida C Velazquez, Mathew R Williams, Irene Hueter, Ke Xu,and Martin B Leon. Vascular Complications After Transcatheter AorticValve Replacement: Insights From the PARTNER (Placement of AoRTicTraNscathetER Valve) Trial. Journal of the American College of Cardi-ology, 60(12):1043–1052, 2012.
6
[5] Susheel K Kodali, Mathew R Williams, Craig R Smith, Lars G Svens-son, John G Webb, Raj R Makkar, Gregory P Fontana, Todd M Dewey,Vinod H Thourani, Augusto D Pichard, Michael Fischbein, Wilson YSzeto, Scott Lim, Kevin L Greason, Paul S Teirstein, S Chris Malais-rie, Pamela S Douglas, Rebecca T Hahn, Brian Whisenant, Alan Zajarias,Duolao Wang, Jodi J Akin, William N Anderson, and Martin B Leon.Two-year outcomes after transcatheter or surgical aortic-valve replace-ment. The New England journal of medicine, 366(18):1686–95, may2012.
[6] Stamatios Lerakis, Salim S Hayek, and Pamela S Douglas. Paravalvularaortic leak after transcatheter aortic valve replacement: current knowl-edge. Circulation, 127(3):397–407, jan 2013.
[7] Jan-Malte Sinning, Mariuca Vasa-Nicotera, Derek Chin, Christoph Ham-merstingl, Alexander Ghanem, Johan Bence, Jan Kovac, Eberhard Grube,Georg Nickenig, and Nikos Werner. Evaluation and management of par-avalvular aortic regurgitation after transcatheter aortic valve replacement.Journal of the American College of Cardiology, 62(1):11–20, jul 2013.
[8] Corrado Tamburino, Davide Capodanno, Angelo Ramondo, Anna SoniaPetronio, Federica Ettori, Gennaro Santoro, Silvio Klugmann, FrancescoBedogni, Francesco Maisano, Antonio Marzocchi, Arnaldo Poli, DavidAntoniucci, Massimo Napodano, Marco De Carlo, Claudia Fiorina, andGian Paolo Ussia. Incidence and predictors of early and late mortalityafter transcatheter aortic valve implantation in 663 patients with severeaortic stenosis. Circulation, 123(3):299–308, jan 2011.
[9] Michael Gotzmann, Michael Lindstaedt, and Andreas Mugge. From pres-sure overload to volume overload: aortic regurgitation after transcatheteraortic valve implantation. American heart journal, 163(6):903–11, jun2012.
[10] W. Grossman, M. a. Stefadouros, L. P. Mclaurin, E. L. Rolett, and D. T.Young. Quantitative Assessment of Left Ventricular Diastolic Stiffness inMan. Circulation, 47(3):567–574, mar 1973.
[11] Robert O Bonow, Blase a Carabello, Kanu Chatterjee, Antonio C de Leon,David P Faxon, Michael D Freed, William H Gaasch, Bruce Whitney Ly-tle, Rick A. Nishimura, Patrick T. O’Gara, Robert A. O’Rourke, Cather-ine M Otto, Pravin M Shah, Jack S Shanewise, Sidney C Smith, Al-ice K Jacobs, Cynthia D Adams, Jeffrey L Anderson, Elliott M Antman,David P Faxon, Valentin Fuster, Jonathan L Halperin, Loren F Hiratzka,Sharon a Hunt, Bruce W Lytle, Rick Nishimura, Richard L Page, andBarbara Riegel. ACC/AHA 2006 Guidelines for the Management of Pa-tients With Valvular Heart Disease. Journal of the American College ofCardiology, 48(3):e1–e148, aug 2006.
[12] Blase A Carabello and Walter J Paulus. Aortic stenosis. The Lancet,373(9667):956–966, mar 2009.
[13] Jan Malte Sinning, Christoph Hammerstingl, Mariuca Vasa-Nicotera,Viktoria Adenauer, Sisa Josefina Lema Cachiguango, Anne CatherineScheer, Sven Hausen, Alexander Sedaghat, Alexander Ghanem, Cor-nelius Mller, Eberhard Grube, Georg Nickenig, and Nikos Werner. Aorticregurgitation index defines severity of peri-prosthetic regurgitation andpredicts outcome in patients after transcatheter aortic valve implantation.Journal of the American College of Cardiology, 59(13):1134–1141, 2012.
[14] Ikechukwu U. Okafor, Arvind Santhanakrishnan, Brandon D. Chaffins,Lucia Mirabella, John N. Oshinski, and Ajit P. Yoganathan. Cardiovas-cular magnetic resonance compatible physical model of the left ventriclefor multi-modality characterization of wall motion and hemodynamics.Journal of Cardiovascular Magnetic Resonance, 17(1):51, dec 2015.
[15] Ikechukwu U. Okafor, Arvind Santhanakrishnan, Vrishank S. Raghav,and Ajit P. Yoganathan. Role of Mitral Annulus Diastolic Geometry onIntraventricular Filling Dynamics. Journal of Biomechanical Engineer-ing, 137(12):121007, nov 2015.
[16] W. H. Gaasch, W. E. Battle, a. a. Oboler, J. S. Banas, and H. J. Levine.Left Ventricular Stress and Compliance in Man: With Special Referenceto Normalized Ventricular Function Curves. Circulation, 45(4):746–762,apr 1972.
[17] Anna Calleja, Paaladinesh Thavendiranathan, Razvan Ioan Ionasec, He-lene Houle, Shizhen Liu, Ingmar Voigt, Chittoor Sai Sudhakar, JuanCrestanello, Thomas Ryan, and Mani A Vannan. Automated quantitative3-dimensional modeling of the aortic valve and root by 3-dimensionaltransesophageal echocardiography in normals, aortic regurgitation, andaortic stenosis: comparison to computed tomography in normals and clin-ical implications. Circulation. Cardiovascular imaging, 6(1):99–108, jan2013.
[18] R Lange, S Bleiziffer, D Mazzitelli, Y Elhmidi, A Opitz, M Krane, M ADeutsch, H Ruge, G Brockmann, B Voss, C Schreiber, P Tassani, andN Piazza. Improvements in Transcatheter Aortic Valve Implantation Out-comes in Lower Surgical Risk Patients. Jac, 59(3):280–287, 2012.
[19] Israel Belenkie and A Rademaker. Acute and chronic changes after aorticvalve damage in the intact dog. The American journal of physiology,241(1):H95–103, jul 1981.
[20] J. L. Bolen and E. L. Alderman. Hemodynamic consequences of after-load reduction in patients with chronic aortic regurgitation. Circulation,53(5):879–883, may 1976.
[21] R O Bonow, D R Rosing, K M Kent, and S E Epstein. Timing of opera-tion for chronic aortic regurgitation. The American journal of cardiology,50(2):325–336, 1982.
[22] W H Gaasch, C W Andrias, and H J Levine. Chronic aortic regurgitation:the effect of aortic valve replacement on left ventricular volume, mass andfunction. Circulation, 58(5):825–836, 1978.
[23] C P Appleton, J M Galloway, M S Gonzalez, M Gaballa, and M aBasnight. Estimation of left ventricular filling pressures using two-dimensional and Doppler echocardiography in adult patients with cardiacdisease. Additional value of analyzing left atrial size, left atrial ejectionfraction and the difference in duration of pul. Journal of the AmericanCollege of Cardiology, 22(7):1972–1982, 1993.
[24] Y Ishida, J S Meisner, K Tsujioka, J I Gallo, C Yoran, R W Frater, andE L Yellin. Left ventricular filling dynamics: influence of left ventricularrelaxation and left atrial pressure. Circulation, 74(1):187–196, 1986.
[25] N M Magid, Donald C Wallerson, J S Borer, Ashis Mukherjee, Mason SYoung, R B Devereux, and John N Carter. Left ventricular diastolicand systolic performance during chronic experimental aortic regurgita-tion. The American journal of physiology, 263(1 Pt 2):H226–33, jul 1992.
[26] W. Gerald Austen, Harvey W. Bender, Benson R. Wilcox, and Andrew G.Morrow. Experimental aortic regurgitation. Journal of Surgical Research,3(10):466–470, dec 1963.
[27] O. M. Hess, M. Ritter, J. Schneider, J. Grimm, M. Turina, and H. P.Krayenbuehl. Diastolic stiffness and myocardial structure in aortic valvedisease before and after valve replacement. Circulation, 69(5):855–865,may 1984.
[28] Paul T L Chiam and Carlos E Ruiz. Percutaneous transcatheter aorticvalve implantation: Evolution of the technology. American heart journal,157(2):229–42, feb 2009.
[29] FERNANDO Florenzano and STANTON A Glantz. Left ventricu-lar mechanical adaptation to chronic aortic regurgitation in intact dogs.American Journal of Physiology-Heart and Circulatory Physiology,252(5):H969–H984, 1987.
[30] N M Magid, George Opio, D C Wallerson, Mason S Young, and Jeffrey SBorer. Heart failure due to chronic experimental aortic regurgitation. TheAmerican journal of physiology, 267(2 Pt 2):H556–62, aug 1994.