T weedy, B rowne C ompany L LC Invest ment Advi sers The High Dividend Yield Return Advantage: An Examination of Empirical Data Associating Investment in High Dividend Yield Securities with Attractive Returns Over Long Measurement Periods In the pages that follow, we set forth a number of studies, largely from academia, analyzing the importance of dividends, and the association of high dividend yields with attractive inv estment returns over long measurement periods. You may be familiar with our prior booklet, What Has Worked In Investing, where we provided an anthology of studies which empirically identified a return advantage for value-oriented investment characteristics. In the same spirit, we attempt to examine what some in our industry have referred to as the “yield effect”; i.e., the correlation of high dividend yields to attractive rates of return over long measurement periods. Much has been written about dividends, and what is contained herein is not meant to be an exhaustive analysis, but rather a sampling of studies examining the impact of dividends on investment returns. W e hope it will provide you with added insight and confidence, as it did us, in pursuing a yield-oriented investment strategy. “The deepest sin against the human mind is to believe things without evidence.”-T.H. HuxleyEstablished in 1920
Transcript
8/19/2019 The High Dividend Yield Return Advantage
An Examination of Empirical Data Associating Investment in
High Dividend Yield Securities with Attractive Returns OverLong Measurement Periods
In the pages that follow, we set forth a number of studies, largely from academia,
analyzing the importance of dividends, and the association of high dividend yields with
attractive investment returns over long measurement periods. You may be familiar with
our prior booklet, What Has Worked In Investing, where we provided an anthology of
studies which empirically identified a return advantage for value-oriented investment
characteristics. In the same spirit, we attempt to examine what some in our industry
have referred to as the “yield effect”; i.e., the correlation of high dividend yields toattractive rates of return over long measurement periods. Much has been written about
dividends, and what is contained herein is not meant to be an exhaustive analysis, but
rather a sampling of studies examining the impact of dividends on investment returns.
We hope it will provide you with added insight and confidence, as it did us, in pursuing
a yield-oriented investment strategy.
“The deepest sin against the human mind is to believe things without evidence.”
-T.H. Huxley
Established in 1920
8/19/2019 The High Dividend Yield Return Advantage
Investing in foreign securities involves additional risks beyond the risks of investing in U.S. securitiesmarkets. These risks include currency fluctuations; political uncertainty; different accounting andfinancial standards; different regulatory environments; and different market and economic factors invarious non-U.S. countries. In addition, the securities of small, less well known companies may be morevolatile than those of larger companies. Please refer to the Fund’s prospectus for a description of riskfactors associated with investments in securities that may be held by the Fund.
The studies presented herein provide a review of the relative past performance of selected securitiesassociated with high dividend yields and various indices. The investment returns presented in the studiesrepresent past performance of those securities and should not be considered indicative or representativeof the future performance of the Tweedy, Browne Worldwide High Dividend Yield Value Fund, nor shouldit be inferred that the future performance of the Fund will equal or exceed the performance set forth inthe studies. Dividends are not guaranteed and a company currently paying dividends may cease payingdividends at any time. There may be studies that exist that contradict the conclusions of the studiespresented herein.
This material is not intended to address every situation, nor is it intended as a substitute for the legal,accounting or financial counsel of your professional advisors, especially with respect to the tax treatmentof dividends and your individual circumstances.
Investors should bear in mind that, as with any wealth building investment strategy, potential futurewealth accumulation in their accounts will be retarded by withdrawals from their accounts, includingregular withdrawals of dividends.
Information contained herein is derived from various sources as set out in the narrative. Although we believe the information provided by the sources to be accurate, we have not independently verified the
information.Investors should consider the Fund’s investment objectives, risks, charges andexpenses carefully before investing. Investors may obtain a free prospectus whichcontains this and other information about the Fund by calling (800) 432-4789 or byvisiting www.tweedy.com. Please read the prospectus carefully before investing.
The Tweedy, Browne Worldwide High Dividend Yield Value Fund is distributed byAMG Distributors, Inc., Member FINRA/SIPC.
8/19/2019 The High Dividend Yield Return Advantage
• Over the long term, the return from dividends has been a significant contributor to the totalreturns produced by equity securities in markets studied.
• There is an abundance of empirical evidence which suggests that portfolios consisting of higherdividend yielding equity securities can produce returns that are attractive relative to lower-
yielding portfolios and to overall stock market returns over long measurement periods.• Stocks with high and apparently sustainable dividend yields that are competitive with high quality
bond yields may be more resistant to a decline in price than lower-yielding securities because thestock is in effect “yield supported.” The reinvestment of dividends during stock market declineshas also been shown to generally lessen the time necessary to recoup portfolio losses.
• The ability to pay cash dividends is a positive factor in assessing the underlying health of a companyand the quality of its earnings. This is particularly pertinent in light of the complexity of corporateaccounting and numerous examples of “earnings management,” including occasionally fraudulentearnings manipulation.
• Dividends remain tax advantaged in the US. Dividends treated as “qualified dividend income”received by individual taxpayers are taxed at the same favorable rates as long-term capital gains(15% Federal Tax Rate for most individuals; 20% for individuals and joint filers with incomesof at least $400,000 and $450,000, respectively. In addition, a 3.8% “Medicare tax” is appliedto the net investment income of shareholders in higher tax brackets.) Of course, one can neverpredict future tax policy and it is possible that this tax advantage could disappear in the future.(This should not be considered tax advice. We encourage you to consult your tax advisor.)
• Most importantly, there is an abundance of empirical evidence which suggests that portfolios
consisting of high dividend yielding equity securities may produce attractive total returns overlong measurement periods.
8/19/2019 The High Dividend Yield Return Advantage
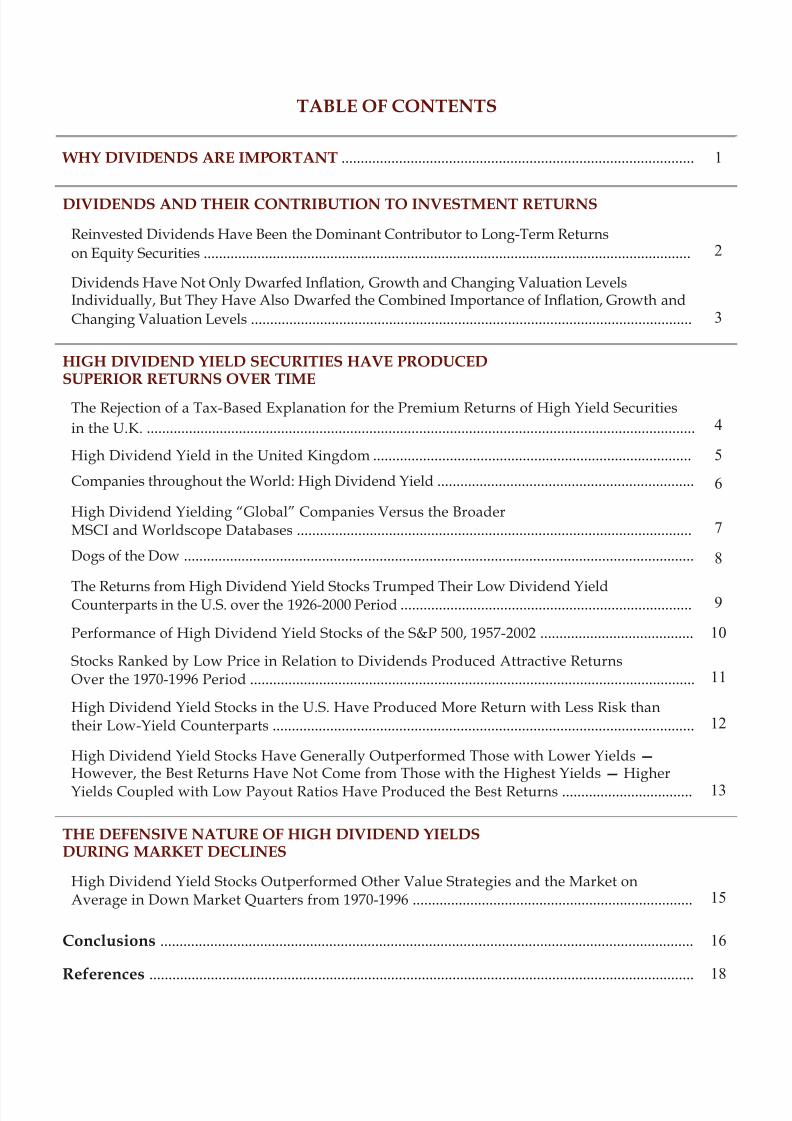
WHY DIVIDENDS ARE IMPORTANT ............................................................................................ 1
DIVIDENDS AND THEIR CONTRIBUTION TO INVESTMENT RETURNS
Reinvested Dividends Have Been the Dominant Contributor to Long-Term Returns
on Equity Securities ............................................................................................................................... 2
Dividends Have Not Only Dwarfed Ination, Growth and Changing Valuation LevelsIndividually, But They Have Also Dwarfed the Combined Importance of Ination, Growth and
HIGH DIVIDEND YIELD SECURITIES HAVE PRODUCEDSUPERIOR RETURNS OVER TIME
The Rejection of a Tax-Based Explanation for the Premium Returns of High Yield Securities
in the U.K. ............................................................................................................................................... 4
High Dividend Yield in the United Kingdom ................................................................................... 5
Companies throughout the World: High Dividend Yield ................................................................... 6
High Dividend Yielding “Global” Companies Versus the BroaderMSCI and Worldscope Databases ....................................................................................................... 7
Dogs of the Dow ..................................................................................................................................... 8
The Returns from High Dividend Yield Stocks Trumped Their Low Dividend YieldCounterparts in the U.S. over the 1926-2000 Period ............................................................................ 9
Performance of High Dividend Yield Stocks of the S&P 500, 1957-2002 ........................................ 10
Stocks Ranked by Low Price in Relation to Dividends Produced Attractive ReturnsOver the 1970-1996 Period .................................................................................................................... 11
High Dividend Yield Stocks in the U.S. Have Produced More Return with Less Risk thantheir Low-Yield Counterparts .............................................................................................................. 12
High Dividend Yield Stocks Have Generally Outperformed Those with Lower Yields — However, the Best Returns Have Not Come from Those with the Highest Yields — HigherYields Coupled with Low Payout Ratios Have Produced the Best Returns .................................. 13
THE DEFENSIVE NATURE OF HIGH DIVIDEND YIELDSDURING MARKET DECLINES
High Dividend Yield Stocks Outperformed Other Value Strategies and the Market onAverage in Down Market Quarters from 1970-1996 ......................................................................... 15
In their book, Triumph of the Optimists: 101 Years of Global Investment Returns, Elroy Dimson,Paul Marsh, and Mike Staunton examined the respective contributions to returns provided by capital gainsand dividends from 1900 to 2000. They discovered that, while year-to-year performance was driven bycapital appreciation, long-term returns were largely driven by reinvested dividends. In the chart below,they show the cumulative contribution to return of capital gains and dividends in both the U.S. and theU.K. from 1900 to 2000. Over 101 years, they found that a market-oriented portfolio, which includedreinvested dividends, would have generated nearly 85 times the wealth generated by the same portfolio
relying solely on capital gains. This wealth accumulation would, of course, have been lower if dividendswere not assumed to have been reinvested.
Reinvested Dividends Have Been the
Dominant Contributor to Long-TermReturns on Equity Securities
DIVIDENDS AND THEIR CONTRIBUTION TO INVESTMENT RETURNS
Source: Triumph of the Optimists: 101 Years of GlobalInvestment Returns, Elroy Dimson, Paul Marsh and Mike
Staunton, Princeton University Press, 2002, p. 145
Please note that the information in the chart above reects past performance of the equitysecurities studied and is not intended to predict or project future investment results.
8/19/2019 The High Dividend Yield Return Advantage
the Combined Importance of Ination, Growthand Changing Valuation Levels
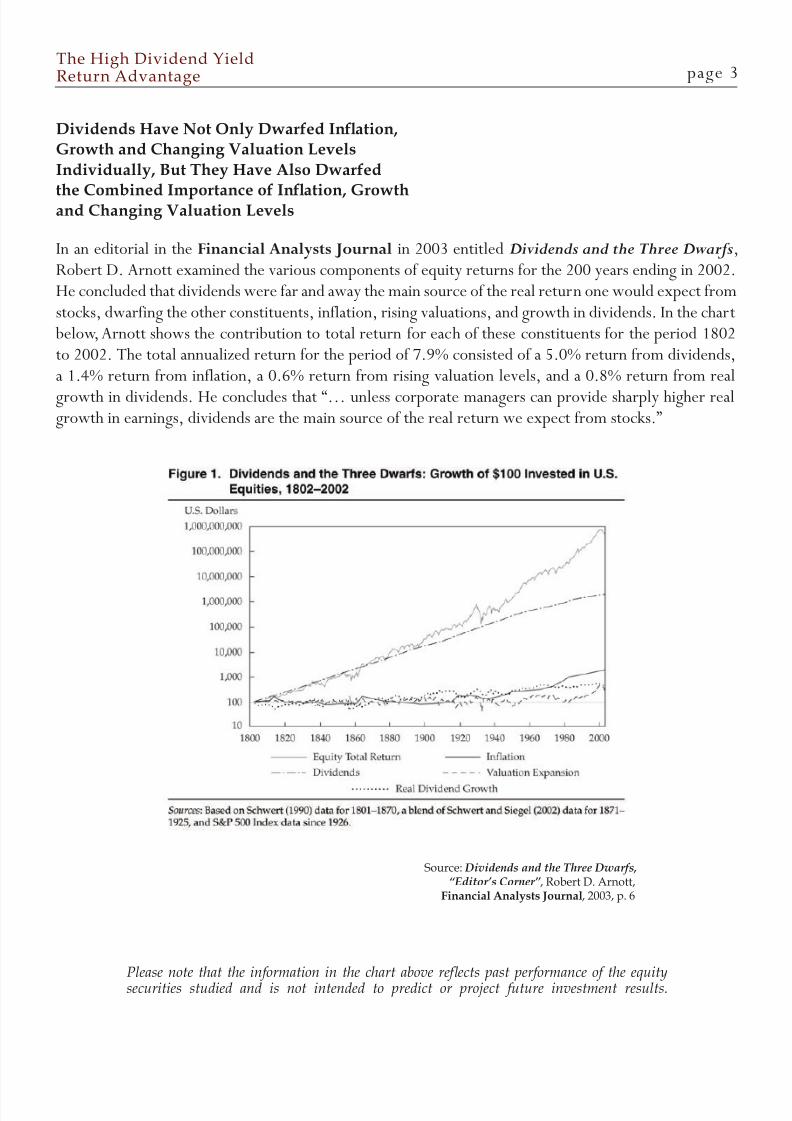
In an editorial in the Financial Analysts Journal in 2003 entitled Dividends and the Three Dwarfs,Robert D. Arnott examined the various components of equity returns for the 200 years ending in 2002.He concluded that dividends were far and away the main source of the real return one would expect fromstocks, dwarfing the other constituents, inflation, rising valuations, and growth in dividends. In the chart
below, Arnott shows the contribution to total return for each of these constituents for the period 1802to 2002. The total annualized return for the period of 7.9% consisted of a 5.0% return from dividends,a 1.4% return from inflation, a 0.6% return from rising valuation levels, and a 0.8% return from real
growth in dividends. He concludes that “… unless corporate managers can provide sharply higher realgrowth in earnings, dividends are the main source of the real return we expect from stocks.”
Source: Dividends and the Three Dwarfs,“Editor’s Corner” , Robert D. Arnott,
Financial Analysts Journal, 2003, p. 6
Please note that the information in the chart above reects past performance of the equitysecurities studied and is not intended to predict or project future investment results.
8/19/2019 The High Dividend Yield Return Advantage
HIGH DIVIDEND YIELD SECURITIES HAVE PRODUCEDSUPERIOR RETURNS OVER TIME
The Rejection of a Tax-Based Explanation
for the Premium Returns of High YieldSecurities in the U.K.
In a paper published in the Journal of Financial Economics in 1979 entitled The Effect of Personal
Taxes and Dividends on Capital Asset Prices, Robert Litzenberg of Stanford University and KrishnaRamaswamy of Bell Labs discovered a strong correlation between expected pre-tax returns and dividendyields of common stocks. They reasoned that investors would demand superior pre-tax returns fromdividend paying securities to compensate for the higher tax rates applied against their dividend incomestreams. Their data, which was supplied by the Center for Research in Security Prices at the Universityof Chicago (CRSP), indicated that “… for every dollar increase in return in the form of dividends,investors required an additional 23 cents in before-tax return.”
In a later paper entitled Taxes, Dividend Yields and Returns in the UK Equity Market in the Journal
of Banking & Finance (1998), Gareth Morgan and Stephen Thomas of the University of Southamptonalso found a return premium associated with higher dividend yield securities, but their data rejected a tax-
based explanation since in the UK dividend income is taxed more favorably than capital gains. Using datafrom the London Share Price Database (LSPD), they examined the relationship between dividend yieldsand stock returns from 1975 through 1993 in the UK. Database companies were ranked by dividendyield at the end of each month and divided into six groups, including a zero dividend group (companiesthat did not pay dividends). In the table below from page 12 of their study, Messrs. Morgan and Thomasfind a strong correlation between the size of the dividend yield and the average monthly return.
DividendYieldPortfolio
AverageMonthlyReturn(%) a
AverageDividend
Yield
AverageMarket
Value ofEquity b
MarketModel
Estimateof α
MarketModel
Estimateof β
1 (Highest) 2.51 11.07 136.53 0.53 c 0.95
(5.62)
2 2.23 7.69 207.27 0.18 c 1.01
(5.22)
3 1.98 5.93 205.68 0.01 0.95
(5.16)
4 1.86 4.31 183.93 -0.01 0.94
(4.90)
5 (Lowest) 1.56 2.25 133.21 -0.44 c 0.97
(4.93)
6 (Zero) 2.06 0.00 33.66 -0.17 1.16
(6.58)
t-test d 1.56
F-test e 0.85
Portfolios ranked by dividend yield using monthly data 1975-1993
Source: Taxes, Dividend Yields and Returns in the
UK Equity Market , Gareth Morgan and StephenThomas, Journal of Banking & Finance, 1998, p. 410
a Standard deviations are in parentheses. Standard
deviation is the statistical measurement of dispersion
about an average, which depicts how widely a stock
or portfolio’s returns varied over a certain period of
time. Investors use the standard deviation of historical
performance to try to predict the range of returns that
is most likely for a given investment. When a stock or
portfolio has a high standard deviation, the predicted
range of performance is wide, implying greater volatility. b Average market value of equity calculated from annual
data, expressed in millions of pounds.c Indicates a t -statistic giving a 95% probability of
signicance.d t -test (452 degrees of freedom) of the null hypothesis
that the mean return to portfolio 1 equals the mean return
to portfolio 5.e F -statistic (distributed (5.1356)) tests the null hypothesis
that average returns are equal for each dividend yield
group.
ɑ A measure of performance on a risk-adjusted basis.
β A measure of the volatility, or systematic risk, of a
security or a portfolio in comparison to the market as
a whole.
Please note that the information in the chart above reects past performance of the equity securities studied and is notintended to predict or project future investment results.
8/19/2019 The High Dividend Yield Return Advantage
In a paper entitled Stock Market Anomalies: A Reassessment Based on the U.K. Evidence in the Journalof Banking and Finance, December 1989, Professor Mario Levis at The School of Management,
University of Bath, United Kingdom, examined a number of anomalies in stock price behavior of firmson the London Stock Exchange including the correlation between dividend yield and investment returns.In a subsequent paper entitled Market Anomalies: A Mirage or a Bona Fide Way to Enhance Portfolio
Returns? , Michael Lenhoff of Capel-Cure Myers Capital Management used data largely derived fromProfessor Levis’ study to illustrate a strong positive relationship between dividend yield and market-
beating rates of return. Using a sample of 4,413 companies, all of which were listed on the LondonStock Exchange during January 1955 through December 1988, Lenhoff ranked these listed companieseach year according to dividend yield and sorted the companies into deciles. The 34-year compoundedannual investment returns and cumulative values of an assumed £1 million initial investment in eachof the ten groups is shown in the following table, along with descriptive information concerning each
group’s average dividend yield and market capitalization.
In his study, there was almost a perfect correlation in the decile returns between higher dividend yieldsand higher annualized returns. The top decile, in terms of high yield, produced an average annualizedreturn over 34 years of 19.3% versus 13.0% for the Financial Times Actuaries All Share Index.
Mr. Lenhoff noted that “… there is a near perfect inverse correlation between the ratio of price-to-netasset value [i.e., book value] for the U.K. equity market and yield. When price stands significantly at adiscount [premium] to the net asset value, the yield available from U.K. plc is significantly above [below]the long run range.” Mr. Lenhoff also went on to observe that the price/earnings ratios of high dividendyield companies are usually low in relation to the price/earnings ratio of the entire stock market and thatthe high yield companies are often takeover candidates.
While it is not the case in all instances, in Tweedy, Browne’s experience, high dividend yields are oftenassociated with stocks selling at low prices in relation to earnings, book value and specific appraisals ofthe value that shareholders would receive in a sale of the entire company based upon valuations of similar
businesses in corporate transactions.
Investment Results of U.K. Companies According to Dividend Yields, January 1955 through December 1988
Source: Market Anomalies: A Mirage or a Bona Fide Wayto Enhance Portfolio Returns?
Michael Lenhoff, Capel-CureMyers Capital Management,
Revised Print, March 1991
Please note that the informationin the chart above reects past
performance of the equitysecurities studied and is notintended to predict or project
future investment results.
8/19/2019 The High Dividend Yield Return Advantage
In The Importance of Dividend Yields in Country Selection in the The Journal of Portfolio
Management, A. Michael Keppler examined the relationship between dividend yield and investmentreturns for companies throughout the world. Mr. Keppler’s study assumed an equal-weighted investmenteach quarter in each of the following eighteen Morgan Stanley Capital International equity indexes overthe 20-year period from December 31, 1969 through December 31, 1989: Australia, Austria, Belgium,Canada, Denmark, France, Germany, Hong Kong, Italy, Japan, The Netherlands, Norway, Singapore/Malaysia, Spain, Sweden, Switzerland, the United Kingdom, and the United States. Each quarter,the country indexes were ranked according to dividend yield and sorted into four quartiles. The totalinvestment return was measured for each of the four quartile groups over the subsequent three months.
The study indicated that the most profitable strategy was investment in the highest yield quartile. The
compound annual investment return for the countries with the highest yielding stocks was 18.49%in local currencies (and 19.08% in U.S. dollars) over the 20-year period. The least profitable strategywas investment in the lowest yield quartile, which produced a 5.74% compound annual return in localcurrency (and 10.31% in U.S. dollars). The Morgan Stanley Capital International World Index returnover the same period was 12.14% in local currency on a cap-weighted basis (and 13.26% in U.S. dollars).On an equal-weighted basis, the MSCI World Index was up 15.5% for the period in local currency.
Compound Annual Returns (in local currencies) based on variousdividend yield strategies and the MSCI World Index
December 1969 – December 1989
18.5% 18.4%
16.8%15.5%
14.2%
10.5%
5.7%
Highest yieldingcountry indices
Lowest yieldingcountry indices
* MSCI World Index (equally weighted) in local currency; on acapitalization-weighted basis, the MSCI World Index returned12.14% in local currency.
Strategies based on yield:(1) Invest in only top quartile yielding country indices(2) Invest in the top two quartiles based on yield(3) Invest in the top three highest yielding quartiles(4) Invest in the bottom three quartiles based on yield(5) Invest in the bottom two quartiles based on yield
(6) Invest in only the lowest yielding quartile.
Source: The Importance of Dividend Yields in Country
Selection, A. MichaelKeppler, The Journal ofPortfolio Management,
Winter 1991
Please note that the informationin the chart above reects past
performance of the equitysecurities studied and is notintended to predict or project
future investment results.
8/19/2019 The High Dividend Yield Return Advantage
According to research from O’Shaughnessy Asset Management entitled Stocks, Bonds, and the Efcacy
of Global Dividends, dividend stocks work well in the US, but work even better globally. Using datafrom Morgan Stanley Capital International (“MSCI”) going back to 1970, the top decile of dividendpaying companies in that database produced returns that were 5.7% better, on an annualized basis, thanthe returns of the broader database. Using another database, the Worldscope database, from 1988 to2010, top decile dividend paying companies performed even better, outperforming the Worldscopedatabase average by 6.9% per year. Global dividend payers also apparently outperformed with a greatdeal of consistency in both databases, with the top decile dividend yielders outperforming the MSCIdatabase in 92% of the rolling three-year periods and outperforming the Worldscope database in 98%of the rolling three-year periods.
Annualized Returns of High Dividend Yield Companiesversus Indices Over Long Measurement Periods
18.9%
13.2%
Best Decile Dividend Yield Universe
16.3%
9.4%
All MSCI Stocks(1970-2010)
All Worldscope Stocks(1988-2010)
Best Decile Dividend Yield vs.MSCI All Stocks Universe
Best Decile Dividend Yield vs.Worldscope All Stocks Universe
1-Yr 3-Yr 5-Yr 10-Yr 1-Yr 3-Yr 5-Yr 10-Yr
77% 92% 97% 100% 81% 98% 100% 100%
Annualized Return:
BaseRates:*
* Base rates are a batting average for how often a strategy beats its benchmark over certain rolling time periods.
Source: Stocks, Bonds, and the Efcacy of Global Dividends ,O’Shaughnessy Asset Management Research,
Winter 2012, p.4
Please note that the information in the chart above reects past performance of the equitysecurities studied and is not intended to predict or project future investment results.
8/19/2019 The High Dividend Yield Return Advantage
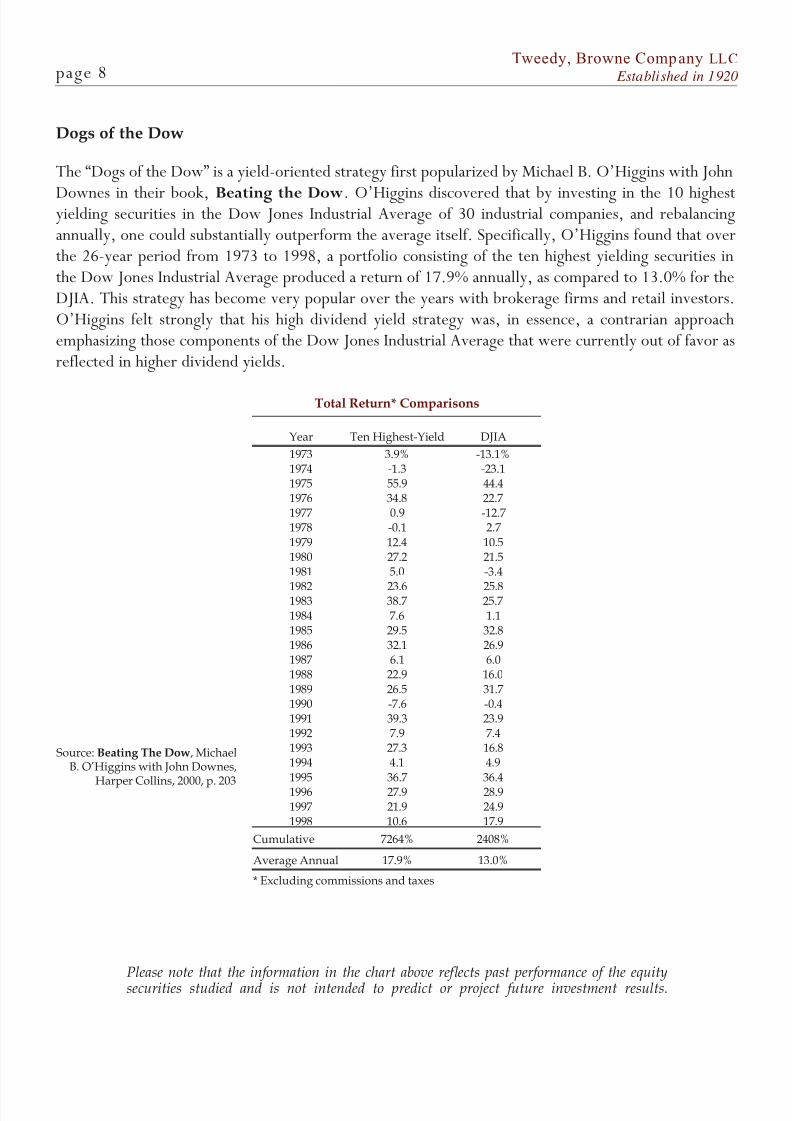
The “Dogs of the Dow” is a yield-oriented strategy first popularized by Michael B. O’Higgins with John
Downes in their book, Beating the Dow. O’Higgins discovered that by investing in the 10 highestyielding securities in the Dow Jones Industrial Average of 30 industrial companies, and rebalancingannually, one could substantially outperform the average itself. Specifically, O’Higgins found that overthe 26-year period from 1973 to 1998, a portfolio consisting of the ten highest yielding securities inthe Dow Jones Industrial Average produced a return of 17.9% annually, as compared to 13.0% for theDJIA. This strategy has become very popular over the years with brokerage firms and retail investors.O’Higgins felt strongly that his high dividend yield strategy was, in essence, a contrarian approachemphasizing those components of the Dow Jones Industrial Average that were currently out of favor asreflected in higher dividend yields.
Source: Beating The Dow, MichaelB. O’Higgins with John Downes,
Harper Collins, 2000, p. 203
Please note that the information in the chart above reects past performance of the equitysecurities studied and is not intended to predict or project future investment results.
8/19/2019 The High Dividend Yield Return Advantage
The chart below, taken from Dimson, Marsh and Stanton’s book, Triumph of the Optimists: 101
Years of Global Investment Returns, shows the cumulative returns from 1926 to 2000 of U.S. stocksthat rank each year in the highest or lowest-yielding 30% of companies, and compares the two groups tothe CRSP value-weighted equity index. Higher dividend yield stocks outperformed their lower-yieldingcounterparts and the index by 180 and 160 basis points annualized from year-end 1926 to year-end2000. This translated into 2.29 times the wealth generated by the lower-yielding stocks.
Source: Triumph of the Optimists: 101 Years of Global
Investment Returns, Elroy Dimson, Paul Marsh andMike Staunton, Princeton University Press, 2002, p.140
Please note that the information in the chart above reects past performance of the equitysecurities studied and is not intended to predict or project future investment results.
8/19/2019 The High Dividend Yield Return Advantage
In another study, The Future for Investors, Jeremy Siegel, the noted finance professor at the Universityof Pennsylvania, examined the performance of the component stocks of the Standard and Poor’s 500Stock Index, ranked by dividend yield from 1957 to 2002. In his study, on December 31 of each year, theS&P 500 stocks were sorted into five quintiles ranked by dividend yield. He then calculated the returnsof the stocks and quintiles over the next year, re-sorting at year-end. He found that better results weredirectly correlated with higher dividend yields. The highest yielding quintile (top 20% of S&P 500 basedon yield) produced an annualized return of 14.27% versus an annualized return of 11.18% for the S&P500 Index, and resulted in three times the wealth accumulation of the index.
Source: The Future for Investors , Jeremy J. Siegel, Crown Business, 2005, p.128
Professor Siegel also coined the terms “bear market protector” and “return accelerator” to describe howdividend reinvestment during stock market declines can dramatically lessen the time necessary to recoupportfolio losses.
Please note that the information in the chart above reects past performance of the equitysecurities studied and is not intended to predict or project future investment results.
8/19/2019 The High Dividend Yield Return Advantage
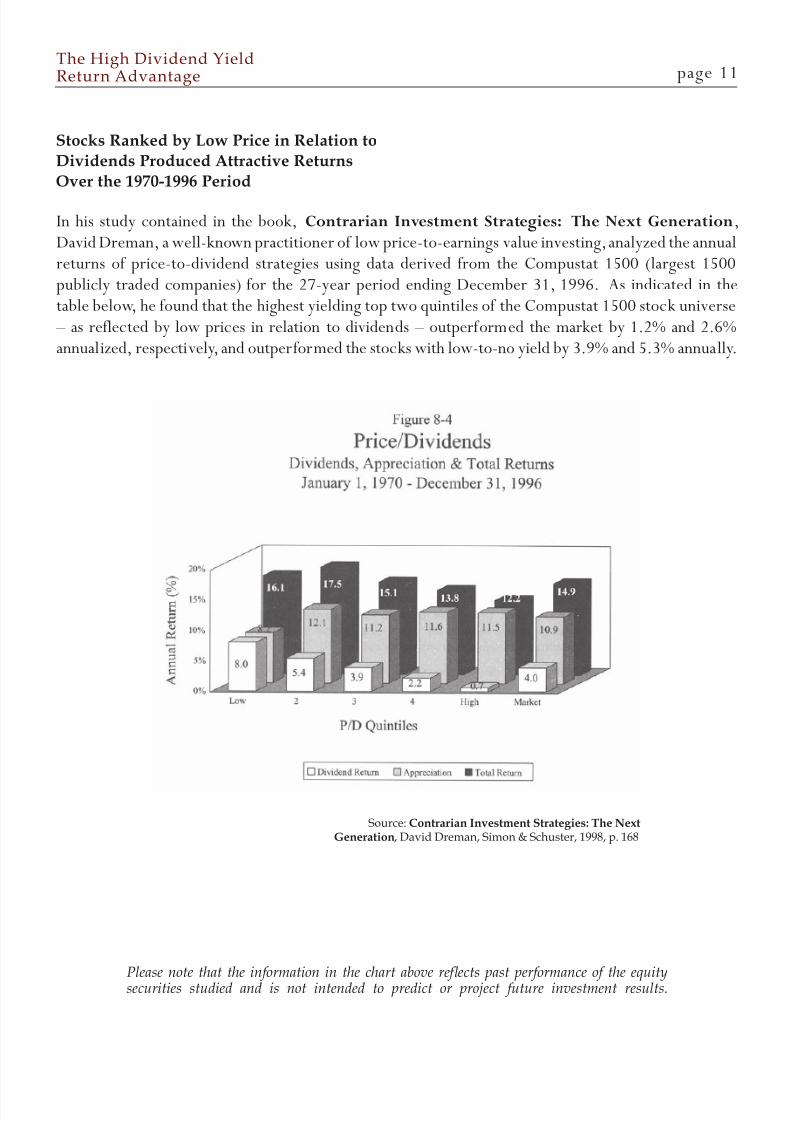
In his study contained in the book, Contrarian Investment Strategies: The Next Generation,David Dreman, a well-known practitioner of low price-to-earnings value investing, analyzed the annualreturns of price-to-dividend strategies using data derived from the Compustat 1500 (largest 1500publicly traded companies) for the 27-year period ending December 31, 1996. As indicated in thetable below, he found that the highest yielding top two quintiles of the Compustat 1500 stock universe
– as reflected by low prices in relation to dividends – outperformed the market by 1.2% and 2.6%annualized, respectively, and outperformed the stocks with low-to-no yield by 3.9% and 5.3% annually.
Stocks Ranked by Low Price in Relation to
Dividends Produced Attractive Returns
Over the 1970-1996 Period
Source: Contrarian Investment Strategies: The NextGeneration, David Dreman, Simon & Schuster, 1998, p. 168
Please note that the information in the chart above reects past performance of the equitysecurities studied and is not intended to predict or project future investment results.
8/19/2019 The High Dividend Yield Return Advantage
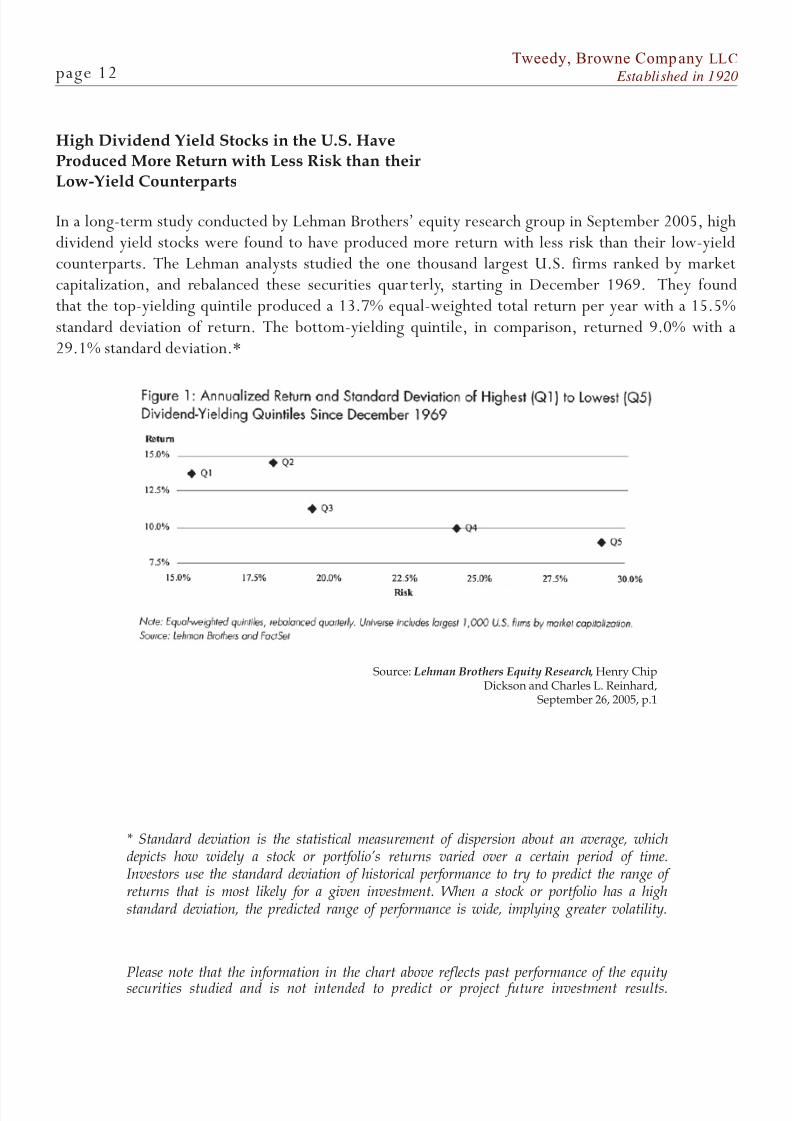
In a long-term study conducted by Lehman Brothers’ equity research group in September 2005, highdividend yield stocks were found to have produced more return with less risk than their low-yieldcounterparts. The Lehman analysts studied the one thousand largest U.S. firms ranked by marketcapitalization, and rebalanced these securities quarterly, starting in December 1969. They foundthat the top-yielding quintile produced a 13.7% equal-weighted total return per year with a 15.5%standard deviation of return. The bottom-yielding quintile, in comparison, returned 9.0% with a29.1% standard deviation.*
Source: Lehman Brothers Equity Research, Henry ChipDickson and Charles L. Reinhard,
September 26, 2005, p.1
* Standard deviation is the statistical measurement of dispersion about an average, whichdepicts how widely a stock or portfolio’s returns varied over a certain period of time.Investors use the standard deviation of historical performance to try to predict the range ofreturns that is most likely for a given investment. When a stock or portfolio has a highstandard deviation, the predicted range of performance is wide, implying greater volatility.
Please note that the information in the chart above reects past performance of the equitysecurities studied and is not intended to predict or project future investment results.
8/19/2019 The High Dividend Yield Return Advantage
from Those with the Highest Yields —Higher Yields Coupled with Low Payout
Ratios Have Produced the Best Returns
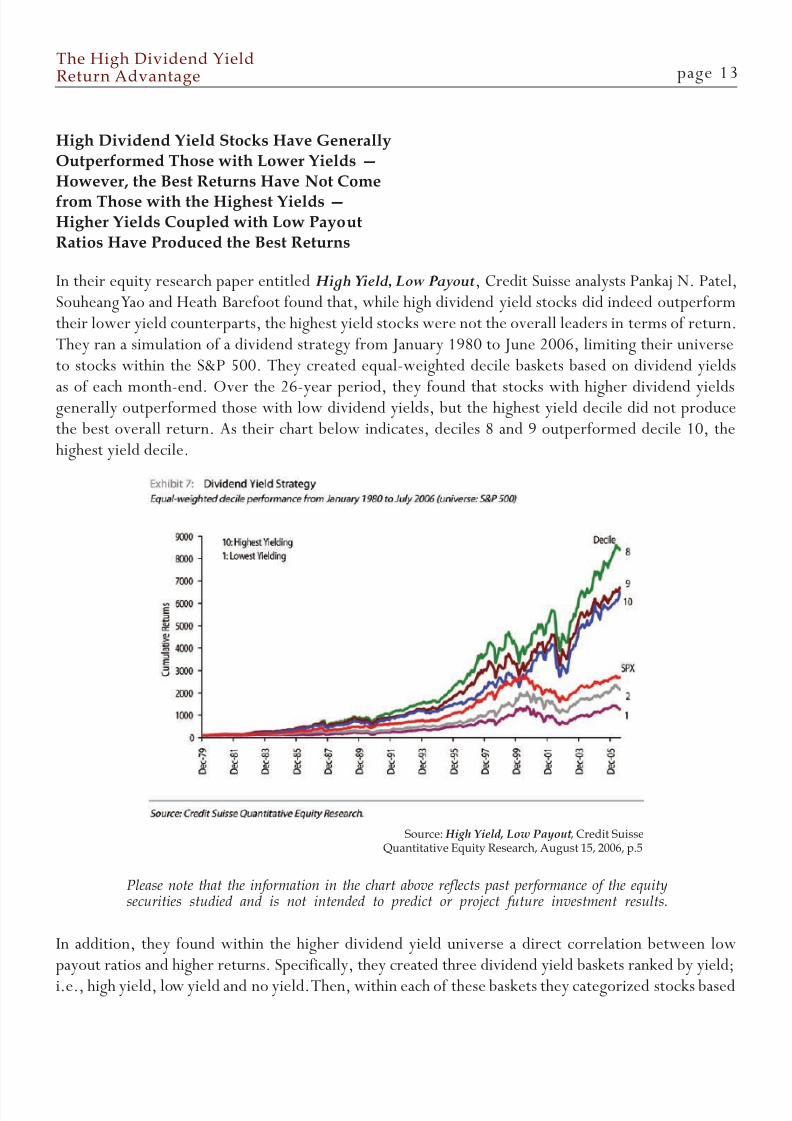
In their equity research paper entitled High Yield, Low Payout, Credit Suisse analysts Pankaj N. Patel,Souheang Yao and Heath Barefoot found that, while high dividend yield stocks did indeed outperformtheir lower yield counterparts, the highest yield stocks were not the overall leaders in terms of return.They ran a simulation of a dividend strategy from January 1980 to June 2006, limiting their universeto stocks within the S&P 500. They created equal-weighted decile baskets based on dividend yields
as of each month-end. Over the 26-year period, they found that stocks with higher dividend yieldsgenerally outperformed those with low dividend yields, but the highest yield decile did not producethe best overall return. As their chart below indicates, deciles 8 and 9 outperformed decile 10, thehighest yield decile.
In addition, they found within the higher dividend yield universe a direct correlation between lowpayout ratios and higher returns. Specifically, they created three dividend yield baskets ranked by yield;
i.e., high yield, low yield and no yield. Then, within each of these baskets they categorized stocks based
Source: High Yield, Low Payout , Credit SuisseQuantitative Equity Research, August 15, 2006, p.5
Please note that the information in the chart above reects past performance of the equitysecurities studied and is not intended to predict or project future investment results.
8/19/2019 The High Dividend Yield Return Advantage
on payout ratio; i.e., high, medium and low. Equal-weighted portfolios of these baskets were created based on dividend yields and payout ratios as of each quarter-end for the period January 1990 to June2006; i.e., high yield, low payout; low yield, low payout; low yield, high payout, etc. The stocks used
were those of the S&P 500. As you can see from the chart that follows, the basket with the highestyields combined with low payout ratios produced the best returns. The high yield, low payout portfolio
bucket generated an annualized return for the period of 19.2% versus 11.16% for the S&P 500.Arithmetically, the lower the payout ratio associated with a given level of dividend yield, the higher theearnings yield for the company, and the cheaper the stock based on price-to-earnings multiples: Thehigh yield, low payout stocks that produced the better returns were priced at low ratios of price-to-earnings, and as a corollary, at high ratios of earnings-to-price; i.e., earnings yield.
Source: High Yield, Low Payout , Credit SuisseQuantitative Equity Research, August 15, 2006, Pages 2-3
Please note that the information in the chart above reects past performance of the equitysecurities studied and is not intended to predict or project future investment results.
8/19/2019 The High Dividend Yield Return Advantage
THE DEFENSIVE NATURE OF HIGH DIVIDEND YIELDSDURING MARKET DECLINES
High Dividend Yield Stocks Outperformed Other
Value Strategies and the Market on Average inDown Market Quarters from 1970-1996
In another study entitled When The Bear Growls: Bear Market Returns 1970-1996 , contained in the book, Contrarian Investment Strategies: The Next Generation, David Dreman, in collaborationwith Eric Lufkin, examined the effectiveness of contrarian value strategies in down market quarters forthe 27 years ended December 31, 1996. The Compustat 1500 database (1500 largest publicly tradedstocks) was used, and the performance of four value strategies (low price-to-earnings, low price-to-book value, low price-to-cash flow, and high dividend yields) was measured and averaged for alldown quarters and then compared to the index itself for the 27-year period. All of the value strategiesoutperformed the market, with the high dividend strategy (low price-to-dividend) performing the bestof all the value strategies, declining on average only 3.8%, or roughly one-half as much as the market.
When both the up and down quarters were considered over the full 27 years, again, all of the valuestrategies outperformed the market, but the price-to-dividend strategy trailed the other strategiessomewhat. For the full 27-year period, through both up and down quarters, the price-to-dividendstrategy produced an annualized return of 16.1% versus 14.9% for the market.
Source: Contrarian Investment Strategies: The NextGeneration , David Dreman, Simon & Schuster, 1998, p. 157
Please note that the information inthis chart reects past performanceof the equity securities studiedand is not intended to predict or
project future investment results.
8/19/2019 The High Dividend Yield Return Advantage
In the preceding pages, we examined a number of papers and empirical studies from academics,
economists and investment professionals that analyzed the relationship between dividend yield andinvestment returns over time. The following conclusions can be drawn:
1. Over the 101-year period from 1900-2000, one study demonstrated that an investment in a market-oriented equity portfolio in both the U.S. and the U.K. that included, most importantly, reinvesteddividends, would have produced nearly 85 times the wealth generated by the same portfolio relyingsolely on capital gains.
2. There is substantial empirical evidence to support a direct correlation between high dividend yieldsand attractive total returns.
3. Three of the studies found that the best returns were not produced by the highest yielding decile orquintile, but rather by the next highest yielding one or two deciles, or the next highest yielding quintile.
4. At least one study demonstrated that the returns associated with market-beating high dividend yieldstocks were also less volatile in terms of the standard deviation of returns.
5. In several of the studies, high dividend yield stocks also sold at low ratios of price-to-book valueand/or price-to-earnings.
6. The return advantages of high dividend yield stocks held for equity securities in both the U.S. andinternationally.
7. At least one study found that high dividend yield stocks outperformed other value strategies as wellas the overall stock market return in declining markets.
8. The reinvestment of dividends from high-yield stocks can dramatically shorten the time necessaryto recoup losses in declining markets.
It seems clear, at least from the studies contained herein, that stocks with high dividend yields haveenjoyed interesting return advantages over their lower yielding counterparts. As to why this is thecase, we can only surmise. Some observers, such as Michael Lenhoff of Capel-Cure Myers CapitalManagement, suggest that a multiple characteristic value effect may, at least in part, account for this
return anomaly. Lenhoff noted that the high dividend yield stocks in his study also sold at relativelylow ratios of price-to-book value and price-to-earnings. In various empirical studies, stocks priced lowin relation to earnings and/or book value have produced above-market returns; i.e., a “value effect.”Similarly, the Credit Suisse high yield, low payout study found that high dividend yield stocks pricedat low multiples of price-to-earnings performed best. Also, as indicated earlier, in Tweedy, Browne’sexperience, high dividend yield stocks often possess one or more value characteristics such as lowprice-to-earnings ratios, low price-to-book value ratios, or relatively low prices in relation to specificappraisals of the value that shareholders would receive in a sale of the entire company based uponvaluations of similar businesses in corporate transactions.
8/19/2019 The High Dividend Yield Return Advantage
The studies contained herein were comprised of long measurement periods and did not present information
or conclusions concerning the pattern, sequence, or consistency of high dividend investment returnsover shorter subsets of time within those long measurement periods. Questions such as whether theexcess returns from stocks with high dividend yields were generated in 50% of the years, or 30% of theyears, or in a several year “run” of outperformance followed by several “dry” years of underperformancewere not addressed. While some studies point in the direction of lower variability of returns for highdividend stocks, no effort was made in this paper to assess the impact of potential sector concentrationon the historical annual returns of high dividend yield stocks. In Tweedy, Browne’s own experience, thelong term annual return pattern for the high dividend yield portfolios under its management has beenvaried, with multiple annual periods of outperformance and underperformance in comparison to the
overall stock market, at times in back-to-back “hot” and “cold” periods.
As the studies in this paper have indicated, there have been recurring patterns of investment successfor high dividend yield stocks over very long periods of time. We believe that helpful perspective and,occasionally, patience and perseverance, are provided by an awareness of these patterns.
Conclusions, continued
8/19/2019 The High Dividend Yield Return Advantage