49
The Human Population and Its Impact Chapter 8
| Date post: | 23-Dec-2015 |
| Category: |
Documents |
| Upload: | homer-greer |
| View: | 214 times |
| Download: | 1 times |
The Human Population and Its Impact
Chapter 8

Crowded Street in China
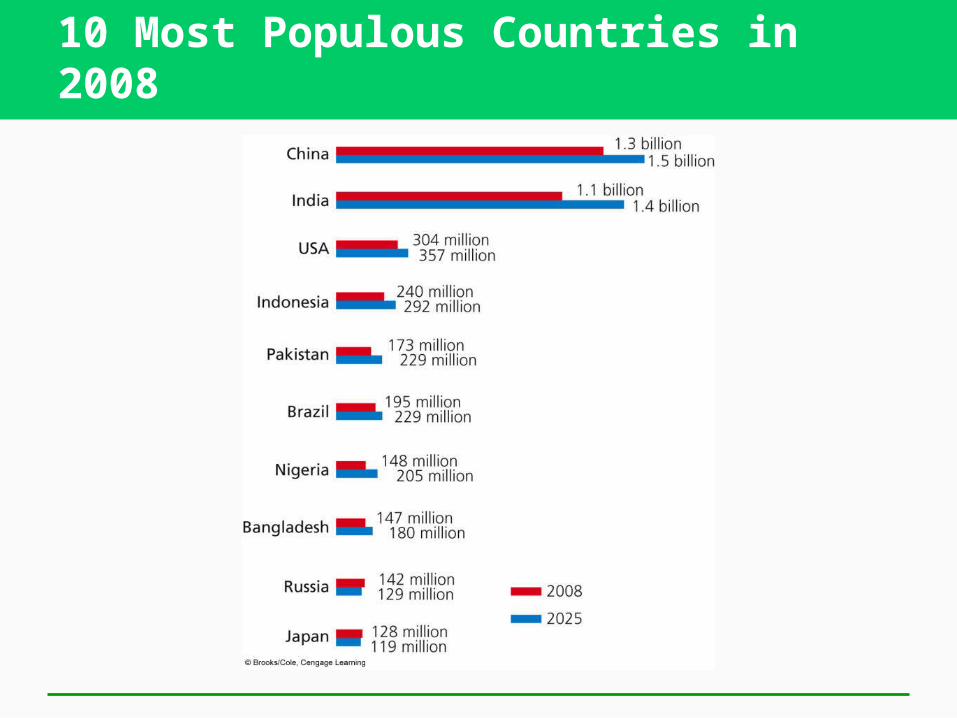
Global Connections: The World’s 10 Most Populous Countries in 2008
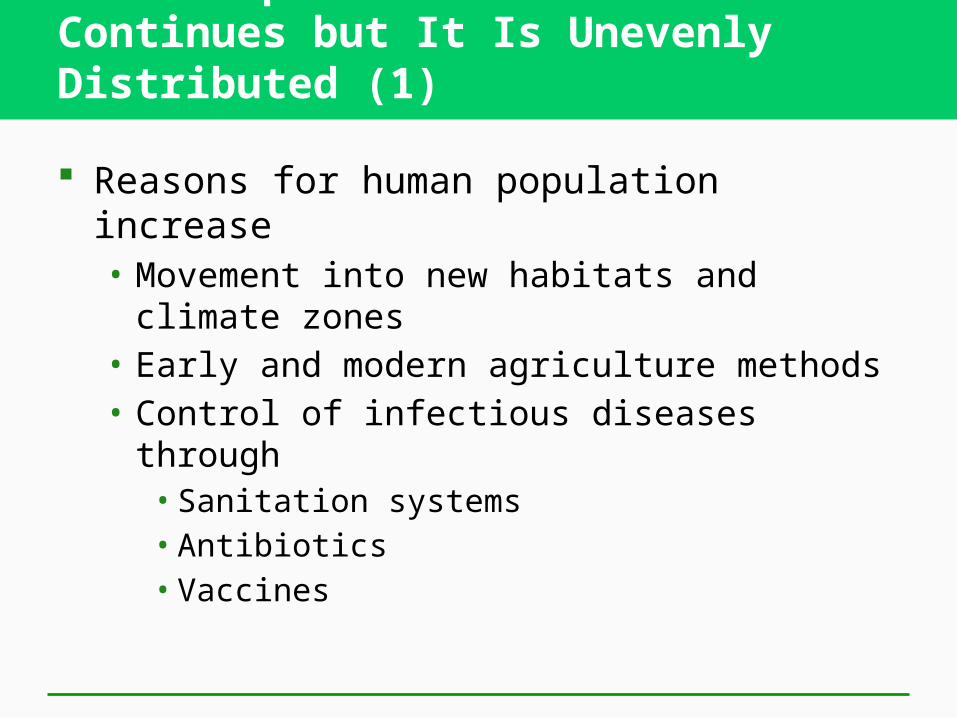
Human Population Growth Continues but It Is Unevenly Distributed (1)
Reasons for human population increase• Movement into new habitats and climate zones• Early and modern agriculture methods• Control of infectious diseases through• Sanitation systems• Antibiotics• Vaccines
Consider this
• In 1905 the three leading causes of death in the United States were pneumonia, tuberculosis and diarrhea.
• 90% of US doctors had NO college education

Science Focus: How Long Can the Human Population Keep Growing?
Thomas Malthus and population growth: 1798
Humans have altered 83% of the earth’s land surface
Can the human population grow indefinitely?

Video: Bonus for a baby

Video: People explosion
Animation: Resources depletion and degradation

The Human Population Can Grow, Decline, or Remain Fairly Stable
Population change• Births: fertility• Deaths: mortality• Migration
Population change =
(births + immigration) – (deaths + emigration) Crude birth rate- the number of live
births/1000 in a given year. Crude death rate- the number of deaths per
100 in a given year
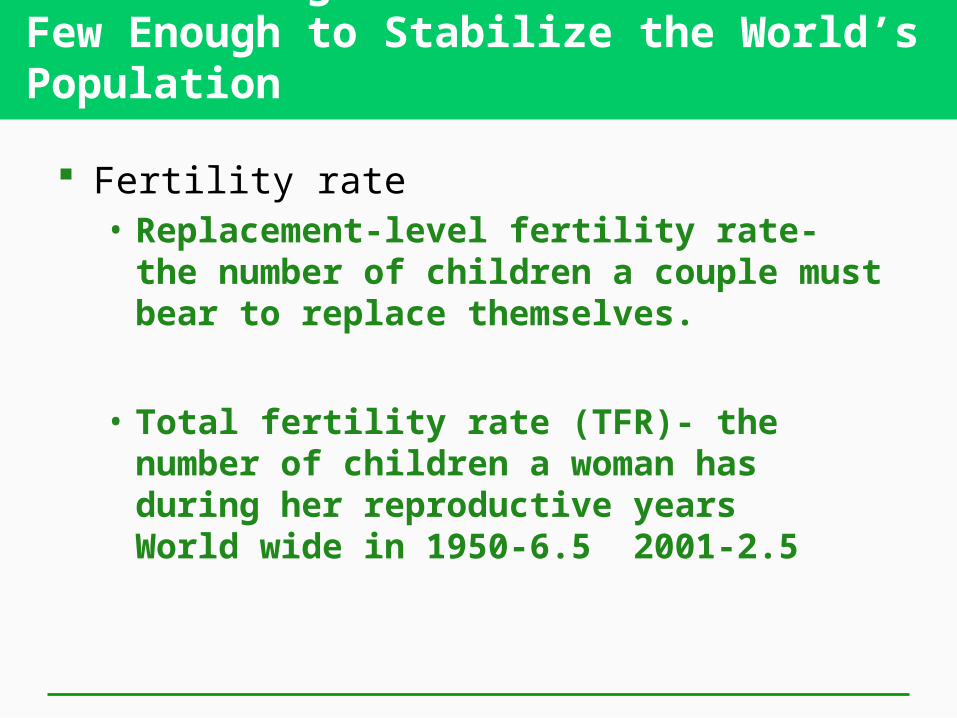
Women Having Fewer Babies but Not Few Enough to Stabilize the World’s Population
Fertility rate • Replacement-level fertility rate- the number of
children a couple must bear to replace themselves.
• Total fertility rate (TFR)- the number of children a woman has during her reproductive years World wide in 1950-6.5 2001-2.5

TFR Rates for the U.S. between 1917 and 2008

Birth Rates in the U.S. from 1910 to 2008
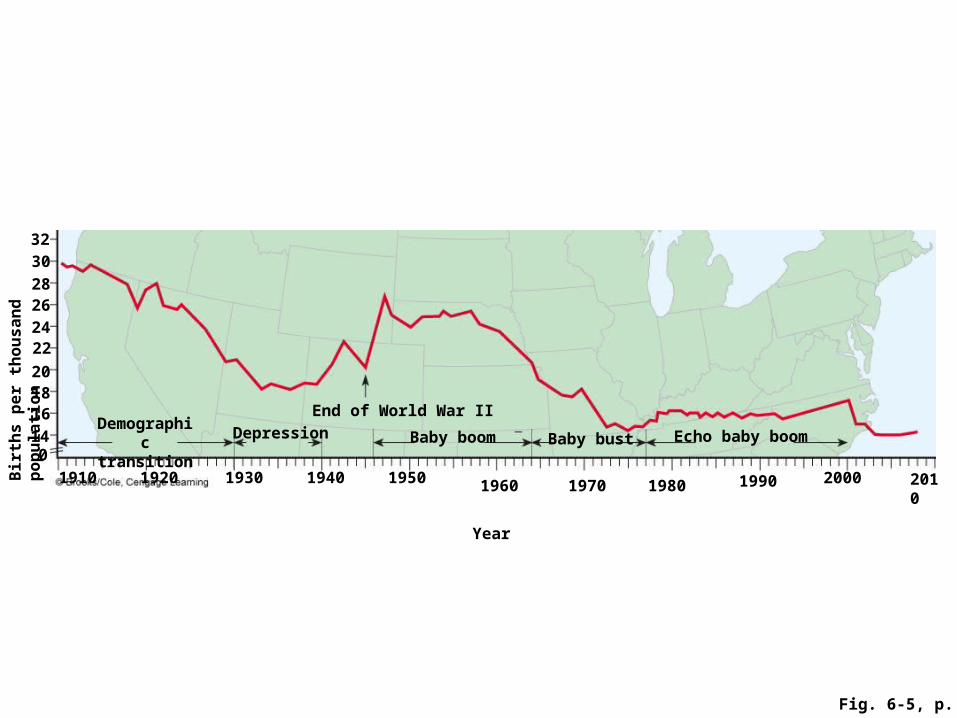
Fig. 6-5, p. 127
3230
28262422
201816 End of World War II
14 Depression Baby boom Baby bust Echo baby boomDemographic
transition
Bir
ths
pe
r th
ou
sa
nd
po
pu
lati
on
0
1910 1920 1930 1940 1950 1960 1970 1980 1990 2000 2010
Year

Some Major Changes That Took Place in the U.S. between 1900 and 2000

Several Factors Affect Death Rates (1)
Life expectancy-average number of years a newborn infant can expect to live.
Infant mortality rate – the number of babies out of every 1000 that die before their first birthday

Why are people living longer and fewer infants dying?Increased food supply and distributionBetter nutritionMedical advancesImproved sanitation

Several Factors Affect Death Rates (2)
U.S. infant mortality rate high due to• Inadequate health care for poor women during
pregnancy and their infants• Drug addiction among pregnant women• High birth rate among teenagers
Migration Affects an Area’s Population Size
Economic improvement
Religious freedom
Political freedom
Wars
Environmental refugees

Case Study: The United States: A Nation of Immigrants
Historical role of immigration in the U.S.
Legal immigration
Illegal immigration
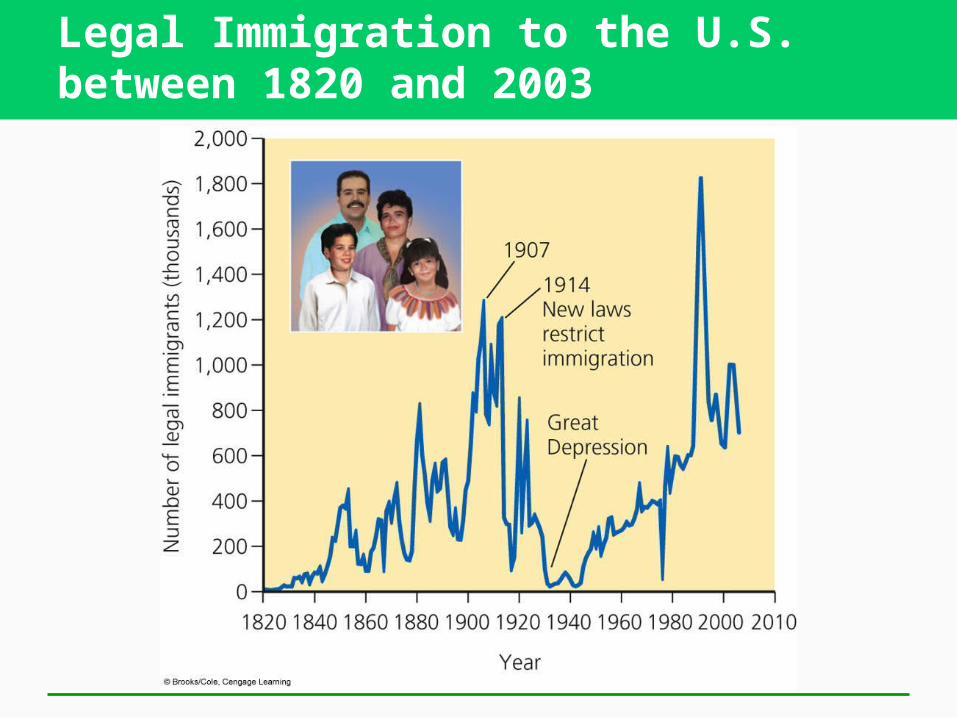
Legal Immigration to the U.S. between 1820 and 2003

Fig. 6-7, p. 129
2,000
1,800
1,600
19071,400
1914 New laws restrict immigration
1,200
1,000
800Great Depression600
400
Nu
mb
er o
f le
gal
im
mig
ran
ts (
tho
usa
nd
s)
200
Year
0
20102000198019601940192019001880186018401820

6-3 How Does a Population’s Age Structure Affect Its Growth or Decline?
Concept 6-3 The numbers of males and females in young, middle, and older age groups determine how fast a population grows or declines.

Populations Made Up Mostly of Young People Can Grow Rapidly
Age structure categories• Prereproductive ages• Reproductive ages• Postreproductive ages

Generalized Population Age Structure Diagrams

Fig. 6-8, p. 131
Male Female Male Female Male Female Male Female
Expanding Rapidly Guatemala
Nigeria Saudi Arabia
Expanding Slowly United States
Australia China
Stable Japan Italy
Greece
Declining GermanyBulgaria Russia
Prereproductive ages 0–14
Reproductive ages 15–44
Postreproductive ages 45–85+
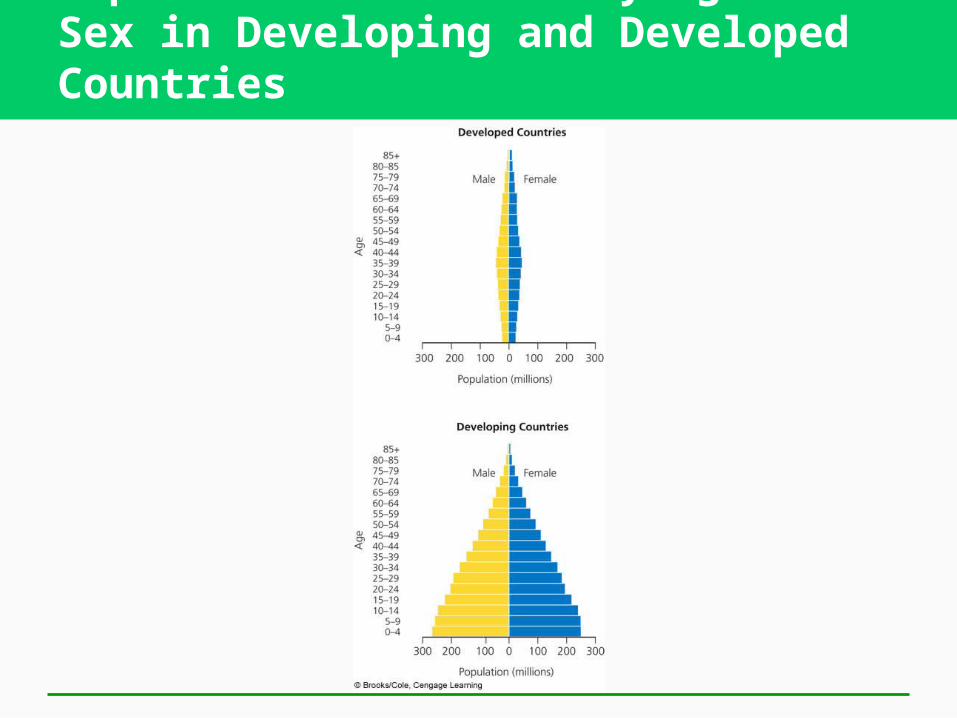
Population Structure by Age and Sex in Developing and Developed Countries

Fig. 6-9a, p. 131

Fig. 6-9a, p. 131
Developed Countries
80–8585+
75–7970–74 Male Female
60–6465–69
55–5950–5445–49
35–39Ag
e 40–44
25–2930–34
20–24
10–1415–19
5–90–4
300 200 100 0 100 200 300
Population (millions)
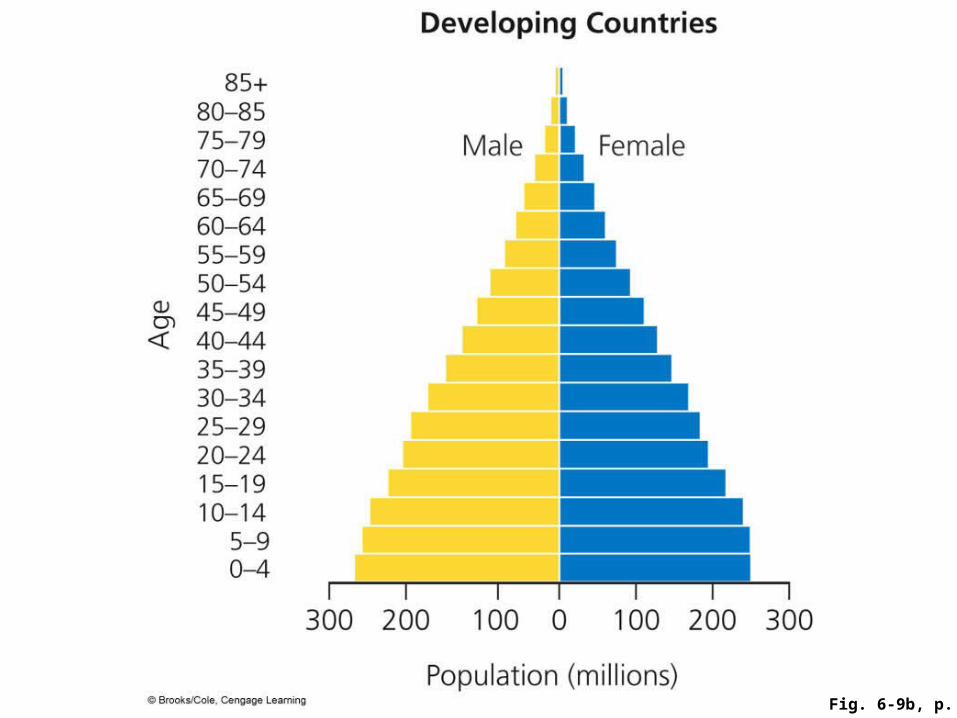
Fig. 6-9b, p. 131

Fig. 6-9b, p. 131
Developing Countries
80–8585+
75–7970–74
Male Female
60–6465–69
55–5950–5445–49
35–39Ag
e 40–44
25–2930–34
20–24
10–1415–19
5–90–4
300 200 100 0 100 200 300
Population (millions)

We Can Use Age-Structure Information to Make Population and Economic Projections
Baby boomers
Job market when they retire
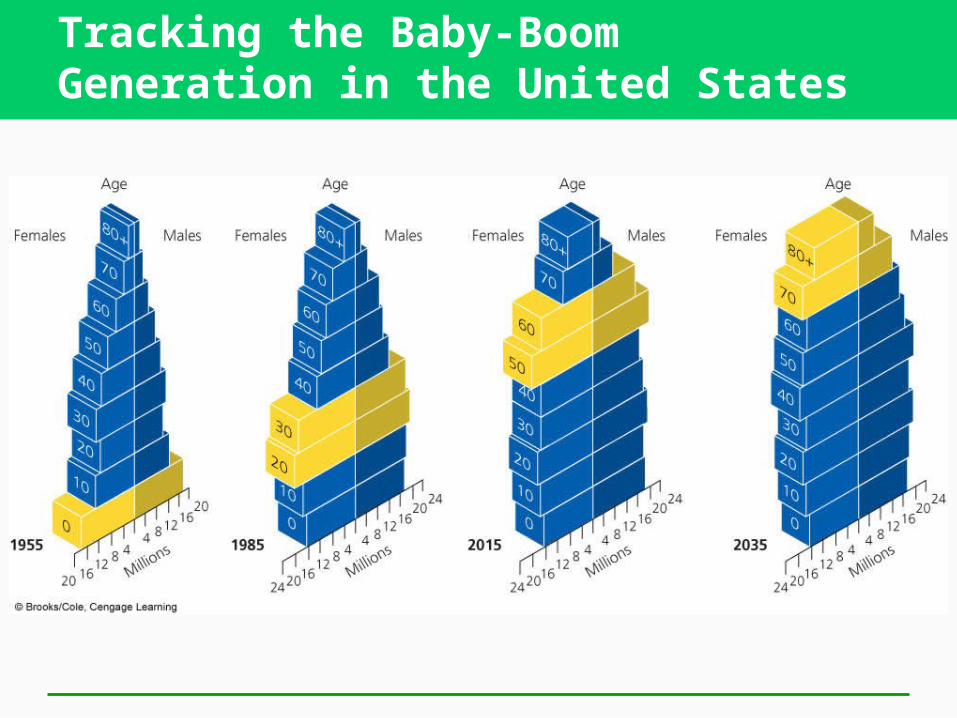
Tracking the Baby-Boom Generation in the United States

Populations Made Up of Mostly Older People Can Decline Rapidly
Slow decline• Manageable
Rapid decline• Severe economic problems• Severe social problems

Some Problems with Rapid Population Decline
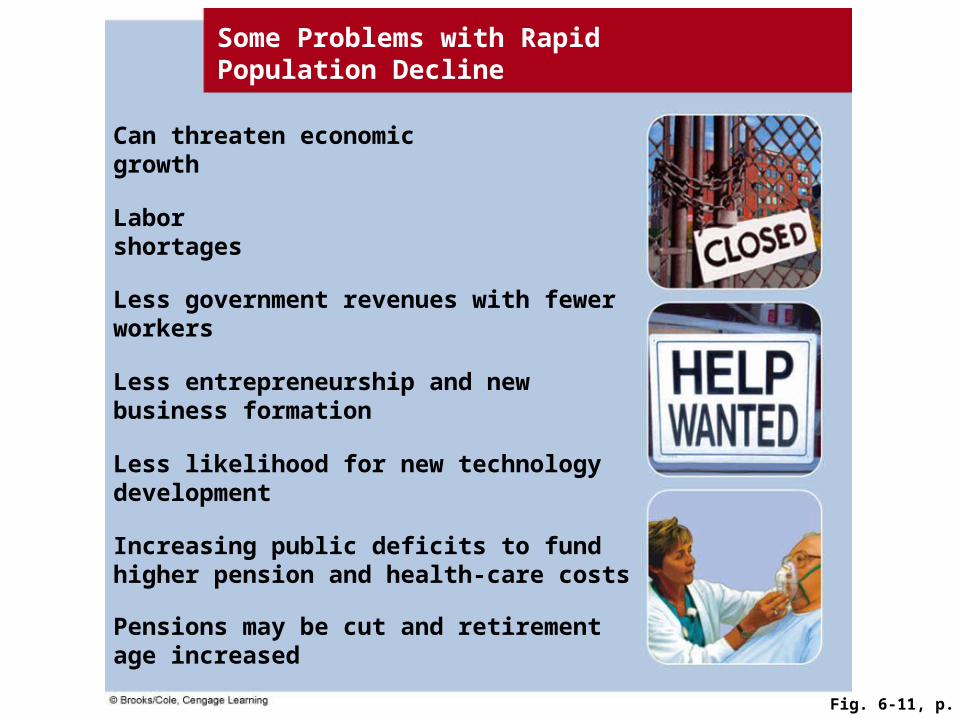
Fig. 6-11, p. 133
Some Problems with Rapid Population Decline
Can threaten economic growth
Labor shortages
Less government revenues with fewer workers
Less entrepreneurship and new business formation
Less likelihood for new technology development
Increasing public deficits to fund higher pension and health-care costs
Pensions may be cut and retirement age increased

Populations Can Decline from a Rising Death Rate: The AIDS Tragedy
25 million killed by 2008
Many young adults die: loss of most productive workers
Sharp drop in life expectancy
International community called upon to• Reduce the spread of HIV through education and
health care• Financial assistance and volunteers

Active Figure: Examples of age structure

Active Figure: U.S. age structure

6-4 How Can We Slow Human Population Growth?
Concept 6-4 Experience indicates that the most effective ways to slow human population growth are to encourage family planning, to reduce poverty, and to elevate the status of women.

As Countries Develop, Their Populations Tend to Grow More Slowly
Demographic transition stages • Preindustrial• Transitional• May lead to a demographic trap
• Industrial• Postindustrial

Four Stages of the Demographic Transition

Death rate
Total population
Birth rate
Population grows rapidly because birth rates are high and death rates drop because of improved food production and health
Decreasing
Stage 2Transitional
Increasing Very high
Fig. 6-12, p. 134
Stepped Art
Population growth levels off and then declines as birth rates equal and then fall below death rates
Stage 4Postindustrial
NegativeZero
Populationgrows veryslowly becauseof a highbirth rate(to compensatefor high infantmortality) and ahigh death rate
Stage 1Preindustrial
Growth rate over time
80
70
60
50
40
30
20
10
0
Bir
th r
ate
an
d d
eath
rat
e(n
um
ber
per
1,0
00 p
er
yea
r)
Low
Population growth slows as both birthand death rates drop because of improved food production, health, and education
Stage 3Industrial
Low

Planning for Babies Works
Family Planning• Responsible for a 55% drop in TFRs• In developing countries• Expansion of program• Include teenagers, sexually active unmarried
women, and men
Slow and stabilize population growth• Invest in family planning• Reduce poverty• Elevate the social and economic status of women

Empowering Women Can Slow Population Growth
Education
Paying jobs
Human rights without suppression
“For poor women the only holiday is when you are asleep”
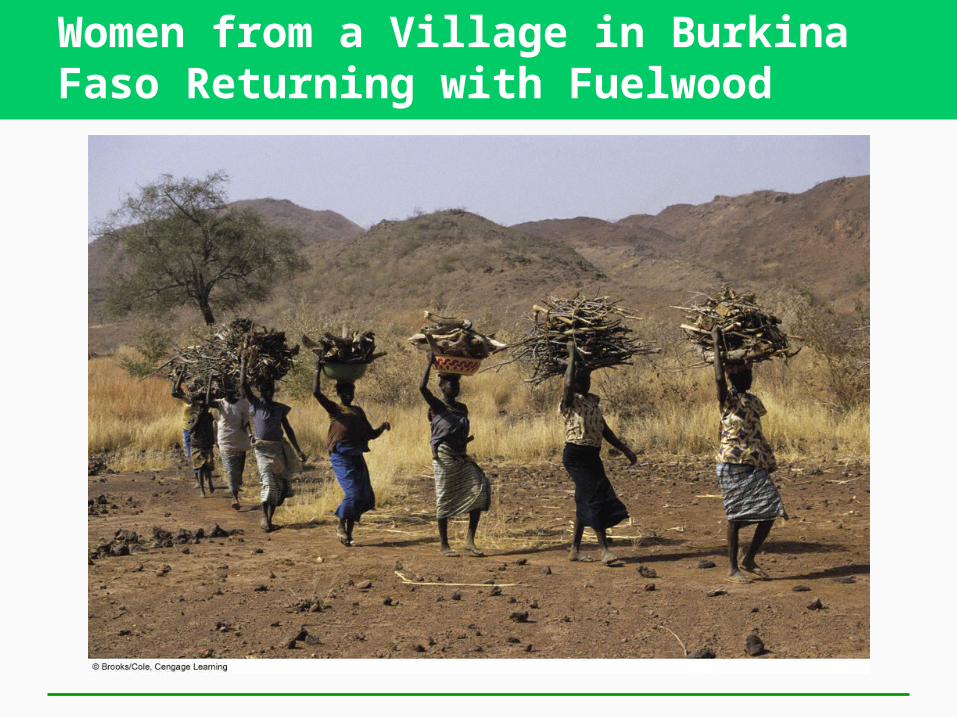
Women from a Village in Burkina Faso Returning with Fuelwood
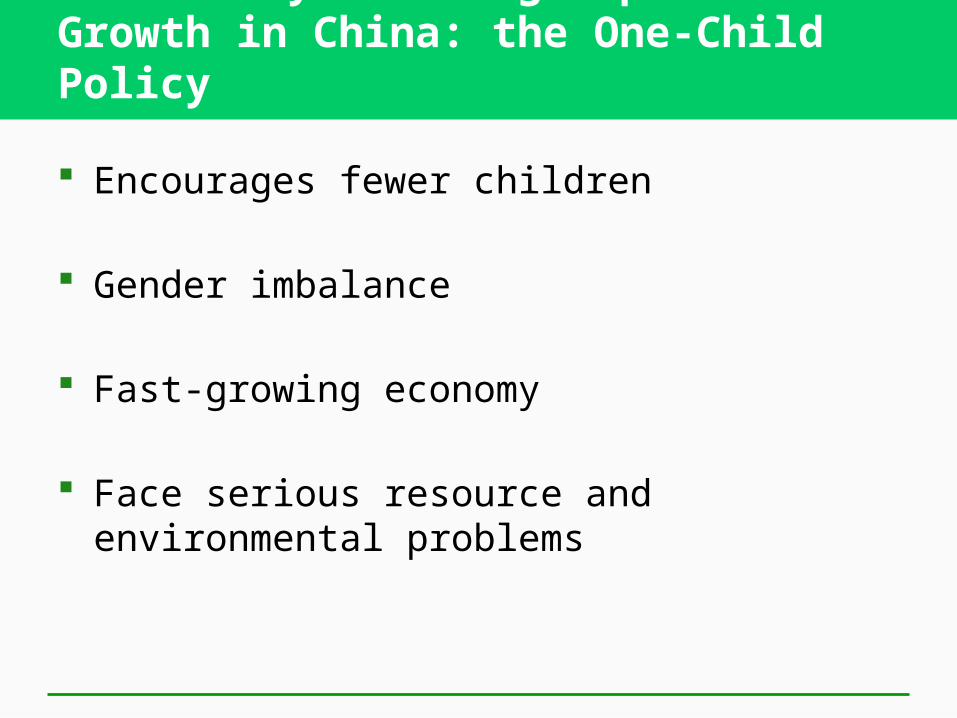
Case Study: Slowing Population Growth in China: the One-Child Policy
Encourages fewer children
Gender imbalance
Fast-growing economy
Face serious resource and environmental problems

Active Figure: Demographic transition model

Case Study: Slowing Population Growth in India
Population control: gender bias
Poverty
Malnutrition
Environmental problems


