Policy Research Working Paper 7664 e Impact of Business Support Services for Small and Medium Enterprises on Firm Performance in Low- and Middle-Income Countries A Meta-Analysis Tulio A. Cravo Caio Piza Development Research Group Impact Evaluation Team May 2016 WPS7664 Public Disclosure Authorized Public Disclosure Authorized Public Disclosure Authorized Public Disclosure Authorized
Transcript
Policy Research Working Paper 7664
The Impact of Business Support Services for Small and Medium Enterprises
on Firm Performance in Low- and Middle-Income Countries
A Meta-Analysis
Tulio A. Cravo Caio Piza
Development Research GroupImpact Evaluation TeamMay 2016
WPS7664P
ublic
Dis
clos
ure
Aut
horiz
edP
ublic
Dis
clos
ure
Aut
horiz
edP
ublic
Dis
clos
ure
Aut
horiz
edP
ublic
Dis
clos
ure
Aut
horiz
ed
Produced by the Research Support Team
Abstract
The Policy Research Working Paper Series disseminates the findings of work in progress to encourage the exchange of ideas about development issues. An objective of the series is to get the findings out quickly, even if the presentations are less than fully polished. The papers carry the names of the authors and should be cited accordingly. The findings, interpretations, and conclusions expressed in this paper are entirely those of the authors. They do not necessarily represent the views of the International Bank for Reconstruction and Development/World Bank and its affiliated organizations, or those of the Executive Directors of the World Bank or the governments they represent.
Policy Research Working Paper 7664
This paper is a product of the Impact Evaluation Team, Development Research Group. It is part of a larger effort by the World Bank to provide open access to its research and make a contribution to development policy discussions around the world. Policy Research Working Papers are also posted on the Web at http://econ.worldbank.org. The authors may be contacted at [email protected].
Interventions designed to support small and medium enter-prises are popular among policy makers, given the role small and medium enterprises play in job creation around the world. Business support interventions in low- and mid-dle-income countries are often based on the assumption that market failures and institutional constraints impede the growth of small and medium enterprises. Significant resources from governments and international organiza-tions are directed to small and medium enterprises to maximize their socioeconomic impact. Business-support interventions for small and medium enterprises in low- and middle-income countries most often relate to formaliza-tion and business environments, exports, value chains and clusters, training and technical assistance, and access
to credit and innovation. Very little is known about the impact of such interventions despite the abundance of resources directed to small and medium enterprise busi-ness-support services. This paper systematically reviews and summarizes 40 rigorous evaluations of small and medium enterprise support services in low- and middle-income countries, and presents evidence to help inform policy debates. The study found indicative evidence that overall business-support interventions help improve firm performance and create jobs. However, little is still known about which interventions work best for small and medium enterprises and why. More rigorous impact evaluations are needed to fill the large knowledge gap in the field.
The Impact of Business Support Services for Small and Medium Enterprises on Firm
Performance in Low- and Middle-Income Countries: A Meta-Analysis
Keywords: Private Sector Development, SME Development, Impact Evaluation, Firm
Performance, and Meta-Analysis.
JEL Classification: J21, J48, O10.
Acknowledgements: We thank Linnet Taylor, Lauro Gonzalez, Samer Abdenour, Anastasia de Santos, Vincenzo Salvucci, and Caroline Schimanski. We also thank participants in the USAID Microlinks seminar “Show Me the Data: Evidence & Experience on SMEs”. Excellent research assistance was provided by Ana Cristina Sierra, Isabel Musse and Isabela Furtado. Corresponding author: Caio Piza ([email protected]).
Small and medium enterprises (SMEs) are responsible for the majority of employment
generation in developed and developing countries (Ayyagari et al., 2007, 2011). Consequently,
they play a central role in socioeconomic policies. In developing countries, business-support
interventions are often based on the assumption that institutional constraints (or failures) impede
SMEs from reaching their full potential to generate jobs, profits, economic growth, and alleviate
poverty. Thus, the large financial resources allocated to the development of SME sectors by
governments and development organizations is intended to address institutional constraints and
allow SMEs to operate more efficiently, thus leading to productivity growth (Beck et al., 2005).
Development agencies provide a considerable amount of targeted assistance to SMEs in
low- and middle-income country economies (Beck et al., 2006). For instance, the World Bank
devoted $9.8 billion to SME projects during 2006-12 (IEG, 2013). For the same period, the
International Finance Corporation (IFC) of the World Bank Group directed $25 billion to SMEs.
However, there is limited evidence on the impact of SME support in the literature. This is due
either to an insufficient number of studies employing convincing identification strategies to isolate
the causal impact of the intervention under consideration or to limited information regarding the
mechanism underlying such interventions.
There is a need to systematically review and synthesize the evidence to provide an account
of the impact of different business-support programs on SMEs. This systematic review contributes
to the public debate by providing an account of the effect of different types of direct support on
firm performance. The evidence gathered and summarized is expected to help policy makers get a
comprehensive overview of the literature and SME interventions that have been most effective.
The review draws on economic theory to discuss the channels through which a particular
intervention can affect firm-level outcomes and synthesizes evidence of existing interventions
most frequently found in the literature: (i) matching grants, (ii) export promotion, (iii) innovation,
(iv) training (technical assistance), (iv) cluster-based development, and (v) tax simplification
policies. The aim is to synthesize the evidence of the impact of various interventions on different
firm outcomes such as employment creation, exports, innovation, investment, and labor
productivity, and firm performance indicators such as revenues and profits.
3
Understanding the mechanisms underlying each intervention is crucial if one is interested
in designing SME interventions for different contexts. We try to provide as much information as
possible on the potential causal chain of each intervention, given the information available in the
literature included in this paper. This review also provides an account of the limitations related to
the difficulties in the implementation of impact evaluations in the area of SME support and points
out that this is, therefore, an area that requires further thorough research.
This work builds on previous related literature and systematic reviews that focused on
specific sets of policies and included interventions that support micro-enterprise. For instance,
McKenzie and Woodruff (2014) analyze business training interventions that include micro-
enterprises and potential entrepreneurs. Similarly, Cho and Honorati (2014) focus on interventions
promoting entrepreneurship among potential or current entrepreneurs. Finally, Grimm and
Paffhausen (2015) provide a review more similar to this work by analyzing the impact of various
types of SME support, but their work focuses only on employment outcomes and includes
interventions with micro-entrepreneurs (for example, microfinance) and, in few cases, potential
entrepreneurs.
Our research differs from previous ones in many ways. First, all evidence coming from
studies with micro-enterprises are not covered in this review. We make this distinction because
self-employed and micro-entrepreneurs targeted by microfinance interventions, for example, are
thought to have a different nature compared to SMEs and are less likely to grow and create jobs
with individual interventions. In fact, these enterprises are often ineligible for the public
interventions covered in this review. Second, our review provides a thorough analysis of the impact
of different types of SME support on various firm outcomes (not only on employment outcomes)
and presents meta-analysis and meta-regression results disaggregated by type of intervention.
Third, our results shed some light on the impact of matching grant interventions, one of the most
popular interventions used by multilateral organizations such as the World Bank (Campos et al.,
2012).
The findings suggest that overall SME business support has a positive impact on firm
performance, employment creation, and labor productivity. When we look at interventions
separately, matching grants stand out as effective in creating jobs and improving firm performance
indicators. As will be discussed below, there is high variability in terms of number of studies per
intervention and robustness of the evidence. The rest of the paper is organized as follows: Section
4
2 presents the logical framework associated with the interventions considered in this review.
Section 3 describes inclusion criteria and search methods. Section 4 presents the search results and
included studies. Section 5 presents the meta-regression methodology, section 6 shows the results,
followed by the conclusion.
2. Logical Framework
Various approaches are used to provide support services to SMEs. We identified the main
among these approaches as relating to the following: formalization and the business environment,1
volume exported (intensive margin), value chains and clusters, training and technical assistance,
and finally, SME financing and innovation policies.
The literature on SME support can be divided into two distinct themes. The first considers
indirect support that addresses constraints to SMEs accessing credit, while the second addresses
the impact of direct business support on SMEs. In the first strand, many studies look at the impact
of indirect types of public support for SMEs, such as tax simplification, which is intended to
provide incentives for informal SMEs to formalize. The underlying assumption is that formal firms
are less credit-constrained than their informal counterparts and therefore formalization is an
effective way of helping entrepreneurs. Formalized firms are expected (assumed) to have higher
economies of scale and, consequently, be more productive, demand a more skilled labor force, and
have higher profits than informal firms. If informal firms are prevented from growing due to credit
constraints, then reducing the cost of formalization should, in theory, indirectly give informal firms
an opportunity to escape the informality-low productivity trap. Such interventions are an indirect
form of public support, as they target all firms with annual revenues below a certain threshold.
Moreover, all informal firms are incentivized to formalize through tax simplification. Those that
formalize do not directly receive other forms of public support.2
The second group of studies addresses the impact of direct business support on SMEs.
These generally estimate the impact of a support program on SMEs within a specific sector in a
1 The Research Group at the World Bank conducted several experimental and quasi-experimental evaluations to investigate the impact of regulatory changes aimed at reducing bureaucratic barriers to SME formalization and growth. See Bruhn and McKenzie (2013) for a review. 2 In fact, there are interventions that are targeted at formal enterprises only, such as subsidized credit lines. Thus, it is possible that after formalizing, some firms may end up being served by different interventions.
5
given country, with the intervention based on the assumption that SMEs face specific constraints
(for instance, a limited pool of skilled labor, limited innovation capability, and/or coordination
failures). In this view, SMEs need public support to break through specific constraints and, in turn,
improve their prospects for investment and productivity. A successful intervention may even
generate spillover effects on firms that do not belong to the program’s target group. These may
include firms in other sectors and/or informal firms in the same sector. This kind of support comes
in the form of training programs and support for innovation or value chain and association
strategies (for example, clusters), which are intended to address coordination failures. Notice that,
unlike the indirect public support programs, the unit of intervention is the firm itself. Firms are
directly targeted with programs that aim to help them shift from a low equilibrium (small size and
scale) to a high equilibrium (bigger scale and dynamism).
As this review investigated the impact of a diverse array of interventions, we provide a
theory of change for different types of interventions based on an initial search of the literature and
provide the causal chain for each type of SME program analyzed.
Support to SMEs is generally related to the dual goals of productivity growth and
employment generation. A general theory of change motivating SME support services is thus
linked to the improvement or creation of institutions that allow SMEs to reach their full potential
in growth and employment. Figure 1 below provides a general illustration of the simplified logical
framework related to each type of intervention considered in this review. The description of the
hypothesis entailed in each intervention model surveyed in this review is provided below.
6
Figure 1 – Logical Framework
Source: Own elaboration
1) Matching Grants/Credit. According to McKenzie (2011), this type of intervention is the
most widespread type of SME intervention in African countries. These programs consist of a
government subsidy with the government reimbursing the costs firms incur on training, marketing,
and/or attending trade fairs. This program is justified on the grounds that these investments have
positive externalities and that, on their own, firms are likely to invest less than the optimal level
(McKenzie, 2011). Subsidized credit lines through SME financing programs are popular and are
intended to tackle adverse selection and moral hazards in credit markets, problems that result in
financial constraints and limits to SME activities. The availability of credit is thought to allow
firms to invest and hire new employees and acquire productive assets. These investments are likely
to lead to productivity growth.
2) Training and management programs are based on the idea that market failures that limit
firm growth are related to the lack of skills in the workforce. Thus, skills acquired in specific
7
training programs should contribute to worker employability and wages and to firm productivity
(for example, through the adoption of more efficient management practices).
3) Interventions that support local production systems (LPS). These are based on the idea
that individual firms benefit from agglomeration externalities and coordination (for example,
Schmitz, 1995). For instance, consider a project in a region specialized in a given sector providing
incentives for firms to act collectively (such as training, joint purchases, or joint certifications).
Economic theory suggests that formal firms might act together to capture collective externalities,
experience mutual growth, and impact local economic performance. A successful project that
allows firms to benefit from positive externalities generated by collective actions would affect
outcomes such as employment and regional growth through: i) the establishment of collective
agreements, and ii) specific outputs from collective action. The resulting causal chain is as follows:
firms will organize around a common goal, enabling them to capture positive externalities from
collective actions. Collective actions are expected to generate intermediate outputs that allow firms
to achieve higher levels of productivity and employment and, in turn, positively impact regional
economic performance. Interventions related to agglomeration economies also relate to value
chains, networks, or clusters.3
4) Support for innovation policies. These involve funding for improving processes (Lagace
and Bourgault, 2003), and are intended to capture externalities stemming from innovations.
Innovation programs aimed at SMEs might support innovation transfer, R&D programs, and
certifications related to innovations (for example, process innovation and/or product
differentiation). The rationale is that innovation will impact productivity and growth of firms,
which contributes positively to regional and national growth.
5) Public intervention supporting access to external markets. Such interventions seek to
tackle information asymmetries that prevent firms from accessing external markets and involve
providing training and counselling. The identification and adaptation to external markets generates
exports that may lead to increased production, which, in turn, are thought to impact firm profits
and employment creation.
3 Like the papers included in this review, we do not try to provide a specific and precise definition of local agglomeration. For more about the difficulties related to the concept and definition of spatial agglomerations, please see Altenburg and Meyer-Stamer, (1999) and Martin and Sunley (2003).
8
6) Tax simplification. These initiatives are a form of indirect business support to SMEs and
are aimed at improving firm performance through formalization. Economic theory suggests that
formal firms grow by accessing credit markets and by taking advantage of economies of scale. A
tax simplification program could affect outcomes such as employment and profits through two
intermediate outcomes: 1) formalization rates and 2) access to credit. The causal chain could be
simplified as follows: the necessary conditions for a tax simplification program shifts informal
entrepreneurs from an equilibrium characterized by low productivity and profits to another where
they face fewer constraints to growth (as a result of formalization). Plenty of studies concentrate
only on final outcomes and thus shed little light on the mechanisms associated with tax
simplification/formalization (and consequently offer little policy guidance). The underlying
assumption is that formal firms are less credit-constrained than their informal counterparts and,
therefore, formalization is an effective way to help entrepreneurs. Indirect support to SMEs may
include policies regarding business registration, property registration, and regulatory frameworks
(Fajnzylber et al., 2011; Monteiro and Assunção, 2012; McKenzie, 2013).
The various result chains shown in Figure 1 are thus useful in providing the rationale
behind the types of interventions considered in this review.
3. Inclusion Criteria and Search Methods
This review focuses on studies that evaluate policies aimed at supporting SMEs in LMICs (as
defined by the World Bank). The focus on LMICs is justified, firstly, because private firms in these
countries tend to be more labor intensive and less innovative and, consequently, are the main
employers of a large proportion of the labor force (for example, Acz and Amoros, 2008; Cravo
et al., 2012). Secondly, restricting the scope to LMICs helps identify the binding constraints that
SMEs might face in similar institutional contexts.
A common definition of SMEs does not exist. This review mainly uses the most common
criteria used to classify SMEs based on employment information. The cut-off used to define SMEs
is 250 employees as Beck et al. (2005), Ayyagari et al. (2007), Cravo et al. (2012), Kushnir et al.
9
(2010).4 We also included studies that do not consider number of employees but use annual
revenue (based on national classifications) instead to classify SMEs. Importantly, as mentioned
above, interventions supporting entrepreneurship and the creation of micro-enterprises (for
instance, microfinance) are not considered for this research. These businesses, especially in
LMICs, comprise less productive or informal enterprises with only a few employees at the fringes
of markets. This is a major difference in our review when compared to Grimm and Paffhausen
(2015) who included studies focused on self-employed and microfinance. Further, these
enterprises are often ineligible for the public interventions covered in this review.
To examine the evidence on the effect of SME support services on firms, this review
focused on quantitative analysis and included only studies that used experimental (randomized
controlled trials, or RCTs) and quasi-experimental methods – such as regression discontinuity
design (RDD), instrumental variables (IV), difference-in-differences (DID), matching on
covariates, propensity-score matching (PSM), and any other studies that purported to control for
selection bias (for example, Heckman two-step estimator). Experimental and quasi-experimental
methods are regarded as good tools when the main objective is to estimate the causal impact of an
intervention or policy (for example, see Duflo et al. 2008). When an intervention is carefully
designed or the identification strategy of an observational study convincing enough, the findings
on the impact of the program or intervention are said to have internal validity. That is, one can
claim that the difference in the outcomes between treatment and control groups was caused by the
intervention. This review only considered those studies that assessed the impact of an intervention
comparing the treatment (or eligible) and the control (or comparison) groups. Moreover, studies
using matching methods needed to clearly state the eligibility criteria of the program to make the
case that the problem of selection bias was (mostly) due to observed characteristics.
Importantly, as described in the previous section, this review includes studies that
considered the impact of six different types of business-support services based on firm
performance. In addition, our study is more complete as it examines different firm-level outcomes
and does not restrict the analysis to employment outcomes as in Grimm and Paffhausen (2014).5
Our review covers studies that looked at both intermediate (or secondary) outcomes (such as access
4 Further, the European Union and the World Bank (see, for instance, the Enterprise Survey website www.enterprisesurveys.org) adopt 250 employees as a cut-off to classify SMEs. 5 Though the literature recommends that synthesis is informed by the theory of change embedded in the design of an intervention (see Waddington et al., 2012b), our focus extends beyond the outcomes directly anticipated by an intervention to also include unanticipated outcomes.
10
to credit, training, formalization, and access to external markets) and final (or primary) outcomes
(such as profits, employment generation, and productivity). To be included in the review the study
had to report estimates to at least one final outcome.6 Studies that reported estimates for
intermediary outcomes only were excluded. This review looked for context-specific variables that
can help explain either the failure or success of an intervention to understand the causal chain of
each intervention.
Search Methods
Following the setting up of the inclusion criteria, different search strategies were devised
to identify studies to be included in the review. The generalized search strategy covered a
comprehensive set of published and unpublished sources. We prioritized electronic searches since,
regarding interventions of interest; it was most likely that sources available electronically were
reported in formal literature on SMEs or in the ‘grey literature’ from national and international
organizations.
The first stage of the review involved a search for all published and unpublished studies
likely to be relevant to our objectives. To be included, the studies had to: i) report on SME support
interventions of the kind detailed in the section on interventions; ii) focus on LMICs, as defined
by the World Bank; and, iii) have occurred after 2000, since the review would cover studies that
used impact evaluation techniques that evolved since that year.
Given the variety of interventions covered in this research, reference ‘snowballing’ was an
effective strategy to begin our search (Hammerstrøm et al., 2009; cited in Waddington et al., 2012).
Reference snowballing consists of using existing reviews, papers, and reports to identify the set of
studies to be reviewed. Our search strategy, therefore, also drew on a first set of important studies
identified in an initial screening. We then conducted the electronic search that is described in detail
in appendix A and Piza et al. (2016).
6 The selected studies reported on at least one impact relating to firm outcomes, either intermediary or final. For the purposes of this review, we defined firm performance impacts as referring to objective indicators such as revenues, profits, job creation, innovation, formalization, number of workers trained, and access to credit. Only factual/objective measures of firm performance impacts are included: subjective measures on beliefs and perceptions are excluded.
11
4. Search Results and Included Studies
4.1. Search Results
The initial electronic search returned 9,475 studies, which was reduced to 5,785 after dropping of
duplicates. The final list of studies was examined with all filters outlined above, which assessed
the impact of an SME intervention using rigorous evaluation methods. With that in mind, abstracts
of all 5,785 studies were read. It was noted that the great majority either did not use quantitative
methods to assess the impact of an intervention nor used a rigorous method to address selection
problems or looked at interventions targeting micro-entrepreneurs.
Three researchers, working independently, were involved in applying the selection criteria.
They read the abstracts and drew up a list of 63 papers that passed all filters. The list dropped to
42 after excluding 21 studies that only covered micro-enterprises. The papers were then classified
according to the methods used: quasi-experimental and experimental methods respectively.
The 42 studies where thoroughly examined to decide whether they should be included in
the review. We excluded six studies that looked exclusively at intermediate outcomes – such as
formalization rates and numbers of new firms – and different versions of the same study. We also
excluded 13 studies that did not use rigorous evaluation methods to address causality. The
snowballing strategy added 17 studies and generated a final list of 40 studies (23 from the search
of online platforms and 17 from snowballing). A further four studies were dropped because we
were unable to compute a standardized effect size and/or their standard errors. To compare effect
sizes across studies, we used two standardized measures reported in section 5.1 and described in
detail in appendix B.
The empirical analysis, therefore, included 36 studies and 72 effect size (ES) per
intervention-outcome study. The large number of ES is because a few studies tested the impact of
several interventions together and then separately on the same outcomes and some randomized
controlled trials tested the effect of more than one treatment arm.
12
4.2. Included Studies
Figure 2 shows the cumulative number of studies produced between 2003 and 2014.
Between 2003 and 2010, only 16 studies used experimental or quasi-experimental techniques to
assess the impact of different business support to SMEs. Between 2011 and 2014 that number
more than doubled.
Figure 2 – Cumulative Number of Studies Per Year
Source: Own elaboration
Figure 3 shows that the evidence from 18 countries, most of which are in the Latin American
region. As noted in Grimm and Paffhausen (2015), this could be because countries in this region
have many experiences with active labor market policies over the past two decades.
labor productivity (11.1 percent), and investment and innovation (8.3 percent).
411
61
63
11
22
15
12
111
ArgentinaBangladesh
BoliviaBrazil
Bulgaria/Georgia/Russia/UkraineChile
ColombiaEgypt
EthiopiaGhanaKorea
MoroccoMexico
PeruSri LankaTunisiaTurkey
Vietnam
14
Figure 4 – Percentage of Outcomes Analyzed
One ES per Treatment per Study – 72 ES in total
Source: Own elaboration
5. Meta-Analysis
This review investigates the impact of a diverse array of SME support. The types of support
include matching grants/credit, innovation support, support for exports, tax simplification,
training, and local production systems (LPS). The impact of these interventions was analyzed in a
series of outcomes such as employment creation, exports, innovation, investment, labor
productivity, and firm performance. This section presents the results from the data extracted from
the papers included in the review. Table C.1 (appendix C) in the annex provides a summary of
each study included in the review.
An initial forest plot analysis provides a summary of the effect size of the interventions and
outcomes considered in this review. The figures illustrate the effect size of interventions on
different outcomes and the heterogeneity of the results. The overall effect was computed assuming
a random effects (RE) model. A RE model assumes there might be different ES underlying
different studies and interventions and that the total variance for these should account for between-
studies variance (see Borenstein et al. 2009). We also report the confidence intervals for each
access to credit, 2.78
job creation, 20.83
export, 15.28
firm performance, 27.78
formal, 5.56
innovation, 8.33
investment, 8.33
labour productivity, 11.11
15
overall estimate and their p-values to assess statistical significance. To provide a more robust set
of results, meta-regressions are used to analyze the impact of SME support programs on firm
outcomes controlling for moderator factors.
5.1 Computing Effect Sizes
Most studies included in this paper use quasi-experimental methods to estimate the causal effect
of a program. The majority of papers estimate the average treatment effect on the treated (ATT),
but few estimate the local average treatment effect (LATE) instead.
For our meta-analyses, the unit of analysis was the study.7 Nonetheless, several studies
performed more than one estimate for the same outcomes. For example, in some cases, studies
report on different interventions and in others, different specifications are tested for the same
intervention. In any case, there was a need to synthesise several estimates for the same
intervention (for example, matching grant) and outcomes (for example, employment). When a
study covered more than one treatment (for example, matching grants and technical assistance)
and provided estimates for each treatment separately and for ‘whatever’ treatment without
distinguishing between the two treatments, we opted to use only the latter estimate to compute
overall effect size when all different interventions were pooled.8 In this case, the treatment
dummy is defined as one if a firm is supported by ‘any program’ (in the example, either
matching grants or technical assistance) and zero if not (as in Hong Tan, 2011; López-Acevedo
et al., 2011).
When such ‘synthetic effect’ is not provided, we determined it by taking a simple average
of the ES across different interventions per outcome per study (Lipsey and Wilson, 2001). In
such cases, the variance of different effect sizes was computed assuming zero covariance
because in most cases overlap was limited. That is, firms either participated in one program or
7 As discussed in Duvendack et al. (2012), there is not a consensus of whether meta-analysis should be performed for quasi-experimental studies. In this review we decided to use meta-analysis to have the ‘big picture’ of the impact of interventions aimed at SMEs. However, in face of the challenges in practice and decisions made, we argue that these results should be treated with care. 8 Alternatively, we could have computed a weighted average of two separated coefficients.
16
another.9 Averaging out across standardised ES provided in the same study was necessary to
generate one overall ES per outcome per study so we could carry out meta-analysis pooling
together different business-support programs.
We also performed subgroup analyses, looking at some interventions separately. For
instance, our review reports on a relatively high number of studies looking at the effect of
matching grants on firm outcomes. In cases where the same study tested the impact of more than
one intervention (for example, matching grants and technical assistance), we first averaged the
ES for matching grants and technical assistance separately and then took a simple average to
obtain an overall ES per outcome per study. As before, this was to estimate an overall
standardized ES across different intervention; and again we computed the variance assuming
covariance between effect sizes as zero.10
When sample sizes and treatment effects for subgroups are available, we computed
summary effects as a weighted average of the effects’ sizes. As before, we also computed the
variance by assuming covariance between the ES equals zero because this seems to be a
plausible assumption for cases where overlap between subgroups is non-existent or small, that is,
where the ES are plausibly independent.
In sum, we provide synthesised ES for three primary outcomes: (1) firm performance; (2)
employment; and (3) labour productivity. For four secondary outcomes, (a) exports, (b)
investment, (c) innovation, and (d) formalization rates, we show the forest plots with individual
estimates in the appendix since we did not systematically review studies looking specifically at
those outcomes. The effect sizes used to construct forest plots for the initial analysis are
subsequently used in the meta-regression estimations.
After obtaining the effect sizes and their respective SE per outcome per study, we computed
forest plots for an initial visualization of the results.
9 Since variance of (a+b) = var(a) + var(b) – 2 Cov(a,b), assuming Cov(a,b) = 0 is a conservative assumption as it implies lower precision of overall effects unless the covariance is negative. On average, we expect the covariance across studies to be close to zero. We also believe this is a reasonable assumption because, according to these studies, the number of firms taking up different treatments is not high. Given the restricted overlap between different treatments, we do not believe there is reason to worry about high correlation between firms participating in different interventions. It is important to clarify that by doing this we are not averaging across outcomes, but instead, across different ES for a given outcome. 10 In other words, we did not combine estimates obtained for firms receiving matching grants only with estimates for firms receiving package of interventions (for example, matching grants and technical assistance).
17
6. Results
This section provides an overview of the overall average effect of business-support programs to
SMEs. We start by aggregating all interventions and providing evidence for single interventions
when sample size (number of studies) allows. We use forest plots and random effect estimates to
compute the average standardized effect size and use I-squared and tau-squared statistics to
compute variability of our main findings.11 The results are summarized for the final (or primary)
outcomes of employment, productivity, and firm performance.
6.1 Forest Plot Analysis
Our review found 18 ES related to firm performance across different interventions as
illustrated in panel A of the forest plot (figure 5).12 The forest plot reports the standardized ES
(SMD) of each study and the overall average across interventions. The interventions included in
this figure consider different group of firms (for example, sector) and aim to tackle different
market failures. Nevertheless, providing an overall picture of the interventions covered in the
review can still be relevant for policy making.13
On average, interventions aimed at improving firm performance had a positive and
significant effect of 0.13 standard deviations. Interestingly, the heterogeneity between studies is
relatively small. The tau-squared is very low (0.0196). As indicated by the statistic I-squared
(92.1 percent), there is an indication of high heterogeneity across studies. This measure captures
the degree of inconsistency in the studies’ results (Higgins et al., 2003).
Since our review included seven ES for studies that examined the impact of matching
grants programs, our data allows us to look at the effect of these two interventions on firm
11 We report forest plot and heterogeneity measures, such as the Chi-squared test for heterogeneity (which captures within-study variance), the I-squared statistic, which we interpret as the proportion of total variance across the observed effects explained by between-study variance, and τ^2 (tau-squared), an estimate for the variance of the ‘true effect size’ (see Borenstein et al., 2009). Borenstein et al. (2009, p.118) argue that “I-squared is a descriptive statistic and not an estimate for any underlying quantity.” 12 Figure 5 reports forest plots dropping studies with ES that are outliers. The results with the full set of observations are similar (see Piza et al., 2016). 13 The decision to report overall effect for different interventions was also made, for instance, in a systematic review that covered the impact of interventions aimed at improving children’s enrollment in primary and secondary schools. See Petrosino et al., 2012.
18
performance in isolation. Panel B of figure 5 shows that the effect of MG on firm performance
equals 0.15 and is similar to that obtained with all interventions pooled together.
The number of ES for employment outcome is 13 (see panel C, figure 5). Although most
of the evidence comes from Latin America, the figure suggests that different types of business
support for SMEs help create jobs in almost all the countries considered. On average, programs
targeted at SMEs tend to help with employment creation. The overall effect is equal to 0.15
standard deviations and statistically significant. Despite the smaller number of cases, the tau-
squared statistic points to a between-study variance of 0.081; that is, the between-study variance
accounts for more than 50 percent of the pooled effect size (0.08/0.15). The high value of I-squared
statistic (99.2 percent), though, indicates a high true between-study variability. This result is
consistent with the view that SMEs are an important source of job creation. When we look at the
effect of matching grants on employment (panel D), the results are similar with a positive effect
size of 0.14 SD. Nevertheless, the reduction in the number of studies leads to higher variability
between the point estimates as captured by the tau-squared (0.133) and I-squared statistics (99.4
percent).
The number of ES results for labor productivity is seven. The evidence comes almost
exclusively from countries in Latin America (see panel E). The overall effect size is 0.11,
indicating that SME support might affect productivity. The overall variance is relatively low as
the I-squared statistic indicates that 88.7 percent of the total variance is explained by between-
studies variability and the tau-squared is low (0.0117). When we look only at the effect of
matching grants, we find a small effect that is not statistically different from zero (-0.02 SD with
a 95 CI of (-0.15, 0.10)) – see figure 5, panel F.
The initial indication of a positive impact of SME support on firm performance is
interesting and can have at least two possible interpretations. First, it can be argued that business
support of any sort works as subsidies (‘free money’) that end up favoring firms that would actually
be able to carry on without any injection of public resources, that is, a picking the winners
argument. On the other hand, one could take this result as an indication that SME interventions of
any sort are key to SMEs needing a ‘nudge’ to increase performance (or survive). To shed light on
these two competing views, we looked at the effect of MG on secondary outcomes, such as
investment. There seem to be some positive effects on investment, as shown in figure D.9 in the
19
appendix. In the meta-regression analysis, we also approached this issue indirectly by looking at
whether firm size is associated with the final outcomes.
NOTE: Weights are from random effects analysis
Overall (I-squared = 92.0%, p = 0.000)
Aivazian & Santor
Gourdon et al
Rijkers et al
Cassano et al
Lopez-Acevedo & Tinajero
Arraiz et al
Rand & Torm
McKenzie & Sakho
De Mel et al
Bruhn et al
Atkin et al
Sekkat
Crespi et al
Author
Benavente and Crespi
Karlan et alTan & Lopez-Acevedo
Fajnzylber et al.
Oh et al
2008
2011
2010
2013
2011
2012
2011
2009
2011
2012
2014
2011
2011
year
2003
20142005
2012
2008
Sri Lanka
Tunisia
Ethiopia
RUS/BGR/UKR/GEO
Mexico
Chile
Vietnam
Bolivia
Sri Lanka
Mexico
Egypt
Marocco
Colombia
country
Chile
GhanaMexico
Brazil
Korea
0.13 (0.05, 0.20)
-0.10 (-0.32, 0.13)
0.11 (-0.12, 0.34)
-0.13 (-0.39, 0.12)
0.26 (0.14, 0.37)
0.21 (0.13, 0.29)
0.18 (0.07, 0.28)
0.09 (-0.02, 0.20)
0.17 (-0.04, 0.37)
0.22 (-0.05, 0.49)
0.10 (-0.10, 0.30)
0.05 (-0.22, 0.32)
0.20 (0.02, 0.39)
0.02 (0.01, 0.04)
ES (95% CI)
0.28 (0.03, 0.54)
-0.06 (-0.30, 0.18)-0.02 (-0.13, 0.09)
0.34 (0.30, 0.39)
0.17 (0.12, 0.21)
100.00
4.55
4.50
4.10
6.48
7.08
6.62
6.50
%
4.90
3.83
5.00
3.85
5.17
7.62
Weight
4.10
4.256.55
7.43
7.46
0-.538 0 .538
Panel A - All interventions: Firm Performance
NOTE: Weights are from random effects analysis
Overall (I-squared = 96.5%, p = 0.000)
Karlan et alRand and Torm
Arraiz et al
Author
Duque & Munoz
Cassano et al
Rijkers et al
Benavente & Crespi
Oh et al
Hong Tan
20142011
2012
year
2011
2013
2010
2003
2008
2011
GhanaVietnam
Chile
country
Colombia
RUS/BGR/UKR/GEO
Ethiopia
Chile
Korea
Chile
0.13 (-0.04, 0.30)
-0.02 (-0.27, 0.22)0.09 (-0.02, 0.20)
0.18 (0.07, 0.28)
ES (95% CI)
0.56 (0.42, 0.71)
0.26 (0.14, 0.37)
-0.13 (-0.39, 0.12)
0.28 (0.03, 0.54)
0.17 (0.12, 0.21)
-0.24 (-0.28, -0.19)
100.00
9.8911.66
11.73
Weight
11.26
11.65
9.73
9.73
12.19
12.17
%
0.13 (-0.04, 0.30)
-0.02 (-0.27, 0.22)0.09 (-0.02, 0.20)
0.18 (0.07, 0.28)
ES (95% CI)
0.56 (0.42, 0.71)
0.26 (0.14, 0.37)
-0.13 (-0.39, 0.12)
0.28 (0.03, 0.54)
0.17 (0.12, 0.21)
-0.24 (-0.28, -0.19)
100.00
9.8911.66
11.73
Weight
11.26
11.65
9.73
9.73
12.19
12.17
%
0-.714 0 .714
Panel B - Matching Grants: Firm Performance
Figure 5 - Forest plot - final outcomes
20
NOTE: Weights are from random effects analysis
Overall (I-squared = 92.8%, p = 0.000)
Lopez-Acevedo & TinajeroKaplan et al
Cassano et al
Arraiz et al
Karlan et al
Author
De Mel et al
Machado et al
Castillo et al
Oh et al
Gourdon et al
Hong TanCrespi et al
Bruhn et al
20112011
2013
2012
2014
year
2011
2011
2010
2008
2011
20112011
2012
MexicoMexico
RUS/BGR/UKR/GEO
Chile
Ghana
country
Sri Lanka
Brazil
Argentina
Korea
Tunisia
ChileColombia
Mexico
0.15 (0.08, 0.22)
0.18 (0.10, 0.25)0.22 (-0.21, 0.65)
0.35 (0.23, 0.46)
0.13 (0.02, 0.24)
-0.09 (-0.33, 0.15)
ES (95% CI)
0.16 (-0.11, 0.44)
0.09 (0.03, 0.15)
0.32 (0.27, 0.38)
0.14 (0.10, 0.19)
0.33 (0.10, 0.56)
0.05 (-0.00, 0.10)0.02 (0.00, 0.04)
0.12 (-0.08, 0.32)
100.00
9.502.28
8.39
8.65
4.88
Weight%
4.31
9.88
10.02
10.23
5.20
10.1410.56
5.96
0-.649 0 .649
Panel C - All interventions: Employment
NOTE: Weights are from random effects analysis
Overall (I-squared = 93.8%, p = 0.000)
Arraiz et alMachado et al
Cassano et al
Hong Tan
Author
Castillo et alOh et al
Karlan et al
20122011
2013
2011
year
20102008
2014
ChileBrazil
RUS/BGR/UKR/GEO
Chile
country
ArgentinaKorea
Ghana
0.14 (0.03, 0.24)
0.13 (0.02, 0.24)0.09 (0.03, 0.15)
0.35 (0.23, 0.46)
-0.00 (-0.05, 0.04)
ES (95% CI)
0.32 (0.27, 0.38)0.14 (0.10, 0.19)
-0.19 (-0.43, 0.06)
100.00
14.1015.61
13.77
15.92
Weight
15.7716.02
8.81
%
0.14 (0.03, 0.24)
0.13 (0.02, 0.24)0.09 (0.03, 0.15)
0.35 (0.23, 0.46)
-0.00 (-0.05, 0.04)
ES (95% CI)
0.32 (0.27, 0.38)0.14 (0.10, 0.19)
-0.19 (-0.43, 0.06)
100.00
14.1015.61
13.77
15.92
Weight
15.7716.02
8.81
%
0-.464 0 .464
Panel D - Matching Grants: Employment Creation
Figure 5 - Forest plot - final outcomes (continued)
21
NOTE: Weights are from random effects analysis
Overall (I-squared = 31.3%, p = 0.189)
Castillo et al
Oh et al
Chudnovsky et al
SanguinettiLopez-Acevedo & Tinajero
Hong Tan
Author
Arraiz et al
2010
2008
2006
20052011
2011
year
2012
Argentina
Korea
Argentina
ArgentinaMexico
Chile
country
Chile
0.11 (0.08, 0.15)
0.07 (0.01, 0.12)
0.14 (0.09, 0.18)
-0.07 (-0.28, 0.15)
0.08 (-0.17, 0.32)0.10 (0.03, 0.18)
0.15 (0.10, 0.20)
ES (95% CI)
0.15 (0.04, 0.25)
100.00
21.68
%
27.26
2.41
1.8614.13
24.23
Weight
8.43
0.11 (0.08, 0.15)
0.07 (0.01, 0.12)
0.14 (0.09, 0.18)
-0.07 (-0.28, 0.15)
0.08 (-0.17, 0.32)0.10 (0.03, 0.18)
0.15 (0.10, 0.20)
ES (95% CI)
0.15 (0.04, 0.25)
100.00
21.68
%
27.26
2.41
1.8614.13
24.23
Weight
8.43
0-.325 0 .325
Panel E - All interventions: Productivity
NOTE: Weights are from random effects analysis
Overall (I-squared = 90.6%, p = 0.000)
Author
Arraiz et al
Oh et al
Castillo et al
Chudnovsky et al
Hong Tan
year
2012
2008
2010
2006
2011
country
Chile
Korea
Argentina
Argentina
Chile
0.05 (-0.05, 0.15)
ES (95% CI)
0.15 (0.04, 0.25)
0.14 (0.09, 0.18)
0.07 (0.01, 0.12)
-0.07 (-0.28, 0.15)
-0.07 (-0.12, -0.02)
100.00
Weight
19.11
23.43
22.84
11.48
23.14
%
0.05 (-0.05, 0.15)
ES (95% CI)
0.15 (0.04, 0.25)
0.14 (0.09, 0.18)
0.07 (0.01, 0.12)
-0.07 (-0.28, 0.15)
-0.07 (-0.12, -0.02)
100.00
Weight
19.11
23.43
22.84
11.48
23.14
%
0-.283 0 .283
Panel F - Matching Grants: Productivity
Figure 5 - Forest plot - final outcomes (continued)
Meta-Regression
The forest plots presented earlier provide a useful preliminary discussion about the effect
size of SME-support programs. However, forest plots are not able to control for moderator factors
(for example, size of firms and regional characteristics and risk of bias of studies). Meta-
regressions are estimated to provide a better account of effect size related to SME-support
programs.
The meta-regression analysis is performed for the pooled sample of interventions and for
matching grants separately. For matching grants we are able to control – separately due to sample
constraints – for another three secondary outcomes: investment, access to export, and innovation.
The overall effect was estimated using a random effects (RE) model. A RE model assumes there
might be different ES underlying different studies and interventions and that the total variance for
these should account for between-studies variance (see Borenstein et al., 2009). We also report the
confidence interval for each overall estimate and its p-value to assess statistical significance. The
baseline framework is as follows:
where is the outcome, includes the type of intervention and is the error term. Extensions
of the baseline model include four additional moderator factors; Latin America and Africa
variables, firm size, and risk of bias indicator created based on a careful risk of bias assessment
(see appendix D). The meta-regressions are estimated for final and intermediary outcomes.
Primary Outcomes
Table 1 shows the coefficients for the meta-regression. The first row shows the random
effects estimates without controlling for any moderator factor. The coefficients are identical to
those reported in the forest plot once outliers are excluded. These estimates correspond to the
overall mean effect as showed in the forest plots.
We then estimate meta-regression controlling for each moderator factor in separated
regressions. We had to estimate each regression one-by-one due to insufficient sample size. We
report the coefficient for the constant (RE when the dummy variable takes the value of zero) and
23
the coefficient of the moderator variable in all cases.
Table 1 – Meta-Regression for Primary Outcomes (Excluding Outliers)
Firm
Performance Employment
Creation Labor
Productivity
RE estimate -- no controls 0.13*** 0.15*** 0.11***
p-value 0.047 0.21 0.027 Risk of bias (1 for moderate or high RoB; 0 for low RoB) 0.08 0.11 0.00
p-value 0.17 0.12 0.99
N 19 13 7
Constant 0.14*** 0.16*** Na
p-value 0.000 0.002
Method (1 if RCTs; 0 if QE) -0.07 -0.08 Na
p-value 0.42 0.42
N 19 13 Note: ***, **, * Statistically significant at 1, 5, and 10 percent respectively.
Given the small sample of studies, these estimates are underpowered. The lack of
statistical significance should not mean that these moderator factors are unimportant. The
magnitude of the effect size and its sign can be informative but should be interpreted with
caution in such a context.
First, the coefficient of the dummy variable for LAC is positive but statistically
24
insignificant. The estimate indicates that business-support services implemented in LAC is
associated, on average, with higher effects on firm performance. However, for the other two
outcomes, we observe the opposite, that business-support services implemented in LAC are
associated, on average, with lower effects on employment creation and labor productivity, by
0.06 of a SD and to 0.03 of a SD respectively. As before, the estimates are not significant in
statistical terms. We have insufficient data to explore this issue further, but it could be that
business support to SMEs in LAC leads to more capital-intensive technology and therefore is
less likely to create jobs.
The estimate for the ‘Africa’ dummy indicates that SME support programs in Africa are
associated with a lower pooled effect on firm performance, but is only marginally associated
with lower effect on employment creation. The size of firms may play a role in the main
findings. As can be seen in the table, the random effects estimate increases in all three cases once
we control for firm size, suggesting that larger firms are associated with larger impacts. The
relationship might not be linear though.14 Figure E.1 in the appendix shows the histogram for this
variable. The figure highlights that most of the firms assessed in the studies covered by this
review have fewer than 100 employees. A high percentage (25 percent) has no more than 10
employees (first bar). For studies covering African countries, the median size of firms is 93 and
the mean is 83. This indicates that there is a larger proportion of small firms studied in Africa,
given the left-skewed distribution.
Table 1 shows the random effects estimates once risk of bias is controlled for. Because
the dummy risk of bias takes the value of 1 for studies with a high risk of bias, the significant
reduction in the magnitude of the effects indicates that high-risk studies tend to show more
positive results on firm performance than studies with low or moderate levels of bias. The same
holds for employment creation, but not for labor productivity. In fact, once a dummy for risk of
bias is added to the model, the effect on employment turns statistically insignificant. One could
interpret these results as a signal that the most rigorous studies have not found effects of business
interventions on these firms’ performance and employment creation. Therefore, with so few
good studies available, any conclusion regarding the effects of such interventions should be
14 We tested a quadratic specification for the variable size; the coefficients for the quadratic term are very often negative, suggesting a concave relationship between firm size and firm performance. Because number of studies is relatively small, the estimates are imprecisely estimated and are available upon request.
25
interpreted with caution.
Finally, the coefficient of the dummy variable that informs the method used (1 for RCT
and zero for quasi-experimental methods) suggests that the RCTs included in this review were
less likely to find positive effects on firm performance and employment creation. We believe that
this might be in part due to the scales of the programs evaluated. Studies using quasi-
experimental methods usually rely on administrative data sets with thousands of observations
whereas RCTs might test programs in their pilot stages.
Table 2 replicates the exercise for MG interventions only. The results for firm
performance are qualitatively similar to those presented in table 1 and few estimates stand out.
First, the coefficient of the dummy ‘Africa’ is large and negative in the first column, suggesting
that MG programs in Africa are associated with worse performance of firms. On the other hand,
the coefficient for Africa region is positive and relatively large for employment creation. This
suggests that MG interventions in African countries were more likely to create jobs. This is
consistent with the hypothesis that African firms’ production functions may be more labor
intensive (than LAC, for instance) and that they likely work at relatively low scales, hence the
N 7 7 5 Note: ***, **, * Statistically significant at 1, 5, and 10 percent respectively.
The coefficient for size of firms is positive and large in all three columns, though not
statistically significant for labor productivity. The result in the second column could be picking
up a mechanical effect since firm sizes are measured as numbers of employees.
MG programs that aimed at improving firm capacities to export and innovate showed
positive effects on firm performance and employment creation, but negative on labor
productivity. This result is puzzling and we interpret it as an indication that firms targeted by the
type of interventions covered in this review were likely facing some constraint to increase output
beyond the variable costs associated with extra hired labor. This could also reflect some
distortion in case an intervention somehow incentivized firms to create jobs (for example, unpaid
jobs through employment of family members) through different forms of subsidies (for example,
wage subsidy).
Finally, the coefficient for the variable ‘investment’ was negative for firm performance
and employment creation. Our interpretation is that the investments made by these firms might
have been toward addition of capital goods.
In a nutshell, these findings suggest that matching grants serve different firm composition
and business purposes. Export-oriented firms, for example, need to become more efficient to be
able to compete in the external market while labor-intensive firms may use matching grants to
hire extra labor.
28
Study Limitations
Most of the studies covered in this review employ quasi-experimental designs that rely on
assumptions that may fail at controlling for all sources of confounders. The process of
elaboration of this review confirmed a point made by Baird et al. (2013) that very few economic
papers report the exact information necessary to perform ES calculations. So assumptions had to
be made. In addition, to synthesize the ES across different studies, we made a considerable
simplification in averaging SMD obtained through estimation of different parameters – such as
intention to treat (ITT) often reported in RCTs, average treatment on the treated (ATT) reported
in DID and PSM, and the local average treatment effect (LATE) reported in RDD and IV. Our
review also gathered evidence from 18 countries, four regions, – Asia, Africa, Latin America,
and East Europe – various contexts, and with differences in program scale, intensity, and period,
which considerably complicated study comparability and the drawing of general conclusions.15
We tried to account for heterogeneity within and between studies by estimating random
effects models and using moderator variables in the meta-regressions. However, the I-squared
and tau-squared statistics showed a high degree of variability in the main findings.
Additional limitations of this review are worth noting. We searched for and included
evidence published or made available after 2000. However, judging by other systematic reviews
conducted in this field and by the publication dates of included studies, it is unlikely that more
studies would be included in the review in case searches were defined with an earlier starting
date.16 We did not conduct a specific search in French, but we searched several databases that
include studies written in other languages and we screened French language studies for inclusion
in the review. We did not conduct specific searches in the RePec database, nevertheless, it is
worth mentioning that we did conduct electronic searches in the Econlit database that
encompasses all RePec working papers. We did not conduct moderator analysis by all types of
global region, only for those regions where we had sufficient observations to undertake
15 Studies were done in different countries, different years, and scale as some used administrative data and other small-scale RCTs. 16 For instance, a paper by Grimm and Paffhausen (2015) studies a similar issue but focuses only on employment outcomes. Their search was done after 1990 and only one paper from prior to the year 2000 (Fretwell et al, 1999) was found. This paper would not qualify to enter this review as it is designed to assess active labor policy in general (not SMEs specifically) and also includes assessment of self-employment, which is not covered by this review.
29
appropriate analysis – in other words, Latin America (since the majority of the evaluated
interventions were implemented in Latin America) and Africa.
Finally, we used Egger’s tests to assess whether the results discussed above reveal any
indication of publication bias.17 The first column in table 3 shows the results for the three
SMEs and (formalization, business environment, institutions, property registration, regulatory frameworks)
Exports/Access to External Markets SMEs and (exports, certification, market fairs)
Support for Innovation Policies SMEs and (innovation, patents, trademarks, research and development, technology transfer)
Value Chain, Networks, and Cluster Interventions
SMEs and (value chain, clusters, network, local productive systems, collective actions)
Training and Technical Assistance SMEs and (training, technical assistance)
SME Financing/Credit Guarantee SMEs and (finance, credit, guarantee), matching grants
37
Appendix B. Calculation of Effect Sizes Across Studies Using Standardized Measures
We used two standardized measures to compare effect sizes across studies. We computed risk ratio
(RR) for binary outcome variables and used standardized mean differences (SMD) for continuous
variables. In most cases, the standard deviation of the whole sample (pooled standard deviation –
pooled_sd) was not reported and we therefore made some assumptions to compute the SMD and
its standard error (SE). For instance, in a couple of studies that reported the effects of different
interventions in a long set of intermediary and final outcomes, only the difference in means and
the t-statistic for the difference was recorded. When the means and standard deviation for each
group were not reported we made the assumption that the standard deviation is the same in the
treatment and control samples and that the covariance of the outcome variable Y between both
groups is zero.18
Although this assumption might be considered plausible in RCTs where the randomization
is at individual level and sample sizes are similar for the treatment and control groups, it is stronger
in the context of quasi-experimental studies, particularly where sample size is relatively small and
numbers of observations differ sharply between treated and comparison groups. In these cases, we
assumed that the standard deviation was the same, regardless of the selection process and the
sample size in each group.
Whenever studies provided the sample size for the treatment and control groups at the
baseline, SMD was computed using the following formulae:
SMD = treatment effect/pooled_sd, for studies that used DID or matching with DID
methods to compute the treatment effects.
For cases where pooled_sd is not available, we used the following:
18 This assumptions imply in a standard deviation (SD) of Y given by: SD(Y) = SD(beta_hat)x(2)-0.5. See the attached file for the formulae.
38
SMD = t*[(Nt+Nc)/Nt*Nc)], where t is the t-statistic of the treatment effect coefficient in the
regression model, and Nt and Nc are the numbers of treated and control observations
respectively.19
For studies that used small samples we corrected SMD using the following correction (see
Waddington et al. 2012).20
SMDcorrected = SMD*{1 – 3/[4*(Nt + Nc – 2) – 1]}
We computed RR as follows (see Waddington et al., 2012):
RR = [Mean(YC)+ ]/Mean(YC) for 0; or
RR = treatment effect for 0.
The computation of SE of the effect sizes also requires some assumptions, particularly for
RR. As discussed in Waddington et al. (2012), the SE of the error term in the regression model is
the preferred option to compute RR (or SMD). In most cases, this was not available, thus we used
the standard deviation of the outcome among control units at the baseline. We used the following
formulae to compute SE(SMD) and SE(RR):
SE(SMD) = [(Nt+Nc)/Nt*Nc) + SMD2/2*(Nt+Nc)]1/2
SE(RR) = *{1/Nt*[Mean(YC)+ ] + 1/Nc*(Mean(YC))}, where is the SE of the error
in the regression or the standard deviation of the outcome among controls at the baseline when the
former is not reported.
Finally, we made an assumption regarding sample size when this was not provided for each
group separately. In cases where only the whole sample was reported, we arbitrarily split the
sample equally between treated and control units.
19 The computation of SMD via t-test was obtained by replacing the formulae of the pooled standard deviation by a simple manipulation of the formulae of a t-test for difference in means. See Wilson (2011). 20 We arbitrarily defined small sample size (n) as less than 100 observations per treatment arm. According to this definition, only three studies in the final list have small samples. Most of the studies use more than 300 observations per treatment arm.
39
Unit of Analysis Issues
Most studies use data at firm level with the great majority coming from administrative data, such
as census data about formal firms or large samples of firms. The authors clustered SE
accordingly in a study where the intervention took place at municipal level.
Dealing with Missing Data
We contacted study authors to ask for missing information, such as descriptive statistics at the
baseline (mean, standard deviation, and sample size and intra-cluster correlation when
applicable), and received quick feedback in most cases. Unfortunately, the quality of data
presented varies considerably across studies. In many cases, we were forced to make
assumptions to compute SMD, RR, and the SE, for instance:
When sample size is not provided for the treatment and control groups separately,
we arbitrarily split the sample equally.
When pooled standard deviation was not reported, we used the standard deviation
of the control group to compute SE (SMD) and the t-statistic of the treatment
effect coefficient to compute the SMD.
When a study used a cluster of firms at municipality level but did not report the
number of firms, we used the number of clusters (municipalities) to compute the
standardized effects and SE.
If there was no information on sample size, means, and standard deviation, the
study was excluded.
In cases where the baseline data was reported for the pooled sample of firms but
estimates were provided for sub-groups of firms according to firm size, we split
the sample equally among the subgroups and used the same means for subgroups
as for the pooled sample.
Some studies reported the p-values rather than the SE or t-statistics. To convert p-
values into t-statistics, we used a conservative approach and used the lower value
of t for cases where the coefficient was statistically significant. For instance, for
cases where the p-value was between 0.051 and 0.10 we used a t-statistic of 1.65.
40
For cases where the p-value was between 0.011 and 0.05 we used a t-statistic of
1.96, and for p-values below 0.01, we used a t-statistic of 2.58.
Where t-statistics were not available to compute SMD, we computed the pooled
standard deviation using the standard deviations of the treatment and control
groups and assumed a covariance between outcomes in both groups of 0.5.
For the cases where the means at the baseline are not available or are zero, we
computed RR assuming it was equal to the treatment effect coefficient.
41
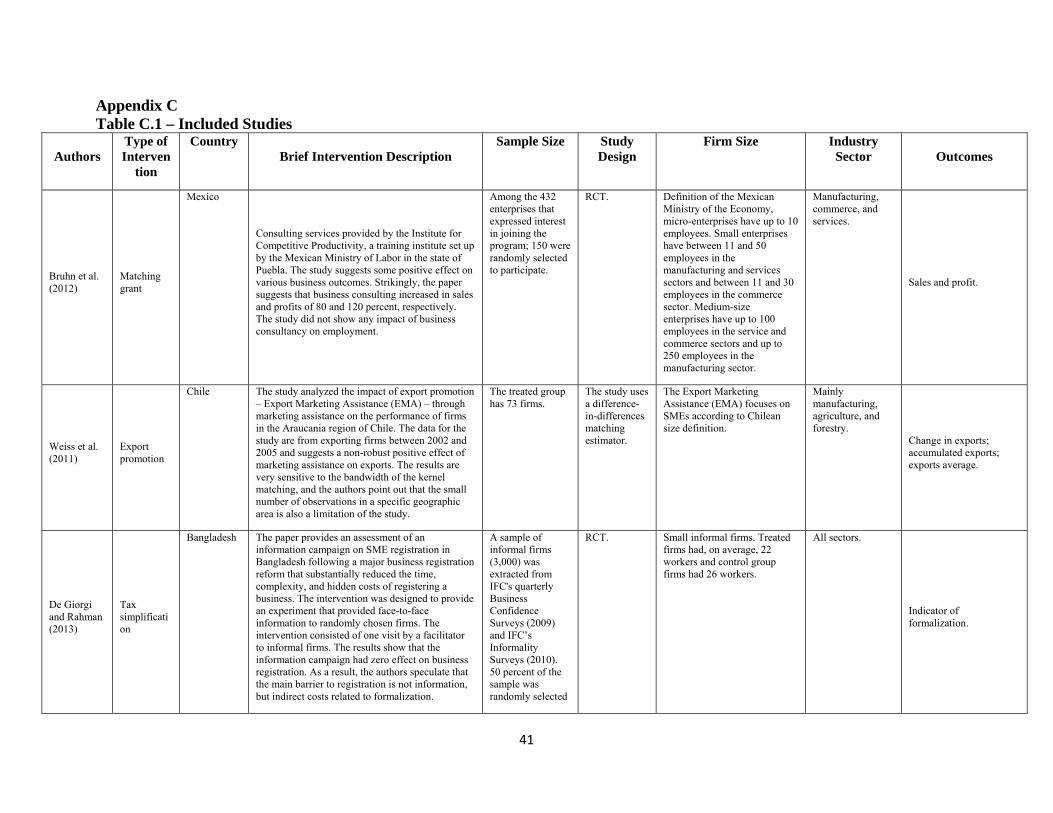
Appendix C Table C.1 – Included Studies
Authors Type of Interven
tion
Country Brief Intervention Description
Sample Size Study Design
Firm Size Industry Sector Outcomes
Bruhn et al. (2012)
Matching grant
Mexico
Consulting services provided by the Institute for Competitive Productivity, a training institute set up by the Mexican Ministry of Labor in the state of Puebla. The study suggests some positive effect on various business outcomes. Strikingly, the paper suggests that business consulting increased in sales and profits of 80 and 120 percent, respectively. The study did not show any impact of business consultancy on employment.
Among the 432 enterprises that expressed interest in joining the program; 150 were randomly selected to participate.
RCT. Definition of the Mexican Ministry of the Economy, micro-enterprises have up to 10 employees. Small enterprises have between 11 and 50 employees in the manufacturing and services sectors and between 11 and 30 employees in the commerce sector. Medium-size enterprises have up to 100 employees in the service and commerce sectors and up to 250 employees in the manufacturing sector.
Manufacturing, commerce, and services.
Sales and profit.
Weiss et al. (2011)
Export promotion
Chile The study analyzed the impact of export promotion – Export Marketing Assistance (EMA) – through marketing assistance on the performance of firms in the Araucania region of Chile. The data for the study are from exporting firms between 2002 and 2005 and suggests a non-robust positive effect of marketing assistance on exports. The results are very sensitive to the bandwidth of the kernel matching, and the authors point out that the small number of observations in a specific geographic area is also a limitation of the study.
The treated group has 73 firms.
The study uses a difference-in-differences matching estimator.
The Export Marketing Assistance (EMA) focuses on SMEs according to Chilean size definition.
Mainly manufacturing, agriculture, and forestry.
Change in exports; accumulated exports; exports average.
De Giorgi and Rahman (2013)
Tax simplification
Bangladesh The paper provides an assessment of an information campaign on SME registration in Bangladesh following a major business registration reform that substantially reduced the time, complexity, and hidden costs of registering a business. The intervention was designed to provide an experiment that provided face-to-face information to randomly chosen firms. The intervention consisted of one visit by a facilitator to informal firms. The results show that the information campaign had zero effect on business registration. As a result, the authors speculate that the main barrier to registration is not information, but indirect costs related to formalization.
A sample of informal firms (3,000) was extracted from IFC's quarterly Business Confidence Surveys (2009) and IFC’s Informality Surveys (2010). 50 percent of the sample was randomly selected
RCT. Small informal firms. Treated firms had, on average, 22 workers and control group firms had 26 workers.
All sectors.
Indicator of formalization.
42
to receive the treatment.
Aivazian and Santor (2008)
Access to credit
Sri Lanka
Analyzed two groups of small firms with different conditions for accessing credit. One group had access to subsidized loans from the World Bank and the other accessed loans without subsidies. The authors used the Small and Medium Industry Impact Evaluation (SMIIE) survey conducted in 1996 by the World Bank. The study indicates that the impact on value added is inconclusive.
304 firms, half of which received subsidized loans and the other half received regular loans.
The study used propensity-score matching and OLS estimates.
The median of the number of employees is 16 for both control and treatment groups.
The study included SMEs from the following sectors: manufacturing, mining, construction, agriculture industries, fish processing, industrial services, horticulture, commercial transport, and animal husbandry.
Value added.
Arraiz et al. (2013)
Local productive systems
Chile The study evaluates the impact of the Chilean Supplier Development Programme on the performance of SME suppliers to sponsor firms, using panel data between 1998 and 2008. The results suggest that SME suppliers in the agribusiness sector experienced increased sales and employment and are more likely to survive after participation in the program.
The final sample consists of 101 sponsor and 3,863 supplier firms; data spans from 1998 to 2008.
Propensity-score matching combined with fixed-effect estimations.
The small firms that participated in the program had annual sales that did not exceed 100,000 UF (Unidad de Fomento, an accounting unit that reflects the real value of the Chilean peso).
Agribusiness sector.
Annual sales (in logs); exporting firm; employment (in logs); salaries (in logs).
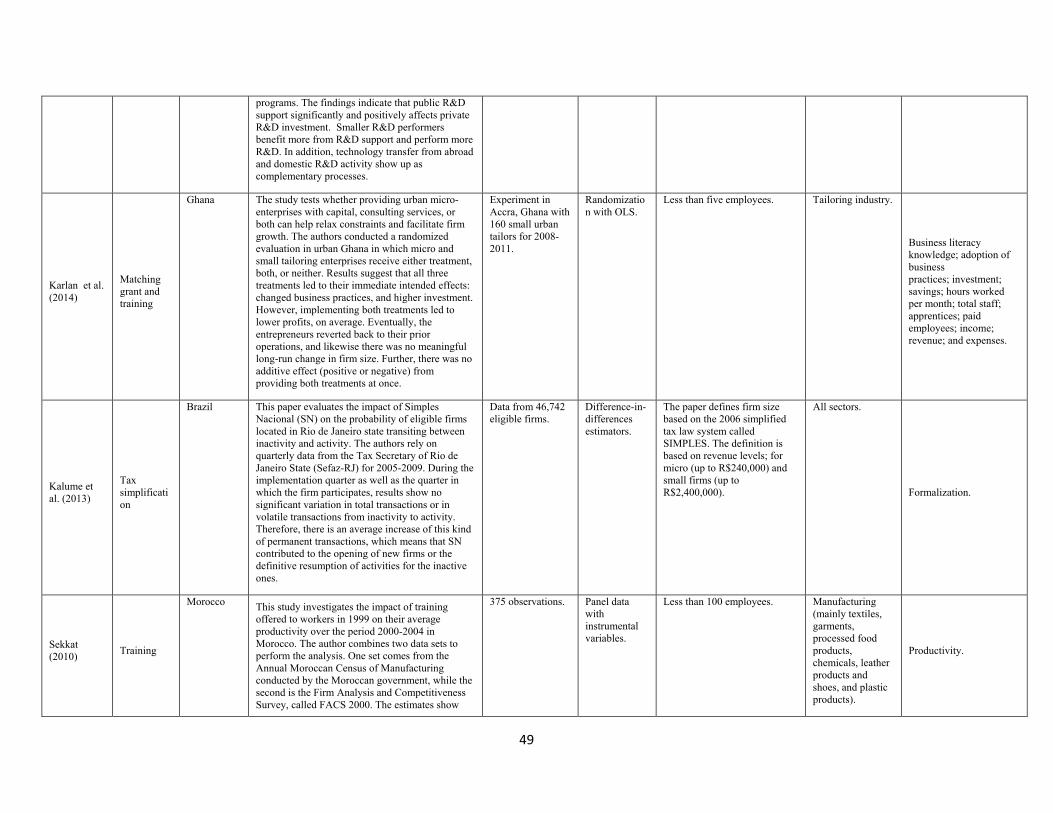
Lee and Cin (2010)
Innovation
Korea, Rep.
The authors analyze whether R&D subsidies stimulate private R&D investment by SMEs in the manufacturing sector in Korea. The results show some positive impacts of government R&D subsidies on additional private R&D funding, and suggest subsidies can increase corporate R&D in manufacturing SMEs.
The data is from 34,782 firms for the period 2000-2007.
The study applies DID and two-stage least-squares estimators to panel data covering the period between 2000 and 2007.
Firm size as defined by the Korean Small and Medium Business Administration. SMEs treated have, on average, 80 workers.
Manufacturing sector.
Corporate R&D investment.
Mano et al. (2012)
Training
Ghana The study is about the impact of business consulting in the form of basic managerial training. However, the authors measure the impact of this type of intervention in the context of industrial clusters. The intervention was made from November 2007 onwards and a follow-up survey was undertaken in November 2008. The results indicate that participation in a rudimentary management training program improves the business practices and results of the firms that participated in the experiment.
The data comes from 167 firms, 60 in the control group.
RCT in Suame Magazine, an industrial area consisting of metal workshops and enterprises in Kumasi, the second largest city in Ghana.
The paper focuses on micro and small firm members of the Ghana National Association of Garages (GNAG).
Manufacturing sector.
Visiting customers; record keeping; record analysis; sales revenue; value added; gross profit.
43
Atkin et al. (2014)
Export
Egypt, Arab Rep.
The study assesses the impact of market-access initiatives on export activity by rug-making firms in Egypt. Results show that involvement with external market-access initiatives increased both quality of rugs, profit, and prices Accordingly, the number of rugs produced decreased.
The study encompasses a total of 405 firms.
RCT. Most of firms have between 1 and 4 employees.
Textile.
Profits from rug business; total product last month (m2); export indication.
Rijkers et al. (2010)
Matching grant
Ethiopia The authors assess the impact of support to SMEs in the construction sector in terms of technology use, labor intensity, and earnings of participant firms in Addis Ababa, Ethiopia. The program was designed as an active labor-market policy through the use of matching grants to create labor-intensive jobs and reduce unemployment. Results indicate that the program was not successful in generating more jobs in treated firms than in the control group.
The study uses data of 240 firms.
Instrumental variable regressions with cross-section data.
Small firms in the construction sector employing fewer than 50 people and with a capital stock worth less than approximately $55,000.
Construction sector.
Log of input per worker; log of annual revenue; log of annual revenue per worker; log of monthly earnings.
Rand and Torm (2012)
Tax simplification
Vietnam The study assesses the relationship between legal status and firm-level outcomes in the manufacturing MSMEs in Vietnam. The results indicate that becoming a registered firm leads to an increase in profits and investments. On the other hand, there is evidence that formalizing does not lead to a higher share of wages in total value added (proxy for labor productivity), and that becoming a registered firm decreases use of casual labor.
The study encompasses 1,366 firms.
The study uses a matched DID strategy.
A definition used by The World Bank was used in this study: Micro-enterprises have between 1 and 10 employees, small-scale enterprises between 11 and 50 employees, and medium-sized enterprises between 51 and 300 employees.
The paper analyses the impact of the introduction of a business-tax reduction and simplification scheme in Brazil called SIMPLES. The results suggest that SIMPLES led to a significant increase in formality and that led to higher revenues, employment, and profits among firms that registered as a result of the new law.
The study used the Brazilian Survey of the Urban Informal Sector that has more than 40,000 entrepreneurs.
The estimations are done using Weighted Two-Stage Least Squares (W2SLS) and regression discontinuity design.
The paper defines firm size based on the 1996 simplified tax law system called SIMPLES. The definition is based on revenue level; for micro (up to R$120,000) and small firms (up to R$720,000).
All sectors. License to operate; legal entity; micro-firm registration; registered with tax authorities; paid taxes; paid social security; revenues; profits; employment; paid employment; paid employment/employment; fixed capital; access to credit; fixed location; sales.
Lopez-Acevedo and Tan (2005)
Training
Mexico The authors provide an evaluation of a training program for SMEs in Mexico: the Comprehensive Quality and Modernization Programme. A panel data for the years of 1991, 1993, and 1995 was used. The results found that participating firms experienced higher investments in worker training, higher rates of capacity utilization, and higher probability of adopting quality-control practices when compared with firms in the control group. Further, firms that participated in the training
The study was based on information from 1233 firms (595 received treatment and 638 were the control group).
Propensity-score matching combined with difference-in-difference estimations.
The definition of SME is based on the following category. Micro - less than 16 workers. Small – between 16-100 workers. Medium - between 101-250 workers.
Manufacturing sector.
Productivity.
44
increased productivity growth, but only in the 1991 to 1993 period.
Duque and Munoz (2011)
Innovation, export, training and LPS (clusters).
Colombia
This study for Colombia uses a panel data setting using data from 1999 to 2006. The evaluation focuses on the impact of the Colombian Fund for the Modernization and Technological Development of the Micro, Small, and Medium-Sized Firms (FOMIPYME). The empirical evidence suggests a positive effect on wages in the first year of two years of treatment, on exports as a share of sales, and also on investment in R&D. Security issues might affect the effectiveness of these programs, as participating in an SME program positively affects productivity when crime is controlled for.
The study encompasses 1282 SMEs that were used to construct the treated and control groups.
Propensity-score matching combined with difference-in-difference estimator.
The definition of SMEs used in the study follow the definition established by Law 905 of 2004: i) Micro-enterprises <10 employees, or total assets worth less than 500 legal monthly minimum wages; ii) Small Enterprises: between 11 and 50 employees, or total assets worth between 501 and 5,000 legal monthly minimum wages; iii) Medium Enterprises: between 51 and 200 employees, or total assets worth between 5,001 and 30,000 legal monthly minimum wages.
All sectors, mostly manufacturing.
Log of sales; log of employment; log of sales over employees; log of staff expenses over employees, log of exports over sales; log of investment in R&D.
Tan (2011)
Innovation, LPS (cluster), matching grants
Chile The study used panel data for the period between 1992 and 2006, and evaluated the impact of eight different programs on different outcomes. The authors used a propensity-score matching combined with DID. Empirical results suggest that SME support led to higher sales, labor productivity, increased wages, and a small effect on employment was observed. No significant effects were found with regards to credit and loans programs, suggesting that access to finance by itself does not affect firm performance.
603 establishments from six manufacturing sectors provided information about the SME participation in different support programs.
Propensity-score matching combined with difference-in-difference estimator.
Micro-enterprises with 1-15 workers, small with 16-100 workers, and medium with 101-250 workers.
Manufacturing sectors: (food and beverages, chemicals, metal products (excluding machinery), machinery and equipment, wood products and paper products).
Log sales; log output; log labor; log wage; log labor productivity; export as percentage of sales.
Jaramillo and Diaz (2011)
Innovation and training
Peru The study evaluates three important public programs oriented towards SMEs (PROMPYME - Public Sector Purchase Programme: Small and Micro-Enterprise Promotion Commission (Comision de Promocion de la Pequeña y Micro-Empresa), BONOPYME (voucher-based training program for small and micro-enterprises) and CITE-Calzado (shoe manufacturing technological innovation program). Data from the beneficiaries of these programs were linked to the Annual Economic Survey carried out by the National Statistics Institute to generate control groups. The results suggest a positive impact of participation in SME programs, associated with a 26 percent increase in profits and a 21 percent increase in sales.
The treated group comprises 414 firms.
Propensity-score matching combined with difference-in-difference estimator.
According to Peruvian legislation (D.L Nº 1086), firms with a maximum of 50 workers and a minimum of two workers can participate in BONOPYME.
All sectors, mainly shoe manufacturing.
Log profits; log sales; log profits per worker; log sales per worker.
45
Lopez-Acevedo and Tinajero (2010)
Matching grants, export, innovation, local productive system, and training.
Mexico This study for Mexico includes data from five different institutions and 18 different programs. The evaluation constructed a rich panel data set by linking SME participation in support programs to a panel of annual industrial surveys for the period 1994 to 2005. The results suggest that participation in the programs of the Ministry of Economy and the National Science and Technology Council is associated with higher value added, sales, export, and employment. Nevertheless, the authors warn that the better results of these specific programs might be related to the fact that they reach bigger and more structured SMEs.
The total number of observations for the panel is 30,199 (18,435 in the control group and 11,764 in the treatment group).
Propensity-score matching combined with difference-in-difference estimator.
Firm size is defined as “micro” with 15 or fewer workers, “small” with 16 to 100 workers, “medium” with 101 to 250 workers, and “large” with over 250 workers.
All sectors.
Value added; gross production; technology transfers; hours worked; wages; fixed assets; sales; export; and employment.
Castillo et al. (2010)
Export
Argentina
This paper evaluates the impact of the SME support program PRE on employment, real wages, and exports in Argentina. Using data from two different sources, that is, the administrative records of the program and a data set constructed by the Observatorio de Empleo y Dinámica Empresarial OEDE, the authors construct a long panel of firms (12 years). Estimations show a positive and quantitatively important impact of the program on employment and a positive although smaller impact on real wages and the probability of exporting. Also, the effect of the program on wages and the probability of exporting take place one year after beneficiaries receive the program.
The data set is a panel of firms that includes all the firms declaring employment in Argentina after 1996. It covers firms in manufacturing, services, retail, and primary sectors. In 2008, the data set included around 6 million workers and 570,000 firms.
Propensity-score matching combined with difference-in-difference estimator.
Firms are classified using the average employment of two consecutive years into micro-firms (less than 4 employees), small firms (between 4 and 13 employees), medium-sized firms (between 14 and 50 employees).
Manufacturing, services, retail, and primary sectors.
Number of employees; wages; and probability to export.
McKenzie and Sakho (2007)
Tax simplification
Bolivia
The paper estimates the impact of registering for taxes on firm profits in Bolivia using the distance of a firm from the tax office where registration occurs, conditional on the distance to the city center, as an instrument for registration. The results show that tax registration leads to significantly higher profits for the firms that the instrument affects. However, there is evidence of heterogeneous effects of tax formality on profits. Tax registration is found to increase profits for the mid-sized firms in the sample, but to lower profits for both the smaller and larger firms.
The study was based on a sample of 469 firms from the Bolivian Encuesta de Productividad de Empresas.
RCT Less than 20 workers. Six industries were chosen: grocery stores; restaurants and food sales; manufacturing of clothing from wool and cloth; transportation of passengers and cargo; manufacturing of clothing from camelid wool (from llamas and alpacas); and manufacturing of
Log monthly profits.
46
furniture from wood.
De Negri et al. (2006)
Innovation (R&D)
Brazil This study assesses the impact of the National Technological Development Support Programme during 1996-2003. The authors used data from the Annual Industrial Survey (PIA), the Technological Innovation Survey (PINTEC) and the Annual Social Information Report (RAIS). The results show evidence that ADTEN had a positive influence on company private R&D expenditure. Also, there is evidence that the program has positively influenced the growth of firms and their productivity.
457 treated firms and the control group is constructed from a database with approximately 80,000 industrial firms.
Difference-in-differences technique combined with propensity-score matching and a two-step selection mode.
Definition of SME used by the innovation agency.
Manufacturing sectors.
Total R&D expenditure.
Oh et al. (2008)
Credit
Korea, Rep. Taking a sample of 44,013 firms from 2000 to 2003, this article evaluates the effect of the credit guarantee policy implemented during 2001 and 2002 in Korea on growth rates of different performance indicators, including productivity, sales, employment, investment, R&D, wage levels, and the survival of firms in the post-crisis period. The study focuses on two major public credit guarantee institutions in Korea: the Korea Credit Guarantee Fund (KCGF) and the Korea Technology Credit Guarantee Fund (KOTEC). Results, estimated using propensity-score matching, suggest that credit guarantees significantly influenced firm ability to maintain their size and increased their survival rate, but did not improve their R&D and investment. However, some evidence was found that the adverse selection in terms of productivity occurred in selecting firms to receive guarantees, and the effect was more prominent for the firms receiving guarantees from both institutions.
The number of treated firms is 8714 and the control group is constructed from an unbalanced panel data with approximately 95,000 to 109,000 plants for each year from 2000 to 2003.
Propensity-score matching combined with difference-in-differences.
Korean official definition of SME (fewer than 300 employees for manufacturing).
Manufacturing industries.
Growth in TFP, employment; sales; wage levels; investment intensity; change in R&D status; and survival of the firm.
Sanguinetti (2005)
Innovation (R&D)
Argentina This study evaluates the impact of a public sector program, FONTAR, aimed at fostering R&D activities in the private sector in Argentina, on innovation. The authors constructed a panel linking two surveys of annual data (Encuesta Nacional sobre la Conducta Tecnológica de las Empresas Industriales Argentinas) collected by CEPAL and INDEC on innovation expenditures by firms for periods 1992-1996 and 1998-2001. The results suggest that the FONTAR program has had a positive effect on R&D expenditures and none on total innovation.
The study comprises 639 firms.
Propensity-score matching combined with difference-in-differences.
FONTAR program focuses on SMEs according to the official definition.
Manufacturing sector.
R&D expenditures/ employees; total innovation expenditures/employees.
47
Cassano et al. (2013)
Access to credit
Bulgaria, Georgia, Russia Federation, and Ukraine
This study assesses the effect of two types of loans–a new type based on cash flows and a traditional-style loan based on collateral–on SME performance in Bulgaria, Georgia, Russia. and Ukraine. The authors used client data from banks participating in microfinance programs of the European Bank for Reconstruction and Development (EBRD) for 2001-2004. Results show that both types of loans are related positively to most performance indicators, enabling the SMEs to be more profitable and expand production. The cash-flow loans also appear to be particularly attractive credit-delivery schemes for micro and small enterprises. Finally, the effects of the smallest loans are often negative, suggesting that the minimum loan size is an important policy issue.
The study had 824 treated firms.
Difference in logs method.
Less than 250 employees. All sectors.
Fixed assets; revenues; employment; and net profits.
Benavente and Crespi (2003)
Local productive system
Chile The main objective of this article is to determine if associative strategies (Programmes of Development, known as PROFOs) followed in Chile had any impact on the enhancement of productive performance of SME firms from 1992 to 1995. The authors use information from a survey applied to a random sample of 102 participating firms and a random sample provided by the Chilean National Institute of Statistics (INE) for control firms. The results suggest that these kinds of policies were effective in increasing the productivity of participating firms, and have also achieved high social profits.
The control group comprised 149 firms and the treated group 102 firms.
Propensity-score matching and difference-in-differences estimator.
Definition of SME used by CORFO.
Manufacturing sectors.
Average Growth in TFP.
Benavente et al. (2007)
Innovation (matching grant)
Chile This paper analyzes the effectiveness of the Chilean Technology Development Fund (TDF), the FONTEC program. Using a survey of beneficiary and control firms carried out by the Chilean Corporación de Fomento (CORFO), the authors adopted difference-in-differences and propensity-score matching methods to estimate the program’s impacts. Results suggest that FONTEC’s subsides partially crowded out private investments in innovation and more effectively promoted technological upgrades and process innovations, rather than radical product innovations. Also, despite finding a positive impact on employment, sales and export, the results did not clearly support a significant result in terms of productivity.
During the first ten years of FONTEC (1991-2001), 6,000 firms participated. The survey, collected by the University of Chile, focused on firms funded by Line 1 between 1999 and 2002. The total sample included a group of 319 treated firms and an equal sample of non-treated firms.
Difference-in-differences and propensity-score matching methods to estimate the program’s impacts.
Definition of SME used by CORFO.
In terms of sectors, 41 percent of funds were allocated to firms in the manufacturing sector, 29 percent to firms in the agricultural and fisheries sectors, and 8 percent to information and communications technologies (ICT) companies.
R&D investment; number of new production processes adopted by the firm; relevance of the process innovations adopted by the firm; relevance of the changes in human resource management practices adopted by the firm; access to external resources; number of new products; number of patents; sales; employment; labor productivity; and exports.
48
Chudnovsky et al. (2006)
Innovation (matching grant)
Argentina This paper evaluates the impact of the Non-Reimbursable Funds (ANR) program of the Argentinean Technological Fund (FONTAR) on the innovation activities of granted firms, their innovative outcomes, and productivity performance. The database was constructed from a tailor-made survey conducted by INDEC (National Institute of Census and Statistics). difference-in-differences matching estimators show that the subsidies had a positive impact on the total level of innovation expenditures of treated firms but not on private innovation intensity. Nevertheless, for firms that already had innovation expenditures there is a crowding-out effect of ANR funds, while for other firms, no crowding out is appreciated. Finally, both the estimation of the effect of subsidies on innovative outcomes and firm performance did not result in statistically significant results.
The authors count with data from 414 firms for four successive years (2001-2004) and for 1998. From the total sample of 414 firms, 136 have been granted a non-reimbursable subsidy (ANR) from FONTAR, 62 firms applied but did not receive the ANR, and 216 firms did not apply for the subsidy.
Propensity-score matching and difference-in-differences estimator.
Average size of participants was 34 employees.
Manufacturing.
Innovation intensity (total innovation expenditures/total sales); private innovation intensity; sales of new products; and labor productivity (sales/employees)..
Bruhn (2011)
Formalization
Mexico This paper studies the effect of business registration regulation on economic activity using micro-level data. The authors use a quarterly panel data from the Mexican employment survey from the second quarter of 2000 to the fourth quarter of 2004. Results obtained by an occupational choice model show that the reform increased the number of registered businesses in eligible industries. This increase was due to former wage earners opening businesses. Moreover, employment in eligible industries grew. Finally, the results imply that the competition from new entrants lowered prices and decreased the incomes of incumbent businesses.
Micro-level data from the Mexican Employment Survey with 1,636,225 observations.
Panel data estimation.
The program focuses on small informal firms.
All sectors.
Registration; employment; prices; and income..
Corseuil and de Moura (2011)
Tax simplification
Brazil The paper uses regression discontinuity design to assess the effect of the introduction of the “SIMPLES” legislation on manufacturing employment generation. The new law establishes a clear criterion in terms of revenue to qualify for the simplification tax system. The results show that SIMPLES has a positive impact on the creation of new manufacturing jobs in Brazil.
Subsamples of the Annual Manufacturing Survey close to the revenue threshold, approximately 3000 observations.
Discontinuity fuzzy regression design.
The threshold defined by the law to define eligibility. According to the law, eligible firms exhibit an annual gross revenue of less than R$720.000.
Manufacturing.
Employment.
Özçelik and Taymaz (2007)
Innovation (R&D)
Turkey This study investigates the effect of public R&D support programs on private R&D investment at the firm level in the Turkish manufacturing industry in 1993-2001. This study is based on the match of three panel databases: Annual Survey of Manufacturing Industries (ASMI), R&D Survey, and a database on the clients of R&D support
There are about 11,000 establishments in the database each year.
Matching difference-in-differences estimation.
The average firm size is 44 employees.
Manufacturing.
R&D intensity.
49
programs. The findings indicate that public R&D support significantly and positively affects private R&D investment. Smaller R&D performers benefit more from R&D support and perform more R&D. In addition, technology transfer from abroad and domestic R&D activity show up as complementary processes.
Karlan et al. (2014)
Matching grant and training
Ghana The study tests whether providing urban micro-enterprises with capital, consulting services, or both can help relax constraints and facilitate firm growth. The authors conducted a randomized evaluation in urban Ghana in which micro and small tailoring enterprises receive either treatment, both, or neither. Results suggest that all three treatments led to their immediate intended effects: changed business practices, and higher investment. However, implementing both treatments led to lower profits, on average. Eventually, the entrepreneurs reverted back to their prior operations, and likewise there was no meaningful long-run change in firm size. Further, there was no additive effect (positive or negative) from providing both treatments at once.
Experiment in Accra, Ghana with 160 small urban tailors for 2008-2011.
Randomization with OLS.
Less than five employees. Tailoring industry.
Business literacy knowledge; adoption of business practices; investment; savings; hours worked per month; total staff; apprentices; paid employees; income; revenue; and expenses.
Kalume et al. (2013)
Tax simplification
Brazil This paper evaluates the impact of Simples Nacional (SN) on the probability of eligible firms located in Rio de Janeiro state transiting between inactivity and activity. The authors rely on quarterly data from the Tax Secretary of Rio de Janeiro State (Sefaz-RJ) for 2005-2009. During the implementation quarter as well as the quarter in which the firm participates, results show no significant variation in total transactions or in volatile transactions from inactivity to activity. Therefore, there is an average increase of this kind of permanent transactions, which means that SN contributed to the opening of new firms or the definitive resumption of activities for the inactive ones.
Data from 46,742 eligible firms.
Difference-in-differences estimators.
The paper defines firm size based on the 2006 simplified tax law system called SIMPLES. The definition is based on revenue levels; for micro (up to R$240,000) and small firms (up to R$2,400,000).
All sectors.
Formalization.
Sekkat (2010)
Training
Morocco This study investigates the impact of training offered to workers in 1999 on their average productivity over the period 2000-2004 in Morocco. The author combines two data sets to perform the analysis. One set comes from the Annual Moroccan Census of Manufacturing conducted by the Moroccan government, while the second is the Firm Analysis and Competitiveness Survey, called FACS 2000. The estimates show
375 observations. Panel data with instrumental variables.
Less than 100 employees. Manufacturing (mainly textiles, garments, processed food products, chemicals, leather products and shoes, and plastic products).
Productivity.
50
that the intensity of training has a significant and positive impact on productivity in small and medium enterprises.
Machado et al. (2011)
Access to credit
Brazil The article evaluates the impact of Brazilian Cartão BNDES (BNDES Card) on employment growth rates of companies that used this instrument to finance investments and other inputs in 2008. The authors used data from BNDES, which provides information on firms with access to the card, and data from Labor and Employment of Brazil, which provides information on the stock of employees of formal firms over 2007-2009. The results show that at the end of the year following the card use, there is a positive impact on the mean employment of the supported firms. The impact occurs mainly on micro and small enterprises, and is larger as the firm size declines.
The sample used for the estimation contained 22,572 firms.
Propensity score matching and difference-in-differences estimator.
Firms were sorted into three groups by the size classification of IBGE as follows: micro-enterprises (0 to 9 employees), small enterprises (10 to 49 employees) and medium and large enterprises (50 or more employees).
All sectors.
Number of employees.
Crespi et al. (2011)
Innovation (matching grants and contingent loans for R&D)
Colombia This paper aims at evaluating the impacts of innovation promotion programs administrated by the Colombian Innovation Agency (COLCIENCIAS) on beneficiary economic performance. The authors create a panel database for the period 1995-2007. Results obtained show that COLCIENCIAS programs have been very effective in increasing firm labor productivity and that the main channel behind this result is product diversification (product innovation). Nevertheless, impacts on employment and capital investments are more modest, suggesting that the main transmission channel is through total factor productivity.
The panel estimates using data in the common support had 10,470 observations.
Propensity-score matching and LSDV.
Small firms that participated in COLCIENCIAS had, on average, 128 employees.
Manufacturing sector.
Labor productivity (value added/total employment); investment/capital; employment; number of products.
Kaplan et al. (2011)
Formalization
Mexico The objective of this study is to estimate the magnitude of the effect of reducing registration procedures on firm startups by evaluating the implementation of a "deregulation" program called "System of Fast Opening of Firms" (SARE) that took place in Mexico in different locations at different time periods. The authors create a database for 1998-2000 with information from three sources: (i) data from the Mexican Institute of Statistics, Geography, and Informatics (INEGI); (ii) contracts of the Federal government with 31 of the 93 municipalities that implemented the program; and (iii) proprietary data from the Mexican Social Security Institute (IMSS). The estimates obtained suggest that the program generated a monthly increase in new firm start-ups.
Data are from the Mexican Institute of Statistics, Geography, and Informatics (INEGI); (ii) contracts of the Federal government with 31 of the 93 municipalities that implemented the program; and (iii) proprietary data from the Mexican
Triple difference panel regressions.
Small firms, System of Fast Opening of Firms" (SARE) for small firms.
Eligible industries include: production of metal and wooden furniture, freezing of fruits and vegetables, production of clothes and textiles, drugstores and small supermarkets, video stores and DVD rentals, real estate services.
New jobs in old firms; new firms.
51
This increase in the flow of firm registration appears to be temporary and concentrated in the first ten months after implementation.
Social Security Institute (IMSS).
de Mel et al. (2012)
Formalization
Sri Lanka The authors conducted a randomized control trial to evaluate the impact of formalization on firm outcomes. The experiment consisted of providing incentives for informal firms to formalize. Three follow-up surveys, at 15 to 31 months after the intervention, measured the impact of formalizing on these firms. Although mean profits increased, this appears largely due to the experiences of a few firms that grew rapidly, with most firms experiencing no increase in income as a result of formalizing. The authors also find little evidence for most of the channels through which formalization is hypothesized to benefit firms, although formalized firms do advertise more and are more likely to use receipt books. Nevertheless, the results suggest that although most informal firms do not want to formalize, policy efforts that lead to relatively modest increases in the net benefits of formalizing would induce a sizeable share of informal firms to formalize.
The baseline sample consists of 520 firms.
Randomized control trial.
Between 1 and 14 employees. The firms cover a range of industries, with 44 percent in services (for example, motor vehicle repair, restaurants), 32 percent in manufacturing (for example, manufacturing fabricated metal products and glass products).
Likelihood of registration; survival; report profits; monthly profits; monthly sales; number of paid workers; recruited a new worker; capital stock; paid taxes; amount of taxes paid; formal accounting; has a receipt book; business bank account; applied for business loan; applied for personal loan.
Martincus et al.
(2012)
Export promotion
Argentina The paper examines the effects of trade promotion programs on the export performance of firms within different size segments using a firm-level data set for Argentina over the period 2002 to 2006. The results indicate that the exportAR program increased exports for small firms mainly through an expansion of the set of destination countries.
In 2006, 312 small firms and 143 medium firms participated in the program.
Difference-in-differences estimator with propensity-score matching.
Firms are classified in terms of employment: up to 50 employees (small), between 51 and 200 employees (medium).
All sectors.
Exports.
Christian Volpe Martincus and Jerónimo Carballo (2008)
Export promotion
Peru The study provides evidence of the impact of export promotion on export performance using firm-level data for Peru over the period 2001-2005. The authors found that export support from PROMPEX had an impact on the number of products and destinations of exports.
In 2005, 709 firms received support from PROMPEX.
Difference-in-differences estimator with propensity-score matching.
The definition of the size categories follows the definition of the Peruvian National Statistics (INEI): up to 10 employees (micro), between 11 and 50 employees (small), between 51 and 200 employees (medium).
All sectors.
Export;, number of products exported; average export per country; and product.
52
Christian Volpe Martincus and Jerónimo Carballo (2010)
Export promotion
Colombia The study compares the effects of different export promotion activities undertaken by PROEXPORT in Colombia on the extensive and intensive margins of firms’ exports against each other. The study also accounts for potential selection bias of firms into these activities. The authors use export data for the entire population of Colombian exporters over the period 2003-06 and the results suggest that firms that simultaneously receive counselling, participate in international trade missions and fairs, and get support in setting up an agenda of commercial meetings experienced higher growth of total exports than comparable firms that participated in only one of these activities.
In 2006, 2752 firms received support from PROEXPORT.
Difference-in-differences estimator with propensity-score matching.
The definition of the size categories follows the definition of the Colombian National Statistics (DANE): micro: 1–10 employees; small: 11–50 employees, and medium-size: 51–200 employees.
All sectors.
Exports.
Christian Volpe Martincus and Jerónimo Carballo (2010)
Export promotion
Chile The paper assesses the distributional impacts of trade-promotion activities, PROCHILE, on export-related measures by using semiparametric quantile treatment effect estimation based on the data of Chilean exporters between 2002 and 2006. The results indicate that export promotion has very heterogeneous effects over the distribution of export performance. Further, smaller firms seem to benefit more from export promotion programs.
1,796 firms received support from PROCHILE in 2006.
The paper defines size based on the distribution of total export to define the quantiles and thus different firm size based on this measure.
All sectors.
Export; number of products exported; average export per country; and product.
Gourdon et al. (2011)
Export promotion (matching grant)
Tunisia This paper examines the impact of the FAMEX II program, which intends to provide Tunisian firms with export-development assistance on a cost-sharing basis, using firm-level data collected through a purposely designed survey. The results suggest that FAMEX II had positive impacts on export growth. The estimated average annual growth rate of export values during the program period 2004-08 is higher for FAMEX II participants than for the control group. The estimates suggest that FAMEX II improved the extensive margin of export performance. Nevertheless, the estimated impacts of FAMEX II on total firm sales and employment are weak, suggesting some reallocation between exported and non-exported products within supported firms.
The survey performed by the authors covered a sample of 420 firms allocated evenly between FAMEX recipients and non-recipients.
Difference-in-differences estimator with propensity-score matching.
The minimum thresholds for eligibility were about $140,000 and $70,000 in sales, respectively, for manufacturing and services firms.
Manufacturing and services.
Change in log (sales); change in log (number of employees); change in log (exports); change in log (number of exported products); change in log (number of export destinations).
53
Appendix D. Risk of Bias Assessment
The assessment of the risk of bias is important to identify issues that might influence the estimated
coefficient of studies and thus impact the results of this systematic review. This report uses the
risk of bias tool, based on Hombrados et al. (2012), to rank the studies and check whether they
addressed the risk of bias. Additionally, the report follows the strategy used by Baird et al. (2013)
to provide an additional aggregated classification of risk of bias.
Table D.1 presents the summary of aggregated results from the risk of bias assessment.
Selection bias and confounders: Only two of the 39 reports (5 percent) completely address this
issue. This is because, for some categories of quasi-experimental design (PSM, OLS, DID), the
best possible ranking is "unclear" for selection bias and confounders. Most paper approaches
correspond to these methodologies.
1. Spillovers, cross-overs, and contamination: Twenty reports (51 percent) adequately address this
issue. Since most of the programs were implemented at the national or city level, and many others
in one specific sector, some sort of contamination was always possible. Yet this issue was never
addressed, not even in the experimental approaches. This was especially difficult in quasi-
experimental approaches, since data was collected previously by external institutions without
taking into account possible spillover effects within sectors or communities. Moreover, some
papers report the existence of other simultaneous interventions likely to affect the outcomes. Since,
in this kind of research, it is not common to separate participants and non-participants
geographically and/or socially, the classification of the papers for the spillovers, cross-overs, and
contamination most times fall into the “unclear”.
2. Outcome reporting: All but one paper adequately address the issue of outcome reporting and there
is no evidence of selective reporting.
3. Analysis reporting: Twenty-two reports take an appropriate approach when conducting analysis.
The main reason a report was deemed of lower quality in this category was the failure to report the
necessary tests for quasi-experimental methods, specially Rosenbaum test for propensity-score
matching and Hausmann test for exogeneity in the case of instrumental variables.
54
4. Other risks of bias: The reasons why other risks of bias show up are heterogeneous, including
violation of orthogonality of instruments, incentives of surveyed firms to overstate outcomes, and
data on the baseline collected retrospectively, among others.
Following Baird et al. (2013), using the above categories, we categorize the reports as low,
medium. or high risk of bias. Only 5 percent of the reports (two studies) are categorized as low
risk, 32.5 percent (13 studies) as medium risk, and 62.5 percent (25 studies) as high risk. Since
most reports presented quasi-experimental designs, it was especially challenging to find those that
discuss all relevant features of the approach. This was especially true for the PSM methods, for
which the most challenging requirement was the Rosenbaum test for hidden bias (which was not
presented by any of the papers), followed by the lack of a test for equality in means of covariates
between treatment, and control groups after matching.
The overall results indicate that there is a huge heterogeneity in the quality of the assessment
of the factors that contribute to the risk of bias but most papers are classified as medium risk of
bias. This result is hugely influenced by the assessment of the spillovers, cross-overs, and
contamination category of the risk of bias tool. From the 36 papers reviewed, given the
characteristics of SME support, most studies were unable to ensure that there is no spillover or
contamination of the treatment.
Table D.1. Summary of Risk of Bias in Included Studies