The Impact of Credit Availability on Small Business Exporters by Joe Peek for Under contract no. SBAHQ-11-M-0206 Release Date: April 2012 The statements, findings, conclusions, and recommendations found in this study are those of the authors and do not necessarily reflect the views of the Office of Advocacy, the United States Small Business Administration, or the United States government.
Transcript
The Impact of Credit Availability on Small Business Exporters
by
Joe Peek
for
Under contract no. SBAHQ-11-M-0206
Release Date: April 2012
The statements, findings, conclusions, and recommendations found in this study are those of the authors and do not necessarily reflect the views of the Office of Advocacy, the United
States Small Business Administration, or the United States government.
1
Contents Contents i Executive Summary 1 Introduction 3 Literature Review 6 The importance of bank health for small businesses 6 The importance of trade finance for exports 12 Hypotheses 15 Data 17 Modeling Approach 19 Industry-level analysis 19 State-level analysis 24 Empirical Results: Industry-level Data 27 Empirical Results: State-Level Data 29 Concluding Comments 31 References 34 Tables 37 Table 1: Distribution of the Dollar Value of Exports by Industry
and Firm Size, 2009 37 Table 2: Summary Statistics, Bank Health Measures,
Industry-Level Analysis 38 Table 3: Correlation Matrix, Industry-Level Analysis 39 Table 4: Determinants of Small Firm Export Shares,
Industry-Level Analysis 40 Table 5: Expanded Determinants of Small Firm Export Shares,
Industry-Level Analysis 41 Table 6: Determinants of Small Firm Export Shares,
Industry-Level Analysis, Subsample of Medium-Sized Banks 42 Table 7: Number of SME Exporters by State 43 Table 8: SME Share of Dollar Volume of Total Exports by State 44 Table 9: Summary Statistics, State-Level Analysis 45 Table 10: Determinants of Small Firm Export Shares, State-Level Analysis 46
Appendix 47 Table A1: Variable Names and Sources, Industry-Level Analysis 47 Table A2: Variable Names and Sources, State-Level Analysis 48
Executive Summary
International trade flows declined dramatically in the wake of the recent financial crisis,
far beyond what might be expected based on historical relationships. For example, census data
show that the value of U.S. exports of goods and services dropped by more than 14 percent from
2008 to 2009. The fact that the decline in exports was unusually large in this particular episode
has been attributed by many to a supply effect emanating from the tightening of credit
availability. Credit plays a particularly important role for exporters for at least two reasons:
• First, exporters rely on credit to finance their working capital to a greater extent than do
firms producing solely for their domestic market, in large part because of the longer
transportation time associated with exported goods.
• Second, cross-border transactions are deemed to be more risky, so that payment
guarantees provided by banks and other financial intermediaries play an important role in
assuring both delivery of purchased goods to the importer and payment to the exporter.
Thus, a deterioration in the ability or willingness of banks to provide financing will have
a greater adverse impact on exporting firms than on firms producing goods for domestic
consumption. Moreover, because small businesses typically rely more than large firms on bank
credit, a tightening of credit might be expected to adversely affect small and medium-sized
enterprises (SMEs) (with fewer than 500 employees) more than larger firms with access to
national and international credit markets. Thus, given the relatively greater reliance on financial
intermediaries by exporting firms, one might expect SME exporters to have been more adversely
affected by the financial crisis than larger exporting firms.
2
Using the U.S. Commerce Department’s International Trade Administration Exporter
Database (ITAED), this study investigates the differential impact on SME exporters of bank
health, disaggregated by industry and separately by state. The study investigates the extent to
which the sensitivity to bank health of small firm total exports (share of dollar volume) across
industries is related to the relative degree of external finance dependence of the industries. The
evidence indicates that, indeed, the small firm export share declines in response to a deterioration
in bank health, with a greater adverse impact for export firms in industries that are more reliant
on external finance. These results hold for alternative measures of bank health.
Moreover, the evidence is stronger for smaller firm size classes. The effects are evident
for the smallest firm size class, firms with fewer than 20 employees, and for small firms with
fewer than 100 employees. However, once the size threshold is raised to include all firms with
fewer than 500 employees, the effects tend to dissipate. Thus, the adverse effects of a
deterioration in bank health appear to be relatively stronger for exporting firms with fewer than
100 employees.
The evidence for the state-level analysis indicates that local bank health does matter.
However, the analysis is limited because the firm size data cannot be disaggregated into small
firm size classes of fewer than 500 employees. Still, the results indicate that both the median
capital ratio measure and the median nonperforming loan ratio measure for large banks have
significant effects on the state-level small firm export share, indicating that a deterioration in
large bank health has stronger adverse effects on SME exporters than on larger exporting firms.
3
I. Introduction1 International trade flows declined dramatically in the wake of the recent financial crisis.
According to figures from the U.S. Census Bureau and Bureau of Economic Analysis, the value of U.S.
exports of goods and services declined from $1.84 trillion in 2008 to $1.58 trillion in 2009.2 Moreover,
the unprecedented declines in late 2008 and 2009 exceeded what might be expected based on
historical relationships. While the demand for exports typically declines with a weakening of
economic activity in importing countries, the fact that the decline in exports was unusually large
in this particular period has been attributed by many to a supply effect emanating from the
tightening of credit availability (for example, Iacovone and Zavacka 2009; Amiti and Weinstein
2011). Credit plays a particularly important role for exporters for at least two reasons. First,
exporters rely on credit to finance their working capital to a greater extent than do firms
producing solely for their domestic market, in large part because of the longer transportation
time associated with the delivery of exported goods. Second, cross-border transactions are
deemed to be more risky, so that payment guarantees provided by financial intermediaries play
an important role in assuring both delivery of purchased goods to the importer and payment to
the exporter. Thus, a deterioration in the ability or willingness of banks to provide financing will
have an adverse impact on exporting firms to a greater degree than on firms producing goods for
domestic consumption.
This study investigates the relative impact of the recent financial crisis and the Great
Recession on small business exporters. Because small businesses typically rely more than large
firms on bank credit, a tightening of credit might be expected to adversely affect small and
1 The author thanks the Office of Advocacy staff for valuable comments on earlier drafts and Sunayan Acharya for valuable comments and research assistance. All errors remain the responsibility of the author. 2 U.S. Bureau of the Census, U.S. International Trade in Goods and Services - Annual Revision for 2011, accessed 1/08/13 at https://www.census.gov/foreign-trade/Press-Release/2011pr/final_revisions/.
4
medium-sized enterprises (SMEs) (fewer than 500 employees) more than larger firms (500 or
more employees) with access to national, and even international, credit markets. Thus, given the
relatively greater reliance on banks by exporting firms, one might expect SME exporters to have
been adversely affected by the financial crisis to an even greater degree than larger exporting
firms.
This study focuses on two major aspects of SME exporter behavior relative to that of
larger firms using the U.S. Department of Commerce’s International Trade Administration
Exporter Database (ITAED). This database, compiled by the federal government, contains the
dollar volume of exports separately for SMEs (fewer than 500 employees) and for large firms
(500 or more employees), with the SME data disaggregated into additional size classes for the
industry-level data.
First, using the national data disaggregated by industry, this study investigates the extent
to which the SME shares of the dollar volume of exports across industries are related to the
relative degree of external finance dependence of the industries, using a measure of external
finance dependence based on Rajan and Zingales (1998). One would expect to find that because
SMEs tend to be more bank dependent than larger firms, the deterioration of bank health would
have a larger adverse effect on small firm exporters compared with larger exporting firms,
suggesting that the SME share of the dollar volume of total exports would have declined as a
consequence of the financial crisis. Moreover, the relative declines in export volumes should be
related to the extent to which firms are dependent on external finance. In particular, a
deterioration in bank health should have a stronger adverse effect on exporting firms in industries
that tend to be more dependent on external finance, with the effects being even more pronounced
5
for smaller firms that tend to be more bank dependent than larger firms that may have direct
access to funding from financial markets.
The second major aspect of the study focuses on the ITAED database disaggregated by
state. This database can exploit differences across states in bank health to investigate the relative
performance of SME exporters compared with large firm exporters. The prediction is that the
relative performance of SME exporters is related to the degree of the deterioration in bank health
in the state in which the firms operate, insofar as smaller firms are more dependent on bank
financing compared with larger firms. In particular, the small firm export share for firms
headquartered in a state will show a greater decline in states where the health of banks operating
in the state deteriorates more.
The evidence indicates that, indeed, the small firm export share declines in response to a
deterioration in bank health, with the adverse impact being greater for export firms in industries
that rely more on external finance. These results hold for alternative measures of bank health.
Moreover, the evidence is stronger for smaller firm size classes. The effects are evident for the
smallest firm size class considered, those with fewer than 20 employees, and remain when the
threshold is raised to define small firms as those with fewer than 100 employees. However, once
the threshold is raised to include all firms with fewer than 500 employees, the effects tend to
dissipate. Thus, the adverse effects of a deterioration in bank health appear to affect exporting
firms with fewer than 100 employees more than is the case for larger firms. In fact, the effect of
deteriorating bank health on firms with 100 to 499 employees appears to differ little from that on
firms with 500 or more employees.
The evidence for the state-level analysis indicates that local bank health does matter.
However, the analysis is limited because the firm size data cannot be disaggregated into size
6
classes within the SME size class of fewer than 500 employees. Still, the results indicate that
both the median capital ratio (Riskcap) measure and the median nonperforming loan (NPL) ratio
measure for large banks have significant effects of the predicted sign on the state-level small
firm export share, suggesting that a deterioration in large bank health has stronger adverse effects
on the exports of SMEs than on those of larger firms.
II. Literature Review
Two important strands of literature are particularly relevant for this study. First, a
substantial literature exists emphasizing that small businesses tend to be “bank dependent.” This
literature emphasizes the importance of bank health in determining credit availability to SMEs. A
second strand of literature concerns the determinants of international trade flows, with an
emphasis on the importance of trade finance. The recent unprecedented decline in international
trade flows has stimulated a resurgence in this literature.
The importance of bank health for small businesses
Previous literature has established that most small firms are “bank dependent” for their
external finance. Furthermore, it has been shown that bank lending is adversely affected by a
tightening of monetary policy, by regulatory changes that tighten capital requirements, and by
bank capital crunches. More recently, the 2007-2009 financial crisis highlighted the importance
of liquidity as a determinant of the ability of banks to satisfy loan demand. While a liquidity
crisis is distinct from a tightening of monetary policy, they do share some characteristics in terms
of the stress placed on banks in raising short-term funds.
7
Much of the literature on “relationship lending” has focused on asymmetric information
problems associated with smaller firms. Udell (1997) describes small firms as “informationally
opaque” compared with large firms, which are “informationally transparent.” Small firms are
informationally opaque because they usually have little or no collateral and, often being
relatively young firms, lack an extensive history from which future firm or management
performance can be extrapolated, even though the firm may have high growth potential. Because
of their small size and the lack of substantial information on their quality, such firms have
virtually no access to external funds from national markets, such as through the issuance of
commercial paper, bonds, or publicly traded equity. Similarly, finance companies provide asset-
backed financing, for example for loans collateralized by inventories and accounts receivable.
Still, for a small, opaque firm with few tangible assets, bank loans may be the only source of an
unsecured line of credit or of a loan secured by an asset that might not be easily commoditized.
As a result, the clientele effect in bank lending results in many firms being bank dependent,
having few alternatives to banks should their bank credit be curtailed or terminated.
Although nonbank financial intermediaries provide loans, open market instruments are
available for short-term credit, and trade credit is available to some firms, these alternative
sources of credit are not perfect substitutes for bank credit for a variety of institutional reasons.
In particular, smaller firms are not able to issue such debt because the issue size would be too
small to overcome the fixed costs of issuance at a reasonable interest rate. Similarly, firms that
are sufficiently opaque or have a sufficiently low credit standing to require close monitoring by a
financial intermediary would not have direct access to the credit markets. On the other hand,
large, highly rated firms can directly access public credit markets by issuing commercial paper.
However, issuing unsecured commercial paper still may require the issuing firms to obtain third-
8
party guarantees from banks to enhance the credit rating of the commercial paper and lower the
interest cost to the firm. Thus, even though many larger firms have come to rely less on direct
credit from banks, they still compete indirectly with small firms for bank resources, and this
competition comes to the fore when credit markets come under stress, as has recently been the
case (Peek 2011).
An important bank characteristic that affects the provision of bank credit is whether a
bank faces a binding capital constraint. As a result of the "headwinds in monetary policy" noted
by Chairman Greenspan during the recovery from the 1990 recession, a variety of authors have
examined the impact that significant bank health problems can have on the efficacy of monetary
policy. For example, Peek and Rosengren (1995a) examined the impact that capital constraints
had on a bank’s ability to lend during the period of significant banking problems in the early
1990s in New England. Using a simple static model, they show that banks facing a binding
capital constraint are limited in altering the size of their balance sheets, restricting the ability of
capital-constrained banks to respond to monetary policy shocks. They document that banks
experiencing an adverse capital shock that makes the capital constraint binding will shrink both
assets and liabilities. Peek and Rosengren (1995a) also show that the behavior of capital-
constrained banks in New England differed from that of unconstrained banks, with the loan
portfolios of unconstrained banks responding more to monetary policy shocks than those of the
capital-constrained banks.
Peek and Rosengren (1995b) focus on the role of the enforcement of capital regulations
through which bank supervisors can have a direct impact on the ability of capital-constrained
banks to lend, and thus be able to increase loans in response to an easing of monetary policy.
They examine the impact on bank lending of formal regulatory actions imposed on banks that
9
experienced asset quality problems. They find that the enforcement actions by bank regulators
included achieving explicit capital targets over a short time frame. The result was an immediate
and significant reduction in bank loan portfolios associated with the enforcement action that
persisted for some time thereafter while the bank continued to operate under the enforcement
action.
A number of authors have examined whether changes in capital regulations, by causing
banks to become capital constrained, cause banks to be particularly responsive to their capital
constraint, and, by implication, less responsive to changes in monetary policy. For example, Hall
(1993) finds that the introduction of the Basel I Accord had a significant impact on bank
portfolios. Hancock and Wilcox (1994) also found that the implementation of the Basel I Accord
affected banks’ willingness to lend. However, Berger and Udell (1994) do not find evidence that
the Basel I Accord created a bank capital crunch. More recently, a concern raised with the Basel
II Accord has been that the new capital regulations would magnify potential capital constraints
during recessions (for example, Kashyap and Stein 2004), making banks less responsive to an
easing of monetary policy. A very real concern with the effectiveness of the bank lending
channel, and thus the overall effectiveness of monetary policy, is whether banks are capital
constrained at the time of an easing of monetary policy. For example, given the liquidity crisis
and bank capital problems, the recent easing of monetary policy may have little impact on
increasing the availability of bank credit to firms.
Panel data techniques have provided more definitive results about the determinants of
bank loan supply. The key is relating cross-sectional differences in the characteristics of banks or
banking organizations to differences in the extent to which banks are able to insulate their loan
portfolios from a tightening of monetary policy. Two bank characteristics appear to have been
10
the primary focus. First, the ability of banks to raise nonreservable liabilities to replace the lost
reservable deposits is a key factor in determining the extent to which a bank must adjust its loan
portfolio when monetary policy is tightened. Because these funds are, for the most part,
uninsured liabilities, bank characteristics related to their access to external funds—for example,
size, health, and having direct access to capital markets—play an important role in determining
the ability of banks to insulate their loan portfolios from the effects of changes in monetary
policy. Second, because banks face a capital requirement constraint in addition to the reserve
requirement constraint on their activities, banks may differ in their response to a change in
monetary policy depending on which constraint is most binding. If the capital ratio requirement
is the binding constraint, easing the reserve requirement constraint through open market
operations should have little, if any, effect on bank lending. That is, because the binding
constraint has not been eased, expansionary monetary policy, at least operating through the bank
lending channel, would be like “pushing on a string.”
Kashyap and Stein (1995) note that with a tightening of monetary policy and the
associated loss in reservable deposits, it is costly for banks to raise uninsured deposits. However,
banks differ in the degree to which they have access to external funds. They hypothesize that
bank size is a reasonable proxy for their degree of access to uninsured liabilities, with smaller
banks having more limited access, and thus having their loan portfolio affected more by a
tightening of monetary policy. Indeed, they find empirical support for the proposition that small
banks are more responsive (shrink their loan portfolios by more) to tightened monetary policy
than are large banks.
Subsequently, Kashyap and Stein (2000) extend their analysis of the relative ease with
which banks can raise uninsured deposits following a monetary policy tightening, noting that the
11
bank loan response also will differ depending on the liquidity position of the bank. A bank that
finds it relatively costly to raise uninsured deposits, but has large securities holdings, has the
option of adjusting to shrinking reservable deposits by selling some of its securities, while a less
liquid bank may be forced to shrink its loan portfolio by a greater degree. In a large cross-section
of banks, they find evidence that the loan portfolios of smaller, more illiquid banks are the most
responsive to monetary policy shocks.
Campello (2002) distinguishes among these smaller banks based on whether or not they
are affiliated with a large multibank holding company. He finds that the lending of small
affiliated banks reacts less to tightening monetary policy than that of similar small stand-alone
banks. The affiliated small banks may thus be more able to insulate their lending from tightening
monetary policy, but it is unclear whether this is caused more by large multibank holding
companies channeling internal funds to subsidiaries, or by these large companies’ easier access
to external funds. Campello tries to address this issue by using capital-to-asset ratios to
distinguish among bank holding companies. Similarly, Kishan and Opiela (2000) use a bank's
capital-to-asset ratio as the proxy for the ability of a bank to raise uninsured deposits, finding that
the loan portfolios of well-capitalized banks are less sensitive to monetary policy shocks than
those of poorly capitalized banks of the same size.
Holod and Peek (2007) use the distinction between publicly traded and non-publicly
traded banks to classify banks by the ease with which they can access external funds. They find
that after controlling for size, capitalization and other factors, the loan portfolios of publicly
traded banks shrink less than those of non-publicly traded banks when monetary policy tightens
because of the banks’ ability to raise external funds, including issuing large time deposits.
Furthermore, as one would expect, when a distinction is made between tightening and easing
12
monetary policy, the estimated effect can be attributed to the effects of monetary policy
tightening (tightening a binding constraint) rather than monetary policy easing (possibly
“pushing on a string”).
The importance of trade finance for exports
Even before the recent financial crisis, an extensive literature investigated the impact of
financial frictions on international trade. This literature has included both theoretical and
empirical studies, with the early empirical studies tending to be cross-country studies relating
country-specific measures of financial development and financial frictions to international trade
flows (for example, Kletzer and Bardhan 1987; Beck 2002, 2003; Matsuyama 2005; Do and
Levchenko 2007; Greenaway et al. 2007). However, the dramatic response of exports to the
economic slowdown and the global financial crisis stimulated interest in investigating the
relationship between trade finance and exports (for example, Iacovone and Zavacka 2009;
Auboin 2009; Bricongne et al. 2010 (France); Behrens et al. 2010 (Belgium); Berman and Martin
2010 (Africa); di Mauro et al. 2010 (Euro Area); Chor and Manova 2011; Paravisini et al. 2011
(Peru); Feenstra et al. 2011 (China); Amiti and Weinstein 2011 (Japan)), with a movement away
from country-level data to a more disaggregated industry or firm-level analysis.
As described by Amiti and Weinstein (2011), among others, the production of exports is
more sensitive to financial shocks than the production of similar goods for domestic
consumption because of the higher working capital requirements and the higher default risk
associated with international trade transactions. First, because of the longer time lags due to the
delivery distances involved, exporters tend to require more working capital than do producers of
domestic goods and services. Second, exporters must protect themselves against the risk of
13
default by importers in foreign countries. This is typically done through financial intermediaries,
primarily banks, using letters of credit and bankers’ acceptances. In this way, third parties
(banks) provide exporters a reduction in counterparty risk, which likely is much more important
than for domestic transactions because the counterparties are at a greater physical delivery
distance and, more important, they are in other countries with different laws and regulations and
different degrees of enforcement of those laws and regulations.
Although motivated by the dramatic decline in international trade during the recent
financial crisis, Iacovone and Zavacka (2009) base their analysis on historical data from 23 past
banking crises in a variety of developed and developing countries between 1980 and 2000. They
find that banking crises affect export growth in sectors with a relatively high reliance on external
finance more than in sectors less reliant on external finance. Moreover, exports from industries
that tend to have more tangible assets (such as machinery, buildings, land, and inventory) suffer
relatively less from a banking crisis than industries with less tangible assets. Demand shocks
amplify the trade finance effect; that is, weakened demand associated with recessions in
importing countries (as was the case in the recent crisis) magnifies the adverse effects of a
restricted credit supply on exporters.
It is difficult to disentangle weakened demand for trade finance from restricted supply
when economic activity is contracting. Still, if as estimated (di Mauro et al. 2010) about 90
percent of international trade relies on some form of trade finance, credit availability is likely
central to explaining the fluctuations in exports. A first pass at isolating credit supply effects is to
focus on imports coming into a given country from a set of exporting countries with varying
credit conditions. Chor and Manova (2011) take exactly that approach, using monthly data on
U.S. imports. They find that countries with tighter credit conditions experienced weaker exports
14
to the United States during the 2008-2009 crisis period. Moreover, the adverse effects were
stronger for industries that tend to rely relatively more on external finance or have fewer tangible
assets that can be used as loan collateral, consistent with the findings by Iacovone and Zavacka
(2009) noted above.
Of course, burrowing down to the individual firm level can be even more informative.
For example, using firm-level data for China, Feenstra et al. (2011) focus on the higher working
capital needs and greater risk associated with exporting firms compared with firms producing for
the domestic market. They find that, in fact, banks do treat exporting firms differently than firms
producing solely for the domestic market, with exporters facing tighter credit constraints, most
likely because they are deemed to expose the lender to more risk. Moreover, the recent financial
crisis tightened the credit constraints on exporters even more, although, as might be expected,
multinational firms were subjected to less severe credit constraints. This may reflect that lenders
view exporting by large multinational firms as less risky compared with domestic firms, or
simply that operations of multinational firms may be exporting to their affiliates in other
countries for which payment guarantees provided by financial intermediaries are not needed.
In another firm-level study, Bricongne et al. (2010), using monthly data on a large sample
of French exporters, were able to investigate the mechanisms through which exports were
adversely affected during the recent financial crisis. They focus on differences across firms in
terms of their size, degree of globalization and reliance on external finance. They find that firms
in industries that tend to rely relatively more on external finance were more severely affected.
Interestingly, they do not find that small firms were hit disproportionately relative to large firms
once they control for export destinations and industries, although they speculate that in the
aftermath of the crisis smaller firms may exhibit higher exit rates from the exporting business.
15
Still, two other studies dig even deeper by matching individual firms to individual banks
in order to exploit differences across banks in their ability or willingness to provide credit.
Paravisini et al. (2011) focus on Peru, while Amiti and Weinstein (2011) focus on Japan.
Paravisini et al. (2011) find that banks in Peru responded to adverse liquidity shocks by reducing
credit availability to firms, leading firms to curtail their exports, with the reduction in credit
availability accounting for about 15 percent of the decline in Peruvian exports during the crisis.
Amiti and Weinstein (2011) build an even stronger case for the importance of credit
availability for international trade, providing quite convincing evidence on the hypothesized
mechanisms underlying the trade finance channel. Not only do they show that the health of a
firm’s main bank matters more for exporters than for firms serving the domestic market, they
also show that the trade finance effects are related to the longer time lag for seaborne shipments
compared with air freight, and to the perceived riskiness of exporters, with weaker bank health
having no impact when default risk is less an issue for exports by firms with foreign affiliates.
III. Hypotheses
The key hypothesis to be tested in this study is that SME exporters are more sensitive to
credit availability than are larger exporters. SMEs tend to be bank dependent, and thus are
affected more by a deterioration in bank health. Moreover, this effect is magnified for exporting
firms because exporters tend to be more sensitive to credit availability than are non-exporting
firms, both because of the longer time lags involved with exporting due to the delivery distances
involved and because of the greater default risk associated with having counterparties to the
export transactions located in a different country with different laws and regulations and
different degrees of enforcement of those laws and regulations.
16
Among the specific hypotheses to be tested are:
1. The share of the dollar volume of total exports attributable to SMEs declined during
the financial crisis as bank health deteriorated.
2. The extent of the decline in the share of the dollar volume of total exports attributable
to SMEs is greater for firms in industries that rely more on external finance.
3. The share of the dollar volume of total exports attributable to SMEs depends on local
bank health, as measured by bank health in the state in which an exporting firm is
headquartered, with the share falling with a deterioration in bank health.
The dependent variables are constructed as the SME share of the total dollar volume of
exports. Because exports are affected by myriad factors that are difficult to quantify, this choice
for the dependent variable is preferable to alternative measures based solely on SME exports,
such as the percentage change in SME exports. Such measures would require the regression
equation to include a number of variables to control for fluctuations in export demand. For
example, export demand would be expected to be sensitive to factors such as the dollar exchange
rates and fluctuations in real economic activity of those countries that import U.S. goods and
services. In contrast, under the key assumption that fluctuations in export demand will be
reflected similarly in the exports of large and small firms, other things equal, controls for import
demand are not required, insofar as fluctuations in import demand would affect exports by large
and small firms similarly.
While SMEs are typically identified as firms with fewer than 500 employees, three
alternative firm size classes will be considered for the industry-level analysis: (1) firms with
fewer than 20 employees, (2) firms with fewer than 100 employees, and firms with fewer than
500 employees. The expectation is that the exports of the firms in the smaller size classes will be
17
affected relatively more by a deterioration in the availability of bank credit than the exports of
firms in the larger size classes. However, for the state-level analysis, only one firm size
distinction is available in the data: fewer than 500 employees and 500 or more employees.
IV. Data
The primary data for this study come from four separate sources. These data sources
include the U.S. Department of Commerce’s International Trade Administration Exporter
Database (ITAED), the Federal Deposit Insurance Corporation’s Summary of Deposits (SOD),
the Federal Reserve’s Consolidated Reports of Condition and Income (Call Reports), and
Compustat.
The ITAED is available only annually, with the 2009 data being the most recent data
currently available. Because of a change in the data beginning in 2002, the analysis will be
restricted to annual observations for the 2002-2009 period, which will provide a benchmark
period prior to the financial crisis, as well as the 2008-2009 period when exports were hit
hardest. Two specific files from the ITAED that separate data for SME exporters from large firm
exporters are used: (1) national data disaggregated by industry, and (2) national data
disaggregated by state. The ideal database would disaggregate the data by both industry and state
in the same database. However, disclosure issues prevent the public release of the data at the
state level with enough separate industry categories for meaningful sector distinctions. The
industry-level data used are aggregated at the three-digit NAICS industry level, resulting in 21
separate industries for the analysis.
The industry-level dataset includes both the number of exporters and the dollar volume of
exports by industry, using the North American Industry Classification System (NAICS) industry
18
categories. For each industry, the firms are divided into firm size categories based on the number
of employees, and a further distinction is made between manufacturing and non-manufacturing
firms. For this study, we focus on the total dollar volume of exports rather than the number of
exporting firms because the number of identifiable exporting firms in the dataset appears to be
volatile, suggesting notable measurement error. While we did estimate the same relationships for
the subset of manufacturing firms, the results were similar, but weaker, likely attributable to the
much smaller sample of manufacturing firms. Consequently, we do not report results for the
manufacturing subsample of exporting firms. The state-level dataset also includes the total
number of exporters as well as the dollar volume of exports. However, because of the volatility
in the number of exporters noted above, we chose to focus solely on the dollar volume of
exports. Unfortunately, for this dataset, we are limited in the extent to which we can investigate
differences across firm size classes because this dataset contains only two firm size classes:
fewer than 500 employees and 500 or more employees.
Compustat data are used to construct the measure of external finance dependence (EFD).
The remaining databases are used to construct alternative measures of bank characteristics. For
the national industry-level analysis, the individual bank balance sheet information is taken from
the Call Reports to construct measures of aggregate bank health. For the analysis of the export
data disaggregated by state, the Call Reports also are used to create measures of bank
characteristics at the state level. Construction of the state-level bank characteristics requires the
SOD data to identify bank operations in each state for multistate banks.
19
V. Modeling Approach
The key variable in this study is the SME share of the dollar value of total exports. While
exports generally were affected adversely by the financial crisis, it is expected that smaller firms
would be hit harder than larger firms due to the greater reliance of smaller firms on bank finance
and the general perception that smaller firms expose lenders to greater risk. Thus, as credit
availability deteriorates and as lenders undertake a flight to quality, smaller exporting firms
might be expected to suffer the brunt of the credit pullback. This would produce a differential
effect on the export volumes of SMEs compared with large firms. In addition, using the small
firm share of the total dollar value of exports rather than the change in the small firm dollar value
of exports avoids having to control explicitly for fluctuations in the demand for exports across
time, which could become quite complicated because export demand would depend, among other
things, on the general level of economic activity in the many countries to which U.S. firms
export.
Industry-level analysis
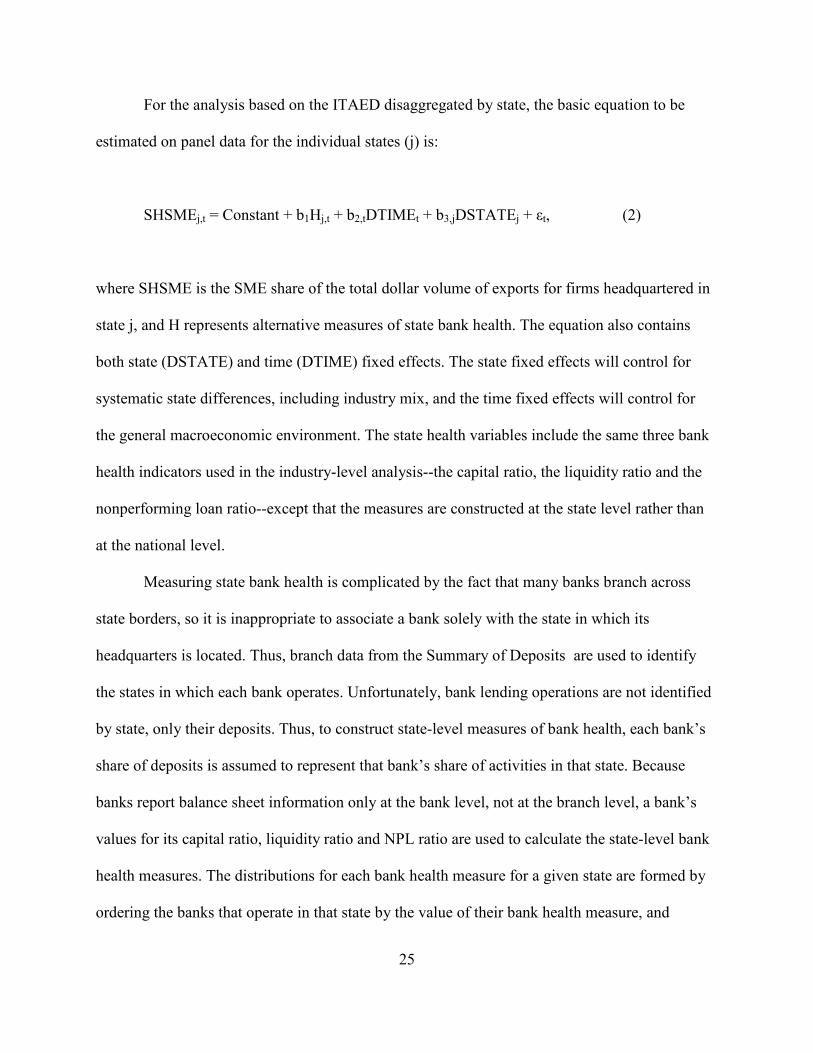
For the analysis based on the ITAED disaggregated by industry at the national level, the
basic equation to be estimated on panel data for the individual industries (k)3 is:
where SHSME is the SME share of the total dollar volume of exports for firms headquartered in
state j, and H represents alternative measures of state bank health. The equation also contains
both state (DSTATE) and time (DTIME) fixed effects. The state fixed effects will control for
systematic state differences, including industry mix, and the time fixed effects will control for
the general macroeconomic environment. The state health variables include the same three bank
health indicators used in the industry-level analysis--the capital ratio, the liquidity ratio and the
nonperforming loan ratio--except that the measures are constructed at the state level rather than
at the national level.
Measuring state bank health is complicated by the fact that many banks branch across
state borders, so it is inappropriate to associate a bank solely with the state in which its
headquarters is located. Thus, branch data from the Summary of Deposits are used to identify
the states in which each bank operates. Unfortunately, bank lending operations are not identified
by state, only their deposits. Thus, to construct state-level measures of bank health, each bank’s
share of deposits is assumed to represent that bank’s share of activities in that state. Because
banks report balance sheet information only at the bank level, not at the branch level, a bank’s
values for its capital ratio, liquidity ratio and NPL ratio are used to calculate the state-level bank
health measures. The distributions for each bank health measure for a given state are formed by
ordering the banks that operate in that state by the value of their bank health measure, and
26
assigning each bank a weight equal to its share of the state’s deposits. Similar to the method used
for the national bank health measures for the industry-level analysis, the median, 25th, and 10th
percentiles of the distribution of the state’s bank health variables are then equal to the value of
the bank located at the median, 25th, and 10th percentiles of the distribution of the state’s
deposits, respectively.
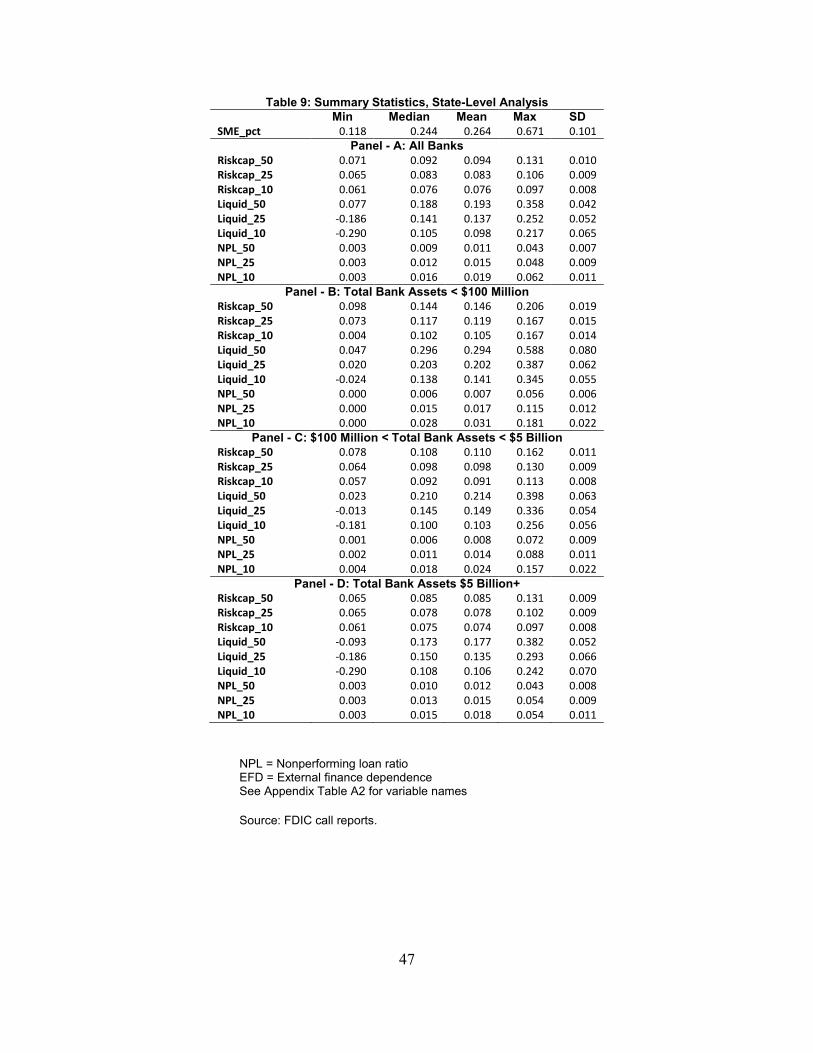
In addition to constructing these bank health measures for all domestic commercial banks
in a state, we also construct the measures for three bank size classes to allow for the possibility
that banks of different sizes may have differing importance in affecting the performance of SME
exporters relative to large exporting firms. The bank size classes are based on the size of the
entire bank rather than on the size of the bank’s branch deposit operations in the state. The three
size classes considered are: small, defined as banks with total assets less than $100 million;
medium, defined as banks with total assets from $100 million to $5 billion; and large, defined as
banks with total assets of $5 billion or more. Bank assets are in real terms, having been deflated
using the GDP implicit price deflator. Capital ratios, liquidity ratios, and NPL ratios are defined
in the same way as for the industry-level analysis. Table A2 in the Appendix lists the
descriptions and sources for each of the variables used in the state-level regression analysis.
The state-level analysis includes 36 states. States are omitted from the sample for two
reasons. First, to reduce noise in the small firm exporter share measure, states with fewer than
1,000 total exporting firms in any year have been eliminated. The 11 states eliminated are
Alaska, Delaware, Hawaii, Idaho, Montana, New Mexico, North Dakota, South Dakota,
Vermont, West Virginia, and Wyoming. Second, some states had few banks in the bank size
classes, allowing a single bank to be represented in the bank health characteristics of that state.
Thus, to minimize idiosyncratic fluctuations in the state-level bank aggregate statistics, states
27
with fewer than two individual banks in each of the three bank size classes were omitted. This
eliminated three additional states: Maine, New Hampshire, and Rhode Island. While it would be
interesting to examine further distinctions among banks, such as whether a bank is a member of a
multibank holding company or whether a bank is publicly traded, the extensive consolidation of
the banking industry that results in the small number of banks in size classes by state limits our
ability to make such additional distinctions.
VI. Empirical Results: Industry-Level Data
Table 4 contains the first pass at explaining the small firm dollar share of national export
volume disaggregated by industry. As noted earlier, the strong correlations of the alternative
measures of bank health preclude entering them as explanatory variables at the same time. Thus,
as a first pass, the explanatory variables are entered one at a time, along with the set of industry
and time fixed effects. As noted above, each explanatory variable is interacted with EFD, with
the anticipated sign on the estimated coefficients for capital ratio and liquidity ratio measures
being positive, and those for the nonperforming loan ratio and problem bank ratio being
negative. That is, the more dependent the industry on external finance, the greater are the adverse
consequences for small exporting firms relative to large exporting firms of a deterioration in
bank health. In the case of the Baa-Aaa interest rate spread, the predicted sign of the estimated
coefficient is negative because a higher credit risk premium embedded in interest rates is
anticipated to adversely affect small firms more than larger firms.
With the exception of the liquidity ratio measures, most of the estimated coefficients have
the predicted sign, indicating that a deterioration in bank health, or an increase in the interest rate
spread, adversely affects smaller firms’ exports more than larger firms’ exports, with stronger
28
effects for industries more dependent on external finance. For the smallest firms, those with
fewer than 20 employees, six of the 11 estimated coefficients are statistically significant at the 5
percent or better level, and in each instance have the predicted sign. While the interest rate
spread, the share of problem bank assets, and all three of the NPL ratios have significant effects,
only the 10th percentile measure for the capital ratio measures is significant, although all three
capital ratio measures have the predicted positive sign. However, none of the estimated
coefficients on the liquidity ratio measures is significant, and each of the three has a sign that is
opposite that predicted.
When the size threshold for exporting firms is raised to include all firms with fewer than
100 employees, much the same story emerges. The difference is that the estimated coefficient on
the 10th percentile measure of the liquidity ratio is now significant, although it has a negative
sign rather than the predicted positive sign. However, all of the statistically significant effects
disappear when the firm size threshold is raised to include firms with fewer than 500 employees,
although four remain significant at the 10 percent level. Thus, it appears that the export shares of
the smaller firms, those with fewer than 100 employees, are sensitive to alternative measures of
bank health, with that sensitivity increasing (in absolute value) with the average dependence of
the firm’s industry on external finance.
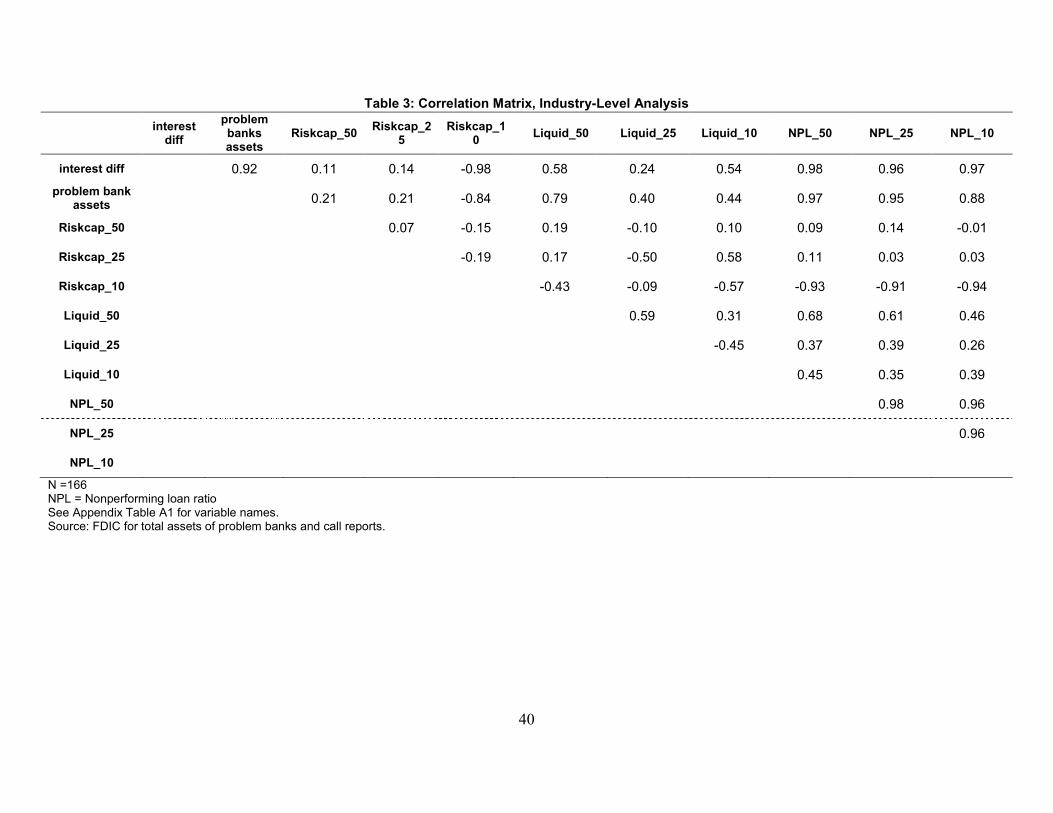
The Table 5 regression specifications differ from those in Table 4 by including the
interest rate spread in addition to a single measure of bank health in each regression. The results
are consistent with those in Table 4 for the interest rate spread. However, few of the bank health
measures have estimated coefficients that are statistically significant, and even then may not
have the predicted sign, as would be expected given the correlations shown in Table 3. Finally,
29
as in Table 5, the significant effects tend to disappear when the firm size threshold is raised to
fewer than 500 employees.
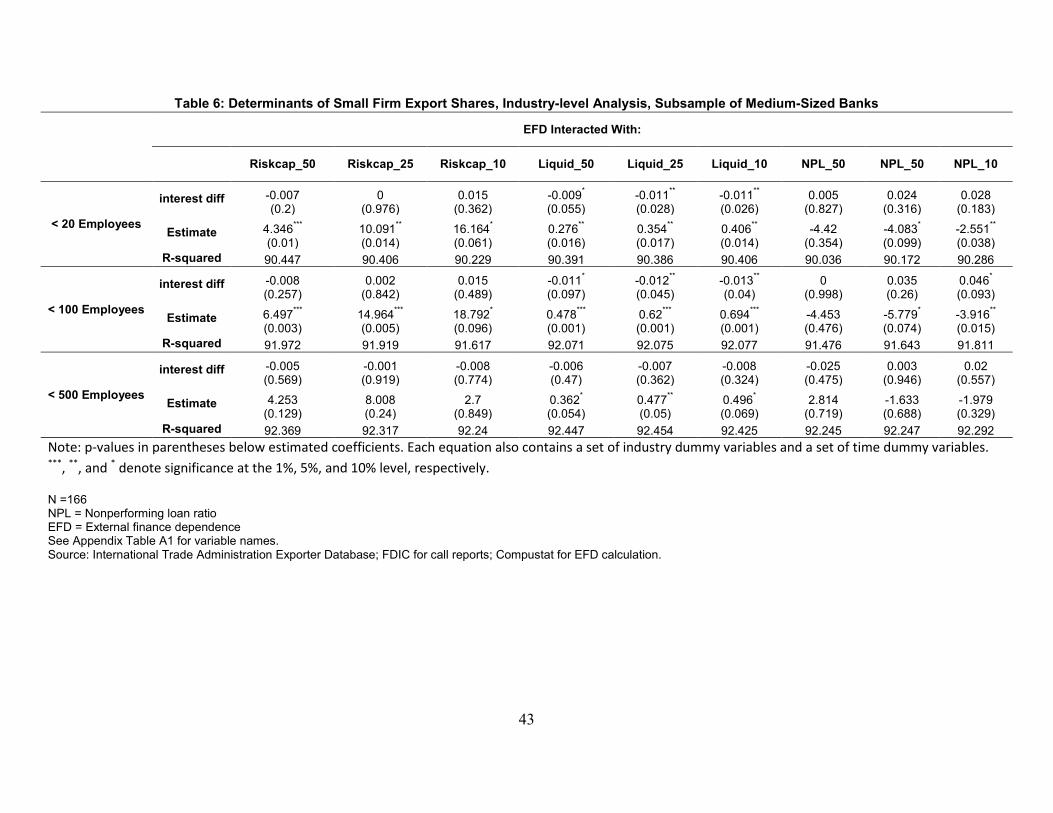
Table 6 specifications repeat those in Table 5. The difference is that the bank health
measures are constructed for a subset of banks, omitting the very largest and smallest banks
which are likely to be less relevant for small exporting firms. For the smallest firms, those with
fewer than 20 employees, the number of estimated coefficients on the bank health measures that
are statistically significant rises from none to six, each with the predicted sign. Two other
estimated coefficients are significant at the 10 percent level, leaving only that for the median
nonperforming loan measure not significant at the 10 percent or better level. On the other hand,
only two of the estimated coefficients on the interest rate spread are now statistically significant,
down from six of the nine corresponding coefficients in Table 5. This suggests that the focus on
medium-sized banks provides a better indicator of the relevant measure of bank health for
exporting firms. Moreover, all nine specifications in Table 6 have a better overall fit than the
corresponding regressions in Table 5.
When the firm size threshold is raised to fewer than 100 employees, a similar story
emerges. Six of the estimated bank health coefficients are statistically significant at the 5 percent
or better level, and again, the bank health measures now dominate the interest rate spread
measure. Finally, using the fewer than 500 employee threshold, none of the interest rate spread
estimated coefficients and only one of the estimated bank health coefficients is statistically
significant at the 5 percent level, consistent with the previous evidence that bank health becomes
less relevant for small firm export shares as firm size increases.
VII. Empirical Results: State-Level Data
30
Table 7 contains the number of SME exporters for each of the 36 states included in the
state-level regression analysis. As might be expected, variation across states is quite large, with
high numbers for populous states such as California, Florida, New York, and Texas, and
relatively low numbers for states such as Mississippi, Arkansas, Kansas, and Nebraska. The table
also shows substantial variation across time in the number of SME exporters for many states.
Table 8 contains the SME shares of the dollar volume of total exports for each of the 36 states.
Substantial variation across states, and across time for a given state, is apparent. Table 9 contains
the summary statistics for the state-level measures of the SME share of the dollar volume of total
exports and the bank health measures. The top panel contains the data for the full sample of
banks, while the next three panels contain the data disaggregated into small, medium, and large
bank size classes.
Table 10 contains the regression results. As with the industry-level analysis, the bank
health measures tend to be highly correlated, both across the dimension of category (capital ratio,
liquidity ratio, and nonperforming loan ratio) and across bank size classes. Thus, each regression
shown in the table includes only a single measure of bank health. The top panel of Table 10
contains the results using aggregate bank health measures not disaggregated by bank size classes.
None of the estimated coefficients are statistically significant. For the capital ratio measures, the
median has the highest level of significance and has the predicted positive sign. All three of the
liquidity ratio measures have the positive predicted sign, with that for the median measure close
to significance at the 10 percent level. For the NPL ratio measures, only that for the 25th
percentile measure has the expected negative coefficient, although none of the three coefficients
are even close to being statistically significant.
31
The next three panels contain the results for bank health measures for small, medium, and
large bank classes. None of the estimated coefficients for small or medium-sized banks are
statistically significant. In contrast, for the large bank class, both the median capital ratio
measure and the median NPL ratio measure are significant with the predicted sign, indicating
that a deterioration in the health of large banks adversely impacts SME exporters more than large
exporters.
What might explain the weak results for the state-level analysis? First, the small firm
aggregate is available only for a firm size of fewer than 500 employees. Recall that in the
industry-level analysis, the statistically significant results were associated with the firm size
classes of fewer than 20 employees and fewer than 100 employees. Thus, finding predominately
statistically insignificant estimated coefficients for the state-level analysis for firms with fewer
than 500 employees is consistent with the industry-level analysis. Moreover, the fact that the
only significant effects emanate from median values, not the 25th or 10th percentile tails of the
distributions, may be related to the larger average size of the SME classification used for the
state-level analysis.
VIII. Concluding Comments
While the recent collapse in international trade makes this study particularly timely, it
also highlights the importance of acquiring a better understanding of the role played by credit
availability in international trade generally, as well as its relative impact on SME exporters. With
an improved understanding of the mechanisms underlying trade finance as applied to SME
exporters relative to large firm exporters, policymakers will have a clearer picture of the
industry-specific and regional impacts of financial crises based on the sensitivity of firms in
32
specific industries and on the composition of banks in particular geographic locations. They also
will gain a better understanding of the role of credit availability shocks in magnifying the effects
of declines in the demand for exports. Given the importance of SMEs in job creation, as well as
the problems emanating from the chronic U.S. trade deficits, how and to what extent SME
exporters are adversely affected by frictions in the credit markets is an important public policy
issue.
This study investigates the role of bank health in the operations of U.S. exporting firms
across two dimensions. First, it looks at industry-level data to improve our understanding of
differences across industries related to the extent to which firms in those industries are more or
less reliant on external finance. Second, the study considers the role of local bank health in the
operations of small exporting firms by using state-level data.
The empirical results are consistent with differential effects on SME exporters relative to
large firm exporters operating through the trade finance channel. In particular, the small firm
share of the dollar volume of total exports is adversely affected by a deterioration in bank health,
using a number of alternative indicators of bank health. Moreover, the adverse impact is more
pronounced for firms in industries that are more reliant on external finance, such as chemicals
and textile mill products. While the effects are prevalent for firms with fewer than 100
employees, once the small firm size threshold is raised to the small firm upper limit of less than
500 employees, the effects relative to large firms tend to dissipate.
Consistent with the industry-level results for SMEs with fewer than 500 employees, the
state-level analysis finds few statistically significant relationships between state-level bank
health and the state’s small firm share of the dollar volume of total exports. One can only
speculate about whether stronger results would have emerged had data been available to
33
investigate state-level small firm export share performance based on smaller firm size classes.
Still, both the median capital ratio and the median NPL ratio for large banks do have significant
effects of the predicted sign on the small firm export share, indicating that local bank health does
matter.
This study finds that small exporting firms are affected more by a deterioration in bank
health than are larger exporting firms. Moreover, it appears that smaller exporting firms, here
firms with fewer than 100 employees, suffer the most. These findings suggest that policies to aid
small businesses when bank credit availability is impaired should place particular emphasis on
smaller SMEs. In fact, given that we have reason to believe that exporting firms are more
sensitive to bank health compared with firms producing for the domestic market, a program
supporting credit to smaller exporting firms may provide the greatest “bang per buck” among
focused small business lending guarantee programs when bank health weakens and the
availability of credit is impaired.
34
References
Amiti, M. and Weinstein, D.E. (2011). Exports and financial shocks, Quarterly Journal of Economics, 126, 1841-1877. Auboin, M. (2009). Restoring trade finance: what the G20 can do, in The Collapse of Global Trade, Murky Protectionism, and the Crisis: Recommendations for the G20, R. Baldwin and S. Evenett, eds., London: Center for Economic Policy Research. Beck, T. (2002). Financial development and international trade: is there a link? Journal of International Economics, 57, 107-131. Beck, T. (2003). Financial dependence and international trade, Review of International Economics, 11, 296-316. Behrens, K., Corcos, G. and Mion, G. (2010). Trade crisis? What trade crisis? CEPR Discussion Paper No. 7956, August. Berger, A.N. and Udell, G.F. (1994). Did risk-based capital allocate bank credit and cause a “credit crunch” in the U.S.?, Journal of Money, Credit and Banking, 26, 585-628. Berman, N. and Martin, P. (2010). The vulnerability of Sub-Saharan Africa to the financial crisis: the case of trade, CEPR Discussion Paper No. 7765. Bricongne, J-C, Fontagné, L., Gaulier, G., Taglioni, D. and Vicard, V. (2010). Exports and sectoral financial dependence: evidence on French firms during the great global crisis, ECB Working Paper Series No. 1227, July. Campello, M. (2002). Internal capital markets in financial conglomerates: Evidence from small bank responses to monetary policy, Journal of Finance, 57(6), 2773-2805. Chor, D. and Manova, K. (2011). Off the cliff and bank? Credit conditions and international trade during the global financial crisis, SSRN abstract No. 1502911, February. Di Mauro, F., Forster, K. and Lima, A. (2010). The global downturn and its impact on Euro area exports and competitiveness, ECB Occasional Paper No. 119, October. Do, Q.T. and Levchenko, A.A. (2007). Comparative advantage, demand for external finance, and financial development, Journal of Financial Economics, 86, 796-834. Feenstra, R.C., Li, Z. and Yu, M. (2011). Exports and credit constraints under incomplete information: theory and evidence from China, NBER Working Paper No. 16940, April. Greenaway, D., Guariglia, A. and Kneller, R. (2007). Financial factors and exporting decisions, Journal of International Economics, 73, 377-95.
35
Hall, B.J. (1993). How has the Basel accord affected bank portfolios?, Journal of the Japanese and International Economies, 7(4), 408-440. Hancock, D. and Wilcox, J.A. (1994). Bank capital and the credit crunch: The roles of risk-weighted and unweighted capital regulation, Journal of the American Real Estate and Urban Economics Association, 22, 59-94. Holod, D. and Peek, J. (2007). Asymmetric information and liquidity constraints: A new test, Journal of Banking and Finance, 31(8), 2425-2451. Iacovone, L. and Zavacka, V. (2009). Banking crises and exports: lessons from the past, World Bank Policy Research Working Paper 5016. Kashyap, A.K. and Stein, J.C. (1995). The impact of monetary policy on bank balance sheets, Carnegie-Rochester Conference Series on Public Policy, 42, 151-195. Kashyap, A.K. and Stein, J.C. (2000). What do a million observations on banks say about the transmission of monetary policy? American Economic Review, 90(3), 407-428 . Kashyap, A.K. and Stein, J.C. (2004). Cyclical implications of the Basel II capital standard, Federal Reserve Bank of Chicago Economic Perspectives, First Quarter, 18-31. Kishan, R. and Opiela, T. (2000). Bank size, bank capital, and the bank lending channel, Journal of Money, Credit and Banking, 32, 121-141. Kletzer, K. and Bardhan, P. (1987). Credit markets and patterns of international trade, Journal of Development Economics, 27(1-2), 57-70. Matsuyama, K. (2005). Credit market imperfections and patterns of international trade and capital flows, Journal of the European Economic Association, 3, 714-23. Paravisini, D., Rappoport, V., Schnabl, P. and Wolfenzon, D. (2011). Dissecting the effect of credit supply on trade: evidence from matched credit-export data, NBER Working Paper No. 16975, April. Peek, J. (2011). Bank liquidity pressures and the availability of bank credit to small firms: Was the 2007-2009 credit crisis different? Office of Advocacy, U.S. Small Business Administration, September. Peek, J. and Rosengren, E.S. (1995a). The capital crunch: Neither a borrower nor a leader be, Journal of Money, Credit and Banking, 27(3), 625-38. Peek, J. and Rosengren, E.S. (1995b). Bank regulation and the credit crunch, Journal of Banking and Finance, 19(3-4), 679-692.
Rajan, R. and Zingales, L. (1998). Financial dependence and growth, American Economic Review, 88, 559-86. Udell, G. (1997). The Consolidation of the Banking Industry and Small Business Lending, in Bank Mergers and Acquisitions, edited by Amihud and Miller, Stern Kluwer Publishers, 221-235.
37
Tables
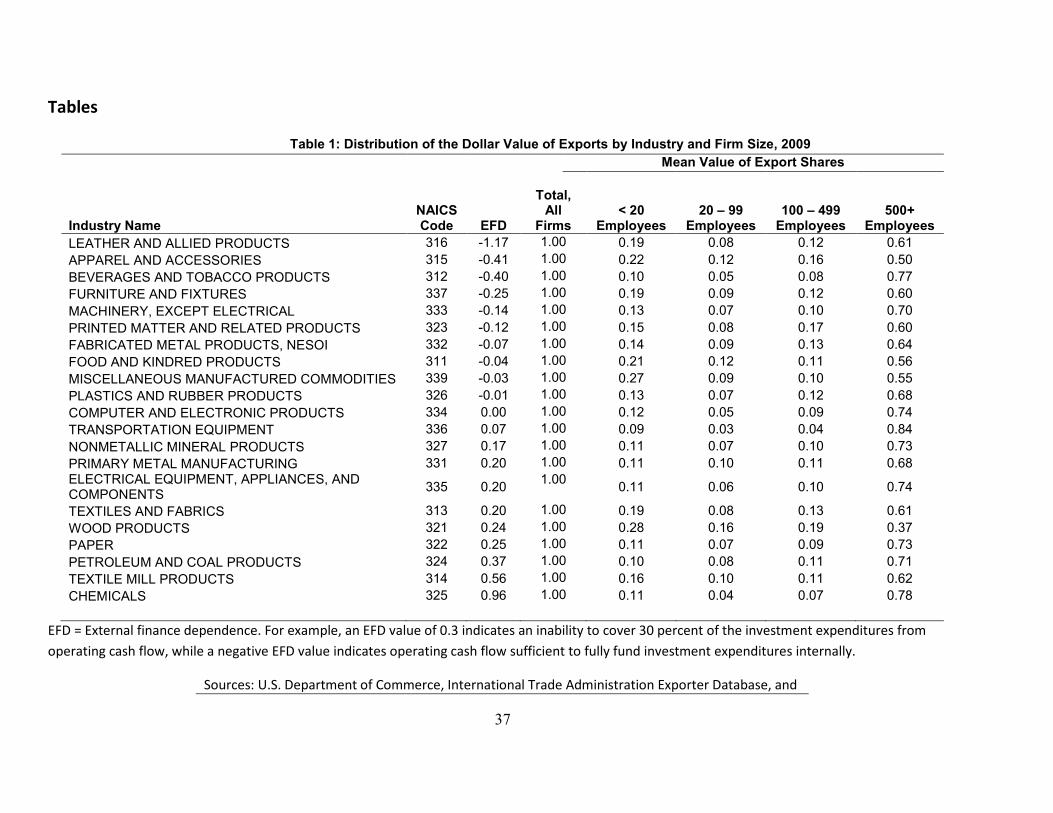
Table 1: Distribution of the Dollar Value of Exports by Industry and Firm Size, 2009
LEATHER AND ALLIED PRODUCTS APPAREL AND ACCESSORIES BEVERAGES AND TOBACCO PRODUCTS FURNITURE AND FIXTURES MACHINERY, EXCEPT ELECTRICAL PRINTED MATTER AND RELATED PRODUCTS FABRICATED METAL PRODUCTS, NESOI FOOD AND KINDRED PRODUCTS MISCELLANEOUS MANUFACTURED COMMODITIES PLASTICS AND RUBBER PRODUCTS COMPUTER AND ELECTRONIC PRODUCTS TRANSPORTATION EQUIPMENT NONMETALLIC MINERAL PRODUCTS PRIMARY METAL MANUFACTURING ELECTRICAL EQUIPMENT, APPLIANCES, AND COMPONENTS TEXTILES AND FABRICS WOOD PRODUCTS PAPER PETROLEUM AND COAL PRODUCTS TEXTILE MILL PRODUCTS CHEMICALS
EFD = External finance dependence. For example, an EFD value of 0.3 indicates an inability to cover 30 percent of the investment expenditures from operating cash flow, while a negative EFD value indicates operating cash flow sufficient to fully fund investment expenditures internally.
Sources: U.S. Department of Commerce, International Trade Administration Exporter Database, and
38
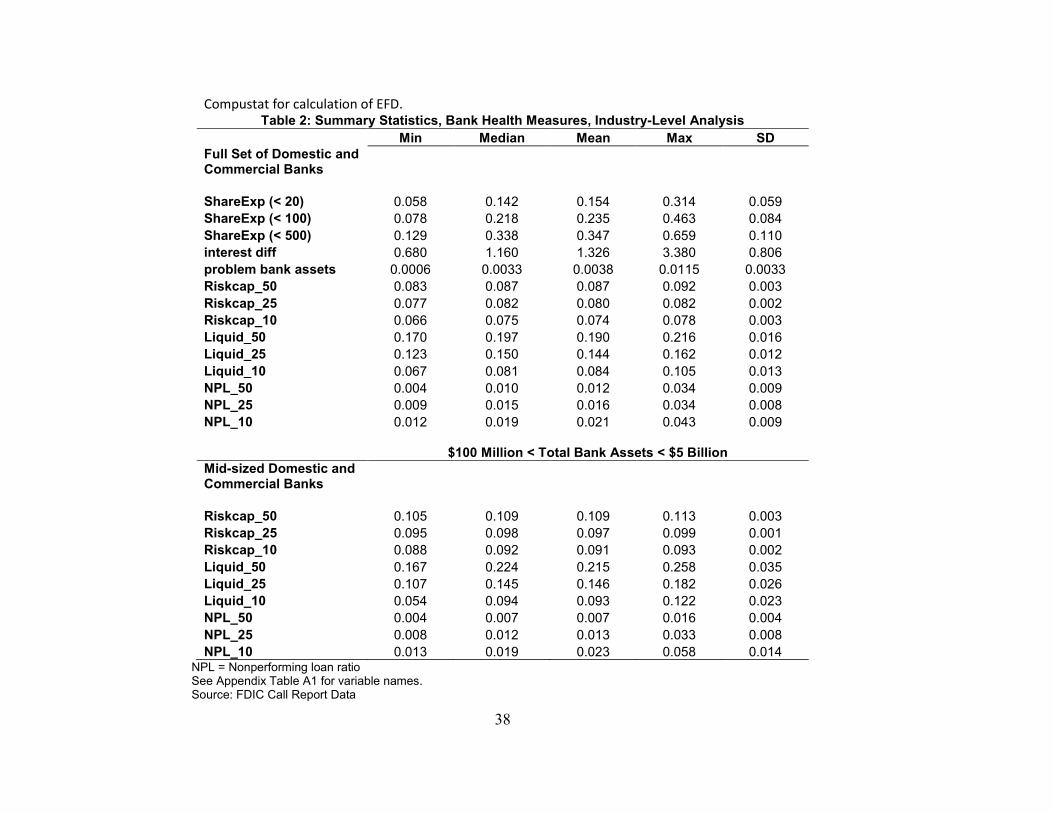
Compustat for calculation of EFD. Table 2: Summary Statistics, Bank Health Measures, Industry-Level Analysis
Full Set of Domestic and Commercial Banks ShareExp (< 20) ShareExp (< 100) ShareExp (< 500) interest diff problem bank assets Riskcap_50 Riskcap_25 Riskcap_10 Liquid_50 Liquid_25 Liquid_10 NPL_50 NPL_25 NPL_10
Note: p-values in parentheses below estimated coefficients. Each equation also contains a set of industry dummy variables and a set of time dummy variables. *** ** *, , and denote significance at the 1%, 5%, and 10% level, respectively.
N =166 NPL = Nonperforming loan ratio EFD = External finance dependence See Appendix Table A1 for variable names. Source: International Trade Administration Exporter Database; FDIC for total assets of problem banks and call reports; St. Louis FRB for bond yields; Compustat for EFD calculation.
42
Table 5: Expanded Determinants of Small Firm Export Shares, Industry-level Analysis
92.24 Note: p-values in parentheses below estimated coefficients. Each equation also contains a set of industry dummy variables and a set of time dummy *** ** *, , and denote significance at the 1%, 5%, and 10% level, respectively.
N =166 EFD = External finance dependence See Appendix Table A1 for variable names. Source: International Trade Administration Exporter Database; FDIC for total assets of problem banks and call reports; Compustat for EFD calculation.
variables.
43
Table 6: Determinants of Small Firm Export Shares, Industry-level Analysis, Subsample of Medium-Sized Banks
Note: p-values in parentheses below estimated coefficients. Each equation also contains a set of industry dummy *** ** *, , and denote significance at the 1%, 5%, and 10% level, respectively.
N =166 NPL = Nonperforming loan ratio EFD = External finance dependence See Appendix Table A1 for variable names. Source: International Trade Administration Exporter Database; FDIC for call reports; Compustat for EFD calculation.
variables and a set of time dummy variables.
44
Table 7: Number of SME Exporters by State
2002
2003 2004 2005 2006 2007 2008 2009
AL 2,226
AR 1,165
AZ 4,158
CA 52,078
CO 3,449
CT 4,403
FL 28,706
GA 7,776
IA 1,777
IL 15,143
IN 4,842
KS 1,753
KY 2,374
LA 2,434
MA 8,945
MD 3,614
MI 10,573
MN 5,223
MO 3,536
MS 1,313
NC 6,624
NE 1,154
NJ 13,943
NV 1,398
NY 27,973
OH 10,887
OK 1,862
OR 4,187
PA 10,802
SC 3,444
TN 3,867
TX 24,693
UT 1,769
VA 4,641
WA 8,266
WI 5,377
Source: International
2,257 2,369 1,894 1,896
1,303 1,434 1,032 1,048
4,235 4,784 3,975 4,147
53,700 55,863 49,148 50,029
3,547 3,850 3,374 3,618
4,469 4,517 4,084 4,111
29,033 32,199 27,048 28,775
8,158 8,544 6,451 6,765
1,895 2,018 1,740 1,813
15,659 15,671 12,359 12,842
5,110 5,215 4,452 4,616
1,803 1,849 1,598 1,744
2,424 2,455 2,091 2,192
2,551 2,607 1,936 1,998
9,013 8,956 7,304 7,422
3,779 3,970 3,066 3,172
10,827 10,672 8,993 9,265
5,460 5,476 4,777 5,009
3,755 3,909 3,238 3,395
1,220 1,168 787 799
6,905 7,015 5,829 6,051
1,166 1,189 842 889
14,267 14,921 12,940 12,988
1,494 1,574 1,795 1,839
28,590 29,755 23,248 23,688
11,309 11,455 9,747 10,024
1,963 1,994 1,825 1,876
4,219 4,131 3,570 3,703
11,031 11,073 9,668 10,028
3,608 3,679 2,531 2,653
4,117 4,188 3,226 3,446
23,216 25,849 19,148 20,121
1,809 1,915 1,786 1,906
4,705 4,773 3,733 3,834
8,451 8,213 6,400 6,664
5,620 5,612 4,883 5,205
Trade Administration Exporter Database
2,129
1,148
4,814
53,323
3,909
4,460
31,879
7,750
1,987
13,892
5,129
1,894
2,392
2,166
7,933
3,455
10,057
5,574
3,844
931
6,811
971
14,013
2,006
25,657
10,938
2,070
4,087
10,900
2,933
3,872
21,797
2,117
4,241
7,196
5,637
2,297
1,218
5,173
57,461
4,200
4,684
36,533
8,812
2,141
15,170
5,619
2,049
2,595
2,338
8,236
3,799
10,651
6,027
4,000
981
7,284
1,084
15,021
2,133
27,265
11,678
2,186
4,384
11,720
3,172
4,135
24,294
2,263
4,650
7,627
5,975
2,214
1,164
4,772
55,530
3,974
4,383
36,109
8,365
2,008
14,239
5,400
1,957
2,437
2,209
7,937
3,661
10,169
5,635
3,753
930
7,067
1,033
14,406
2,034
25,422
11,102
2,044
4,198
11,013
3,056
3,906
23,792
2,200
4,414
7,193
5,677
45
Table 8: SME Share of Dollar Volume of Total Exports by State 2002
2003 2004 2005 2006 2007 2008 2009
AL AR AZ CA CO CT FL GA IA IL IN KS KY LA MA MD MI MN MO MS NC NE NJ NV NY OH OK OR PA SC TN TX UT VA WA WI
Note: p-values in parentheses below estimated coefficients. Each equation also contains a set of state dummy variables and a set of time dummy variables. ***, **, and * denote significance at the 1%, 5%, and 10% level, respectively.
N =288 NPL = Nonperforming loan ratio EFD = External finance dependence See Appendix Table A2 for variable names
Source: International Trade Administration Exporter Database; FDIC call reports.
Fraction of dollar volume of total exports attributed to exporters employees Fraction of dollar volume of total exports attributed to exporters employees Fraction of dollar volume of total exports attributed to exporters employees
with less than
with less than
with less than
20
100
500
ITAED
ITAED
ITAED
Independent Variables
interest diff Interest Rate Difference between Aaa and Baa Moody's Seasoned Corporate Bond Yields Board of Governors of the Federal Reserve
problem bank assets
Fraction of total bank assets that belong to problem banks System FDIC
Riskcap_50 Value of risk-based capital ratio corresponding to the median value of total bank assets FDIC Call Reports
Riskcap_25 the 25thValue of risk-based capital ratio corresponding to percentile of total bank assets FDIC Call Reports
Riskcap_10 the 10thValue of risk-based capital ratio corresponding to percentile of total bank assets FDIC Call Reports
Liquid_50 Value of liquidity ratio corresponding to the median value of total bank assets FDIC Call Reports
Liquid_25 Value of liquidity ratio corresponding to the 25th percentile of total bank assets FDIC Call Reports
Liquid_10 Value of liquidity ratio corresponding to the 10th percentile of total bank assets FDIC Call Reports
NPL_50 Value of nonperforming loan ratio corresponding to the median value of total bank assets FDIC Call Reports
NPL_25 the 25thValue of nonperforming loan ratio corresponding to percentile of total bank assets FDIC Call Reports
NPL_10 the 10thValue of nonperforming loan ratio corresponding to percentile of total bank assets FDIC Call Reports