The impact of financial reporting quality on debt contracting: Evidence from internal control weakness reports Anna Costello The University of Chicago Booth School of Business 5807 South Woodlawn Avenue Chicago, IL 60637, USA [email protected]Regina Wittenberg-Moerman The University of Chicago Booth School of Business 5807 South Woodlawn Avenue Chicago, IL 60637, USA rwitten1@ chicagobooth.edu Current version: September 4, 2010 Abstract We examine the effect of financial reporting quality on the trade-off between monitoring mechanisms used by lenders. We rely on Sarbanes-Oxley internal control reports to measure financial reporting quality. We find that when a firm experiences a material internal control weakness, lenders decrease their use of financial covenants and financial-ratio-based performance pricing provisions and substitute them with alternatives such as price and security protections and credit-rating-based performance pricing provisions. We also find that changes in debt contract design following internal control weaknesses are substantially different from those following restatements, where lenders impose tighter monitoring on managers’ actions, but do not decrease their use of financial statement numbers. We are grateful to the Editor (Douglas Skinner), an anonymous reviewer, Ray Ball, Philip Berger, Jeffrey Burks, Craig Chapman, Gus De Franco, Peter Easton, Bob Holthausen, Christian Leuz, Ningzhong Li, Abbie Smith, Jayanthi Sunder, Florin Vasvari, Daniel Wilhelm, Wayne Guay (discussant) and participants at Utah Winter Accounting Conference, and seminar participants at McGill University, Northwestern University, the University of Chicago, the University of Notre Dame and the AAA 2010 Annual Meeting for valuable comments and helpful discussions.
Transcript
The impact of financial reporting quality on debt contracting: Evidence from internal
control weakness reports
Anna Costello The University of Chicago Booth School of Business
Regina Wittenberg-Moerman The University of Chicago Booth School of Business
5807 South Woodlawn Avenue Chicago, IL 60637, USA
rwitten1@ chicagobooth.edu
Current version: September 4, 2010
Abstract
We examine the effect of financial reporting quality on the trade-off between monitoring mechanisms used by lenders. We rely on Sarbanes-Oxley internal control reports to measure financial reporting quality. We find that when a firm experiences a material internal control weakness, lenders decrease their use of financial covenants and financial-ratio-based performance pricing provisions and substitute them with alternatives such as price and security protections and credit-rating-based performance pricing provisions. We also find that changes in debt contract design following internal control weaknesses are substantially different from those following restatements, where lenders impose tighter monitoring on managers’ actions, but do not decrease their use of financial statement numbers. We are grateful to the Editor (Douglas Skinner), an anonymous reviewer, Ray Ball, Philip Berger, Jeffrey Burks, Craig Chapman, Gus De Franco, Peter Easton, Bob Holthausen, Christian Leuz, Ningzhong Li, Abbie Smith, Jayanthi Sunder, Florin Vasvari, Daniel Wilhelm, Wayne Guay (discussant) and participants at Utah Winter Accounting Conference, and seminar participants at McGill University, Northwestern University, the University of Chicago, the University of Notre Dame and the AAA 2010 Annual Meeting for valuable comments and helpful discussions.
1
1. Introduction
The role of financial reporting quality in debt contracting is one of the fundamental
questions in accounting research. Watts and Zimmerman [1986], Watts [1993], Ball [2001] and
Holthausen and Watts [2001] suggest that financial statement information is particularly
important for contracting purposes. Leftwich [1983], Dichev and Skinner [2002], Asquith et al.
[2005] and Li [2010] show that in setting debt covenants and performance pricing provisions,
lenders rely explicitly on financial statement numbers. While a number of recent studies suggest
that different attributes of financial reporting quality affect debt contractual terms, there is little
empirical evidence on the effect of financial reporting quality on the choice of monitoring
mechanisms used by lenders (Armstrong et al. [2010]).1 In particular, prior studies suggest that
lenders impose overall more stringent terms when financial reporting quality is low, but they do
not address the trade-offs that lenders can make between different monitoring mechanisms.
However, Melnik and Plaut [1986] suggest that a loan contract is a package of n-contractual
terms, and lenders offer the borrower a trade-off between different terms. Gigler et al. [2009]
also show that, to evaluate the effect of reporting quality on debt contracting, we need to
explicitly consider the trade-offs between contractual terms. In this paper, we examine whether
lenders decrease their use of contractual terms based on accounting numbers and substitute them
with non-accounting-based terms when financial reporting is of low quality.
We address this question by examining how lenders change the design of debt contracts
following the disclosure of a material internal control weakness (ICW, hereafter). Section 302 of
the Sarbanes Oxley Act (SOX) requires managers of all public firms filing under Sections 13(a)
or 15(d) of the Securities Exchange Act to test and report on the quality of the internal controls.
1See Francis et al. [2005], Zhang [2007], Bharath et al. [2008] and Graham et al. [2008]. Most pertinent to our study is Ball et al. [2008], who examine how financial reporting timeliness affects the choice of performance pricing provisions.
2
A material ICW is defined as “[a] deficiency, or a combination of deficiencies, in internal
controls over financial reporting such that there is a reasonable possibility that a material
misstatement of the registrant’s annual or interim financial statements will not be prevented or
detected on a timely basis by the company’s internal controls” (www.sec.gov). Thus, internal
control reports provide a rigorous assessment of the reliability of a firm’s financial reporting,
which we expect to have a first-order effect on the design of debt contracts.2
For firms that experience an ICW, we examine whether debt contractual terms differ for
new syndicated loans issued in three distinct periods: before an ICW is reported (prior period,
hereafter), from the day an ICW is reported through the day it is corrected (uncorrected period,
hereafter) and after an ICW is corrected (corrected period, hereafter). Because ICWs reveal to
lenders that financial covenants are less efficient in conveying changes in a borrower’s
creditworthiness, we predict that lenders decrease their use of financial covenants as an ex-post
monitoring tool when a borrower’s financial statements are subject to an ICW. We find that the
number of financial covenants imposed by lenders during the uncorrected period decreases by
0.36 relative to the prior period, which represents a 21.9 percent decrease in the number of
covenants. Further, we find that lenders continue to distrust financial covenants as an ex-post
monitoring tool even after the ICW has been corrected, suggesting that the ICW imposes a long-
term reputation effect.
We predict that an ICW will increase loan pricing via two channels. First, an ICW
decreases the lenders’ reliance on financial covenants. Agency theory suggests that there is a
trade-off between the number of covenants and the interest rate (Jensen and Meckling [1979],
Myers [1977], Smith and Warner [1979]). Therefore, a decrease in the number of financial
2Supporting the importance, to lenders, of an assessment of the reliability of a borrower’s financial reporting, loan contracts often include an internal control provision as an affirmative covenant. This covenant requires a firm to report the occurrence of an internal control event; the failure to inform the lenders can trigger a loan’s default.
3
covenants should be compensated by an increase in the interest rate. Second, we expect an ICW
to affect the interest rate through an increase in uncertainty. Financial statements are an
important mechanism for communicating information to lenders and for facilitating loan
monitoring. Therefore, a reasonable possibility of a material misstatement increases uncertainty
regarding the firm’s creditworthiness and consequently increases the agency costs of debt, which
should be priced by lenders (Lambert et al. [2007]). Because of managers’ information
advantage relative to lenders, we also expect this higher uncertainty to translate into higher
information asymmetry between a firm and its lenders, which in turn should increase the interest
rate (Verrecchia [2001], Easley et al. [2002]). Consistent with our prediction, the interest rate on
loans issued during the uncorrected period increases by 29 basis points relative to the prior
period, which represents an 11.4 percent increase in the interest rate.
We also find that following an ICW report, lenders are more likely to require a borrower to
provide collateral. The probability that a loan is collateralized increases by three percent during
the uncorrected period and by eight percent during the corrected period, relative to the prior
period. This finding suggests that lenders require collateral to compensate for the decrease in the
number of financial covenants. Further, we test the effect of an ICW on loan maturity and the
number of general covenants. We find no evidence that these monitoring mechanisms substitute
for the decrease in the number of financial covenants.3
Further, we predict that lenders move away from financial-ratio-based performance pricing
provisions and toward credit-rating-based provisions when a borrower’s financial statements are
subject to an ICW. Because credit ratings frequently lag recent changes in a firm’s credit quality
3 In related study, Kim et al. [2009] compare the loans of ICW firms to those of non-ICW firms and find that the loans related to ICW firms have a higher interest rate and a higher probability of being secured, but contrary to our findings, they have a higher number of financial and general covenants. Although Kim et al. [2009] attribute these differences in the loan terms to an ICW disclosure, we show that their results are due to the higher riskiness and information opacity of ICW firms relative to non-ICW firms (see Section 4.5).
4
(Hite and Warga [1997], De Franco et al. [2009]), lenders view financial ratios as more timely
indicators of changes in a firm’s creditworthiness. However, when an ICW indicates that
reporting quality is low, lenders are likely to trade off more timely financial ratios for more
reliable credit ratings. We find that the probability that the provision is based on a financial ratio
decreases by 20 percent during the uncorrected period, relative to the prior period.
Finally, to shed more light on the impact of financial reporting quality on loan terms, we
contrast lenders’ responses to ICWs with their responses to financial restatements. We find that,
following a restatement, lenders increase the interest rate, collateral protection and the number of
general covenants and decrease loan maturity but do not decrease their reliance on financial
covenants or financial-ratio-based performance pricing provisions. This evidence is consistent
with Graham et al. [2008] who examine the effect of restatements on loan terms in the pre-SOX
period. We also show that when a restatement is preceded by an ICW, lenders increase the
number of general covenants and decrease maturity, but do not change other contractual terms.
This suggests that ICWs provide lenders with an early signal for a decrease in financial reporting
quality, prompting them to adjust the design of debt contracts prior to the event of a restatement.
We conjecture that when managers restate financial statements, lenders both increase price
and security protections and monitor managers more tightly by imposing additional general
covenants (restricting managers’ operating, investment and financial activity) and by decreasing
loan maturity (forcing managers to refinance more frequently). We suggest that tighter
monitoring is explained, at least partially, by restatements being often associated with managers’
culpability in misreporting, which results in a decrease in lenders’ trust in management. In
contrast, ICWs are attributed primarily to a firm’s complexity and insufficient resources and
reflect a potential for an accounting misstatement. As a result, lenders do not restrict managers’
5
actions, but instead decrease their reliance on contractual terms based on accounting numbers
and substitute them with non-accounting-based terms.4
We view our paper as making four main contributions. First, we contribute to the literature
on the role of financial reporting quality in debt contracting. By establishing that an ICW causes
lenders to move away from financial covenants and toward security and price protection and to
substitute financial-ratio-based performance pricing provisions with provisions based on credit
ratings, we explicate the effect of reporting quality on the choice of monitoring mechanisms used
by lenders. To the best of our knowledge, we are the first to show that low financial reporting
quality does not lead to overall tighter debt contractual terms but rather triggers a trade-off
between debt contracting mechanisms based on accounting numbers and those that are not.
Further, we establish that lenders decrease their reliance on financial covenants when financial
reporting quality is low.
Second, we extend and complement prior research by documenting a significant relation
between the reliability of financial statements and debt contractual terms. Francis et al. [2005]
and Bharath et al. [2008] rely on accruals quality and Zhang [2007] and Ball et al. [2008] on
financial reporting timeliness to establish the link between reporting quality and debt contracting.
Accruals models suffer from measurement error and often incorrectly characterize a firm as
having poor reporting quality (Dechow et al. [1995], Hribar and Collins [2002], Hribar and
Nichols [2007], Ball and Shivakumar [2008]). In addition, abnormal accruals and reporting
timeliness are strongly associated with a firm’s business model and production function, making
it difficult to attribute the cross-sectional differences in these measures to reporting quality per
se. Accruals quality and reporting timeliness also capture only specific aspects of reporting
4 See Section 4.6 and Burns and Kedia [2006], Efendi et al. [2007], Cheng and Farber [2008], DeFond and Jiambalvo [1991], Richardson et al. [2003], Ge and McVay [2005], Ogneva et al. [2006], Ashbaugh-Skaife et al. [2006] and Doyle et al. [2007a] for a discussion of the main factors that explain restatements and ICWs.
6
quality. In contrast, internal control reports provide an unambiguous and comprehensive measure
of the reliability of a firm’s financial reporting. By demonstrating that ICWs significantly impact
loan terms, our study provides strong support for the importance of reporting quality for debt
contracting.
Third, we contribute to the literature that examines whether financial reporting quality
affects the cost of capital. Many studies examine this question in the equity market, but there is
no consensus on the relation between the quality of financial reporting and the cost of equity
capital (Core et al. [2007]).5 Specific to ICWs, Beneish et al. [2008], Hammersley et al. [2008]
and Ashbaugh-Skaife et al. [2009] find that firms with ICWs have a higher cost of equity,
although Ogneva et al. [2007] find no effect after controlling for firm characteristics. We show
that an ICW significantly increases loan pricing, providing strong support for the effect of
financial reporting quality on the cost of debt capital.
Finally, we contribute to the debate on the costs versus benefits of SOX. Critics of SOX
argue that it is a regulatory imposition with very low economic benefits. Supporters of SOX
emphasize that it provides important information to capital markets and improves transparency.
We add to this debate by showing that ICWs provide useful information to lenders, triggering
substantial changes in debt contract design and allowing for more efficient debt contracting.
The following section presents the research design. The third section describes the data.
The fourth section discusses our empirical findings. The fifth section concludes.
5Botosan [1997], Francis et al. [2004] and [2005], Ecker et al. [2006] and Botosan and Plumlee [2007] show that lower quality financial information results in a higher cost of equity capital, while Ball and Brown [1969], Core et al. [2007] and Hughs et al. [2007] argue that the effect of reporting quality is diversifiable. While Lambert et al. [2007] support the effect of accounting information on the equity cost of capital, they argue that this effect is fully captured by an appropriately specified forward-looking beta.
7
2. Research Design
2.1. Within-sample analysis
We focus on temporal changes in debt contractual terms for firms reporting an ICW,
because ICW firms are fundamentally different from non-ICW firms. Ge and McVay [2005] and
Doyle et al. [2007a] find that smaller, younger, financially weaker, more complex, high growth
and restructured firms are more likely to report ICWs. To the extent that we cannot perfectly
control for firm characteristics associated with ICWs, analyzing changes in the terms of new
loans within the sample of ICW firms results in a stronger design than comparing the loans of
ICW firms to those of non-ICW firms.
Our analysis consists of three distinct time periods. The prior period spans the three years
before the ICW was first reported. The uncorrected period starts at the first ICW report and ends
on the date of the first clean internal control report. For our sample, the average period of an
uncorrected weakness is 1.26 years. The corrected period spans the three years after the ICW is
corrected. The purpose of separating the sample into these periods is to pinpoint changes in
accounting quality. Lenders are likely to view firms as having low reporting quality during the
uncorrected period, while reporting quality could be restored during the corrected period.
However, if an ICW imposes a long-term reputation effect, it is possible that lenders continue to
view a firm as having low reporting quality even after the weakness is corrected. Our sample
includes all loans issued to ICW firms in the periods of interest: 1,456 loans issued in the prior
period, 594 loans issued in the uncorrected period and 778 loans issued in the corrected period.
We control for firm characteristics at the time of loan issuance and for a variety of loan features.
We include year fixed effects in each regression to control for time varying effects on loan terms,
and we estimate t-statistics based on standard errors clustered at the firm level.
8
2.2. Debt contractual terms
To examine the impact of ICWs on loan terms, we estimate the following model:
∑ , (1)
where Uncorrected is an indicator variable equal to one if the loan is issued during the
uncorrected period, zero otherwise, and Corrected is an indicator variable equal to one if the loan
is issued in the corrected period, zero otherwise. Our coefficients of interest are β1 and β2.
First, we examine how ICWs affect financial covenants. We expect that during the period
of decreased accounting quality, lenders will be less likely to rely on financial covenants to
monitor the borrower. This should be reflected by a negative coefficient on the Uncorrected
variable. If lenders continue to distrust financial covenants as an monitoring tool even after the
ICW is corrected, we also expect a negative coefficient on the Corrected variable.
The control variables include loan and firm characteristics that are likely to affect financial
covenant intensity. Because small, less profitable and highly leveraged firms are characterized by
high agency costs of debt, the number of covenants is expected to be negatively related to size
and profitability and positively related to leverage. We predict that institutional loans have a
higher number of covenants, because, relative to bank term loans, these loans are more risky,
have a longer maturity and have a back-end-loaded repayment schedule. We also control for the
existence of performance pricing provisions because Asquith et al. [2005] suggest that these
provisions are common when the potential for adverse selection and moral hazard is higher.
Longer maturity loans typically have a higher default risk and higher ex-post incentive conflicts
(Flannery [1986], Demiroglu and James [2010]). According to the agency theory of covenants
(Jensen and Meckling [1979], Myers [1977], Smith and Warner [1979]), we predict a negative
9
relation between the interest rate and the number of covenants. Finally, we control for credit
ratings, loan size, collateral, the number of syndicate lenders and whether the loan is a revolver.
Second, we investigate the impact of an ICW on the interest rate. We expect it to increase
following an ICW if lenders view a borrower’s accounting quality as inferior and/or if they
compensate for the decrease in financial covenants with an increase in loan price. We control for
loan size because larger loans are priced at lower interest rates (Booth [1992], Beatty et al.
[2002]). We include firm size because small firms have greater information asymmetries and a
higher probability of distress (Bharath et al. [2007]). We also control for revolvers; prior research
finds that revolvers are priced at lower interest rates than term loans (Harjoto et al. [2004], Zhang
[2008]). Because of the higher agency costs of debt associated with institutional loans, we expect
these loans to be priced at a higher interest rate. In addition, we control for the number of
syndicate participants; a syndicate is structured with fewer lenders when a firm is more
informationally opaque and has a higher probability of default (Lee and Mullineaux [2004], Sufi
[2007]). Finally, we control for credit quality and loan maturity.
Based on our prediction that a reasonable probability of a material misstatement leads to a
decrease in the number of financial covenants, we next test whether loan securitization
substitutes for financial covenants imposed by lenders. If lenders substitute less efficient
financial covenants with loan collateral, we expect a positive coefficient on the uncorrected and
corrected indicator variables. We generally follow Bharath et al. [2009] when choosing control
variables in the collateral model.
We also test whether general covenants substitute for the decrease in the number of
financial covenants. Following Bradley and Roberts [2004], we include sweeps and dividend
10
restrictions in the general covenant index.6 Sweeps are prepayment covenants that mandate the
early retirement of the loan conditional on a particular firm’s action and include restrictions on
debt issuance, equity issuance, asset sales and insurance proceeds. They are stated as percentages
which correspond to the fraction of the loan that must be retired in such an event. For example, a
contract imposing a 50 percent debt issuance sweep will force the borrower to prepay 50 percent
of the principal value of the loan if a borrower issues more than an agreed-upon amount of debt.
If lenders substitute general covenants for financial covenants, we expect coefficients on the
Uncorrected and Corrected variables in the general covenant regression to be positive.
To compensate for the decrease in the monitoring efficiency caused by a reduction in the
number of financial covenants, lenders can also reduce loan maturity. Shorter maturity induces
more frequent refinancing, which allows lenders to periodically evaluate a firm’s
creditworthiness and more frequently renegotiate the loan terms. In estimating loan maturity, we
control for firm and loan characteristics suggested by prior research to affect maturity (see
Barclay and Smith [1995], Stohs and Mauer [1996], Scherr and Hulbert [2001] and Ortiz-Molina
and Penas [2006]). Because of a nonmonotonic relation between a borrower’s credit quality and
debt maturity (Diamond [1991]), we include both the Credit Rating and Credit Rating Square
variables in the model.7
6 While we classify dividend restrictions as general covenants, in some loan contracts they may be linked to financial statements. More specifically, dividend payments may be restricted by a specified amount per fiscal year or by a proportion of a borrower’s cash or earnings. Dividend covenants may also condition payments on a firm’s creditworthiness; creditworthiness is measured by credit ratings or by financial ratios. In addition, dividend covenants may not impose restrictions on periodic dividend payments, but may instead limit other distributions to equity holders, such as stock repurchases over a specified number of shares. Because DealScan does not reflect the complexity of dividend covenants and reports only a binary variable indicating the presence of such a covenant, we cannot determine whether or not a dividend covenant in the loan agreement is linked to financial statement numbers. Consequently, we classify dividend restrictions as general covenants. As a robustness test, we exclude dividend restrictions from the general covenant index and re-estimate the general covenant model. This test produces similar results and inferences to the analysis tabulated in Table 5. 7 A decrease in financial reporting quality can also decrease lenders’ reliance on borrowing base restrictions (so-called asset-based lending). Borrowing base restrictions are typically found in revolvers to speculative-grade borrowers (LSTA [2007], Standard & Poor’s [2007]). These restrictions define a maximum borrowing limit tied to a
11
Last, we test the choice of the performance pricing provision following ICWs. We expect
that a decrease in the reliability of a firm’s financial statements will decrease the probability that
lenders base the performance pricing provision on an accounting ratio. In choosing our control
variables we generally follow Ball et al. [2008]. We restrict the estimation of the performance
pricing model to the loans of borrowers with available credit ratings and to the borrowers whose
loan contracts include performance pricing provisions both before and after the ICW report.
3. Data
3.1. Data sources and sample selection
We obtain data on ICW reports filed under Sarbanes-Oxley Section 302 from Audit
Analytics. Section 302 refers to the ‘Corporate Responsibility for Financial Reports’ and requires
that chief executive officers and chief financial officers evaluate the design and effectiveness of
internal controls and report their overall conclusions on a quarterly basis. Any company filing
periodic reports under Sections 13(a) or 15(d) of the Exchange Act, without exception for firm
size, must comply with the rule.
Our initial sample consists of 2,231 firms reporting material weaknesses over the
September 2002 through July 2008 period (Table 1). We match our ICW sample to public firms
in the DealScan database and retain all loans issued in the prior, uncorrected or corrected
periods. DealScan is provided by Loan Pricing Corporation (LPC) and contains a wide range of
loan characteristics, such as interest rate, amount and covenants. Matching Audit Analytics to
DealScan leads to a sample of 3,666 loans. Further, we eliminate loans (facilities8) missing the
formula primarily based on a borrower’s inventory and receivables. Because only 13% of our sample loans are subject to a borrowing base restriction, we do not analyze these restrictions in this study. 8 In the syndicated loan market, a loan is referred to as a ‘facility.’ Usually, a number of facilities with different maturities, interest rate spreads and repayment schedules are structured and syndicated as one transaction (deal) with a borrower. The analysis in this paper is performed at the individual facility level.
12
loan or firm characteristics required for the empirical analysis. To ensure that our results are not
due to changes in the sample’s composition, we require the firm to have at least one loan issued
in the prior period and at least one loan issued in either the uncorrected or corrected periods. Our
final sample includes 2,828 facilities issued to 788 borrowers.9
3.2. Descriptive Statistics
Table 2, Panel A reports descriptive statistics. All variables are defined in Appendix A. On
average, the loans are priced at 252 basis points above LIBOR. This is high relative to the mean
interest rate of 198 basis points for all syndicated loans of public firms issued during our sample
period; the evidence implies that borrowers subject to ICWs are relatively risky, consistent with
Doyle et al. [2007a]. The loans are restricted by an average of 1.64 financial covenants and 4.35
general covenants. Seventy-six percent of sample loans are subject to a performance pricing
provision; across these loans, 65 percent have performance pricing provisions based on financial
ratios. Eighty-two percent of the sample loans are secured. A typical firm in our sample has a
credit rating of B+, further suggesting that firms reporting a material ICW have a high credit risk.
The sample loans are syndicated by an average of 6.7 lenders; during our sample period, the
syndicated loans of public firms are characterized by an average of 9 lenders. The relatively
small number of syndicate lenders indicates that borrowers in our sample are relatively risky and
informationally opaque (Lee and Mullineaux [2004], Sufi [2007]). The average loan in our
sample is $334M and has a mean maturity of 49 months. Forty-seven percent of the sample loans
are issued by relationship lenders. The firms in our sample are relatively small, also consistent
with Doyle et al. [2007a].
9 For our research sample, 187 loans were issued before firms were required to file Section 302 reports. Because these firms may have had ICWs but were not required to report them, we eliminate these loans (verifying that the remaining firms have a loan both in the prior and in the uncorrected or corrected periods) and repeat the empirical analysis (untabulated). These tests produce results and inferences similar to the tabulated analyses.
13
The loan terms we examine in this study are highly correlated (Table 2, Panel B). This
evidence is consistent with Melnik and Plaut [1986], who suggest that a loan contract is a
package of n-contractual terms which cannot be split and traded separately. These terms include
both price and non-price features, and the lenders offer the borrower a trade-off between certain
contractual terms. Lenders may offer a firm a loan contract with a higher interest rate and fewer
financial covenants or a contract with a lower interest rate and a higher number of financial
covenants. A significant negative correlation between the interest rate and the number of
financial covenants for the loans in our sample supports this trade-off. We address the trade-off
between our main variables of interest in Section 4.7.2.
4. Empirical Results
4.1. The impact of financial reporting quality on financial covenants
Table 3, Column 1 presents the results from the financial covenant regression. Consistent
with our prediction, an uncorrected ICW leads to a decrease in the number of financial covenants
imposed by a loan contract. When compared to the mean number of financial covenants in the
prior period of 1.64, the coefficient of -0.36 on the Uncorrected variable represents a 22 percent
decrease in the number of covenants. The coefficient on Corrected is also negative and
statistically and economically significant. This implies that lenders continue to distrust financial
covenants as monitoring tool even after the firm has corrected the ICW, suggesting that ICWs
impose a long-term reputation effect on the borrower.10 The relationships between the number of
financial covenants and the control variables are consistent with the predicted signs. In
particular, the variables associated with the firm’s risk and potential ex-post incentive conflicts
are positively associated with the number of covenants. 10 An untabulated test suggests that the difference in coefficients on the Uncorrected and Corrected variables is not significantly different from zero (p-value=0.22).
14
We also examine whether the effect of an ICW on financial covenants is mitigated if a loan
is issued by a relationship lender (Column 2). Relationship lenders previously transacted with the
firm and thus have both extensive knowledge of the firm’s operations and well-developed
channels of communication with the firm’s managers (Bharath et al. [2009], Sufi [2007]). We
augment the financial covenant model with the Relationship Lender indicator variable and
interaction terms between this variable and Uncorrected and Corrected. A decrease in financial
covenants following an ICW is not different for relationship versus non-relationship loans.
It is important to emphasize that, following an ICW, a decrease in the number of financial
covenants is not inconsistent with an increase in uncertainty regarding the borrower. Because
lenders impose a higher number of financial constraints on more informationally opaque
borrowers (Bradley and Roberts [2004], Standard & Poor’s [2007]), one could argue that,
holding all else constant, following an ICW report, lenders should impose more financial
covenants. However, ICWs reveal to lenders that covenants based on financial statement
numbers are less efficient in conveying changes in a borrower’s creditworthiness. Consequently,
following ICWs, lenders decrease their reliance on financial covenants and are likely to
substitute them by more efficient tools and/or compensate for the decrease in financial covenants
with an increase in loan price.11
4.2. The impact of financial reporting quality on loan pricing
In Table 4 we investigate the impact of accounting quality on the interest rate charged on a
loan. The first column shows that disclosure of an ICW leads to higher interest rates. The 11 In untabulated tests we examine four major categories of financial covenants imposed by the sample loans’ contracts: an interest coverage restriction (min interest coverage, min fixed charge coverage, min debt service coverage and min cash interest coverage), a net worth restriction (min net worth and min tangible net worth), a CAPEX restriction and a debt to profitability restriction (max debt to EBITDA and max senior debt to EBITDA). We find a significant decrease in the frequencies of interest coverage, net worth and CAPEX restrictions of 6.4 percent, 8.2 percent and 6.6 percent, respectively. We infer that ICWs affect financial covenants based on both income statement and balance sheet numbers.
15
coefficient on Uncorrected is positive and statistically significant and implies that reporting an
uncorrected ICW increases the interest rate by 29.0 basis points, which represents an 11 percent
increase in the interest rate. In contrast, the coefficient on Corrected is not statistically different
from zero, suggesting that there is no pricing effect after the ICW is corrected. The loadings on
the control variables are generally consistent with predictions.12
We also examine whether the adverse effect of an ICW on loan pricing is different for
relationship versus non-relationship loans. Following an ICW disclosure, the increase in
uncertainty regarding a borrower and in information asymmetry between a borrower and the
lenders should be smaller for loans issued by relationship lenders. Therefore, we expect the
effect of an ICW on loan pricing to be less pronounced for relationship loans. In Column 2, we
augment the interest rate model with the Relationship Lender indicator variable and interaction
terms between this variable and Uncorrected and Corrected. Consistent with our predictions, the
interest rates on relationship loans issued during the uncorrected period are 11.33 basis points
lower than those on non-relationship loans.
4.3. The impact of financial reporting quality on collateral and additional monitoring
mechanisms
Table 5, Column 1 presents evidence on whether lenders require a borrower to post
collateral to compensate for the decrease in the number of financial covenants. We find that the
coefficients on both the Uncorrected and the Corrected variables are positive and significant,
suggesting that the probability of a loan being secured increases following an ICW. The
coefficient of 0.282 on Uncorrected translates into a three percent increase in the probability that
a loan will be backed by collateral; the coefficient of 0.494 on Corrected translates into an eight
12 The pricing estimation is robust to controlling for the number of general covenants, the loan purpose, the reputation of the syndicate’s lead arranger and whether the loan is secured or traded (untabulated).
16
percent increase in this probability.13 The coefficients on the control variables are consistent with
our predictions. In particular, variables indicating a higher credit risk are associated with an
increase in the probability that the loan is secured.
With respect to general covenants and maturity, the coefficients on Uncorrected and
Corrected are insignificantly different from zero, suggesting that lenders do not use these
monitoring mechanisms to substitute for the decrease in the number of financial covenants
(Table 5, Columns 2 and 3). In untabulated analyses we examine whether the effect of an ICW
on collateral, general covenants and maturity is different for relationship loans compared to non-
relationship loans; we find that this is not the case.
4.4. The impact of financial reporting quality on performance pricing provisions
Table 6 presents the results from the performance pricing estimation. Consistent with our
prediction, we find that poor financial reporting quality leads to a lower probability that a
performance pricing provision is based on a financial statement ratio. Economically, the
probability that this provision is based on a financial ratio decreases by 20 percent during the
uncorrected period. As our performance pricing analysis is restricted to the borrowers whose
loan contracts include performance pricing provisions both before and after an ICW report, this
finding suggests a switch from performance pricing provisions based on financial statement
ratios to those based on credit ratings. We find no lasting reputational impact of an ICW on
performance pricing provisions. The coefficients on the control variables are mostly consistent
with our predictions and with those reported in Ball et al. [2008]. In untabulated tests we also
find that the effect of an ICW on the performance pricing provision does not differ across
relationship and non-relationship loans. 13 An untabulated test shows that the difference in coefficients on the Uncorrected and Corrected variables is not significantly different from zero (p-value=0.77).
17
4.5. The effect of the seriousness of an ICW on loan terms
In this section we examine whether more serious internal control problems result in more
significant changes in loan contractual terms following the ICW disclosure. We use two
approaches to estimate the severity of an ICW. First, we follow Doyle et al. [2007b] and separate
ICWs into more serious, company-level material weaknesses, and less serious, account-specific
material weaknesses.14 We find that 93.9 percent of our sample loans are related to firms with at
least one company-level weakness. To investigate cross-sectional variation in ICWs, we count
the number of company-level weaknesses for each ICW report and classify the loan as Company-
High if the number of company-level weaknesses in the report is greater than the sample median.
The coefficients on Uncorrected*Company-High and Corrected*Company-High indicate that
more widespread internal control problems result in more serious changes in loan contractual
terms (Table 7, Panel A).15 Loans issued to firms with a higher number of company-level
weaknesses have a more pronounced decrease in financial covenants, a larger increase in the
interest rate, a higher probability of being secured and a lower probability of using financial-
ratio-based performance pricing provisions.
Second, we test the effects of ICWs related to fraud. For our sample, 8.6 percent of the
weaknesses are fraud-related. The coefficients on the interaction term variables in Panel B of
Table 7 indicate that more serious, fraud-related weaknesses result in a more significant decrease
in financial covenants, a more significant increase in the interest rate and a higher probability of
a loan being secured. We do not find that the performance pricing provision choice is affected by 14We classify the following weaknesses as company-level: board, audit committee and other corporate governance issues; company size, financial constraints or other limiting issues; inadequate disclosure issues; financial close process, policy or timeliness issues; financial records controlled by a third party; information technology, access or security issues; senior management tone or self-dealing issues; personnel inadequacies or segregation of duty issues. 15We use the methodology of Norton et al. [2004] to compute the marginal effects of interaction terms in probit models. In the security model, the mean interaction effect for Uncorrected*Company-High is 0.216 (p-value=0.06) and for Corrected*Company-High is 0.198 (p-value=0.08). In the performance pricing model, the mean interaction effect for Uncorrected*Company-High is -0.342 (p-value=0.08).
18
fraud-related weaknesses; this result is probably due to the extremely small number of fraud-
related weaknesses (2.8 percent) for the performance pricing sample.16
Our findings are distinct from those of Kim et al. [2009], who compare the loans of ICW
firms following the ICW disclosure to the loans of non-ICW firms. Kim et al. [2009] find that
the loans of firms with company-level ICWs have a marginally higher number of financial
covenants, which contradicts our finding of a significant decrease in financial covenants
following an ICW disclosure. They also show that the loans of ICW firms have a marginally
higher number of general covenants, a higher interest rate, a higher probability of being secured
and a smaller number of syndicate participants. We suggest that while the cross-sectional
research design of Kim et al. [2009] attributes differences in the loan terms between ICW and
non-ICW firms to an ICW disclosure, these differences may be, in fact, due to differences in
more fundamental firm characteristics, such as riskiness and information opacity.
To investigate this proposition, in untabulated analysis we examine whether the terms of
loans issued to ICW firms prior to the ICW disclosure are significantly different from those of
loans issued to non-ICW firms. We find that, relative to the loans of non-ICW firms, loans of
company-level ICW firms have a higher number of financial and general covenants, are priced at
higher interest rates, are more likely to be secured and have a smaller number of lenders even in
the period prior to the ICW disclosure. Therefore, we conjecture that the differences between the
loan contractual terms of ICW and non-ICW firms reported by Kim et al. [2009] are unlikely to
be attributed to the impact of the ICW disclosure.
16We compute the mean interaction effect (MIE) for the interaction variables in the security probit regression (Norton et al. [2004]). The MIE of Uncorrected*Fraud is 0.762 (p-value=0.06) and the MIE of Corrected*Fraud is 0.952 (p-value = 0.05). In addition, in untabulated tests, we find no evidence that more severe ICWs, as measured by both a high number of company-level weaknesses and fraud-related weaknesses, affect general covenants and loan maturity. It is important to note that fraud-related weaknesses do not reflect the realization of fraud, but rather suggest that a potential fraudulent activity may not be detected or prevented in a timely manner.
19
4.6. Comparative analysis of ICWs and restatements
In this section we analyze how the changes in debt contract design following ICWs differ
from those following restatements. Both ICWs and restatements imply that a firm’s financial
reporting is of low quality, but there are three primary distinctions between these phenomena.
First, restatements usually result from past malfeasance or misreporting, and the announcement
of a restatement coincides with the correction of previously reported numbers. In contrast, ICWs
imply that the firm’s internal controls are not sufficient to prevent or detect potential accounting
misstatements. Second, restatements are often linked to aggressive accounting and management
culpability. Prior research suggests that managers’ compensation incentives (Burns and Kedia
[2006], Efendi et al. [2007], Cheng and Farber [2008]) and capital market pressure (DeFond and
Jiambalvo [1991], Richardson et al. [2003]) are key motivating factors leading to restatements.
Supporting the relation between managers’ economic interests and restatements, Desai et al.
[2004] and Collins et al. [2009] show that managers of restating firms experience substantial
reputational penalties, as reflected by their high turnover and inability to secure comparable
subsequent employment. Conversely, prior research suggests that the primary factors explaining
ICWs include the firm’s small size, young age, high growth, high complexity, restructuring
activity and insufficient resources (Ge and McVay [2005], Ogneva et al. [2006], Ashbaugh-
Skaife et al. [2006], Doyle et al. [2007a]). Third, while both restatements and ICWs increase
uncertainty about reported accounting numbers, restatements also cause a significant real “wealth
effect.” Restatements not only change historic financial numbers, typically reducing past
profitability, but they are also often associated with a decrease in future profitability, which leads
20
to a downward revision in investors’ estimate of firm value (Kinney and McDaniel [1989],
Palmrose et al. [2004], Graham et al. [2008]).17
To identify differences between lenders’ contractual responses to ICWs and restatements,
we obtain restatements from Audit Analytics for the period from September 2002 to December
2008, which overlaps with our ICW sample period.18 We differentiate restatements that are not
“pre-empted” by previously disclosed ICWs from those that occur after an ICW disclosure. For
firms that restate their financial statements without a previous ICW, we compare the terms of
loans issued in the three year period before the restatement to the terms of loans issued in the
three year period after the restatement. The construction of this “clean” restatement sample
ensures that the changes in contractual terms following the restatement are not due to a
previously disclosed ICW.19 For firms that disclose an ICW before they restate their financial
statements, we compare the terms of loans issued in the interim period between the ICW
disclosure and the restatement to the terms of loans issued in the two year period after the
restatement. We limit the post-restatement period to two years in order to be consistent with the
average time of the interim period. This ensures that changes in debt contract design following
the restatement represent the incremental effect of restatements on loan terms relative to the
effect of ICWs. We ensure that each firm in the restatement samples has at least one loan in the
periods preceding and following the restatement, resulting in 2,299 loans issued to 727 firms that
17 In untabulated analysis we find that firms that restate their financial statements experience a significant deterioration in profitability, sales turnover and credit quality in the three year period following the restatement, relative to the three year period prior to it. In contrast, firms reporting ICWs do not experience changes in profitability or sales turnover and have a marginal increase in credit quality in the three year period following an ICW, relative to the three year period prior to it. 18 We verify that the changes in loan terms we attribute to ICWs cannot be explained by a borrower’s subsequent restatement. For a sample of 2,148 loans issued to firms that reported ICWs but did not subsequently restate, we find that the changes in debt contractual terms are similar to the changes we documented in our primary analysis. 19The “clean” restatement sample includes 107 firms that reported an ICW after a restatement. All the results and inferences are robust to excluding these firms from the analysis.
21
restated their financial statements without previously reporting an ICW and 442 loans issued to
118 firms that restated their financial statements after an ICW.20
For the “clean” restatement sample we find that, relative to loans issued before
restatements, post-restatement loans have a higher interest rate, a higher probability of being
secured, a higher number of general covenants and a shorter maturity (Table 8, Panel A).
However, the lenders do not decrease the number of financial covenants and do not move away
from financial-ratio-based performance pricing provisions. We infer from these results that when
firms restate financial statements, lenders decrease their trust in management, which can be
explained, at least partly, by the previously documented link between restatements and
management culpability. As a result, lenders both increase price and security protections and
monitor managers more tightly by imposing additional general covenants and by decreasing loan
maturity. Additional general covenants restrict managers’ operating, investment and financial
activities and shorter maturities force managers to refinance more frequently. This contrasts with
how lenders respond to ICWs, when they decrease their reliance on financial covenants and
financial-ratio-based performance pricing provisions and substitute these contractual terms with
price and security protection and credit rating-based provisions, but do not change the number of
general covenants or the loan maturity. This evidence suggests that when low financial reporting
quality is attributed primarily to a firm’s complexity and insufficient resources (as with ICWs),
lenders do not restrict managers’ actions, but instead decrease their reliance on contractual terms
based on accounting numbers and substitute them with non-accounting-based terms.
20 To ease the comparison of the results to those in Graham et al. [2008], we estimate the covenant models using Poisson regressions. In untabulated analysis, we re-estimate our primary covenant regressions using Poisson regressions. The incidence ratio from the Poisson regression suggests that the number of financial covenants in the uncorrected and corrected periods decreases by around 45%, relative to the prior period.
22
Table 8, Panel B reports the results for firms that reported an ICW before a restatement.
We find that, relative to loans issued during the interim period, post-restatement loans have a
higher number of general covenants and a shorter loan maturity, but do not experience changes
in interest rate, collateral, performance pricing provisions or number of financial covenants.
These findings reinforce our inference that, relative to ICWs, restatements prompt lenders to
more tightly monitor managers’ activities. Further, this suggest that in the post-SOX period,
ICWs provide lenders with an early signal for a decrease in financial reporting quality,
prompting lenders to adjust the interest rate and loan security prior to the event of restatement.
4.7. Robustness tests
4.7.1. Inter-temporal analysis
Our analysis of the effect of an ICW on the design of debt contracts requires a firm to have
a loan both in the prior and uncorrected or corrected periods, which may introduce survivorship
bias into our sample. As a firm borrows in the syndicated loan market for a longer time period, it
is likely to become better known to lenders, which may affect their monitoring activities.
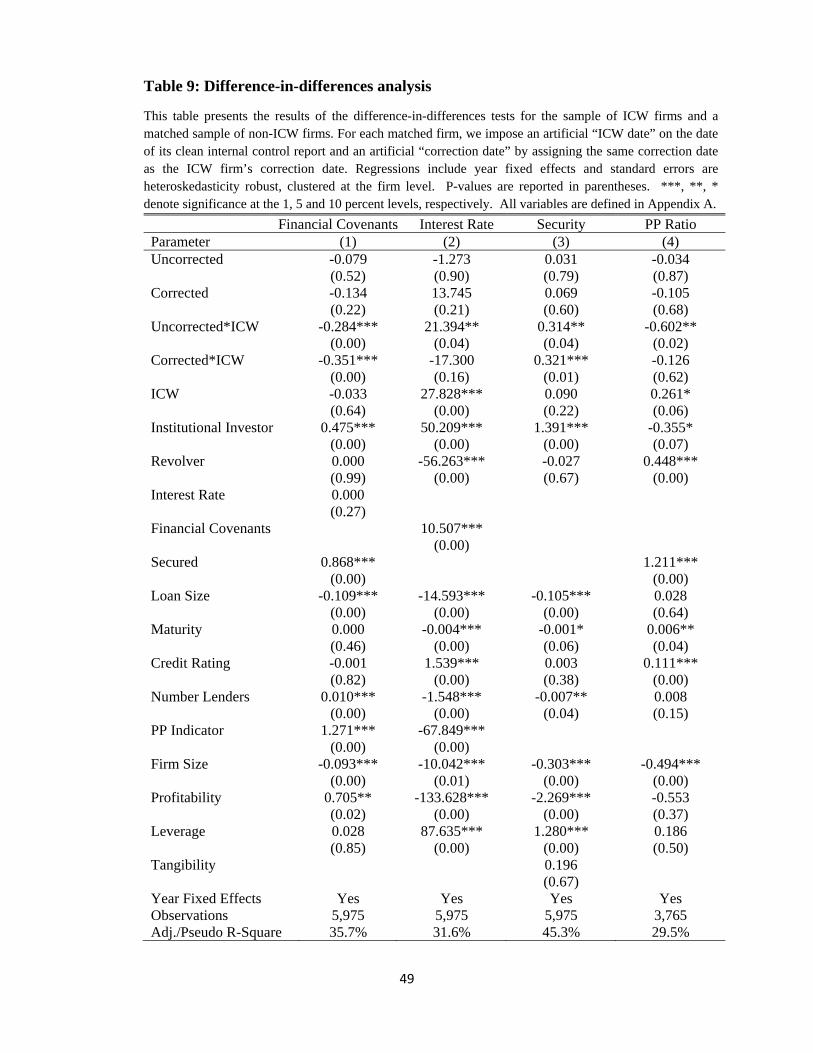
To address the survivorship bias concern, we conduct “difference-in-differences” tests. We
match each ICW firm to a firm that did not report an ICW during our sample period; we match
firms based on the quarter-year of the internal control report and the firms’ size and leverage at
the time of the report. Then, for each matched non-ICW firm, we impose an artificial “ICW
date” on the date of its clean internal control report and an artificial “correction date” by
assigning the same correction date as the ICW firm’s correction date. As a result, the matched
non-ICW firms have three artificial periods that correspond to the ICW sample periods. The
prior period includes all loans issued to the matched firm in the three year period before the
artificial “ICW date”, the uncorrected period includes all loans issued to the matched firm
23
between the artificial “ICW date” and the artificial “correction date” and the corrected period
includes all loans issued to the matched firm in the three year period following the artificial
“correction date.” We then run a “difference-in-differences” analysis where the prior,
uncorrected and corrected periods include loans issued to both the ICW and the non-ICW firms.
The results of this test are reported in Table 9, Column 1. Insignificant coefficients on the
Uncorrected and Corrected variables in the financial covenant model indicate that the matched
non-ICW firms do not experience a decrease in the number of covenants following the artificial
“ICW date.” In contrast, significant coefficients on Uncorrected*ICW and Corrected*ICW
indicate a decrease in financial covenants in the loan contracts of ICW firms following the ICW
report. These results are consistent with our main findings.
The relationship lending test reported in Table 3 further alleviates the survivorship bias
concern. This bias is expected to have the strongest effect on relationship loans, because if a firm
has a long-term relationship with the lender, information asymmetry between the firm and the
lender should substantially decrease over time, leading to a reduction in the use of covenants.
This test reveals that the decrease in financial covenants following an ICW is not different for
relationship versus non-relationship loans. In untabulated analysis, we also re-estimate the
financial covenant regression restricting the prior and corrected periods to one year before the
ICW is reported and to one year after it is corrected, respectively. This test substantially shortens
the time period for which we require a firm to survive and therefore mitigates the survivorship
bias concern. Despite a decrease in the sample size, all results and inferences are unchanged.
Finally, survivorship bias would also suggest that the interest rates should decrease over time and
that lenders should impose more lenient non-price contractual terms. These predictions are
opposite to the results that we find.
24
With respect to the interest rate model, our research design implies that the increase in the
interest rates that we observe could be attributed to hold-up costs, which are expected to increase
over time. We perform two tests to address this concern. First, the hold-up problem should be
significantly smaller for borrowers who have access to the public debt market. We repeat the
interest rate test, restricting the sample to firms that have publicly traded debt as reported by the
Mergent Fixed Income Securities Database; our results are robust to this restriction
(untabulated). Second, we perform the “difference-in-differences” test for the interest rate model.
As evidenced from Column 2 of Table 9, the coefficient on the Uncorrected variable is
insignificant, indicating that non-ICW matched firms do not experience an increase in loan
pricing following the artificial “ICW date”. The coefficient on the interaction term
Uncorrected*ICW is significantly positive, consistent with our findings of an increase in the
interest rate for ICW firms. We also perform the “difference-in-differences” test for the
performance pricing provision and security analyses (Table 9, Columns 3 and 4). We find results
consistent with our main findings.21 We believe that this evidence further alleviates concerns
associated with the time-series nature of our research design.
4.7.2. The joint determination of loan contractual terms
Agency theory suggests that there is likely to be a trade-off between the number of
covenant restrictions imposed by a loan contract and the interest rate (Jensen and Meckling
[1979], Myers [1977], Smith and Warner [1979]). Specifically, since the restrictions imposed by
covenants are costly to the firm, they are offset by a lower cost of debt. Gigler et al. [2009] show
that when testing the effect of financial reporting quality on debt contractual terms, the trade-off
21We compute the marginal effects of the interaction terms (Norton et al. [2004]) and find that the mean interaction effects for Uncorrected*ICW and Corrected* ICW in the security model are positive and significant and that the mean interaction effect for Uncorrected* ICW is negative and significant in the performance pricing model (untabulated).
25
between the interest rate and covenants should be explicitly considered. To verify that the
potential simultaneity between loan pricing and financial covenant intensity does not affect our
findings, we estimate a system of two equations where the interest rate and the number of
financial covenants are simultaneously determined.
To instrument the number of financial covenants, we rely on the Syndicate Relationship,
Reputable Arranger and Traded variables. The first two variables are designed to capture
information asymmetry between the lead arranger and syndicate participants. When there is high
information asymmetry within the syndicate, the participants rely to a lesser degree on ex-post
monitoring by the lead arranger (Ivashina [2009]) and are likely to require that loan contractual
terms be designed to facilitate the ex-post monitoring of a borrower. Because financial covenants
enhance efficient monitoring of the borrower, high information asymmetry within the syndicate
is expected to be associated with a higher number of financial covenants imposed by the loan
agreement. To address information asymmetry within the syndicate, we follow Sufi [2007] and
Ivashina [2009] and use the reputation of the lead arranger, measured by the arranger’s market
share (the Reputable Arranger indicator variable), and the syndicate-specific reputation of the
arranger, measured in terms of the previous arranger-participant relationships (the Syndicate
Relationship variable). Because high values for the Syndicate Relationship variable and the
Reputable Arranger indicator variable reflect low information asymmetry within the syndicate,
we predict and find a negative relation between these variables and the number of financial
covenants (Table 10, Column 1).
Prior research also suggests that traded loans have more financial covenants to facilitate
monitoring of the borrower by uninformed lenders who purchase loans on the secondary loan
market (Drucker and Puri [2009], Wittenberg-Moerman [2009]). The positive coefficient on
26
Traded in the financial covenant estimation confirms that this relation holds for our research
sample (Table 10, Column 1). We do not expect the Syndicate Relationship, Reputable Arranger
and Traded variables to directly affect the interest rate; the coefficients on these variables are
insignificantly different from zero in the interest rate model.
To instrument interest rate, we follow Bharath et al. [2009] and use the average interest rate
of all loans issued in the syndicated loan market over the six month period prior to the loan
issuance. The average market interest rate primarily reflects changes in institutional investors’
demand for syndicated loans (Ivashina and Sun [2010]). As expected, we find a positive and
significant association between the interest rate and the Average Prior Rate (Table 10, Column
2). Note that there is no empirical or institutional evidence that investor demand for syndicated
loans directly affects non-price loan contractual terms such as financial covenants. 22
We take comfort that our simultaneous estimation of the interest rate and financial
covenants is correctly identified because the results show a significant negative relation between
the interest rate and financial covenants (Table 10, Columns 3 and 4). The coefficient of -0.002
on the Interest Rate variable in the financial covenant regression indicates that a one standard
deviation increase in the interest rate translates into a 0.35 decrease in the number of financial
covenants; this is equivalent to 21.1 percent of the mean number of covenants for the sample
loans. As suggested by the interest rate estimation, a higher number of financial covenants is
associated with a lower interest rate. A one standard deviation increase in the number of financial
covenants decreases the interest rate by 49.3 basis points, which represents 19.5 percent of the
22Partial-F statistics indicate that Ave Prior Rate is a strong instrument for the interest rate and that Syndicate Relationship, Reputable Arranger and Traded are collectively strong instruments for financial covenants (Table 10, Columns 1 and 2). Partial R-Squares reveal that these variables have explanatory power in their respective regressions. Because the interest rate regression has one endogenous variable and three instruments, we also test the validity of the instruments for financial covenants. We find a Hansen-J statistic of 3.628 with a p-value of 0.16 and therefore fail to reject the null hypothesis that our instruments are relevant and valid.
27
mean interest rate for our sample. This negative and significant relation between the interest rate
and the number of financial covenants is consistent with theoretical predictions but was not
observed in Tables 3 and 4. These results suggest successful identification of the simultaneous
equation system.
The results presented in Columns 3 and 4 of Table 10 confirm that allowing for the joint
determination of the interest rate and the number of financial covenants does not affect our main
conclusion that financial reporting quality significantly affects these loan terms. The coefficients
on the Uncorrected and Corrected variables in the covenant regression remain negative and
significant. The interest rate in higher in the uncorrected period and is marginally higher during
the corrected period, relative to the prior period.
While we address the simultaneity between the interest rate and financial covenants, our
empirical analysis treats the rest of the variables of interest as exogenous. The regressions using
loan terms involve a variety of simultaneity and endogeneity problems, making finding the
appropriate instruments extremely difficult. Further, it is infeasible to concurrently endogenize
all the loan contractual terms that we examine in this paper. To address this issue, we estimate
the interest rate, financial covenant, collateral, general covenant, maturity and performance
pricing provision regressions as a system of equations using a seemingly unrelated regression
(SUR) model, which allows the error terms in all five regressions to be correlated (untabulated).
All findings are robust to the SUR estimation of the loan contractual terms: coefficients on both
the Uncorrected and the Corrected variables have similar statistical and economic significance to
our primary specifications, and all inferences remain the same.
4.7.3. Additional robustness tests
The results are also robust to imposing additional restrictions on our sample. In untabulated
28
analyses, we limit our sample to loans for which DealScan reports at least one financial covenant
and re-estimate all regressions involving financial covenants. We also repeat the general
covenant test for the sample restricted to loans subject to at least one general covenant.
Inferences from these analyses are identical to the tabulated results.23 As an additional robustness
test, we restrict our sample to loans with an available credit rating; the results of these tests are
similar to our primary specifications in statistical and economic significance. With respect to the
collateral model, we perform an analysis including only borrowers whose loans had been
unsecured in the prior period. The results of this estimation are consistent with those reported in
Table 5. In addition, all regressions are robust to controlling for the purpose of the loan and the
borrower’s market-to-book ratio. We also ensure that the credit crisis does not drive the post-
ICW loan characteristics by excluding from the sample all loans issued in 2008 and their
corresponding pre-ICW loans. Our results are not sensitive to the exclusion of these loans.
In addition, we repeat the estimation of all the regressions using Section 404 ICW reports;
our main inferences remain unchanged in both the uncorrected and corrected periods
(untabulated). We note that auditor opinions on internal controls agreed with management
opinions on internal controls in 100 percent of the cases in our sample for 2004-2008, a period
for which year-end auditor internal control reports are available.
Lastly, we verify that reporting an ICW does not trigger technical default. We randomly
select 50 ICW firms from our sample and examine whether they reported covenant violations in
the same 10-K or 10-Q filing that includes the ICW disclosure (if the ICW is disclosed in the 10-
23When DealScan reports that a loan is not subject to covenants, it indicates one of the following: 1) LPC has verified that the loan contract does not impose covenants or 2) LPC has not been able to obtain covenant information. In our primary analysis, we set covenants equal to zero for these loans. It is important to note that DealScan’s covenant coverage has significantly improved since 1996 and that all of the sample facilities have been issued after that point. Therefore, we do not expect the covenant coverage issue to have a significant impact on our empirical findings.
29
Q, we also examine the 10-K for the same fiscal year). Firms have to report covenant violations
in 10-K or 10-Q filings according to SEC Regulation S-X. In the majority of financial statements
that we examine, firms explicitly stated that they are in compliance with all covenants imposed
by their loan agreements. In the few cases where firms reported covenant violations, they were
unrelated to ICWs.
5. Conclusions
We examine the effect of financial reporting quality on the trade-off between monitoring
mechanisms used by lenders in debt agreements. We find that when a firm experiences an ICW,
lenders move away from financial covenants and toward security and price protection. Lenders
also substitute financial-ratio-based performance pricing provisions with provisions based on
credit ratings. The effects of an ICW on loan contractual terms become stronger for more serious
weaknesses, as measured by a high number of company-level weaknesses and fraud-related
weaknesses. We demonstrate that low financial reporting quality does not lead to overall tighter
debt contractual terms, as suggested by prior research, but rather triggers a trade-off between
contractual terms based on accounting numbers and non-accounting-based terms.
We also compare changes in debt contract design following ICWs to those following
restatements and find that when firms restate financial statement numbers, lenders both increase
price and security protections and monitor managers more tightly by imposing additional general
covenants and by decreasing loan maturity. However, lenders do not decrease the number of
financial covenants and do not move away from financial-ratio-based performance pricing
provisions. Therefore, while the potential for accounting misstatements decreases lenders’
reliance on accounting numbers, the realization of misreporting triggers tighter monitoring of
managers’ actions.
30
Our study provides novel evidence on the role of financial reporting quality in the design of
debt contracts. We document the effect of reporting quality on the choice of monitoring
mechanisms used by lenders and establish an important link between reporting quality and
lenders’ reliance on financial covenants. In addition, we document a significant relation between
the reliability of financial statements and loan terms and thus corroborate the importance of
financial reporting quality in debt contracting. Our findings also contribute to the literature on
the impact of financial reporting quality on the cost capital. Finally, by demonstrating that an
ICW disclosure allows for more efficient debt contracting, we add to the debate on the costs
versus benefits of SOX.
31
Appendix A: Data Definitions
Average Prior Rate: The average All-In-Drawn-Spread for all loans originated in the syndicated loan market (and recorded in DealScan) over the six month period prior to entering into the loan contract.
Company High: An indicator variable equal to one if the total number of company-level weaknesses disclosed in the ICW report is greater than the sample median, zero otherwise.
Corrected: An indicator variable equal to one if the loan is issued in the three year period following a corrected material internal control weakness, zero otherwise.
Credit Rating: The numerical equivalent of S&P, Moody’s, Fitch or DPR senior debt rating. It is set as equal to one for the highest senior debt rating, through 27 for the lowest senior debt rating. For firms not rated by S&P, we assign the Moody’s senior debt rating; for firms not rated by either S&P or Moody’s, we assign the Fitch senior debt rating; finally, for firms not rated by S&P, Moody’s or Fitch, we assign the DPR senior debt rating. We use a conventional conversion scheme to match ratings from all four rating agencies. The corporate credit rating variable is set to 28 for firms without an available S&P, Moody’s, Fitch or DPR debt rating. Credit ratings are collected from the S&P Historical Rating Database and from the Mergent FISD database.
Financial Covenants: The number of financial covenants imposed by the loan agreement.
Firm Size: A logarithm of the borrower’s total assets in the year prior to entering into a loan contract.
Fraud: An indicator variable equal to one if the ICW is fraud-related, zero otherwise.
General Covenants: The number of general covenants imposed by the loan agreement. This includes equity issuance sweeps, debt issuance sweeps, asset sales sweeps, insurance proceeds sweeps and dividend restrictions.
ICW: An indicator variable equal to one if the loan is issued to a firm that reports an ICW, zero otherwise.
Institutional Investor: An indicator variable taking the value of one if the loan’s type is term loan B, C or D (institutional term loans), zero otherwise.
32
Interest Rate: The interest rate is based on the All-In-Drawn-Spread measure reported by DealScan. This measure is equal to the amount the borrower pays in basis points over LIBOR for each dollar drawn down, so it accounts for both the spread of the loan and the annual fee paid to the bank group. LPC always uses the LIBOR spread or the LIBOR-equivalent spread option to calculate the All-In-Drawn spread.
Leverage: The ratio of the long-term debt to total assets, estimated in the year prior to entering into a loan contract.
Loan Size: A logarithm of the loan’s amount.
Maturity: The number of months between the facility’s issue date and the date when the loan matures.
When maturity is the dependent variable, we use the logarithm of maturity.
Number Lenders: Number of participants in the loan syndicate, including the arranger.
PP Ratio: An indicator variable taking the value of one if the loan contract has a performance pricing provision based on an accounting ratio; it is equal to zero if it has a performance pricing provision based on a credit rating.
PP Indicator: An indicator variable taking the value of one if the loan contract
incorporates a performance pricing option, zero otherwise.
Profitability: The ratio of EBITDA to total assets, estimated in the year prior to entering into a loan contract.
Relationship Lender: Reputable Arranger:
An indicator variable taking the value of one if at least one of the loan’s lead arrangers had been a lead arranger of the borrower’s previous loans over the 5 year period preceding the loan’s issuance date, zero otherwise. An indicator variable taking the value of one if the loan is syndicated by one of the top six arrangers, based on the arranger’s average market share in the primary loan market. In the case of multiple arrangers, we consider the highest market share across the arrangers involved in the loan transaction.
Restatement: An indicator variable taking the value of one if the loan is issued after a firm restates their financial statements, zero otherwise.
33
Revolver: An indicator variable taking the value of one if the loan’s type is revolver, zero otherwise.
Secured: An indicator variable taking the value of one if the loan is backed by collateral, zero otherwise.
Syndicate Relationship: The syndicate-specific reputation of the arranger, measured in terms of the previous arranger-participant relationships. For every syndicate participant, the number of previous relationships between the lead arranger and the participant is deflated by the total number of deals syndicated by the arranger (the estimation is performed over a five year period preceding the loan’s issuance). The syndicate-specific measure is estimated as the averaged relationship measure across all syndicate participants.
Tangibility: The ratio of net PPE plus inventory to total assets, estimated in the year prior to entering into a loan contract.
Traded: An indicator variable taking the value of one if the loan is traded on the secondary loan market, zero otherwise. The data is provided by the Loan Trade Database.
Uncorrected: An indicator variable equal to one if the loan is issued during a period of an uncorrected material internal control weakness. We define this period from the day of the first material internal control weakness through the day of the first report where the weakness has been corrected.
34
References
ARMSTRONG, C., W. GUAY, and J. WEBER. “The Role of Information and Financial Reporting in Corporate Governance and Debt Contracting.” Unpublished paper, University of Pennsylvania, 2010. Available at http://papers.ssrn.com/sol3/papers.cfm?abstract_id=1571138.
ASHBAUGH-SKAIFE, H., D. COLLINS, and W. KINNEY JR. “The Discovery and Reporting of Internal Control Deficiencies Prior to SOX-mandated Audits”. Unpublished paper, University of Wisconsin, 2006. Available at http://papers.ssrn.com/sol3/papers.cfm?abstract_id=694681.
ASHBAUGH-SKAIFE, H., D. COLLINS, W. KINNEY JR., and R. LAFOND. “The Effect of SOX Internal Control Deficiencies on Firm Risk and Cost of Equity.” Journal of Accounting Research 47 (2009): 1-43.
ASQUITH, P., A. BEATTY, and J. WEBER. “Performance Pricing in Bank Debt Contracts.” Journal of Accounting and Economics 40 (2005): 101-128.
ASSENDER, T. Growth and Importance of Loan Ratings. T. Rhodes, K. Clark and M. Campbell, Syndicated Lending: Practice and Documentation, London, UK. 2000.
BALL, R. “Infrastructure Requirements for an Economically Efficient System of Public Financial Reporting and Disclosure.” Brookings-Wharton Papers on Financial Services, (2001): 69-127.
BALL, R., and P. BROWN. “Portfolio Theory and Accounting.” Journal of Accounting Research 7 (1969): 300-23.
BALL, R., R. BUSHMAN, and F. VASVARI. “The Debt-contracting Value of Accounting Information and Loan Syndicate Structure.” Journal of Accounting Research 46 (2008): 247-287).
BARCLAY, M., and C. SMITH. “The Maturity Structure of Corporate Debt.” The Journal of Finance 50 (1995): 609-631.
BEATTY, A., K. RAMESH, and J. WEBER. “The Importance of Accounting Changes in Debt Contracts: The Cost of Flexibility in Covenant Calculations.” Journal of Accounting and Economics 33 (2002): 205-227.
BENEISH, D., M. BILLINGS, and L. HODDER. “Internal Control Weaknesses and Information Uncertainty.” The Accounting Review 83 (3) (2008): 665-703.
BHARATH, S., S. DAHIYA, A. SAUNDERS, and A. SRINIVASAN. “So what do I Get? The Bank's view of Lending Relationships.” The Journal of Financial Economics 85 (2007): 368-419.
BHARATH, S., S. DAHIYA, A. SAUNDERS, and A. SRINIVASAN. “Lending Relationships and Loan Contract Terms: Does Size Matter?” Review of Financial Studies (2009), forthcoming.
BHARATH, S., J. SUNDER, and S. V. SUNDER. “Accounting Quality and Debt Contracting.” The Accounting Review 83 (2008): 1-28.
BURNS, N., and S. KEDIA. “The Impact of Performance-based Compensation on Misreporting.” Journal of Financial Economics 79 (2006): 35–67.
BOOTH, J. “Contract Costs, Bank Loans, and The Cross-monitoring Hypothesis.” Journal of Financial Economics 31 (1992): 25-42.
BOTOSAN, C. “Disclosure Level and the Cost of Equity Capital.” The Accounting Review 72 (1997): 323–349.
35
BOTOSAN, C., and M. PLUMLEE. “Are Information Attributes Priced?“ Unpublished paper, University of Utah, 2007. Available at http://papers.ssrn.com/sol3/papers.cfm?abstract_id=475222.
BRADLEY, M., and M. ROBERTS. “The Structure and Pricing of Corporate Debt Covenants.” Unpublished paper, Duke University, 2004. Available at http://papers.ssrn.com/sol3/papers.cfm?abstract_id=466240.
CHENG, Q., and D. FARBER. “Earnings Restatements, Changes in CEO Compensation, and Firm Performance.” The Accounting Review 83 (2008): 1217-1250.
COLLINS, D., A. MASLI, A. REITENGA, and J. SANCHEZ. “Earnings Restatements, the Sarbanes-Oxley Act and The Disciplining of Chief Financial Officers.” Journal of Accounting, Auditing and Finance 24 (2009): 1-34.
CORE, J., W. GUAY, and R. VERDI. “Is Accruals Quality a Priced Risk Factor?” Journal of Accounting & Economics 46 (2007): 2-22.
DEFOND, M., and J. Jiambalvo. “Debt Covenant Violation and Manipulation of Accruals.” Journal of Accounting and Economics 17 (1994): 145-176.
DE FRANCO, G., F. VASVARI, and R. WITTENBERG-MOERMAN. “The Informational Role of Bond Analysts.” Journal of Accounting Research 47 (2009): 1201-1248.
DESAI, H., C. HOGAN, and M. WILKINS. “The Reputational Penalty for Aggressive Accounting: Earnings Restatements and Management Turnover.” The Accounting Review 81 (2006): 83-112.
DEMIROGLU, C. and C. JAMES. “The Information Content of Bank Loan Covenants.” Review of Financial Studies (2010), forthcoming.
DENNIS, S., and D. J. MULLINEAUX. “Syndicated Loans.” Journal of Financial Intermediation 9 (2000): 404-426.
DICHEV, I., and D. SKINNER. “Large-sample Evidence on the Debt Covenant Hypothesis.” Journal of Accounting and Economics 40 (2002): 1091-1123.
DOYLE, J., W. GE, and S. MCVAY. “Determinants of Weaknesses in Internal Control over Financial Reporting.” Journal of Accounting and Economics 44 (2007a): 193-223.
DOYLE, J., W. GE, and S. MCVAY. “Accruals Quality and Internal Control over Financial Reporting.” The Accounting Review 82 (5) (2007b):1141-1170.
DRUCKER, S., and M. PURI. “On Loan Sales, Loan Contracting, and Lending Relationships.” Review of Financial Studies 22 (2009): 2635-2672.
EASLEY, D., S. HVIDKJAER, and M. O’HARA. “Is Information Risk a Determinant of Asset Returns?” The Journal of Finance 58 (2002): 2185-2210.
EASLEY, D., and M. O’HARA. “Information and the Cost of Capital.” The Journal of Finance 59 (2004): 1553-1583.
ECKER, F., J. FRANCIS, I. KIM, P. OLSSON, and K. SCHIPPER. “A Returns-based Representation of Earnings Quality.” The Accounting Review 81 (2006): 749-780.
EFENDI, J., A. SRIVASTAVA, and E. SWANSON. “Why do Corporate Managers Misstate Financial Statements? The Role of Option Compensation and Other Factors.” Journal of Financial Economics 85 (2007): 667-708.
FLANNERY, M. “Asymmetric Information and Risky Debt Maturity Choice.” Journal of Finance 41 (1986): 19-37.
FRANCIS, J., R. LAFOND, P. OLSSON, and K. SCHIPPER. “Cost of Equity and Earnings Attributes.” The Accounting Review 79 (2004): 967-1010.
36
FRANCIS J., R. LAFOND, P. OLSSON, and K. SCHIPPER. “The Market Pricing of Accruals Quality.” Journal of Accounting and Economics 39 (2005): 295-327.
GE, W., and S. MCVAY. “The Disclosure of Material Weaknesses in Internal Control After the Sarbanes-Oxley Act.” Accounting Horizons 19 (2005): 137-158.
GIGLER, F., C. KANODIA, H. SAPRA, and R. VENUGOPALAN. “Accounting Conservatism and the Efficiency of Debt Contracts.” Journal of Accounting Research 47 (2009): 767-797.
GRAHAM, J., S. LI, and J. QIU. “Corporate Misreporting and Bank Loan Contracting.” Journal of Financial Economics 89 (2008): 44– 61.
GUPTA, A., A. SINGH, and A. ZEBEDEE. “Liquidity in the Pricing of Syndicated Loans.” Journal of Financial Markets 11 (2008): 339-376.
HAMMERSLEY, J., L. MYERS, and C. SHAKESPEARE. “Market Reactions to the Disclosure of Internal Control Weaknesses and to the Characteristics of those Weaknesses under Section 302 of the Sarbanes Oxley Act of 2002.” Review of Accounting Studies 13 (2007): 141-165.
Harjoto, M., D. Mullineaux, and H. Yi. “Loan Pricing at Investment versus Commercial Banks.” Financial Management 35 (2006): 49-70.
HITE, G., and A. WARGA. “The Effect of Bond-rating Changes on Bond Price Performance.” Financial Analysts Journal 53 (1997): 35-51.
HOLTHAUSEN, R., and R. WATTS. “The Relevance of Value Relevance Literature for Financial Accounting Standard Setting.” Journal of Accounting and Economics 31 (2001): 3-75.
HUGHES, J., J. LIU, and J. LIU. “Information Asymmetry, Diversification, and Cost of Capital.” The Accounting Review 82 (2007): 705-729.
IVASHINA, V. “The Effects of Syndicate Structure on Loan Spreads.” Journal of Financial Economics 92 (2009): 300-319.
IVASHINA, V. and Z. SUN. “Institutional Demand Pressure and the Cost of Leveraged Loans.” Journal of Financial Economics (2010). Forthcoming.
JENSEN, M., and W. MECKLING. “Theory of the Firm: Managerial Behavior, Agency Costs, and capital structure.” Journal of Financial Economics 3 (1976): 305-360.
Kim, J., B. Song and L. Zhang. “Internal control weakness and bank loan contracting: Evidence from SOX Section 404 disclosures.” Unpublished paper, City University of Hong Kong, 2009. Available at http://papers.ssrn.com/sol3/papers.cfm?abstract_id=1080479.
KINNEY, W., and L. MCDANIEL. “Characteristics of Firms Correcting Previously Reported Quarterly Earnings.” Journal of Accounting and Economics 11 (1989): 71–93.
LAMBERT, R., C. LEUZ, and R. VERRECCHIA. “Accounting Information, Disclosure, and the Cost of Capital.” Journal of Accounting Research 45 (2007): 385-420.
LEE, S., and D. MULLINEAUX. “Monitoring, Financial Distress, and the Structure of Commercial Lending Syndicates.” Financial Management 33 (2004): 107-130.
LEFTWICH, R. “Accounting Information in Private Markets: Evidence from Private Lending Agreements.” The Accounting Review 58 (1983): 23-42.
LI, N. “Negotiated Measurement Rules in Debt Contracts.” Journal of Accounting Research, (2010). Forthcoming.
LSTA. The Handbook of Loan Syndications and Trading. A. Taylor and A. Sansone, Editors, New York: McGraw-Hill. 2007.
MELNIK, A., and S. PLAUT. “Loan Commitment Contracts, Terms of Lending and Credit Allocation.” The Journal of Finance 41 1986: 425-436.
37
MYERS, S. “Determinants of Corporate Borrowing.” Journal of Financial Economics 5 (1977): 147-176.
NORTON, E., H. WANG, and C. AI. “Computing Interaction Effects and Standard Errors in Logit and Probit Models.” The Stata Journal, (2004): 103-116.
OGNEVA, M., K. SUBRAMANYAM, and K. RAGHUNANDAN. “Internal Control Weakness and Cost of Equity: Evidence from SOX Section 404 disclosures.” The Accounting Review 82 (2007): 1255-1207.
ORTIZ-MOLINA, H., and M. PENAS. “Lending to Small businesses: The role of Loan Maturity in Addressing Information Problems.” Small Business Economics 30 (2008): 361-383.
PALMROSE, Z., V. RICHARDSON, and S. SCHOLZ. “Determinants of Market Reactions to Restatement Announcements.” Journal of Accounting and Economics 37( 2004): 59-89.
RICHARDSON, S., I. TUNA, and M. WU. “Predicting Earnings Management: The Case of Earnings Restatements.” Unpublished paper, University of Pennsylvania, 2003. Available at: http://papers.ssrn.com/sol3/papers.cfm?abstract_id=338681.
SCHERR, F., and M. HULBURT. “The Debt Maturity of Small Firms.” Financial Management 30 (2001): 85-111.
SMITH, C., and J. WARNER. “On Financial Contracting: An Analysis of Bond Covenants.” Journal of Financial Economics 7 (1979): 117-161.
STANDARD & POOR’S. A Guide to the U.S. Loan Market. 2007, STOHS, M., and D. MAUER. “The Determinants of Corporate Debt Maturity Structure.”
Journal of Business 69 (1996): 279-312. SUFI, A. “Information Asymmetry and Financing Arrangements: Evidence from Syndicated
Loans.” The Journal of Finance 62 (2007): 629-668. VERRECCHIA, R. E. “Essays on Disclosure.” Journal of Accounting and Economics 32 (2001):
91-180. WATTS, R.L. “A Proposal for Research on Conservatism.” Unpublished paper, University of
Rochester, 1993. Available at: http://papers.ssrn.com/sol3/papers.cfm?abstract_id=6044. WATTS, R.L., and J.L. ZIMMERMAN. Positive Accounting Theory, Prentice-Hall, Englewood
Cliffs, NJ. 1986. WEIDNER, D. “Syndicated Lending Closes out ‘90s on a Tear.” The American Banker, January
10th. 2000. WITTENBERG-MOERMAN, R. “The Role of Information Asymmetry and Financial Reporting
Quality in Debt Trading: Evidence from the Secondary Loan Market.” Journal of Accounting and Economics 46 (2008): 240-260.
WITTENBERG-MOERMAN, R. “The Impact of Information Asymmetry on Debt Pricing and Maturity.” Unpublished paper, University of Chicago, 2009. Available at: http://papers.ssrn.com/sol3/papers.cfm?abstract_id=1152863.
ZHANG, J. “The Contracting Benefits of Accounting Conservatism to Lenders and Borrowers.” Journal of Accounting and Economics 45 (2008): 27-54.
38
Table 1: Sample selection
This table presents our sample selection process.
Filters Facilities Firms Material Weaknesses1 2,231 Intersection with DealScan Public Companies2 3,666 1,166 Excluding Facilities with Missing Data3 3,088 856 Matched Before and After Sample4 2,828 788
1. The sample includes all SOX Section 302 material weakness reports for the period September 2002 through July 2008, as reported by Audit Analytics.
2. Companies filing material weakness are matched to public borrowers on the DealScan database for the period September 1999 through December 2008. We include all facilities (loans) that the company initiated in the period from three years before the internal control weakness was reported through three years after it was corrected.
3. We require firms to have non-missing DealScan and Compustat data for each of our loan- and firm-level control variables.
4. We require that the firm has at least one facility before the internal control weakness report and one facility after the report.
39
Table 2: Descriptive statistics and correlation matrix
Panel A presents the descriptive statistics for the total sample of 2,828 facilities. Panel B presents the Pearson correlation matrix of selected variables. ***, **, * denote significance at the 1, 5 and 10 percent levels, respectively. All variables are defined in Appendix A.
Table 3: Financial covenants as a function of financial reporting quality
This table presents the results from the estimation of the financial covenant model. In Column (1) we regress the number of financial covenants on the uncorrected and corrected ICW variables and the loan- and firm-specific control variables. In Column (2) we add relationship lending to the financial covenant model. Regressions include year fixed effects and standard errors are heteroskedasticity robust, clustered at the firm level. P-values are reported in parentheses. ***, **, * denote significance at the 1, 5 and 10 percent levels, respectively. All variables are defined in Appendix A.
Table 4: Interest rate as a function of financial reporting quality
This table presents the results from the estimation of the interest rate model. Our primary specification is in Column (1); we regress the interest rate on the uncorrected and corrected ICW variables and loan- and firm-specific control variables. In Column (2) we test whether the impact of financial reporting quality on the interest rate is mitigated if the loan is issued by a relationship lender. Regressions include year fixed effects and standard errors are heteroskedasticity robust, clustered at the firm level. P-values are reported in parentheses. ***, **, * denote significance at the 1, 5 and 10 percent levels, respectively. All variables are defined in Appendix A.
Table 5: The impact of financial reporting quality on loan security, general covenants and maturity
This table presents the results from the estimation of the security, general covenant and maturity models. Column (1) is a probit regression estimation of the probability that the lenders require a loan to be secured. The dependent variable equals one if the loan is secured, zero otherwise. In Column (2) we regress the number of general covenants on the uncorrected and corrected ICW variables and control variables. In Column (3) we regress the logarithm of maturity on the ICW variables and control variables. Regressions include year fixed effects and standard errors are heteroskedasticity robust, clustered at the firm level. P-values are reported in parentheses. ***, **, * denote significance at the 1, 5 and 10 percent levels, respectively. All variables are defined in Appendix A.
Security General Covenants Maturity Parameter (1) (2) (3)
Table 6: The impact of financial reporting quality on the probability of accounting-based performance pricing provisions
This table presents the results from the probit regression estimation of the probability of using accounting-based performance pricing provisions. The dependent variable equals one if the performance pricing provision is based on a financial statement ratio, zero if it is based on a credit rating. The regression includes year fixed effects and standard errors are heteroskedasticity robust, clustered at the firm level. P-values are reported in parentheses. ***, **, * denote significance at the 1, 5 and 10 percent levels, respectively. All variables are defined in Appendix A.
Table 7: The impact of the relative seriousness of an ICW on loan terms
This table examines the effect of the relative seriousness of the ICW on loan terms. In Panel A, we consider firms with the number of company-level weaknesses greater than the sample median as having more severe internal control problems. In Panel B, we consider firms with fraud-related weaknesses as having more severe internal control problems. Regressions include year fixed effects and standard errors are heteroskedasticity robust, clustered at the firm level. P-values are reported in parentheses. ***, **, * denote significance at the 1, 5 and 10 percent levels, respectively. All variables are defined in Appendix A.
Table 8: The comparative analysis of ICWs and restatements
In this table we analyze how changes in debt contract design following ICWs differ from those following restatements. In Panel A, we investigate changes in loan terms for firms that restate their financial statements without previously reporting ICWs. In Panel B, we investigate the incremental effect of restatements on loan terms for firms that report ICWs and then subsequently restate their financial statements. We estimate financial covenant and general covenant models using a Poisson regression. Regressions include year fixed effects and standard errors are heteroskedasticity robust, clustered at the firm level. P-values are reported in parentheses. ***, **, * denote significance at the 1, 5 and 10 percent levels, respectively. All variables are defined in Appendix A.
Panel A: The effect of a restatement on loan terms for firms that did not previously report an ICW
This table presents the results of the difference-in-differences tests for the sample of ICW firms and a matched sample of non-ICW firms. For each matched firm, we impose an artificial “ICW date” on the date of its clean internal control report and an artificial “correction date” by assigning the same correction date as the ICW firm’s correction date. Regressions include year fixed effects and standard errors are heteroskedasticity robust, clustered at the firm level. P-values are reported in parentheses. ***, **, * denote significance at the 1, 5 and 10 percent levels, respectively. All variables are defined in Appendix A.
Table 10: Simultaneous estimation of the interest rate and financial covenants
This table presents the results from the simultaneous estimation of the interest rate and financial covenant models. Columns (1) and (2) present the results of the first stage estimation of the financial covenant and the interest rate models, respectively. Columns (3) and (4) present the estimation of the interest rate regression and the financial covenant regression as a system of two equations. We use 3sls, with the Average Prior Rate variable as our instrument for the interest rate and Syndicate Relationship, Reputable Arranger, and Traded as our instruments for covenants. All variables are defined in Appendix A. Regressions include year fixed effects. P-values are reported in parentheses. ***, **, * denote significance at the 1, 5 and 10 percent levels, respectively.