http://www.iaeme.com/IJCIET/index.asp 675 [email protected]
International Journal of Civil Engineering and Technology (IJCIET) Volume 8, Issue 6, June 2017, pp. 675–686, Article ID: IJCIET_08_06_073
Available online at http://www.iaeme.com/IJCIET/issues.asp?JType=IJCIET&VType=8&IType=6
ISSN Print: 0976-6308 and ISSN Online: 0976-6316
© IAEME Publication Scopus Indexed
THE IMPACT OF LAND USE CHANGED AND
CLIMATE CHANGED TO THE DISCHARGE ON
KODINA WATERSHED – POSO, CENTRAL
SULAWESI
Rudi Herman
Doctoral Student of Civil Engineering Department,
Hasanuddin University, Makassar
M. Saleh Pallu
Professor, Civil Engineering Department,
Hasanuddin University, Makassar
M. Arsyad Thaha
Associate Professor, Civil Engineering Department,
Hasanuddin University, Makassar
Rita Tahir Lopa
Associate Professor, Civil Engineering Department,
Hasanuddin University, Makassar
ABSTRACT
The river's flow is highly depend on climatology and soil conditions and the vegetation as
well as land use changes have a direct impact to the river flow. NRECA’s model used in this
study was considered the parameters of soil moisture storage, ground water flow and climate
changed. The method was involved calculation of evapotranspiration due to temperature rise
and net rainfall which are used in the models.
In this model used coefficient NOM = 0.21; SMS = 351.55 mm (soil test results), GWF =
0.225 and PSUB = 0.815 for evapotranspiration adopted a increasing of 0.5 % of temperature.
While rainfall correction used 9% net rainfall, which is strongly influenced by vegetation and
land use in Kodina watershed. The results of models was found that the total discharges output
due to climate and land use changed were 2443.38 m3/s/year, the average discharge value =
15.66 m3/s, whilst the total observed discharge = 2487.58 m3/s/year and average debit = 15.95
m3/s. The differences of model and observed discharge were – 1.78 %. So the climate and land
use changed was should be considered in the models. Because it would be made the model are
very close with the observed discharge.
Rudi Herman, M. Saleh Pallu, M. Arsyad Thaha and Rita Tahir Lopa
http://www.iaeme.com/IJCIET/index.asp 676 [email protected]
Key words : Climatology, Net Rainfall, Land Use, and Physical Factor of Watershed.
Cite this Article: Rudi Herman, M. Saleh Pallu, M. Arsyad Thaha and Rita Tahir Lopa,
The Impact of Land Use Changed and Climate Changed To The Discharge On Kodina
Watershed – Poso, Central Sulawesi. International Journal of Civil Engineering and
Technology, 8(6), 2017, pp. 675–686.
http://www.iaeme.com/IJCIET/issues.asp?JType=IJCIET&VType=8&IType=6
1. INTRODUCTION
Hydrological model is one way to estimate the river discharge approaching the condition of a
catchment area. A good model is to pay attention to natural phenomena such as the impacts of
climate change that lead to an increase of temperatures resulting in the increase of
evapotranspiration. On the other hand land use changed result in changes in land infiltration
capacity, soil surface capacity, and interception by plant canopy (net rainfall).
Knowing the impact of rainfall variability and land conversion on river flow discharge is
essential to ensure the sustainability of water resources. Therefore modeling is rain-discharge
unit to approach the values of hydrological processes that occur in the field are required. The
availability of Flow data, rainfall data and climatological data is needed to determine the
potential of water resources in a river basin. Rain-flow models can be used as a tool to monitor
and evaluate the potential of river discharge through the approach of the existing surface water
resources. (e.g, Ammann, Asdak, Bardsley) [2,3,5].
The sensitivity of hydrology system to changes in land use and climate change in a
watershed can be evaluated by using models of hydrology that it concerned by the biophysical
properties in the regions. Some parameter according to water balanced scheme was analyzed
such a climate change, surface flow, base flow, percolation and evapotranspiration. Nreca’s
hydrological models are an approach models which is simulate and predict the hydrological
events that occur by using specific hydrological data recording. (e.g, Asdak, Indarto, Rudi H)
[3,12,15].
In response analysis of the watershed, the watershed is a hydrological system in which there
is a very close relationship between every input in the form of rain, hydrological processes, and
outputs such as the river discharge and sediment transported. Referred to hydrological processes
in a watershed, it can be concluded that the distribution of rainfall into streams are influenced
by the physical properties of the surface of the watershed are also influenced by the properties
of the rain. (e.g, Indarto, Kesuma, Rahman,Syukur, S) [9, 12, 16, 20].
From several discharge models found by hydrological experts, in this study Nreca model
(National Rural Electric Cooperative Association, 1985) was selected. This model is widely
used by scientists, universities (hydrological analysis calculations). This is probably due to the
practicality in its application and the parameters used are not too much. Considering those
phenomena so that a debit model is needed taking into account changes in land use, soil type
and soil characteristics. This study was made to analyze land use changes that directly impact
on river discharge. The result of debit analysis will be compared to the observed discharge so
that the model can be well validated.
2. RESEARCH METHODS
Aspects reviewed are factors that can be affected by land use change and climate change. Where
the climate factors were include rainfall, temperature, air humidity, solar irradiance and wind
speed. Location of the study is the upland of Kodina Watershed, the south of Lake Poso. The
size of watershed is 28.800 ha and it is located at the coordinates 2o8'02 "- 2°14'52" South
latitude and 120o40'18"- 120o51’16”.
The Impact of Land Use Changed and Climate Changed To The Discharge On Kodina Watershed –
Poso, Central Sulawesi
http://www.iaeme.com/IJCIET/index.asp 677 [email protected]
2.1. Data of the Research
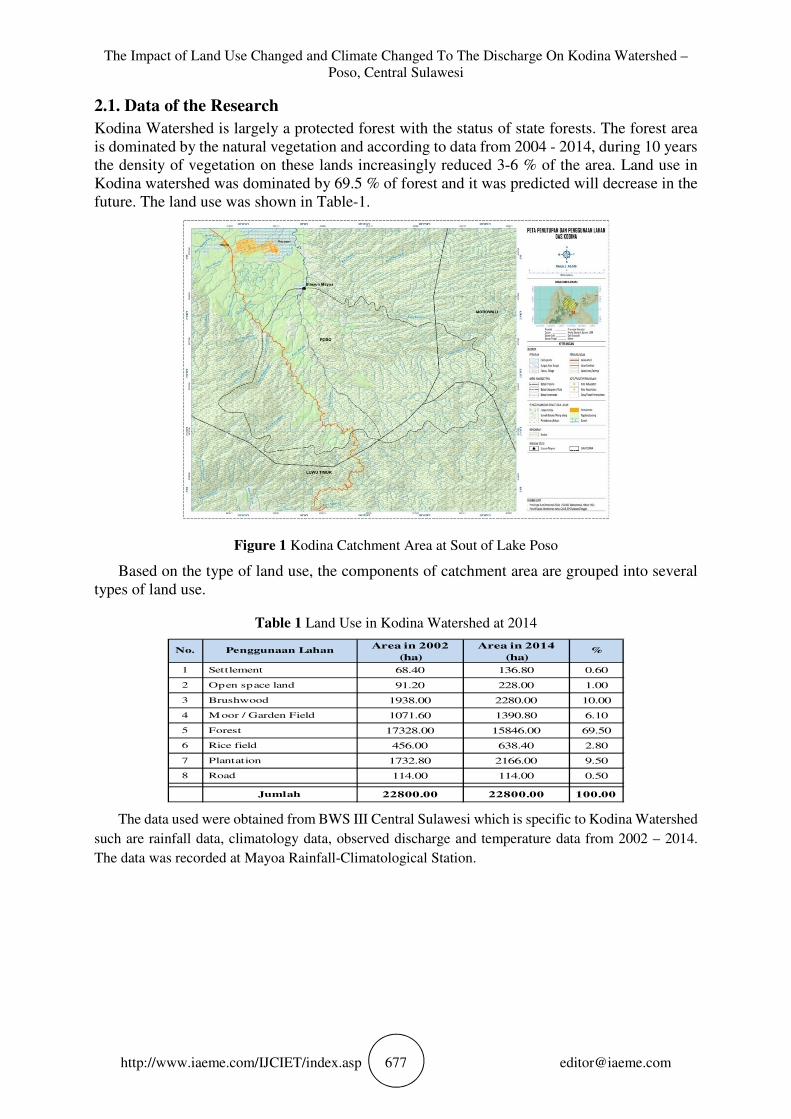
Kodina Watershed is largely a protected forest with the status of state forests. The forest area
is dominated by the natural vegetation and according to data from 2004 - 2014, during 10 years
the density of vegetation on these lands increasingly reduced 3-6 % of the area. Land use in
Kodina watershed was dominated by 69.5 % of forest and it was predicted will decrease in the
future. The land use was shown in Table-1.
Figure 1 Kodina Catchment Area at Sout of Lake Poso
Based on the type of land use, the components of catchment area are grouped into several
types of land use.
Table 1 Land Use in Kodina Watershed at 2014
1 Settlement 68.40 136.80 0.60
2 Open space land 91.20 228.00 1.00
3 Brushwood 1938.00 2280.00 10.00
4 Moor / Garden Field 1071.60 1390.80 6.10
5 Forest 17328.00 15846.00 69.50
6 Rice field 456.00 638.40 2.80
7 Plantation 1732.80 2166.00 9.50
8 Road 114.00 114.00 0.50
Jumlah 22800.00 22800.00 100.00
No. Penggunaan LahanArea in 2014
(ha)%
Area in 2002
(ha)
The data used were obtained from BWS III Central Sulawesi which is specific to Kodina Watershed
such are rainfall data, climatology data, observed discharge and temperature data from 2002 – 2014.
The data was recorded at Mayoa Rainfall-Climatological Station.
Rudi Herman, M. Saleh Pallu, M. Arsyad Thaha and Rita Tahir Lopa
http://www.iaeme.com/IJCIET/index.asp 678 [email protected]
Table 2 Data of Monthly Average Temperature
Year Jan Peb Mar Apr May Jun Jul Ags Sep Okt Nov Des
2002 24.76 25.54 25.85 25.47 25.61 24.54 26.06 26.23 27.41 27.65 27.65 26.98
2003 25.85 25.17 26.21 24.91 24.89 26.37 25.49 25.90 26.28 26.72 26.34 25.43
2004 25.54 25.37 25.35 25.10 26.01 25.21 23.85 26.10 26.24 27.29 27.11 25.79
2005 25.86 25.08 27.18 25.26 23.91 24.84 24.86 25.34 27.01 27.24 26.34 26.01
2006 26.85 26.63 26.04 25.99 25.90 24.84 26.01 25.79 26.69 27.60 26.82 25.65
2007 25.84 27.25 25.89 24.68 25.48 25.02 23.60 24.75 23.12 27.36 25.55 25.74
2008 25.95 25.51 25.52 25.19 24.52 24.88 23.60 23.48 25.30 26.09 25.79 25.34
2009 26.07 26.85 26.99 26.53 26.44 25.78 27.77 28.42 27.79 26.86 28.81 27.96
2010 28.46 30.64 29.89 31.31 30.37 29.77 30.98 29.43 30.02 28.52 27.31 26.27
2011 25.75 26.50 27.03 27.58 29.22 29.53 31.00 30.38 28.56 27.40 26.87 25.80
2012 27.35 28.04 28.50 29.23 28.50 28.95 28.34 30.26 27.28 24.22 24.94 24.73
2013 25.00 24.43 24.01 23.67 23.51 23.80 23.77 24.14 24.73 25.11 24.59 26.42
2014 26.63 25.30 24.39 25.09 23.58 22.82 23.64 23.45 25.69 26.99 25.32 25.91
Monthly Average Temperature (T oC)
Table 3 Data of Monthly Rainfall
2002 334.7 199.5 854.5 493.3 413.3 559.1 68.8 32.2 46.0 16.6 386.5 321.0 3725.5
2003 151.8 322.2 796.5 571.4 236.3 60.1 117.0 307.0 177.6 94.7 357.7 320.0 3512.3
2004 323.8 381.3 416.4 404.9 397.9 230.1 214.9 3.9 128.7 18.8 245.9 28.0 2794.6
2005 453.2 553.2 361.2 376.3 371.1 209.6 433.6 137.3 97.3 297.9 431.0 452.3 4174.0
2006 211.1 223.4 308.8 480.4 349.3 325.9 43.2 111.5 28.2 29.4 210.9 384.3 2706.4
2007 212.6 605.9 353.1 690.3 348.1 437.4 164.5 172.4 169.6 217.3 306.8 253.9 3931.9
2008 279.8 236.5 477.7 472.9 407.1 259.4 216.8 451.1 215.8 369.6 826.7 514.6 4728.0
2009 484.1 369.9 604.6 597.0 441.2 179.2 165.6 75.5 49.3 92.5 343.5 298.4 3700.8
2010 485.1 337.3 934.7 577.0 580.2 224.5 149.2 490.4 289.3 536.7 346.1 567.9 5518.4
2011 198.9 251.6 269.8 425.5 462.9 184.7 213.5 105.6 203.8 282.3 383.7 404.0 3386.3
2012 104.5 110.0 74.2 146.9 497.4 292.8 90.4 17.7 26.8 71.7 258.9 257.6 1948.9
2013 80.1 419.8 326.7 554.9 525.9 445.7 708.1 126.3 214.0 95.6 517.3 528.0 4542.4
2014 203.2 173.0 360.0 306.3 250.8 388.2 375.1 190.6 41.0 21.6 246.7 602.1 3158.6
June July Agst
Monthly Rainfall at Mayoa Rainfall Station (mm/month)
Years Jan Peb March April May Des TotalSept Okt Nop
Table 4 Data of Average Climatology
Jan Peb Mar Apr May June July Ags Sept Okt Nop Des
Relative Humidity (RH) % 91.86 92.93 93.82 94.93 94.66 95.71 96.91 93.67 90.21 88.81 92.72 93.77
Temperature, T oC
26.15 26.33 26.37 26.15 26.00 25.87 26.07 26.44 26.62 26.85 26.43 26.00
Wind Velocity, u m/s 0.34 0.34 0.35 0.32 0.30 0.30 0.32 0.34 0.35 0.34 0.33 0.29
Solar Radiation (SR) % 43.37 45.11 45.32 46.49 44.28 36.24 36.83 40.76 50.04 54.79 49.88 41.96
Average Climatology Data at Mayoa Station (2002-2014)
Description UnitsMonth
The Impact of Land Use Changed and Climate Changed To The Discharge On Kodina Watershed –
Poso, Central Sulawesi
http://www.iaeme.com/IJCIET/index.asp 679 [email protected]
Table 5 Discharge Recorded at Sta.Mayoa
Month Jan Peb Mar Apr May Jun Jul Ags Sep Okt Nov Des
2002 12.56 15.76 16.04 27.85 25.75 11.63 5.68 5.29 3.98 4.55 8.72 22.08
2003 15.86 17.64 22.33 31.15 11.70 5.90 6.25 13.73 9.75 4.65 10.17 15.94
2004 15.63 15.95 20.41 20.97 18.09 13.17 15.86 12.97 11.04 8.82 10.60 7.47
2005 12.89 28.40 15.78 23.28 25.01 12.64 12.69 11.22 6.92 10.01 15.27 21.88
2006 10.54 11.73 13.18 32.20 19.57 12.99 5.17 4.30 5.06 3.29 3.52 9.78
2007 8.38 17.15 16.54 28.54 20.62 23.22 16.55 19.90 14.71 13.29 15.62 13.88
2008 14.19 14.44 18.21 19.68 19.16 20.61 15.80 21.81 19.14 29.10 25.68 27.28
2009 17.76 16.02 27.68 29.62 26.15 22.16 23.16 21.05 18.82 20.68 20.71 11.81
2010 16.62 18.21 32.96 22.01 25.10 16.80 17.18 18.71 20.22 26.71 24.40 25.59
2011 23.80 15.81 15.88 17.51 19.65 18.22 11.21 10.32 10.86 11.37 14.57 17.28
2012 9.94 9.33 6.45 6.22 12.38 13.32 7.93 6.79 5.76 4.43 10.62 7.38
2013 8.82 13.99 14.05 18.77 16.27 20.98 20.30 20.30 21.81 13.92 20.62 27.39
2014 10.47 8.73 9.35 12.74 8.98 12.62 16.81 12.02 10.31 5.28 7.09 14.63
Discharge Recorded at Mayoa Rainfall Station (m3/s)
2.2. Research Stage
Following Nreca models which are using the result of calculation evapotranspiration, rainfall
and soil condition as follows water balance equations. Therefore it stage of research is
calculating of evapotranspiration (using Penmann formula), calculating the net rainfall by
adopting Dunne and Leopold formula), testing ground water content, and the impact of climate
changed. The water balance is specifically formulated with (e.g. Festy R.A) [7]
P = Q + E ± ΔS (1)
where: P = Precipitation (mm); Q = Discharge (m3/s);
E = Evapotranspiration (mm) ; ΔS = Delta Storage (mm)
2.2.1. Evapotranspiration
Evapotranspiration is the total amount of water that is returned to the atmosphere from the
surface of the ground, bodies of water and vegetation by the influence of climatic factors and
physiological vegetation. The Calculation of potential evapotranspiration using Penman
Method received a recommendation from the UN Food and Agriculture Organization. The
general principle of the calculation of potential evapotranspiration in accordance with the
following formula:
E = C *(W*Rn + (1-W)*f(u)*(ea-ed)) (2)
where: E = daily potential evapotranspiration (mm/day) ; C = correction factor ; W =
weighting factor ; Rn = net radiation (Rnl - RNS) ; f(u) = function of wind speed ; ea = saturated
vapor pressure ; ed = actual vapor pressure
From the climatology data then it was calculated the evapotranspiration and the results are
follows:
Rudi Herman, M. Saleh Pallu, M. Arsyad Thaha and Rita Tahir Lopa
http://www.iaeme.com/IJCIET/index.asp 680 [email protected]
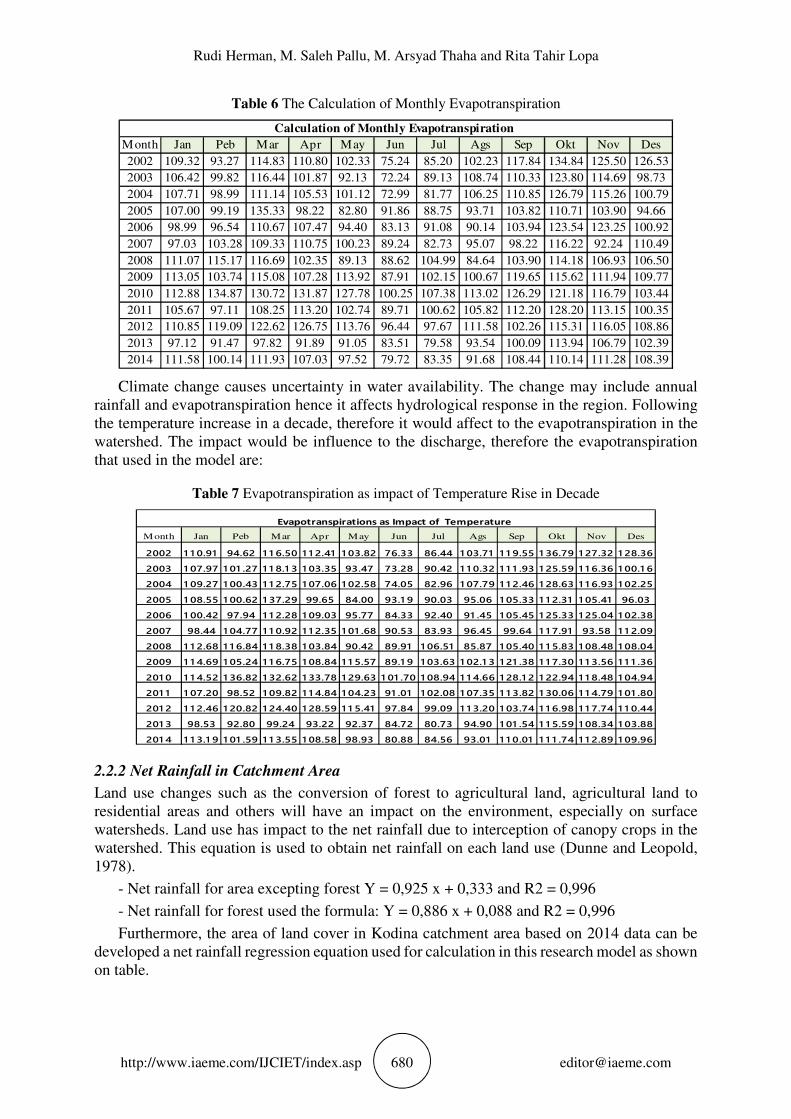
Table 6 The Calculation of Monthly Evapotranspiration
Month Jan Peb Mar Apr May Jun Jul Ags Sep Okt Nov Des
2002 109.32 93.27 114.83 110.80 102.33 75.24 85.20 102.23 117.84 134.84 125.50 126.53
2003 106.42 99.82 116.44 101.87 92.13 72.24 89.13 108.74 110.33 123.80 114.69 98.73
2004 107.71 98.99 111.14 105.53 101.12 72.99 81.77 106.25 110.85 126.79 115.26 100.79
2005 107.00 99.19 135.33 98.22 82.80 91.86 88.75 93.71 103.82 110.71 103.90 94.66
2006 98.99 96.54 110.67 107.47 94.40 83.13 91.08 90.14 103.94 123.54 123.25 100.92
2007 97.03 103.28 109.33 110.75 100.23 89.24 82.73 95.07 98.22 116.22 92.24 110.49
2008 111.07 115.17 116.69 102.35 89.13 88.62 104.99 84.64 103.90 114.18 106.93 106.50
2009 113.05 103.74 115.08 107.28 113.92 87.91 102.15 100.67 119.65 115.62 111.94 109.77
2010 112.88 134.87 130.72 131.87 127.78 100.25 107.38 113.02 126.29 121.18 116.79 103.44
2011 105.67 97.11 108.25 113.20 102.74 89.71 100.62 105.82 112.20 128.20 113.15 100.35
2012 110.85 119.09 122.62 126.75 113.76 96.44 97.67 111.58 102.26 115.31 116.05 108.86
2013 97.12 91.47 97.82 91.89 91.05 83.51 79.58 93.54 100.09 113.94 106.79 102.39
2014 111.58 100.14 111.93 107.03 97.52 79.72 83.35 91.68 108.44 110.14 111.28 108.39
Calculation of Monthly Evapotranspiration
Climate change causes uncertainty in water availability. The change may include annual
rainfall and evapotranspiration hence it affects hydrological response in the region. Following
the temperature increase in a decade, therefore it would affect to the evapotranspiration in the
watershed. The impact would be influence to the discharge, therefore the evapotranspiration
that used in the model are:
Table 7 Evapotranspiration as impact of Temperature Rise in Decade
Month Jan Peb Mar Apr May Jun Jul Ags Sep Okt Nov Des
2002 1 1 0.91 94.62 1 1 6.50 1 1 2.41 1 03.82 76.33 86.44 1 03.71 1 1 9.55 1 36.79 1 27.32 1 28.36
2003 1 07.97 1 01 .27 1 1 8.1 3 1 03.35 93.47 73.28 90.42 1 1 0.32 1 1 1 .93 1 25.59 1 1 6.36 1 00.1 6
2004 1 09.27 1 00.43 1 1 2.75 1 07.06 1 02.58 74.05 82.96 1 07.79 1 1 2.46 1 28.63 1 1 6.93 1 02.25
2005 1 08.55 1 00.62 1 37.29 99.65 84.00 93.1 9 90.03 95.06 1 05.33 1 1 2.31 1 05.41 96.03
2006 1 00.42 97.94 1 1 2.28 1 09.03 95.77 84.33 92.40 91 .45 1 05.45 1 25.33 1 25.04 1 02.38
2007 98.44 1 04.77 1 1 0.92 1 1 2.35 1 01 .68 90.53 83.93 96.45 99.64 1 1 7.91 93.58 1 1 2.09
2008 1 1 2.68 1 1 6.84 1 1 8.38 1 03.84 90.42 89.91 1 06.51 85.87 1 05.40 1 1 5.83 1 08.48 1 08.04
2009 1 1 4.69 1 05.24 1 1 6.75 1 08.84 1 1 5.57 89.1 9 1 03.63 1 02.1 3 1 21 .38 1 1 7.30 1 1 3.56 1 1 1 .36
201 0 1 1 4.52 1 36.82 1 32.62 1 33.78 1 29.63 1 01 .70 1 08.94 1 1 4.66 1 28.1 2 1 22.94 1 1 8.48 1 04.94
201 1 1 07.20 98.52 1 09.82 1 1 4.84 1 04.23 91 .01 1 02.08 1 07.35 1 1 3.82 1 30.06 1 1 4.79 1 01 .80
201 2 1 1 2.46 1 20.82 1 24.40 1 28.59 1 1 5.41 97.84 99.09 1 1 3.20 1 03.74 1 1 6.98 1 1 7.74 1 1 0.44
201 3 98.53 92.80 99.24 93.22 92.37 84.72 80.73 94.90 1 01 .54 1 1 5.59 1 08.34 1 03.88
201 4 1 1 3.1 9 1 01 .59 1 1 3.55 1 08.58 98.93 80.88 84.56 93.01 1 1 0.01 1 1 1 .74 1 1 2.89 1 09.96
Evapotranspirations as Impact of Temperature
2.2.2 Net Rainfall in Catchment Area
Land use changes such as the conversion of forest to agricultural land, agricultural land to
residential areas and others will have an impact on the environment, especially on surface
watersheds. Land use has impact to the net rainfall due to interception of canopy crops in the
watershed. This equation is used to obtain net rainfall on each land use (Dunne and Leopold,
1978).
- Net rainfall for area excepting forest Y = 0,925 x + 0,333 and R2 = 0,996
- Net rainfall for forest used the formula: Y = 0,886 x + 0,088 and R2 = 0,996
Furthermore, the area of land cover in Kodina catchment area based on 2014 data can be
developed a net rainfall regression equation used for calculation in this research model as shown
on table.
The Impact of Land Use Changed and Climate Changed To The Discharge On Kodina Watershed –
Poso, Central Sulawesi
http://www.iaeme.com/IJCIET/index.asp 681 [email protected]
Table 8 The Result of Calculation Net Rainfall in The Cathment Area
Tahun Jan Peb Mar April May June July Agst Sept Okt Nop Des
2002 304.61 181.55 777.60 448.90 376.10 508.78 62.61 29.30 41.86 15.11 351.72 292.11
2003 138.14 293.20 724.82 519.97 215.03 54.69 106.47 279.37 161.62 86.18 325.51 291.20
2004 294.66 346.98 378.92 368.46 362.09 209.39 195.56 3.55 117.12 17.11 223.77 25.48
2005 412.41 503.41 328.69 342.43 337.70 190.74 394.58 124.94 88.54 271.09 392.21 411.59
2006 192.10 203.29 281.01 437.16 317.86 296.57 39.31 101.47 25.70 26.75 191.92 349.71
2007 193.47 551.37 321.35 628.17 316.77 398.03 149.70 156.88 154.34 197.74 279.19 231.05
2008 254.60 215.25 434.68 430.34 370.50 236.02 197.32 410.50 196.38 336.34 752.30 468.29
2009 440.53 336.61 550.19 543.27 401.49 163.07 150.70 68.71 44.86 84.18 312.59 271.54
2010 441.44 306.94 850.58 525.07 527.98 204.30 135.77 446.26 263.26 488.40 314.95 516.79
2011 181.00 228.96 245.52 387.21 421.24 168.08 194.29 96.10 185.46 256.89 349.17 367.64
2012 95.10 100.10 67.52 133.68 452.63 266.45 82.26 16.11 24.39 65.25 235.60 234.42
2013 72.89 382.02 297.30 504.96 478.57 405.59 644.37 114.93 194.74 87.00 470.74 480.48
2014 184.91 157.43 327.60 278.73 228.23 353.26 341.34 173.45 37.31 19.66 224.50 547.91
Monthly Net Rainfall due to Interception
2.2.3. Nreca Methods
The amount of discharge is calculated using simulation models Nreca. Nreca principle is to
estimate the amount of river flow due to the rain that fell in the Catchment Area taking into
account the soil conditions and topography of the catchment. In the model Nreca there are two
(2) types of reservoirs, namely the storage humidity (moisture storage) and soil water storage
(groundwater storage). Humidity storage is determined by rainfall and actual
evapotranspiration, while the soil water storage is determined by the excess moisture (excess
moisture).
�� = � − ��� + ∆ 3)
Input is needed from the model of rain - runoff are as follows; The average rainfall (P);
Potential evapotranspiration (PET); The capacity of the storage moisture (NOM); PSUB (values
ranging from 0.3 - 0.9); GWF (ranged from 0.2 - 0.8); The initial value of the storage soil
moisture (SMSTOR); The initial value of the ground water reservoir (GWSTOR); and Crop
factor (Cf),
Table 9 Parameter Value Used in the Model
No. ParameterInitial
Parameter
Calibration
Parameter
Final Nreca
ParameterNote
NOMINAL 3679.1 mm
c 0.25 0.22 0.22
2 PSUB 0.9 0.815 0.825
3 GWF 0.25 0.22 0.21
4 SMS (mm) 200 mm 295 315.55 Soil test results
5 GWS (mm) 150 mm 200 200
1NOM = 100 + C*
(avg annual rainfall)
3. RESULTS AND DISCUSSION
3.1. Discharge with Initial Parameter and Calibration in Nreca Model
Determining the influence of climate components to stream flow on Kodina watershed needed
the parameters associated with the discharge of the river. The climate data used ranging from
2002 – 2014 as well as the data of river discharge. Therefore the monthly evapotranspiration
results were apply to Nreca models.
Table 10 The Result of Discharge with Initial Parameters
Rudi Herman, M. Saleh Pallu, M. Arsyad Thaha and Rita Tahir Lopa
http://www.iaeme.com/IJCIET/index.asp 682 [email protected]
Month Jan Peb Mar Apr May Jun Jul Ags Sep Okt Nov Des
2002 15.46 18.83 34.64 32.44 33.21 26.83 10.60 8.69 7.36 5.84 9.19 10.57
2003 11.23 14.00 18.82 21.32 17.11 12.57 11.38 12.92 11.14 8.47 11.90 12.31
2004 12.99 16.45 16.49 18.19 18.51 17.12 15.29 11.78 10.34 8.10 9.37 6.73
2005 11.80 17.99 15.13 16.98 17.44 15.46 18.24 13.87 11.50 12.74 16.25 18.01
2006 14.94 15.60 14.71 18.85 17.85 18.56 13.34 11.35 9.50 7.54 8.09 11.29
2007 9.90 18.89 15.90 23.64 20.33 22.80 17.72 15.58 14.19 12.84 18.72 15.21
2008 16.23 15.62 16.57 22.67 21.71 22.21 19.30 19.52 16.65 22.82 28.26 26.41
2009 25.45 26.32 28.82 31.62 28.81 24.33 20.05 16.07 16.34 14.81 13.90 10.44
2010 17.33 17.82 28.04 24.79 28.76 26.80 21.39 25.63 22.94 26.37 24.83 28.54
2011 22.47 19.88 20.03 23.07 24.30 20.37 18.06 14.08 14.04 13.98 17.04 18.54
2012 13.23 12.01 8.90 8.00 14.73 14.42 10.18 8.35 7.07 5.61 7.94 7.63
2013 6.13 13.39 12.16 16.57 15.88 19.11 18.23 18.91 19.47 15.81 22.68 23.54
2014 9.14 9.28 11.24 12.14 11.55 16.74 17.84 14.97 10.97 8.70 10.12 17.03
Discharge Nreca Model on Kodina Watershed
From Initial off Nreca models then it was calibrated and validated regarding to the
biophysical oh the Kodina watershed. After obtained the parameters then it was calibrated and
validated. So the calculation results can be seen on table below.
Table 11 The Result of Nreca Calibration models
Month Jan Peb Mar Apr May Jun Jul Ags Sep Okt Nov Des
2002 14.79 16.83 30.43 29.23 28.57 18.43 11.47 7.46 6.21 5.44 10.65 12.52
2003 11.34 15.96 24.13 25.78 18.65 11.48 10.95 13.73 10.87 7.50 12.98 13.43
2004 14.20 18.52 18.68 20.48 20.71 18.05 15.74 11.85 9.26 6.80 9.44 5.57
2005 13.53 21.46 16.72 19.02 19.51 16.01 20.55 13.61 10.49 13.21 18.17 20.14
2006 15.30 15.90 15.51 25.36 19.43 20.05 12.50 10.36 8.11 6.12 7.43 12.52
2007 10.04 22.85 17.69 28.53 22.44 25.62 17.94 16.33 14.61 12.41 16.25 14.82
2008 15.20 14.69 18.55 21.15 20.91 19.20 17.88 21.12 16.82 25.91 34.05 29.74
2009 29.57 29.65 32.31 35.32 30.87 23.92 18.91 14.05 14.78 15.55 15.83 10.40
2010 19.21 18.61 34.33 32.01 29.51 24.82 18.59 25.10 20.88 26.16 23.30 28.12
2011 20.00 18.16 17.95 22.12 23.85 17.99 15.86 11.12 11.75 12.40 16.47 18.39
2012 10.98 9.48 6.68 5.99 15.56 14.13 8.49 6.63 5.34 4.03 8.42 7.34
2013 7.22 14.58 13.30 17.88 24.03 22.31 19.35 19.13 19.83 13.30 23.01 25.25
2014 8.72 8.62 11.73 12.38 11.45 16.18 17.04 13.03 9.44 7.13 9.38 18.73
Discharge Calibratrion of Nreca Model on Kodina Watershed
The result of the calibration of discharge Nreca models shown in figure-2. The hydrograph
was compared with observed discharge data. The result of the computation are shows the graph
below.
The Impact of Land Use Changed and Climate Changed To The Discharge On Kodina Watershed –
Poso, Central Sulawesi
http://www.iaeme.com/IJCIET/index.asp 683 [email protected]
Figure 2 The Graph of observed discharge, Nreca model and Nreca calibration
The calibration and verification in the calculation Nreca models need to be calibrated
against the parameters of the Soil Moisture Capacity (SMC), the coefficient of infiltration,
recession coefficient, Initial Soil Moisture (ISM), and Initial Ground Water Storage (IGWS) in
order to obtain the optimal parameter values then used statistical test for correlation coefficient,
volume and t-test error.
The calibration results are shown in table 11. It shows that results of the discharge are more
closely to the observed discharge data. The average observed data is 15.58 m3/s while the Nreca
calibration models had a result of 16.12 m3/s. From the Figure 2, Nreca calibration models could
be assure to predict the distribution of availability of water with good accuracy. This is caused
by the correlation value R2 of 0,826. Correlation value is greater so it can be trusted.
with comparing the mean and variance between discharge data on the calculation and
observed data.
3.2. Discharge with Final Nreca model and Adopting Land Use and Climate
Changed
Effects of changes in land covers increase of temperature has direct impact to the flow rate in
the rivers. Following the Dunne and Leopold (1978) that the impact of land used are direct to
net rainfall. Also it would influence to recharge the ground water. The Phenomena of
temperature rise and reducing of vegetation has an effect to the discharge. Therefore calculation
of Net rainfall was considered in the simulation.
Effects of changes in land cover and rainfall to recharge the ground water and in showing a
similar pattern, for groundwater recharge in a part of the shallow groundwater recharge and the
amount was comparable even with a much smaller percentage. The best results by following
the test shows the Nreca calibration model is closed to observed data. It can be concluded that
the calibration model gives best results.
It is seen from the results of the correlation value (R) Nreca calibration model is best
compared to the other methods. The Simulation results show that the vegetation changes from
2002 to 2014 as the year for the same rainfall will produce more water runoff, while decreasing
the amount of rainfall on the same land cover by itself will reduced runoff.
0
5
10
15
20
25
30
35
40
2002 2003 2004 2005 2006 2007 2008 2009 2010 2011 2012 2013 2014
Deb
it (
m3/s
)
Years
Comparison of Discharge On Kodina WatershedObserved Discharge, Calibration of Nreca and Nreca Model
Data Nreca Model Nreca Calibration Model
Rudi Herman, M. Saleh Pallu, M. Arsyad Thaha and Rita Tahir Lopa
http://www.iaeme.com/IJCIET/index.asp 684 [email protected]
Regarding to result of evapotranspiration due to temperature rise (table-7) and calculation
of net rainfall in Kodina Watershed (table-8), the it was calculated the discharge as an impact
of both parameters. The result of discharge was shown on table below.
Table 12 The Result of Discharge by Using Net Rainfall and Temperature rise
Month Jan Peb Mar Apr May Jun Jul Ags Sep Okt Nov Des
2002 14.42 17.63 28.25 26.99 27.89 16.39 11.43 5.89 4.87 4.62 10.27 14.03
2003 13.55 16.52 23.11 26.28 16.69 8.72 10.10 12.95 10.05 5.09 13.18 14.79
2004 14.49 16.52 17.85 19.96 17.70 14.91 12.63 12.15 9.23 8.46 10.38 6.58
2005 11.13 21.76 15.94 19.13 20.68 12.90 14.58 10.45 7.73 10.26 15.22 20.20
2006 11.79 14.09 17.38 26.23 16.38 16.90 9.76 5.73 5.57 3.99 4.84 10.09
2007 7.61 18.12 15.04 25.69 19.41 22.38 16.56 16.82 15.40 13.91 15.71 13.10
2008 14.06 14.54 18.75 19.14 18.99 18.00 15.68 20.77 16.39 27.59 32.67 29.48
2009 27.00 26.42 28.96 31.87 26.64 23.34 20.38 17.18 17.92 18.57 16.65 11.39
2010 16.32 17.12 31.41 26.57 27.57 21.16 17.32 20.04 19.51 26.65 23.08 25.87
2011 17.89 16.69 15.96 18.19 20.23 14.16 12.13 9.99 10.28 11.08 13.29 15.97
2012 10.43 9.91 7.62 6.53 13.28 11.72 8.54 6.84 5.70 5.65 8.93 7.61
2013 7.62 12.66 13.60 17.94 18.45 21.11 21.29 19.64 20.43 13.08 20.46 24.23
2014 11.43 8.02 10.26 11.58 9.20 13.61 16.15 11.84 8.79 6.28 7.88 17.14
Discharge Nreca Model on Kodina/Mayoa Watershed
Figure 3 The graph of observed discharge, Nreca model, and Model LU&TC
The hydrologic processes simulated in the basin as shown by the influence of land use
change (net rainfall) and climate changed (temperature rise) has a similar and closed result
compared with observed discharge. Considering the land use change and climate change in the
Kodina watershed, it was the obtained results are better and very close to measured data.
4. CONCLUSIONS
To obtain better results on Nreca model it was concluded that the model should engage the net
rainfall (due to changes in land use) and evapotranspiration due to climate changed. The
influence of land use changed caused the net rainfall was less about 9 % from rainfall data.
While the increase of temperature effect to the rise of evapotranspiration. Both of parameters
had significant impact to the models. By applying of these two parameters, the results obtained
are very close to the observed discharge on Kodina Watershed. There was the difference -1.78
% of the model compared with observed discharge. However, the database should have an
adequate level of accuracy.
0
5
10
15
20
25
30
35
40
2002 2003 2004 2005 2006 2007 2008 2009 2010 2011 2012 2013 2014
Deb
it (
m3/s
)
Years
Comparison of Discharge On Kodina WatershedObserved Discharge, Nreca Model dan Land Use & Temperature Changed
Data Nreca Model Land Use & Temp Changed
The Impact of Land Use Changed and Climate Changed To The Discharge On Kodina Watershed –
Poso, Central Sulawesi
http://www.iaeme.com/IJCIET/index.asp 685 [email protected]
Soil moisture content test are needed to obtain parameter of SMS (SMS= 315.55 mm).
Regarding to model by reducing of forest area it would reducing some parameters such as
Nominal = 809.4 mm; PSUB = 0.815 and GWF = 0.21. While a temperature rise has an impact
to evapotranspiration (increase about 0.5 %/month). From the models it was concluded that
land use and climate has a big impact to the catchment area therefore it was needed a good
control to reduce deforestation.
REFERENCES
[1] Arsyad, S. 2010. Soil and Water Conservation, Second Edition. IPB Press. Bogor
[2] Ammann, Caspar; et al. (2007). "Solar influence on climate during the past millennium:
Results from transient simulations with the NCAR Climate Simulation Model" (PDF).
Proceedings of the National Academy of Sciences of the United States of America 104 (10)
: 3713–371.
[3] Asdak, C. 2007. Hydrology and Watershed Management. UGM-Press, Yogyakarta.
[4] Asdak, Chay. 2010. Hydrology and Management of River Watershed: Revised Fifth
Edition. Yogyakarta: Gadjah Mada University Press
[5] Bardsley, W. E. & Purdie, J. M. (2007). An invalidation test for predictive models. Journal
of Hydrology, 2007(338), 57–62.
[6] Chow, V.T., Maidment, D.R., and Mays L.W. (1988), Applied hydrology, McGraw-Hill
Book Company, New York, St. Louis, etc .; 110-113.
[7] Festy Ratna Aditama. 2012. Transformation Hujan- Debit Watershed Dam Singomerto
Based Methods Mock, NRECA, Tank Model and Rainrun.
[8] Guobin FU, Michael E.B., and Shulin Chen. 2007. Impacts of Climate Change on Regional
Hydrological Regims in the Spokane River Watershed, Journal of Hydrologic Engineering.
12 (5): 452-461.
[9] Indarto. 2010. Hydrology: Basic Theory and Sampling Applications Hydrology Model. PT.
Bumi Aksara, Jakarta.
[10] IPCC (November 11, 2013): D.3 Detection and Attribution of Climate Change, in:
Summary for Policymakers (finalized version), p.15, in: IPCC AR5 WG1 2013
[11] I. Wayan Sutapa, Ishak M. Galib. 2016. Application of non-parametric test to detect trend
rainfall in Palu Watershed, Central Sulawesi, Indonesia. � International Journal of
Hydrology Science and Technology, Volume 6, Issue 3
[12] Kesuma, P.R., Wayudi, H.A., dan Suyanto, 2013, Application of Mock Method, NRECA,
Tank model and Rainrun in Trani Dam, Wonotoro, Sudangan and Walikan, Journal of Civil
Engineering Matrices, Vol.1, December 4,13,477
[13] Kuswadi, Didier. 2002. Discharge Estimation Model Based on climate on the Upland of
Ciliwung Watershed. Thesis Program Post Bachelor IPB. Bogor.
[14] N. Hadisusanto. 2006. Rainfall-River Flow Simulation Model as a function of Ground
Water Deposit, Disertation of Post Graduate of Brawijaya University. Malang
[15] Rudi Herman, M. S. Pallu, M. A. Thaha, R.T Lopa, June 2016. The Calibration Of
Discharge Model As An Impact Of Land Use And Climate Changed In Kodina Watershed,
The South Of Lake Poso, International Journal of Advances in Mechanical and Civil
Engineering, ISSN: 2394-2827 Volume-3, Issue-3, June-2016. pp 35 – 41.
[16] Rahman, Sulianto & Ernawan, 2009, Application of Tank Models on 3 (three) tanks
arrangement system for rainfall data transformation into river flow data, Thesis, Department
of Civil Engineering, FT-UMM.
[17] Setiawan, E., Sulistiyono, H., dan Budianto, M.B.,2006, NRECA Model Early Grading
Effect on Consistency of Calibration and Verification Results, Journal of Engineering
UNRAM, Vol. 7 No.1, pp. 24-31 April 2006 ISSN: 1411-5565
Rudi Herman, M. Saleh Pallu, M. Arsyad Thaha and Rita Tahir Lopa
http://www.iaeme.com/IJCIET/index.asp 686 [email protected]
[18] Preet Arora Change of Land Use and Its Implications in The Development Schemes of
Amritsar City. International Journal of Civil Engineering and Technology, 8(5), 2017,
pp.1347-1352.
[19] R. U. Enotoriuwa, E. O. Nwachukwu and J. N. Ugbebor, Assessment of Particulate Matter
Concentration Among Land Use Types In Obigbo and Environs In Rivers State Nigeria,
International Journal of Civil Engineering and Technology, 7(3), 2016, pp. 252–261.
[20] Setiawan, B.I., S. Shiozawa, Y. Sato. 2008. Environmental Changes and Sustainable
Development in Cidanau Watershed, Banten Province, Indonesia. JSPS-DGHE Core
University Program in Applied Biosciences. Published by the Graduate School of IPB and
IPB Press.
[21] Suroso, Hery, (2005), Influence of Land Use Change to Flood Debit of Banjaran River
Flood Area, Journal of Civil Engineering, Vol. 3, July 2, 2006
[22] Syukur, S. 2007. Repartition of Rainfall and Evapotranspiration to Assess Crop Water
Needs in Irrigation Dolago-Torue Regions. University Tadulako, Palu..
[23] Teddy W.S., 2000. Determination of Nreca Model Parameters in Natuna Island, Environtal
Tecnology Journal, Vol. 1, No. 3, December 200 : 252-257.