THE IMPACT OF MODERN RETAILING ON THE PRICES OF FAST MOVING CONSUMER GOODS: EVIDENCE FROM TURKEY A THESIS SUBMITTED TO THE GRADUATE SCHOOL OF SOCIAL SCIENCES OF MIDDLE EAST TECHNICAL UNIVERSITY BY HAKI PAMUK IN PARTIAL FULFILLMENT OF THE REQUIREMENTS FOR THE DEGREE OF MASTER OF SCIENCE IN THE DEPARTMENT OF ECONOMICS SEPTEMBER 2008
Transcript
THE IMPACT OF MODERN RETAILING ON THE PRICES OF FAST MOVING CONSUMER GOODS: EVIDENCE FROM TURKEY
A THESIS SUBMITTED TO THE GRADUATE SCHOOL OF SOCIAL SCIENCES
OF MIDDLE EAST TECHNICAL UNIVERSITY
BY
HAKI PAMUK
IN PARTIAL FULFILLMENT OF THE REQUIREMENTS FOR
THE DEGREE OF MASTER OF SCIENCE IN
THE DEPARTMENT OF ECONOMICS
SEPTEMBER 2008
Approval of the Graduate School of Social Sciences
Prof. Dr. Sencer Ayata
Director
I certify that this thesis satisfies all the requirements as a thesis for the degree of Master of Science.
Prof. Dr. Haluk Erlat Head of Department
This is to certify that I have read this thesis and that in my opinion it is fully adequate, in scope and quality, as a thesis for the degree of Master of Science.
Prof. Dr. Erol Taymaz Supervisor Examining Committee Members Prof. Dr. Erol Taymaz (METU, ECON)
Associate Prof. Dr. Serap Aşık Türüt (METU, ECON)
Associate Prof. Dr. Burak Günalp (H.U., ECON)
iii
I hereby declare that all information in this document has been obtained and presented in accordance with academic rules and ethical conduct. I also declare that, as required by these rules and conduct, I have fully cited and referenced all material and results that are not original to this work. Name Surname: Haki Pamuk
Signature :
iv
ABTRACT
THE IMPACT OF MODERN RETAILING ON THE PRICES OF FAST MOVING CONSUMER GOODS: EVIDENCE FROM TURKEY
Pamuk, Haki
Ms.c Department of Economics
Supervisor: Prof. Dr. Erol Taymaz
September 2008, 101 pages
In Turkey, the retailing sector is in a modernization process with the increase in the
market share of supermarkets since 1990s. This process has important implications
on general economy with changing consumption characteristics. This thesis analyzes
the impact of increasing market share of supermarkets on the prices of fast moving
consumer goods in traditional retailers. By means of a household panel, a panel data
econometric approach is used for assessing the impacts of different supermarket
formats between 2002 and 2006 in 12 sectors. The results indicates that increasing
market share supermarkets decreases the price levels observed in traditional retailers
in some of the sectors and these impacts vary according to supermarket formats and
A. TABLES ..................................................................................................... 46
B. FIGURES .................................................................................................... 82
viii
LIST OF TABLES
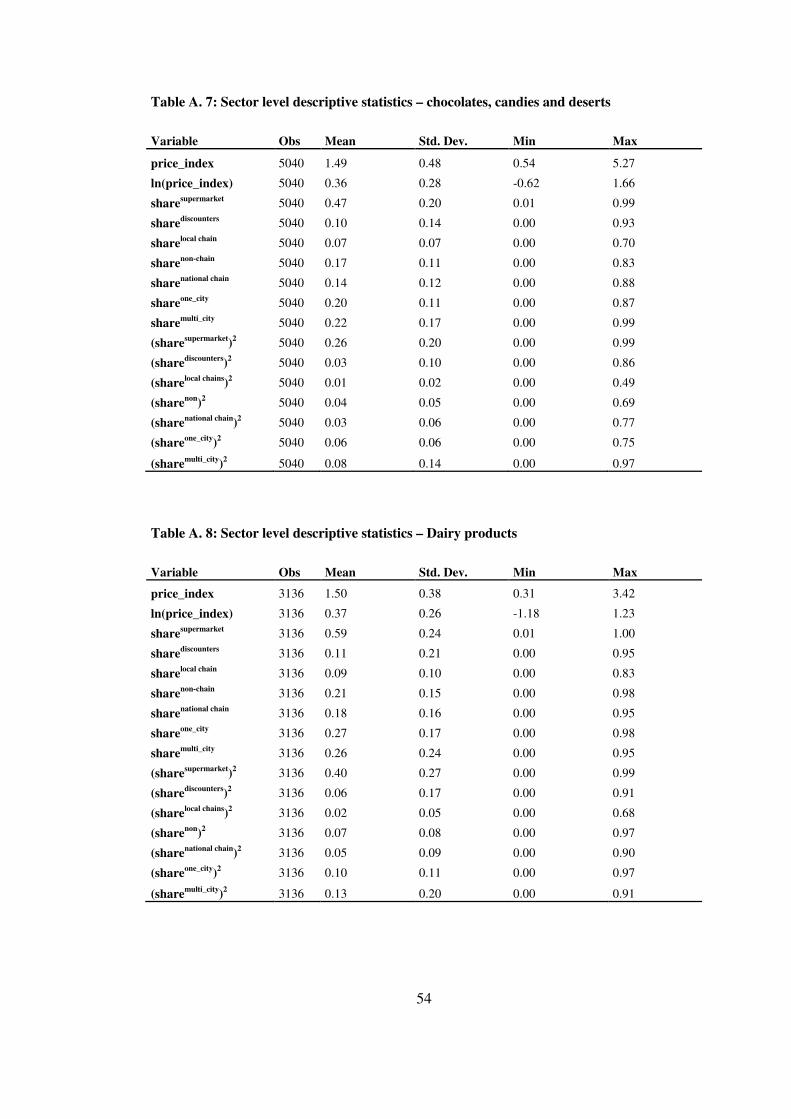
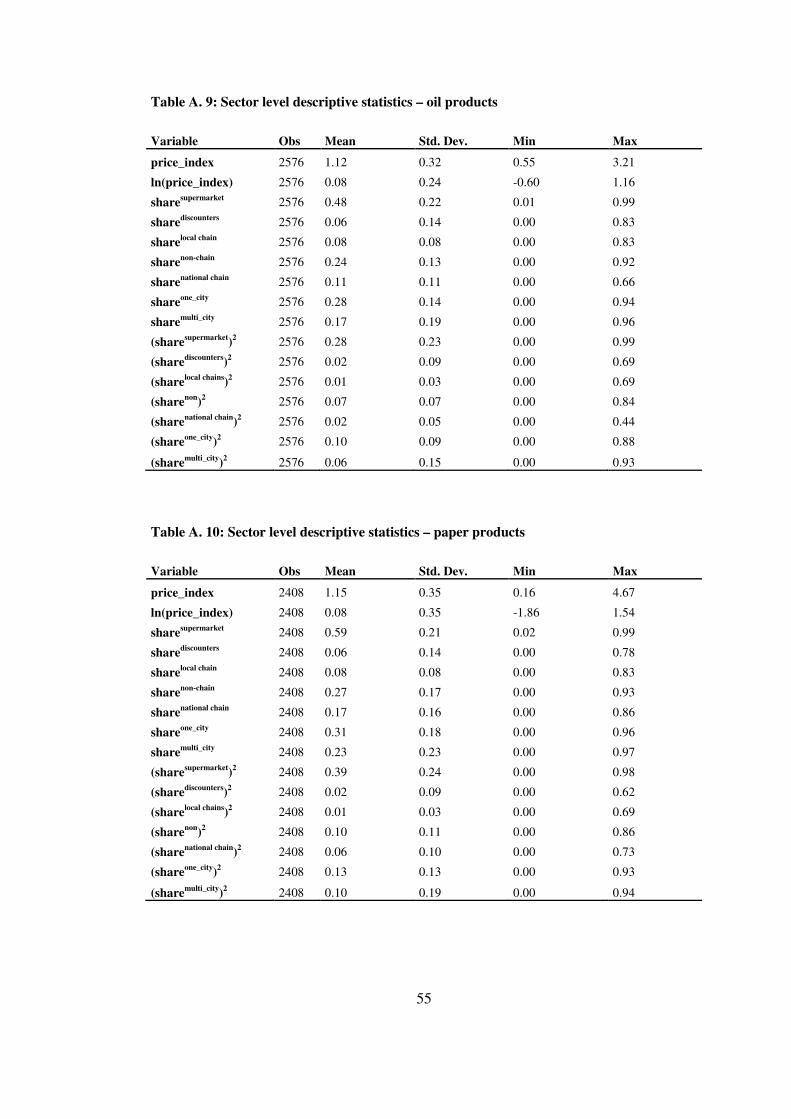
TABLES Table 4. 1: Breakdown for number of markets according to size, 1990-1997 ........... 18 Table 4. 2: Average relative price level of organized retailers relative to traditional stores ......................................................................................................... 27 Table 5. 1: Descriptive statistics of the variables –entire dataset used in the analysis ....................................................................................................................... 33 Table 5. 2: Summary results for the estimations-1 (price_index is the dependent variable)...................................................................................................................... 36 Table 5. 3: Summary results of the estimation-1 (ln(price_index) is the dependent variable)...................................................................................................................... 37 Table 5. 4: Summary results for the estimations-2 (price_index is the dependent variable)...................................................................................................................... 38 Table 5. 5: Summary results of the estimations-2 (ln(price_index) is the dependent variable) .................................................................................................... 39 Table A. 1: Sector names and corresponding product groups for FMCG ................. 46 Table A. 2: Store Classification by Names and Period (End Period shows the last month that the store is in Specification_3 classification)........................................... 47 Table A. 3: Sector level descriptive statistics - other products .................................. 52 Table A. 4: Sector level descriptive statistics - meat products .................................. 52 Table A. 5: Sector level descriptive statistics - food products ................................... 53 Table A. 6: Sector level descriptive statistics – beverages ........................................ 53 Table A. 7: Sector level descriptive statistics – chocolates, candies and deserts....... 54 Table A. 8: Sector level descriptive statistics – Dairy products ................................ 54 Table A. 9: Sector level descriptive statistics – oil products ..................................... 55 Table A. 10: Sector level descriptive statistics – paper products ............................... 55
ix
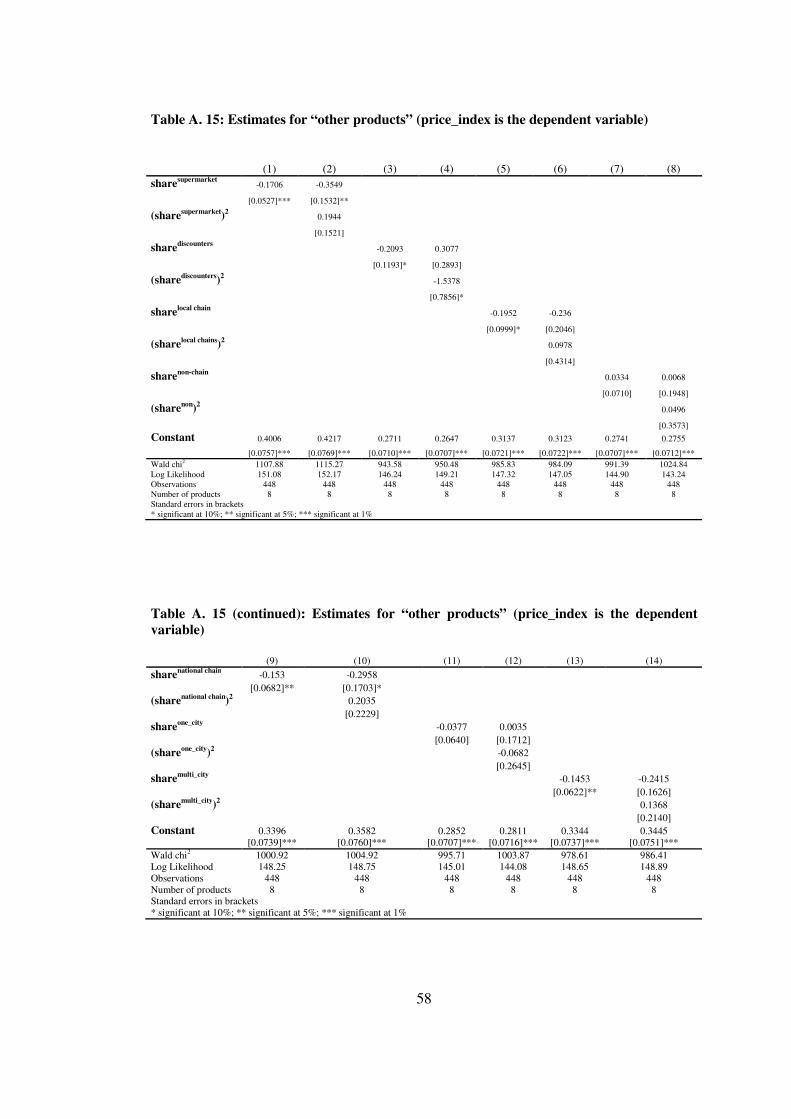
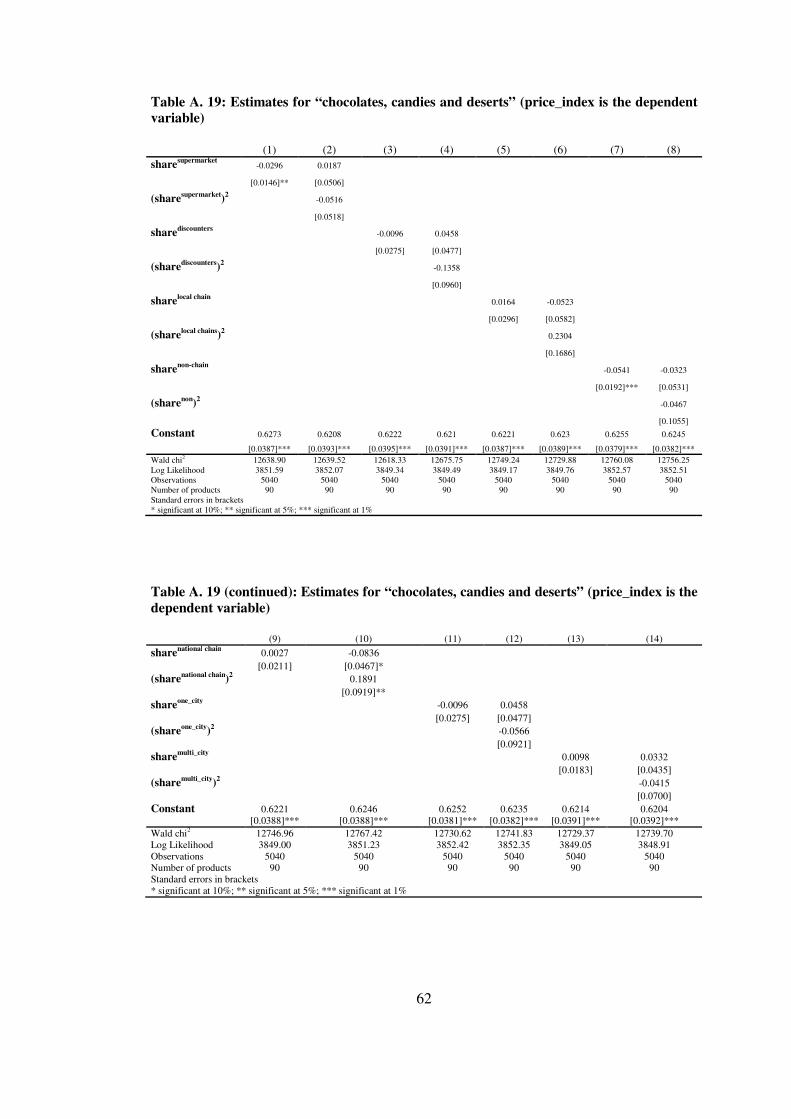
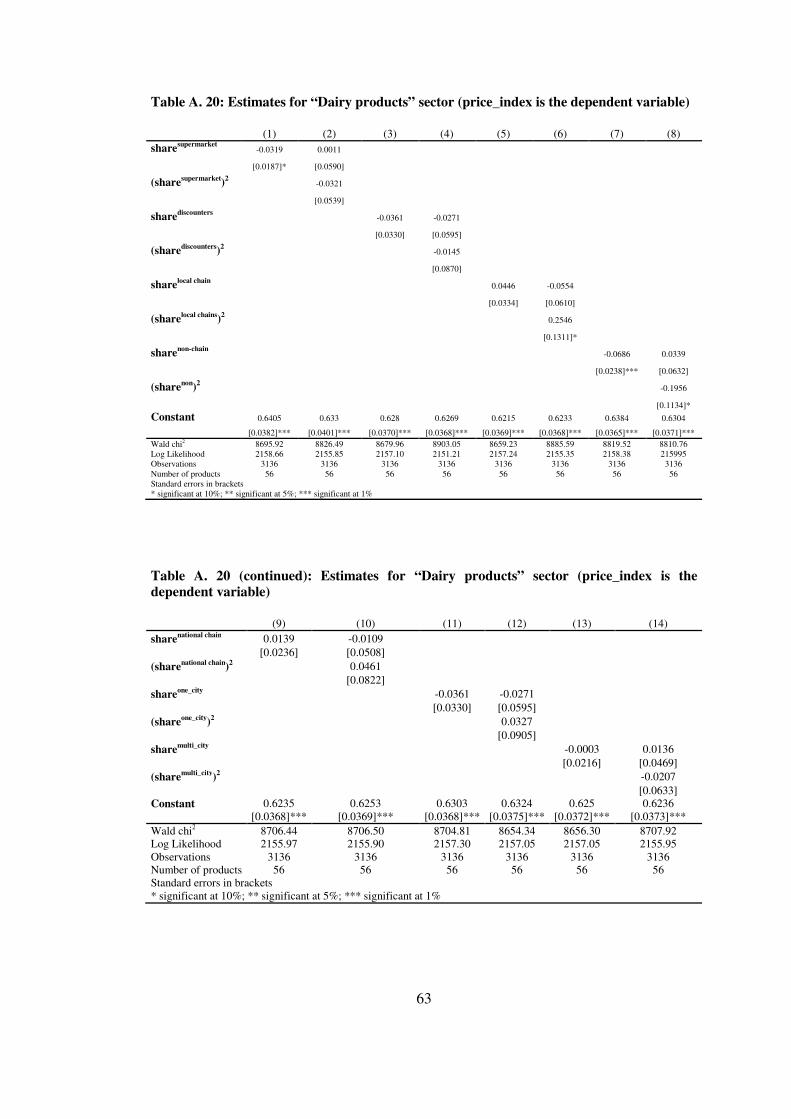
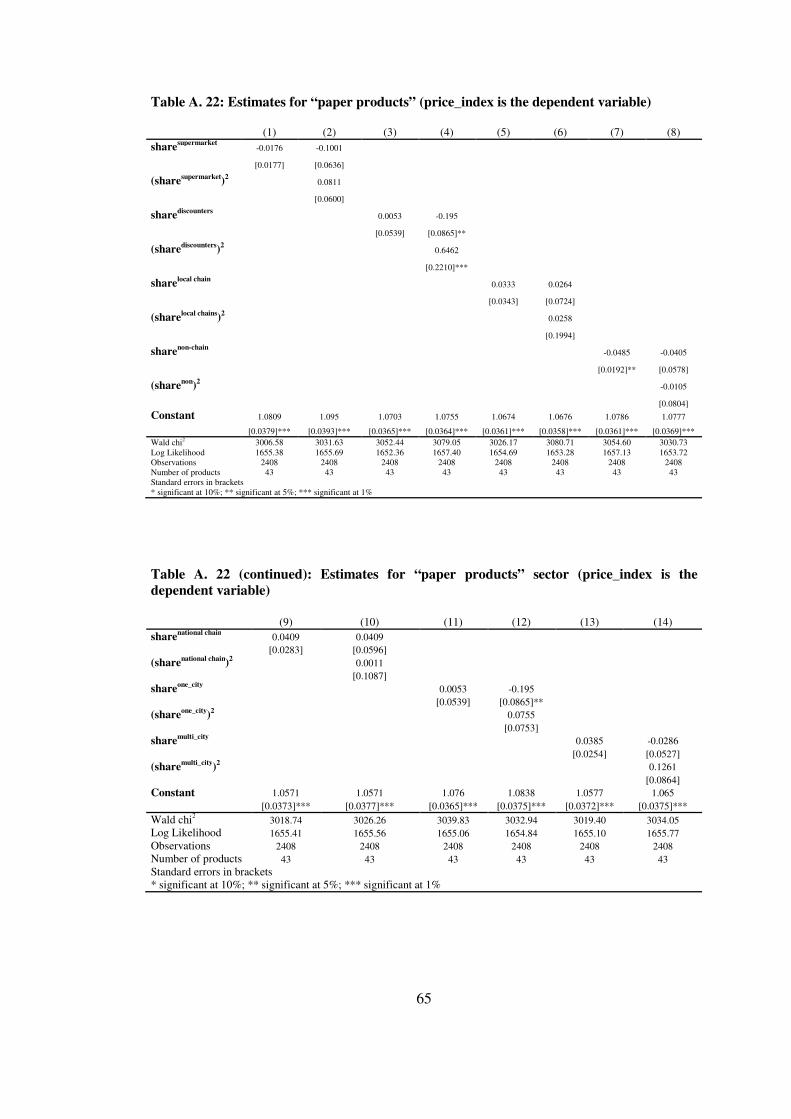
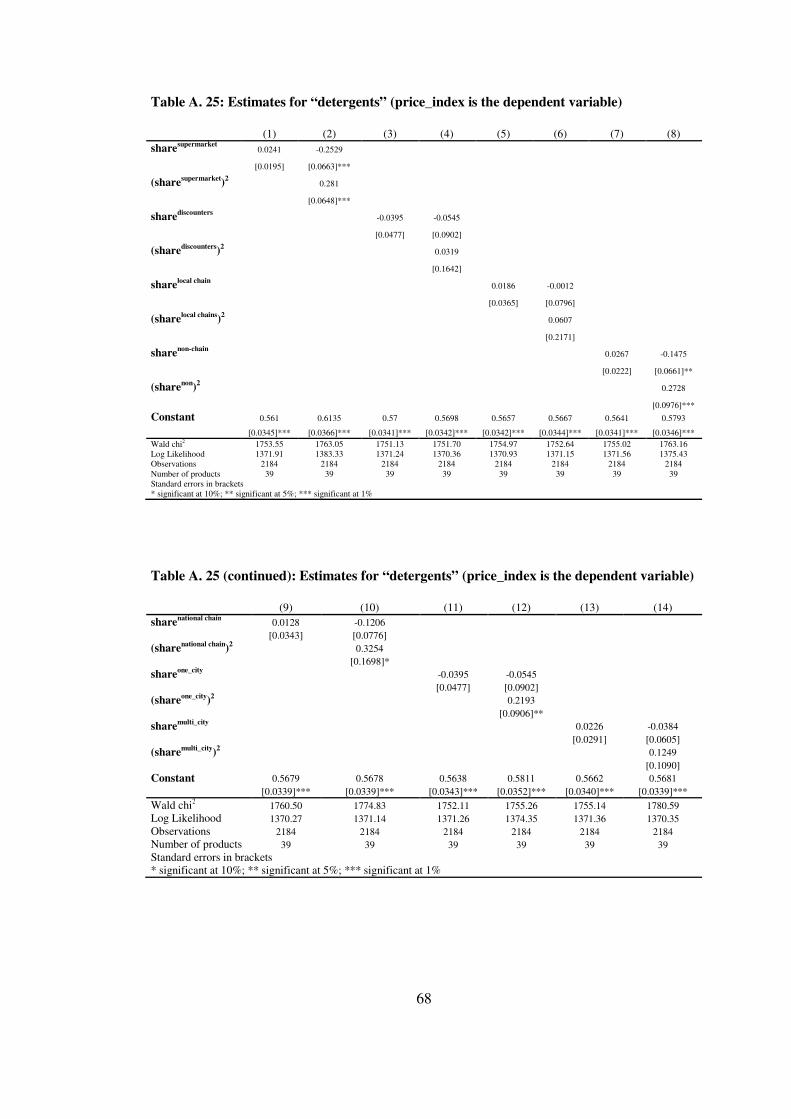
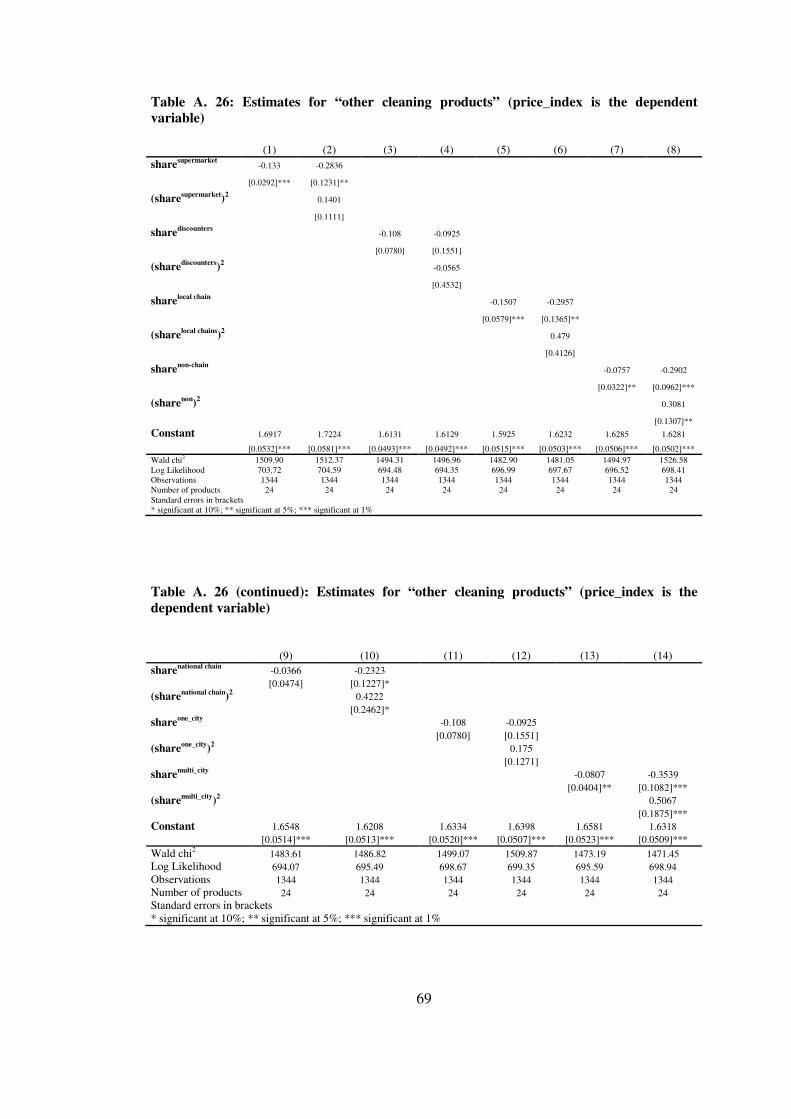
Table A. 11: Sector level descriptive statistics – hair products ................................. 56 Table A. 12: Sector level descriptive statistics – body products................................ 56 Table A. 13: Sector level descriptive statistics – detergents ...................................... 57 Table A. 14: Sector level descriptive statistics – other products ............................... 57 Table A. 15: Estimates for “other products” (price_index is the dependent variable)...................................................................................................................... 58 Table A. 16 : Estimates for “meat products” (price_index is the dependent variable)...................................................................................................................... 59 Table A. 17: Estimates for “food products” (price_index is the dependent variable)...................................................................................................................... 60 Table A. 18: Estimates for “beverages” (price_index is the dependent variable) ..... 61 Table A. 19: Estimates for “chocolates, candies and deserts” (price_index is the dependent variable) .................................................................................................... 62 Table A. 20: Estimates for “Dairy products” sector (price_index is the dependent variable)...................................................................................................................... 63 Table A. 21: Estimates for “oil products” (price_index is the dependent variable) .. 64 Table A. 22: Estimates for “paper products” (price_index is the dependent variable)...................................................................................................................... 65 Table A. 23: Estimates for “hair products” (price_index is the dependent variable)...................................................................................................................... 66 Table A. 24: Estimates for “body products” (price_index is the dependent variable)...................................................................................................................... 67 Table A. 25: Estimates for “detergents” (price_index is the dependent variable) ..... 68 Table A. 26: Estimates for “other cleaning products” (price_index is the dependent variable) .................................................................................................... 69 Table A. 27: Estimates for “other products” (ln(price_index) is the dependent variable)...................................................................................................................... 70 Table A. 28 : Estimates for “meat products” (ln(price_index) is the dependent variable)...................................................................................................................... 71
x
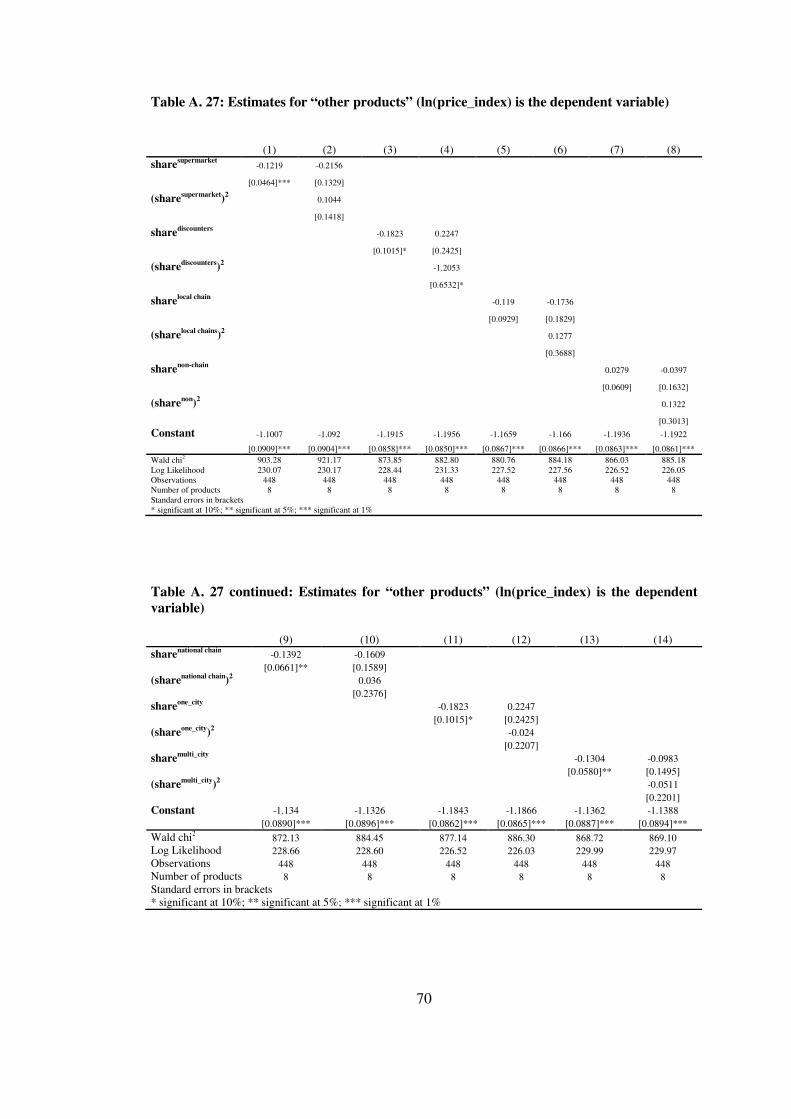
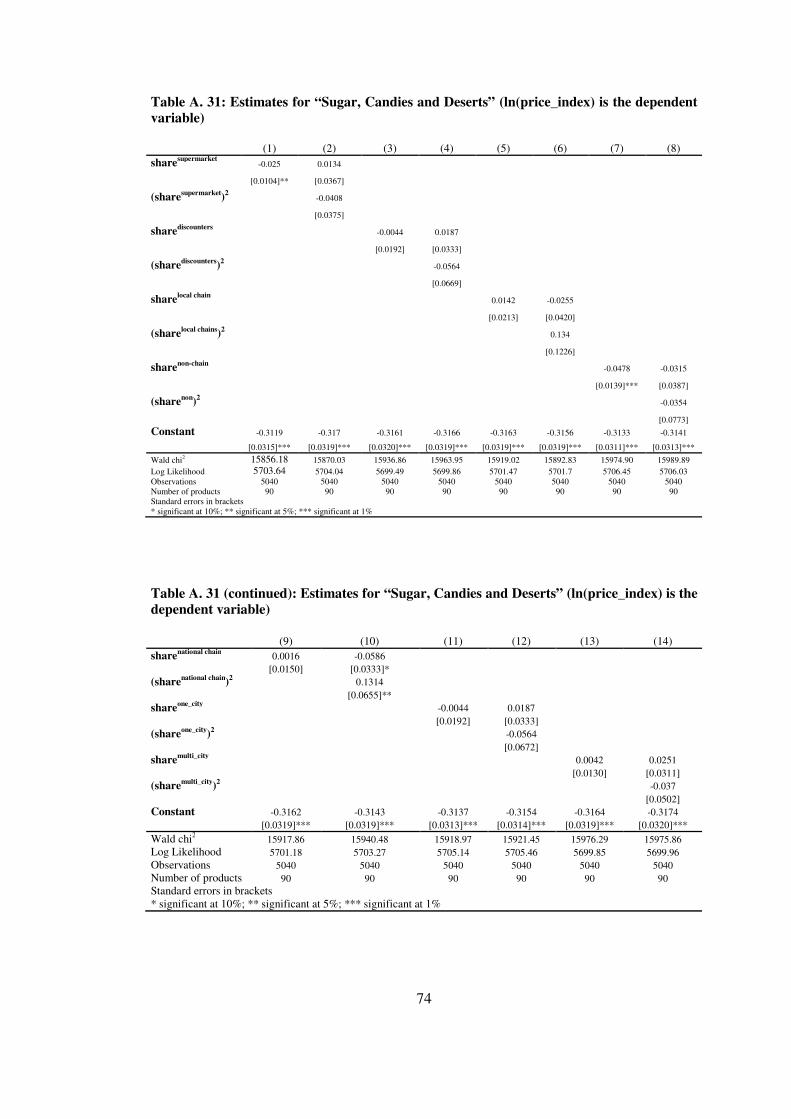
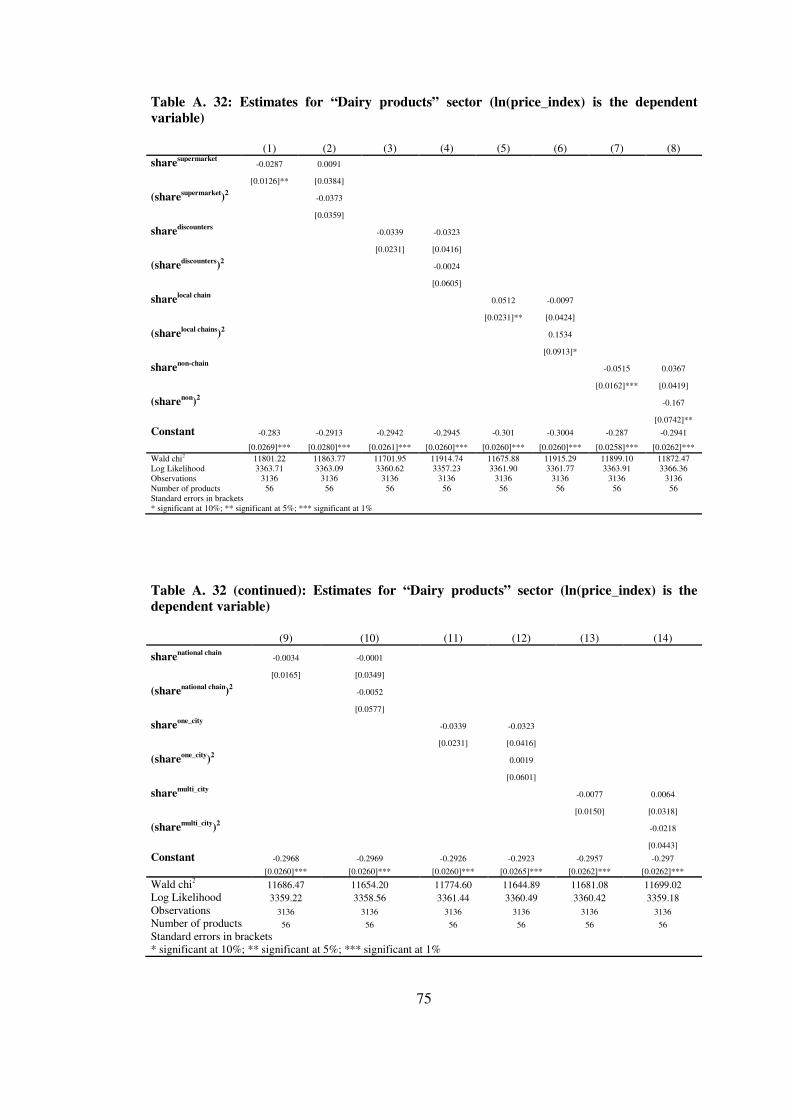
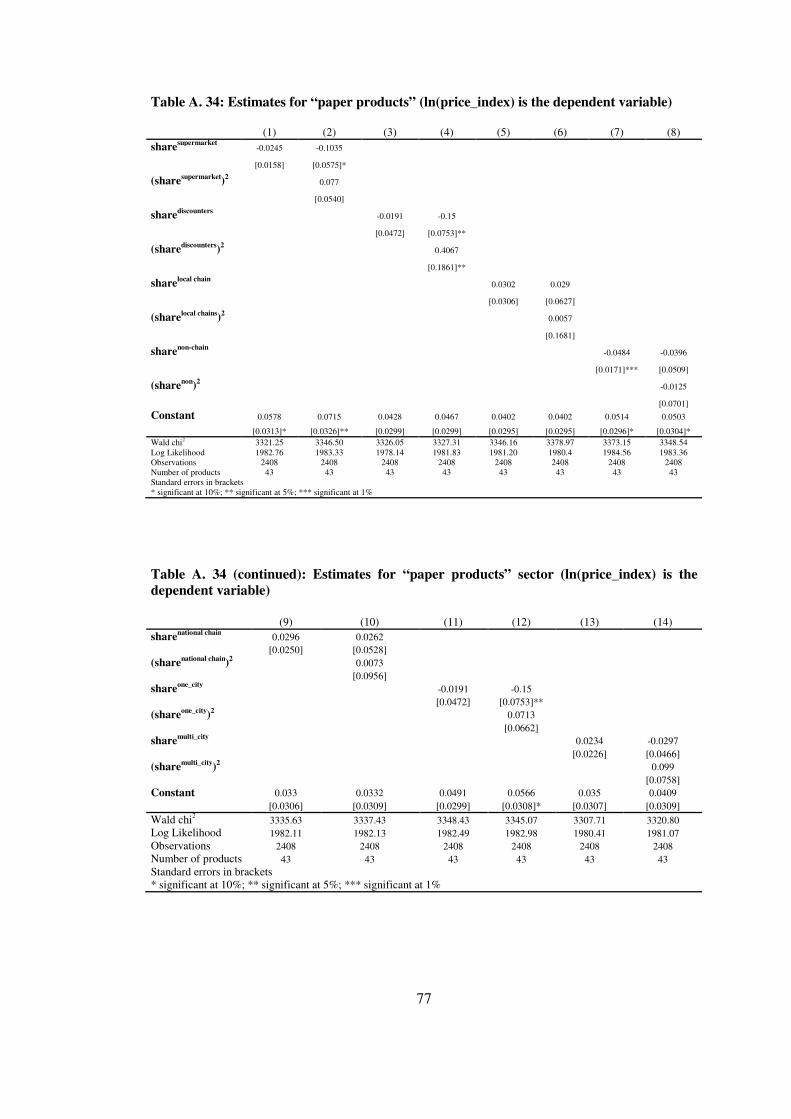
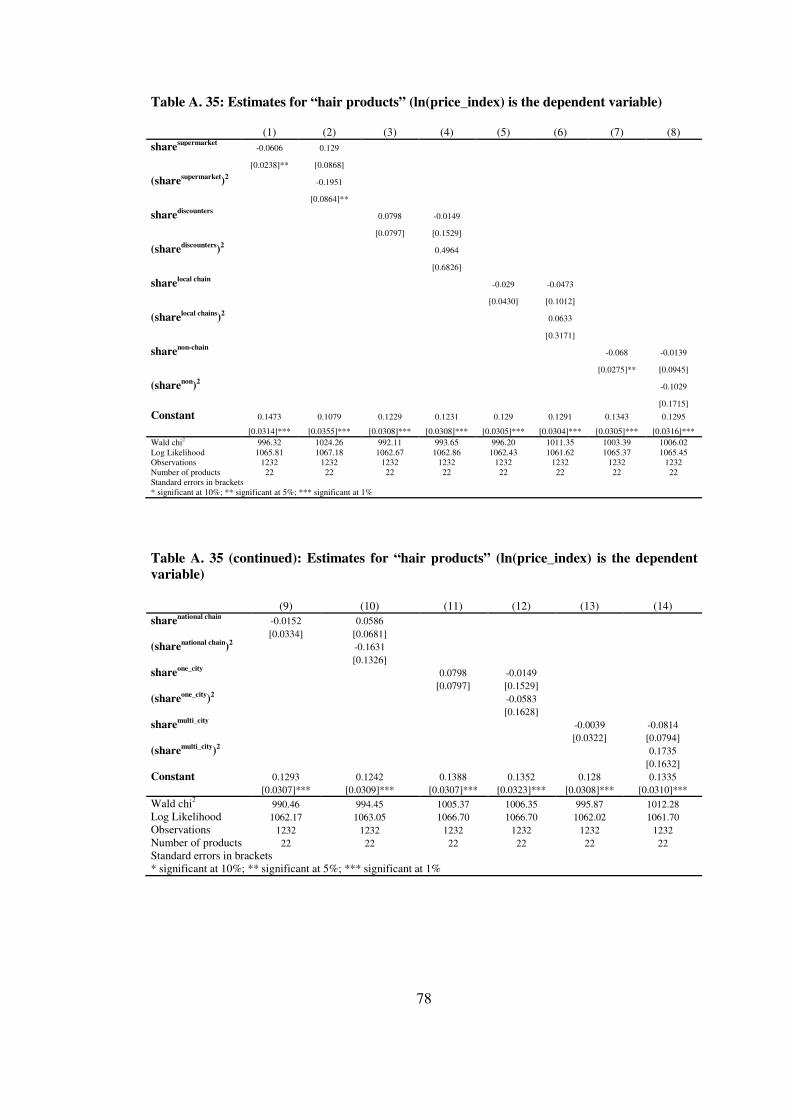
Table A. 29: Estimates for “food products” (ln(price_index) is the dependent variable)...................................................................................................................... 72 Table A. 30: Estimates for “Beverages” (ln(price_index) is the dependent variable)...................................................................................................................... 73 Table A. 31: Estimates for “Sugar, Candies and Deserts” (ln(price_index) is the dependent variable) .................................................................................................... 74 Table A. 32: Estimates for “Dairy products” sector (ln(price_index) is the dependent variable) .................................................................................................... 75 Table A. 33: Estimates for “oil products” (ln(price_index) is the dependent variable)...................................................................................................................... 76 Table A. 34: Estimates for “paper products” (ln(price_index) is the dependent variable)...................................................................................................................... 77 Table A. 35: Estimates for “hair products” (ln(price_index) is the dependent variable)...................................................................................................................... 78 Table A. 36: Estimates for “body products” (ln(price_index) is the dependent variable)...................................................................................................................... 79 Table A. 37: Estimates for “detergents” (ln(price_index) is the dependent variable)...................................................................................................................... 80 Table A. 38: Estimates for “other cleaning products” (ln(price_index) is the dependent variable) .................................................................................................... 81
xi
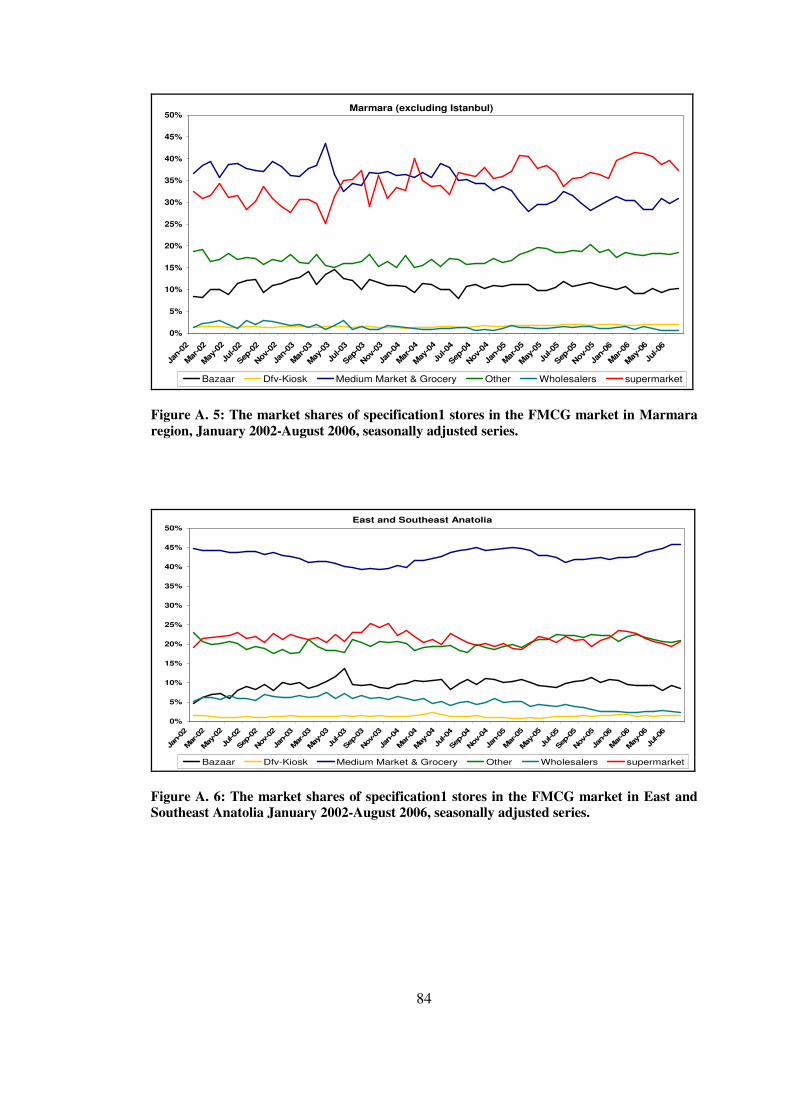
LIST OF FIGURES FIGURES Figure 4. 1: Trends in the Number of Modern and Traditional Retailers (1998=100) ................................................................................................................ 19 Figure 4. 2: The developments in market shares of retailers in the FMCG market, January 2002-August 2008, seasonally adjusted series. ............................................ 21 Figure 4. 3: The market shares of supermarket format in the FMCG market, January 2002-August 2008, seasonally adjusted series. ............................................ 22 Figure 4. 4: The market shares of city-based supermarket formats in the FMCG market, January 2002-August 2008, seasonally adjusted series. ............................... 23 Figure 4. 5: The share of regions in total FMCG consumption for selected regions-1, January 2002-August 2006, seasonally adjusted series. ........................... 24 Figure 4. 6: The share of regions in total FMCG consumption for selected regions-2, January 2002-August 2006, seasonally adjusted series. ........................... 25 Figure A. 1: The market shares of specification1 stores in the FMCG market in Istanbul, January 2002-August 2006, seasonally adjusted series. ............................. 82 Figure A. 2: The market shares of specification1 stores in the FMCG market in Ankara, January 2002-August 2006, seasonally adjusted series ............................... 82 Figure A. 3: The market shares of specification1 stores in the FMCG market in Izmir, January 2002-August 2006, seasonally adjusted series. .................................. 83 Figure A. 4: The market shares of specification1 stores in the FMCG market in Mediterranean region, January 2002-August 2006, seasonally adjusted series ......... 83 Figure A. 5: The market shares of specification1 stores in the FMCG market in Marmara region, January 2002-August 2006, seasonally adjusted series. ................ 84 Figure A. 6: The market shares of specification1 stores in the FMCG market in East and Southeast Anatolia January 2002-August 2006, seasonally adjusted series. .......................................................................................................................... 84 Figure A. 7: The market shares of specification1 stores in the FMCG market in Central Anatolia, January 2002-August 2006, seasonally adjusted series. ................ 85
xii
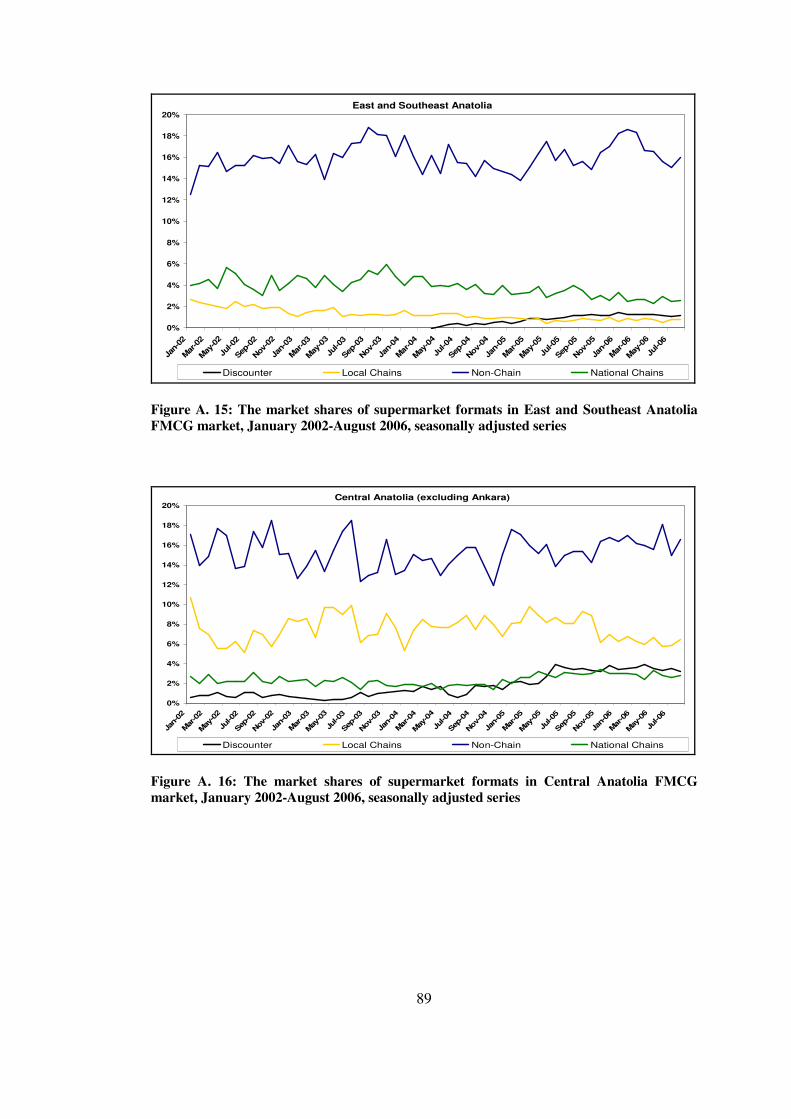
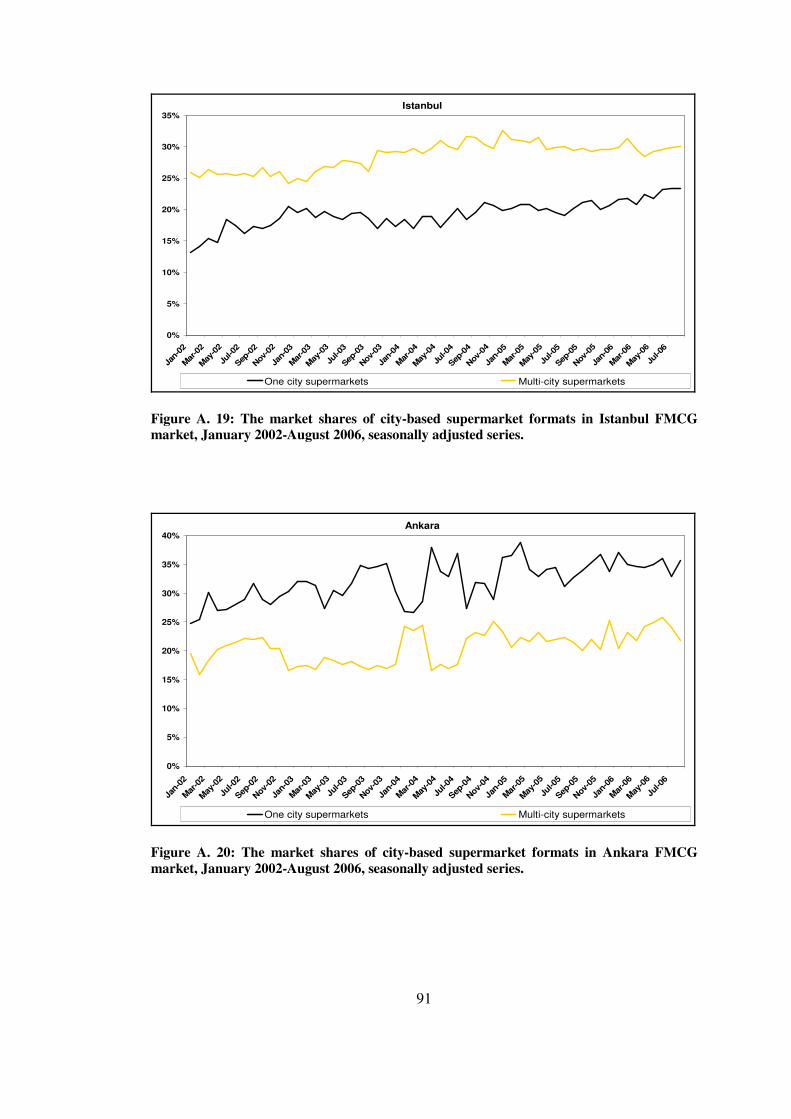
Figure A. 8: The market shares of specification1 stores in the FMCG market in Blacksea region, January 2002-August 2006, seasonally adjusted series. ................. 85 Figure A. 9: The market shares of specification 1 stores in the FMCG market in Central Anatolia, January 2002-August 2006, seasonally adjusted series. ................ 86 Figure A. 10: The market shares of supermarket formats in Istanbul FMCG market, January 2002-August 2006, seasonally adjusted series ................................ 86 Figure A. 11: The market shares of supermarket formats in Ankara FMCG market, January 2002-August 2006, seasonally adjusted series ................................ 87 Figure A. 12: The market shares of supermarket formats in Izmir FMCG market, January 2002-August 2006, seasonally adjusted series ............................................. 87 Figure A. 13: The market shares of supermarket formats in Mediterranean FMCG market, January 2002-August 2006, seasonally adjusted series .................... 88 Figure A. 14: The market shares of supermarket formats in Marmara FMCG market, January 2002-August 2006, seasonally adjusted series ................................ 88 Figure A. 15: The market shares of supermarket formats in East and Southeast Anatolia FMCG market, January 2002-August 2006, seasonally adjusted series ..... 89 Figure A. 16: The market shares of supermarket formats in Central Anatolia FMCG market, January 2002-August 2006, seasonally adjusted series .................... 89 Figure A. 17: The market shares of supermarket formats in Blacksea FMCG market, January 2002-August 2006, seasonally adjusted series ................................ 90 Figure A. 18: The market shares of supermarket formats in Aegean region FMCG market, January 2002-August 2006, seasonally adjusted series .................... 90 Figure A. 19: The market shares of city-based supermarket formats in Istanbul FMCG market, January 2002-August 2006, seasonally adjusted series. ................... 91 Figure A. 20: The market shares of city-based supermarket formats in Ankara FMCG market, January 2002-August 2006, seasonally adjusted series. ................... 91 Figure A. 21: The market shares of city-based supermarket formats in Izmir FMCG market, January 2002-August 2006, seasonally adjusted series. ................... 92 Figure A. 22: The market shares of city-based supermarket formats in Mediteranean Region FMCG market, January 2002-August 2006, seasonally adjusted series. ........................................................................................................... 92 Figure A. 23: The market shares of city-based supermarket formats in Marmara FMCG market, January 2002-August 2006, seasonally adjusted series. ................... 93
xiii
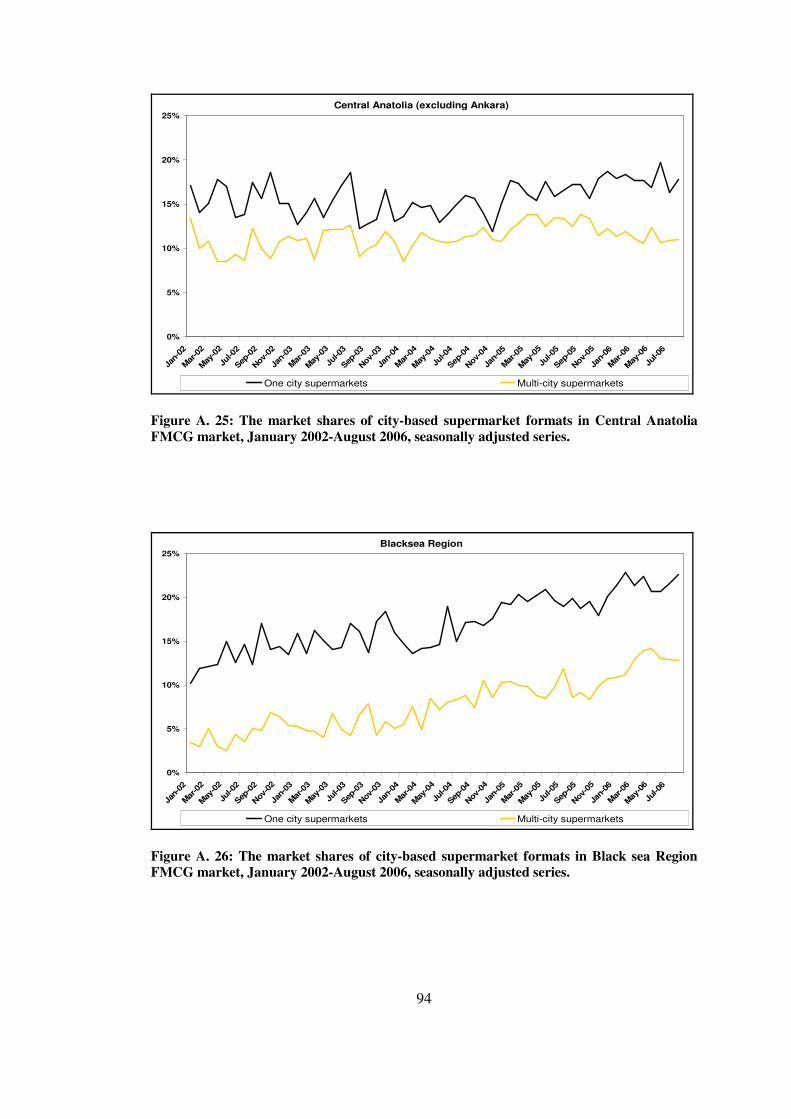
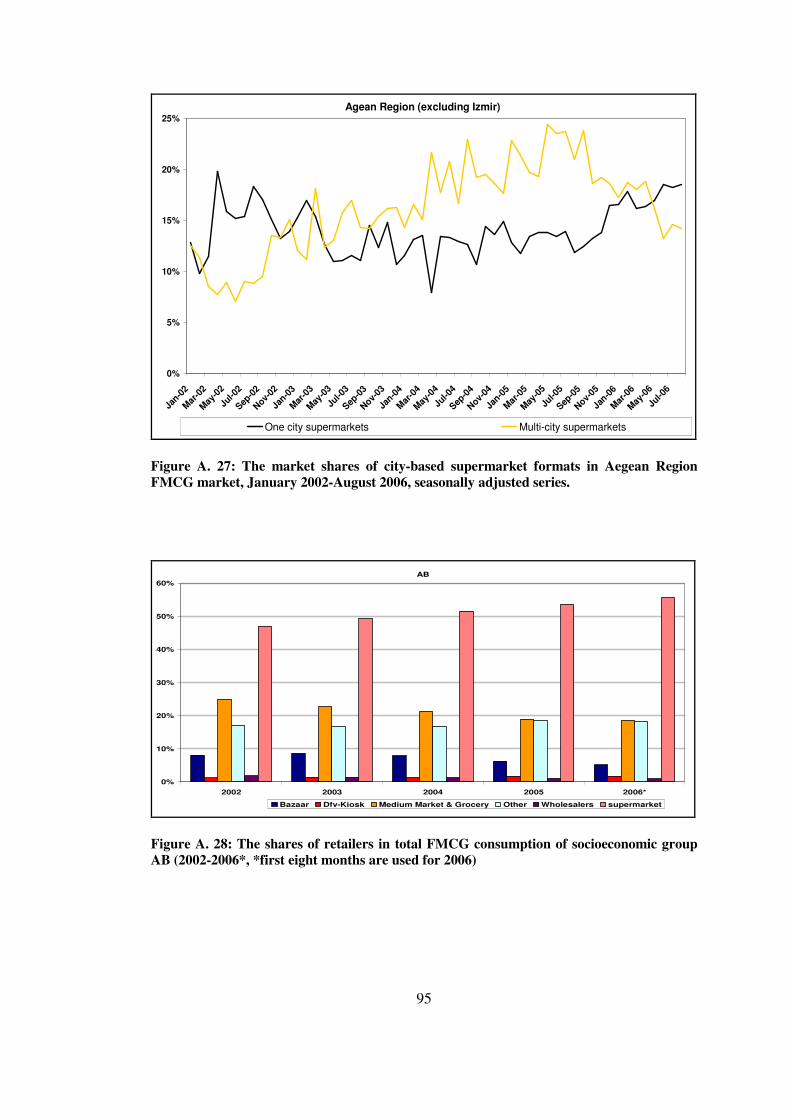
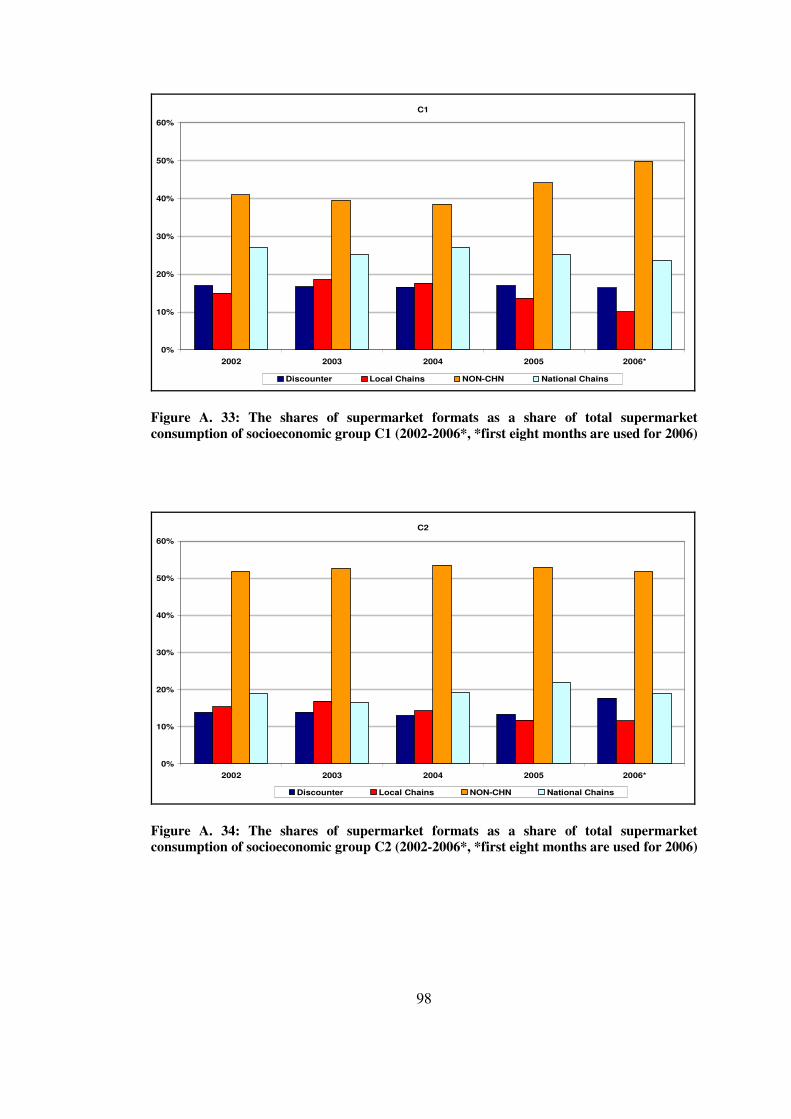
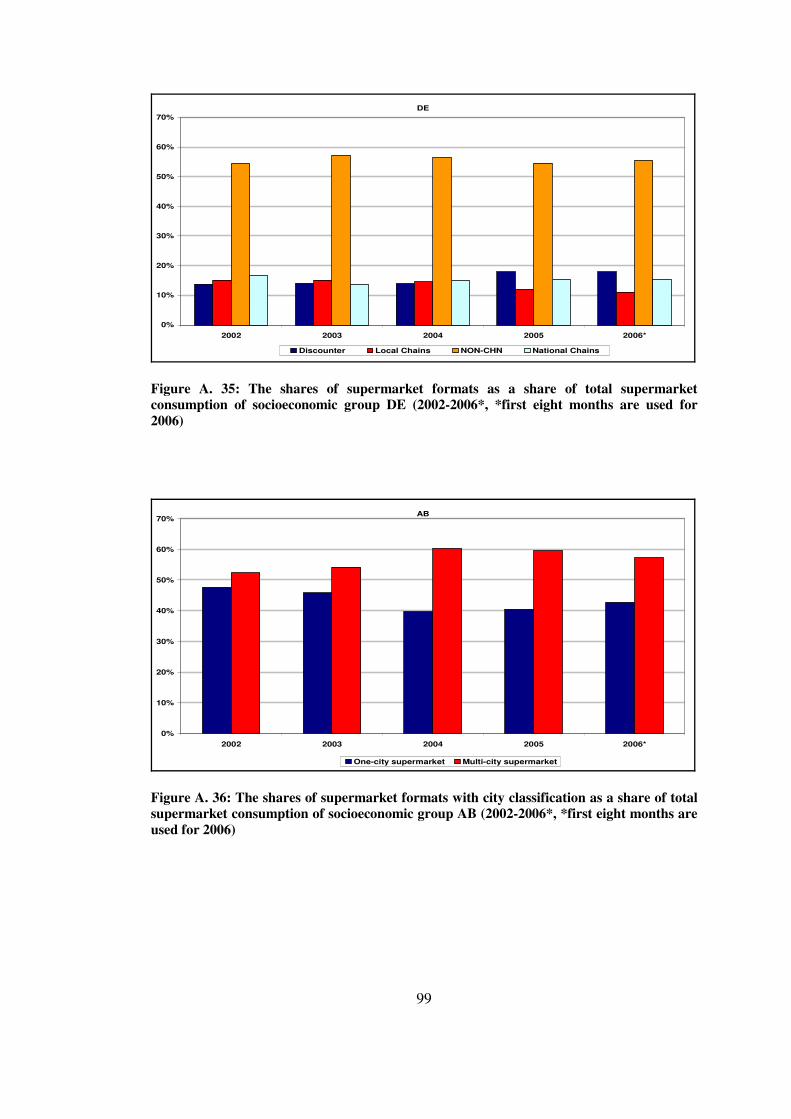
Figure A. 24: The market shares of city-based supermarket formats in East and Southeast Anatolia FMCG market, January 2002-August 2006, seasonally adjusted series. ........................................................................................................... 93 Figure A. 25: The market shares of city-based supermarket formats in Central Anatolia FMCG market, January 2002-August 2006, seasonally adjusted series. .... 94 Figure A. 26: The market shares of city-based supermarket formats in Blacksea Region FMCG market, January 2002-August 2006, seasonally adjusted series. ...... 94 Figure A. 27: The market shares of city-based supermarket formats in Agean Region FMCG market, January 2002-August 2006, seasonally adjusted series. ...... 95 Figure A. 28: The shares of retailers in total FMCG consumption of socioeconomic group AB (2002-2006*, *first eight months are used for 2006) ....... 95 Figure A. 29: The shares of retailers in total FMCG consumption of socioeconomic group C1 (2002-2006*, *first eight months are used for 2006) ........ 96 Figure A. 30: The shares of retailers in total FMCG consumption of socioeconomic group C2 (2002-2006*, *first eight months are used for 2006) ........ 96 Figure A. 31: The shares of retailers in total FMCG consumption of socioeconomic group DE (2002-2006*, *first eight months are used for 2006) ....... 97 Figure A. 32: The shares of supermarket types as a share of total supermarket consumption of socioeconomic group AB (2002-2006*, *first eight months are used for 2006) ............................................................................................................ 97 Figure A. 33: The shares of supermarket formats as a share of total supermarket consumption of socioeconomic group C1 (2002-2006*, *first eight months are used for 2006) ............................................................................................................ 98 Figure A. 34: The shares of supermarket formats as a share of total supermarket consumption of socioeconomic group C2 (2002-2006*, *first eight months are used for 2006) ............................................................................................................ 98 Figure A. 35: The shares of supermarket formats as a share of total supermarket consumption of socioeconomic group DE (2002-2006*, *first eight months are used for 2006) ............................................................................................................ 99 Figure A. 36: The shares of supermarket formats with city classification as a share of total supermarket consumption of socioeconomic group AB (2002-2006*, *first eight months are used for 2006) ................................................. 99
xiv
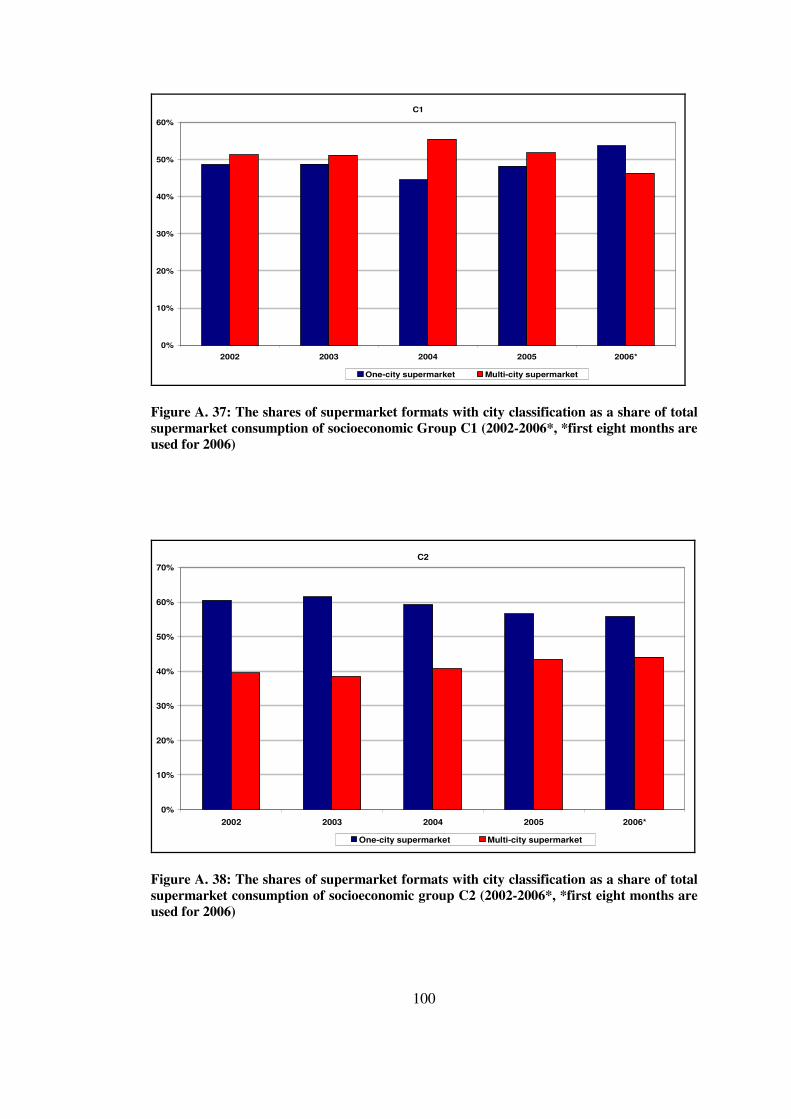
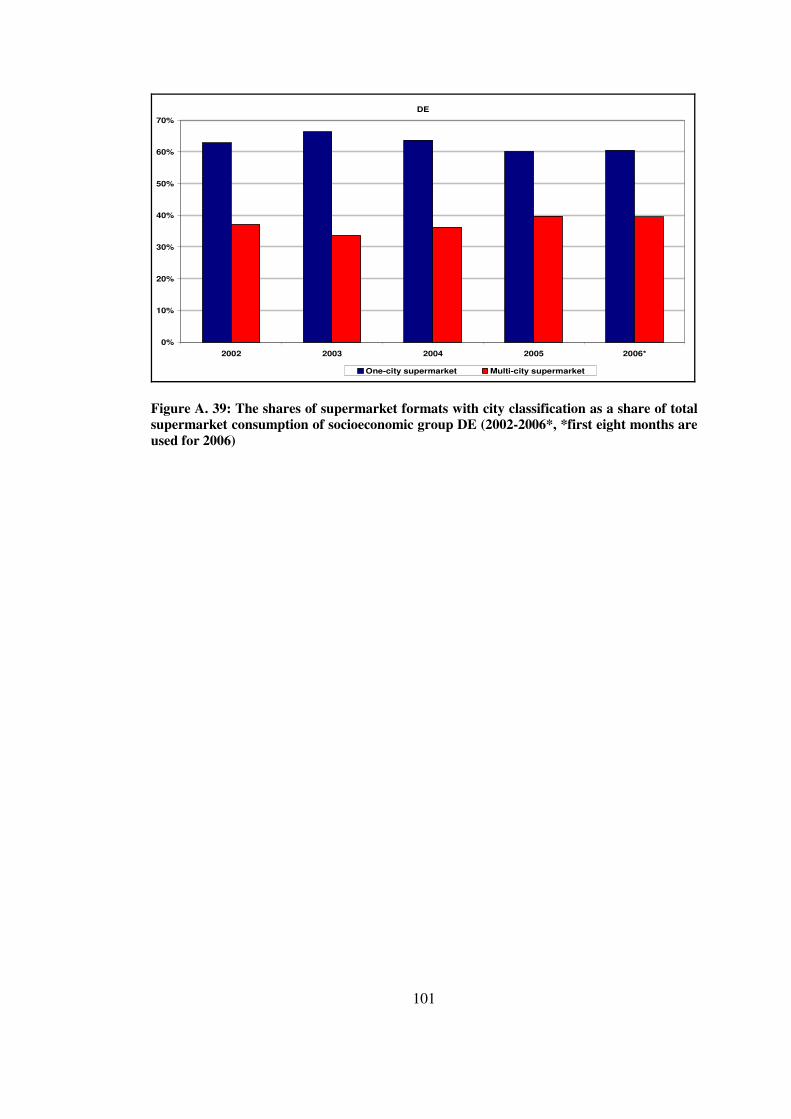
Figure A. 37: The shares of supermarket formats with city classification as a share of total supermarket consumption of socioeconomic Group C1 (2002-2006*, *first eight months are used for 2006) ............................................... 100 Figure A. 38: The shares of supermarket formats with city classification as a share of total supermarket consumption of socioeconomic group C2 (2002-2006*, *first eight months are used for 2006) ............................................... 100 Figure A. 39: The shares of supermarket formats with city classification as a share of total supermarket consumption of socioeconomic group DE (2002-2006*, *first eight months are used for 2006) ............................................... 101
1
CHAPTER 1
INTRODUCTON There is an important transformation in retailing around the world with the increase of
chains and introduction of larger stores, hypermarkets especially. This process has
important impacts on economic activities at macro and micro levels. In Turkey where
such a process is also seen, traditional retailers leaving its place to organized retailers
having varying structures, stores and formats including discounter, Non-chains, Local
chains, National chains, one-city and multi-city supermarkets. Therefore, Turkey
becomes an important laboratory to study impacts of this process. In this study, one of
the most important effects of modern retailing on consumer welfare, the impact of this
transformation on price levels, is investigated by looking at the evidence in Fast Moving
Consumer Goods (FMCG) sector which consist of the products subject to daily
consumption such as foods, beverages, cleaning products excluding dresses and white
goods, etc. The results point out that increasing market shares of supermarkets have
significant negative effects on the price levels in traditional retailers for specific sectors.
There is evidence in the literature about the impacts of different supermarket formats,
chains and hypermarkets on different parts of the economy. But there are few empirical
studies about their impacts on price levels. Previous studies investigating the impacts of
organized retailers on the economy mainly focus on productivity changes, buyer power
and competition policy issues. Studies about the impact of modern retailing on price
levels focus on the impact of hypermarkets such as Wal-Mart but not other general
supermarket types such as Discounters, Non-chains, Local chains etc. However,
organized retailers operate under a wide variety of store types each should have different
impacts on price levels. In addition, there is need to assess more deeply product choice
for the analysis since supermarkets can reduce price levels by selling cheaper, low
quality goods.
Ipsos-KMG Household Panel Data enable to analyze the prices of the goods at the brand
level and across different supermarket types for Turkey. Dataset includes daily FMCG
2
consumption of households with detailed information for the purchase, items,
households and stores. With some elimination and regrouping, database provides a
unique opportunity to assess effects of organized retailers on price levels at brand level
and across supermarket types.
According to this dataset it is evident that there is an important transformation in FMCG
retailing in Turkey starting with 1990s. Supermarkets in Turkey replace Medium Market
and Groceries and this trend can be observed for different regions and socioeconomic
groups in Turkey. Nevertheless, the supermarket types that are subject to analysis have
different market shares in different geographical regions and in the consumption bundles
of different socioeconomic groups. Especially, the loyalty of upper socioeconomic
groups in terms of specific supermarket types gives an idea about the service quality and
other aspects of different formats directly related to their cost structure as well as the
price level. On the other hand, there is important evidence that supermarkets charge
lower prices relative to the traditional stores. Therefore, with increasing market share of
supermarket formats - consisting Discounters, Local chains, Non-chain, National chains,
one-city and multi-city supermarkets - a decrease in price levels should be expected. But
this movement will be dependent on different cost structure of different formats
The impacts of increasing market share of supermarket formats on price levels of
traditional retailers are studied in this study. To study these, first, the supermarket
formats that will be used in the analyses is determined and also new supermarket
definitions are created. In addition to that, the transformation in the retail market
structure is analyzed with special emphasis on the changing role of supermarket and
different supermarket formats as subgroups of it. Related with this issue, regional
differentiation in market structures and effects of socioeconomic characteristic on store
choice of households are also explored.
Finally, the impact of increasing market share of supermarkets on the price level of the
products sold in traditional retailers is examined with a panel data econometric analysis.
In this analysis, market share of each supermarket format is calculated by using the
household consumption panel. The impact of the change in market share of supermarkets
on the price level of the products in traditional stores is investigated for different sectors.
A panel data econometric analysis is used for the estimations. The results showed that
3
supermarkets have a negative impact on the price levels in traditional stores but impact
level varies according to different supermarket formats and sectors.
The study summarizing these results is organized as follows. In Chapter 2, there will be
a brief overview of the literature on the impact of organized retailing to the economy. In
Chapter 3, the characteristics of the dataset are described. In Chapter 4, the structure of
the FMCG market and the role of retailers will be explained by using the dataset. Then
the impact of supermarkets on price levels will be investigated in Chapter 5.
4
CHAPTER 2
LITERATURE REVIEW The transformation of retail sector and its impacts on the economy is relatively a new
subject in microeconomics and industrial organization literature. These studies point out
three characteristics of retail chains that are effective on the general economy. First,
organized retailers bring competition to the market with their increasing market share.
Second effect is the superior productivity level of the organized retail chains relative to
the traditional stores. Last effect is the buyer power of larger chains leading to higher
bargaining power against suppliers and decrease in cost levels.
Related with these impacts, recent studies explore the effects of the hypermarkets on the
price levels and consumer welfare. To summarize the effects mentioned and their
relationship with the change in price levels, this chapter will first focus on the literature
discussing the relationship between competition and price levels and the role of retailers.
Then the evidence on productivity and buyer power effects of the modern retailers will
be summarized. Finally the planned contribution to the literature will be stated.
2.1 Competition and price levels In the literature, the studies’ focus about the relationship between competition and price
levels are concentrated mainly on the evidence from general economy but there is few
industry level studies as well. Previous studies found that the increased competition due
to entrance of the new firms into the market reduces price levels. There are also cross
country studies showing that differentiation in degree of competition level between
countries becomes a determinant in inflation rate differential and price dispersion in the
economies. Some empirical and theoretical studies also indicate the importance of
change in competition level in the market at industry level including two recent studies
by Basker (2005) and Lira et. al. (2005) about the effects of entrance of hypermarkets.
5
The causal link between the degree of competition in retail market and price levels at
macro level has been investigated in different empirical studies. Armstrong and Vickers
(1993) explored the effects of price discrimination practice of a dominant incumbent
firm facing competition from more than one market. They find that the prices in the
markets that incumbent firm competes in might fall with competition. Evidence about
this particular relationship is also found in ECB (2001) whose focus was on the
deregulation in network industries. This study indicates that deregulation bringing
competition to the network industries decreases average telecommunication and
electricity prices in Euro area. Another study about European economies also states that
one of the reasons of the price dispersion in the European common market is the
difference in the competition level in the economy (ECB, 2002).
Like the relationship between degree of competition in the economy and price levels,
there is also evidence about the relationship between product market competition and
inflation. Neiss (2001) tests the linkage between competition and inflation for twenty-
four OECD countries with a cross county analysis and found that with the increase in
product mark-up, inflation rate also increases. Cavelaars (2003) adds the role of product
market institutions to the analysis of former study by using economic regulation indexes
and more recent data. He finds that product market institutions also determine the
competitive behavior of firms and lead to a decrease in inflation rates. He also gives
special emphasis on the product market competition stating that it is a more important
factor than any other factor in explaining the differences in inflation rates. On this
particular emphasis, another study by Przybyla and Roma (2005) has been conducted.
They investigate degree of competition by using mark-up levels and suggest that
increase in the degree of competition in product markets leads to a decrease in the
inflation rates in EU-15 countries.
At industry level, the negative effects of an increase in competition level on price levels
have been also investigated in some empirical studies. Early studies by Marvel (1979)
and Coterill (1986) show that with the increase in the market concentration – i.e.
decrease in the competition level- the price level of the retailers also increases. A recent
study by Golbsee and Syverson (2004) also shows that entry of new airlines into flight
routes in the US reduced the price level of the incumbents vis-a vis the period before
entry.
6
In the case of retailers, two recent studies shed light on the relationship between price
levels and increasing competition by entrance of hypermarkets to the market. Basker
(2005) investigates the impacts of Wal-Mart’s entry to the retail sector in the U.S on the
general price levels. Basker investigates these by combining two data sets: U.S average
retail prices and opening dates of Wal-Mart stores. He finds that the prices for several
goods are decreased with the Wal-Mart’s entry to the market and this fall increased by 3-
4 times in the long-run as long as Wal-Mart is active in the specific market.
The second study about the effects of entrance of hypermarkets on price levels is
conducted for Chilean economy by Lira et al. (2005). They study the impacts of entry of
hypermarkets on regional relative price levels by using the regional price indices
supplied by national statistics institute and opening dates of supermarkets. The results
show that the entry of a new hypermarket reduced the price levels by around ten percent.
2.2 Productivity and buyer power effects of organized retailers It is expected and shown in empirical studies that high productivity level combined with
buyer power of organized retailers enable them to charge lower prices. Organized chains
have achieved high productivity growth with adaptation of technology. Putting together
this productive organization structure with buying power, modern retailers can charge
lower prices. Nevertheless, there is no directly related empirical study showing the effect
of these developments on price levels.
The commerce and services sectors have important contribution to the productivity
increases in the countries where studies showing the relationship between entry of
hypermarkets and decrease in price levels. For Chilean economy it was also shown that
the productivity growth in Chilean economy was driven largely by the commerce sector
(Vergara and Rivero, 2005). In the U.S case, service sector is found to be the major
driver of the productivity growth after mid 90s with high information technology usage
(Bosworth et. al.). On average, U.S productivity has grown annually by 2.88 percent
while this ratio increases to 5.33 and 5.37 percent in retail and wholesale sectors
respectively (Fernald and Ramnath, 2004). According to Holmes (2001) the reason
behind the high productivity growth in these sectors is the fact that retail sector made an
7
effectively uses of IT and this improves the logistic services and decreases the stock
costs.
The retail chains increase the productivity level of not only retailers but also the
suppliers of the retail chains. Dries, Reardon and Swinnen (2004), Swinnen et al. (2006),
Reardon and Berdegue (2002) and Reardon et al. (2003), Minten et al. (2006), Mattoo
and Payton (2007) explain the effects of entrance of foreign chains on the productivity
growth in agriculture sector supplying food products to retail sector. Javorcik and Li
(2008) reports that entry of global retail chains increases the productivity level of
suppliers in the case of Romania. They suggest that the entry of global retail chains may
transform retail sector and supplying industries. By triggering the modernization of
supplying industries, retail chains create positive externalities and these suppliers can
accommodate themselves with the distribution networks, IT usage and global sourcing of
global chains. According to report of Mc-Kinsey (2003) for Turkey, the main performing
difference between traditional retailers and organized chains is explained by their
efficiency differential in operations as former does not have organized relations with the
suppliers and have poor usage of logistics and IT services.
The literature points out that buyer power effect gives an important advantage to large
retail chains for charging lower prices. Large retail chains have an important bargaining
power over suppliers with their huge market shares and can obtain discounts on
transactions (Dobson Consulting, 1999). Reardon and Hopkins (2006) summarize this
change in the relations with suppliers with modernization of retailing as follows:
1. a shift from store-by-store procurement to centralised procurement via distribution centres; this tends to increase the geographical market-shed of procurement first to the country, then the region, then globally; the centralisation of procurement tends to reduce coordination costs and congestion diseconomies substantially, a gain that swamps increases in transport costs; this also allows purchase at mass scale, allowing stronger bargaining power with suppliers and reduction of per unit fixed costs of transaction; and 2. a shift from spot market procurement in traditional wholesale markets gradually toward procurement via specialized dedicated wholesalers and direct purchase
8
Related with these effects, the theoretical study of Dobson and Waterson (1997) suggests
that increased retailer concentration reduces the price level of monopoly suppliers and
only when retailers are very close substitutes, the decrease in the suppliers’ prices are
reflected to the consumer prices as a net decrease. About this issue, the case study of
Dobson Consulting Report (1999) points out that the net effect of increase in buyer
power will be positive for consumers because of decrease in prices unless there is no
barrier in the entry of other retailers.
There is no empirical study directly enlightening the effect of buyer power and
productivity increases on price levels. However Hausman and Leibtag (2005) find that
the increase in the market share of Wal-Mart has negative impact on price levels by two
channels one of which is the increase in competition but the other is the Wal-Mart’s low
cost structure enabling it to charge lower prices. They use AC Nielsen Household Panel
data for U.S and investigated the effects with average price level of different product
groups. The first channel for the downward pressure according to them is the increase in
the competition in the market because of a new entrant. It is found that by increasing
market share of Wal-Mart, the average price level of the same products sold in
traditional stores is negatively affected. Second, Wal-Mart charges relatively lower
prices leading to lower average price levels because of its high productivity level and
buyer power leading lower costs. The combination of these effects leads to increase in
consumer welfare according to their study and supporting the theory in the literature.
2.3 The contribution of the study There is little empirical evidence in the literature about the impacts of modernization in
retailing. This study aims to contribute to the existing literature focusing on Turkish
retailing. In the previous studies summarized above, the effects of modernization in
retailing on general economy are investigated heavily by empirical studies. However, the
effect of this process on price levels got relatively small attention in the literature mostly
because of the data scarcity. In previous studies, to overcome this problem, the consumer
price index and information about the entrance of the specific hypermarket to the market
data has been merged most of the time. Nevertheless, with this methodology, finding
outcomes for overall effect of modernization in retailing is not easy. Hausman and
Leibtag (2005) use household panel data to explore competition effect and other effects.
9
But in their study average price level of products in different brands is used which
misses the fact that Wal-Mart and other retail stores can decrease the prices they charge
by simply selling low quality goods or cheaper brands. Furthermore, in three previous
studies on this issue by Lira et al. (2005), Basker (2006), and Hausman and Leibtag
(2005), the impact of only hypermarkets (Wal-Mart is the only hypermarket for the two
researches that is done for U.S), are considered but different retail formats might have
different impacts on price levels because of the variation in their productivity level,
buying power and competitive power.
To extend existing literature, in this study the impacts of different retail types on the
price level of traditional retailers will be examined at brand level for different sectors. In
order to explore the effects of different retail types, the existing and new definitions of
organized retail types will be used in addition to an aggregate analysis. The effects of
these retail types will be studied with products of FMCG sector having same brands in
order to control for the product quality in entire Turkey.
10
CHAPTER 3
DATA DESCRIPTION The dataset that will be used in the analyses is Ipsos-KMG Household Panel Data. This
panel consists of the daily consumption of Fast Moving Consumer Goods (FMCG) of
households between 2000 and mid 2006 in Turkey. To explain the properties of data set
first the gathering methodology, time and geographical properties will be explained.
Then, variables of the dataset will be summarized in a more detailed way.
3.1 General Characteristics Data is collected by shopping reports filled by each household. Each household collects
the bill of each shopping, a visit to a store, and fill the forms given by the company with
the name, price and amount of the items that is purchased. Each week these forms and
bills are collected by the company but data is announced monthly. The bills are used for
checking the information about the items purchased is accurately filled in. Then database
is formed by items specific to the family, household and store.
Data set covers time period between January 2000 and August 2006 and each household
in the dataset represents a constant amount of households in Turkey having same
characteristics. Until 2002 data was collected from the towns of 14 cities whose
population is 25000 and above. Therefore dataset can only represent a smaller portion of
Turkish population. 6.5 million households can be represented at most in 14 major cities.
Starting with 2002, the number of cities where data is collected increased year by year in
order to represent the entire Turkish population. With this modification, dataset
represents entire population by covering 17 million households.
In descriptive statistics, regional classification will be used for geographic distinction.
Data are in collected more than 20 cities. However, data from cities do not represent the
consumption characteristics of each city except three most populated cities since
household from these small cities are not sampled by taking household characteristics of
11
the cities that they live in. But these household are chosen in order to represent regional
household characteristics where these households belong. Another important reason why
cities are not used as unit of analyses is the fact that some cities are added to the data set
after 4 or 5 years although by sampling methodology the region they belong to
represented in the dataset starting with 2002. For this reason, a new regional variable
named region code is created by using the regional classification in the dataset. In the
classification, three largest cities of Turkey are separated from their original regions and
9 regions are created which are: Istanbul, Ankara, Izmir, Mediterranean, Marmara
(excluding Istanbul), East and Southeast Anatolia, Central Anatolia (excluding Ankara),
Black sea and Aegean region (excluding Izmir).
In the dataset, there are four different categories of variables: (1) Variables related with
purchase, (2) variables related with the household that purchase the goods, (3) variables
related with the items that are purchased and (4) the store where household purchase the
goods. Those variable categories will be explained below.
3.2 Purchase In the dataset, each item purchased have exact shopping characteristics. For each item
purchased, the daily date of the purchase, price of items and the amount- number of item
purchased1 of transaction exists. By multiplying price level and transaction amount, the
value of each purchase can be found2.
3.3 Items
The dataset gives exact properties of the items that are purchased. There are 78777 items
observed between 2000 and 2006 which are coded according to various properties. First,
items are coded according to their major sector and sub sectors. Second, items are coded
by using the information about its producer and the brand of the item. Although the exact
name of the company, brand and item cannot be seen, they can be differentiated by the
codes verified for each of these. A good having a specific brand for a specific sector can
have multiple package types for different amounts of the same good. To differentiate the
1 If an item is sold in kilogram or grams, there will be gram value of the purchase which is explained in Chpater 3.3. 2 Whole monetary values in dataset are in New Turkish Liras.
12
goods which do not have same packages, for each item, the unit amount of each package
and the number of packages for a specific item is given. With these properties, for
instance, the purchase of Coke, whose brand name can be Coca Cola, in a can with a
volume of 330 milliliter can have different item codes since a consumer can buy six of
Coca Cola in cans with a six–pack package or one by one.
Item codes can easily differ in the dataset because of a small change in one of the
characteristics above. This creates an important continuity problem in observations since
each small number of items can be observed at each month. To overcome this continuity
problem, other variables are derived by aggregating the items in a sensible way. First of
these variables is derived by defining the products at brand level. By aggregating items
at brand level, the package type of the items is not taken into consideration. This
methodology enabled us to control for the product quality since it is assumed that quality
of the item will not depend on the package item.
Items are classified under 12 sectors in the data set. These sectors are: Other products,
products, paper products, hair products, body products, detergents and other cleaning
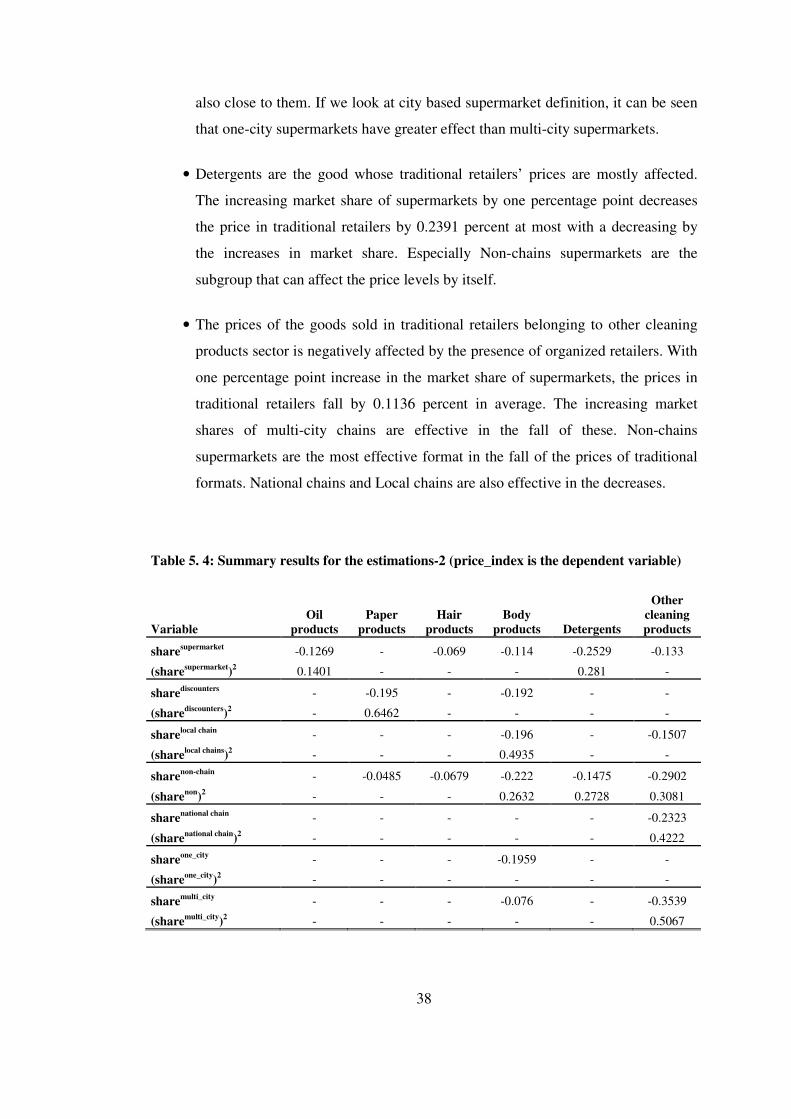
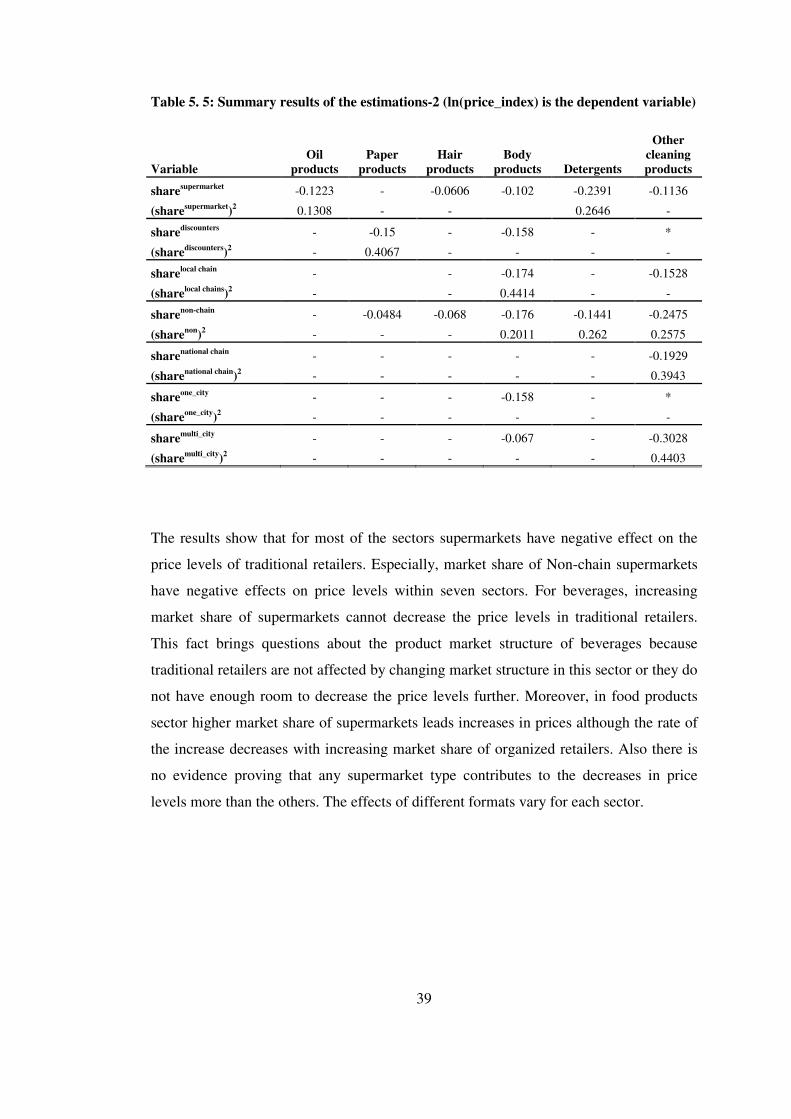
products. The products groups that are represented under these sectors are given in Table
A.1.
3.4 Households The variables related with the households who purchase items cover some basic
characteristics about them. These characteristics include the size of household, the ages
of household leader and its partner, the city and region they live in, their socioeconomic
status they belong to. There are also monthly projection constants specific to each
household showing the number of families living in Turkey, represented by the
household in question.
Socioeconomic status of the household is determined according to some major
determinants. First of all, the ownership point of each household which is a proxy for
income level is determined. It is calculated by using the number and quality of the
electronic and consumer durables in the house that the households live. For the education
13
and professional status points, the qualifications of the household member who is above
18 years old and has the highest level of education and professional status are used. By
adding these points the socioeconomic status (SES) group of each family is determined.
Then households are grouped according to the predetermined SES scales. For instance, a
family has a point above 53 will be in group A, between 35 and 52 will be in group B.
By aggregating A and B group families AB, D and E group families DE groups are
formed. Finally four SES groups AB, C1, C2 and DE are represented in the dataset.
3.5 Store classification Seven store classifications are used in the analysis. First of all, the analysis is being
conducted for entire supermarkets. Then, the definitions of the data provider -Ibsos
KMG- are used in order to observe characteristics of different formats. An additional
classification having a dynamic classification varying in time is also derived in order to
see the effects of increasing organizational capacity.
3.5.1 Supermarkets and traditional stores
In the study traditional and organized retailers will be examined by aggregating relevant
retailer types. In dataset stores are classified as National chains, Local chains,
Discounters, Non-chain Supermarkets, Medium Market and Groceries, Wholesalers,
Kiosks, Open Bazaars and other stores. First of all National chains, Local chains and
Discounters and Non-chain supermarkets are aggregated under the name of supermarkets
which can also be called organized retailers. The traditional stores definition will be used
for grouping rest of the retailers: Medium Market and Groceries including Bakkals,
Wholesalers, Kiosks (Büfe in Turkish), Open Bazaars and other stores including
specialties like Eczane (for cosmetics), Cleaning products sellers, butchers, şarkuteri etc.
3.5.2 Supermarket formats Different supermarket formats are used in order to conduct a detailed analysis of the
effects on different chains. Since each of the supermarket types defined in the dataset can
have different service qualities and productivity levels, each can have different impacts
on the analysis. Therefore, Discounters, Non-chain supermarkets, Local chains and
National chains are used in the study as separate variables.
14
3.5.2.1 Discounters
Discounters are the supermarkets that target cheaper shopping. In general, their service
quality is lower than other formats with longer queues and products in boxes. In Turkey,
discounters have smaller stores dispersed around the city most of the time. In addition to
that, they often sell cheaper brands as they target lower-income households.
3.5.2.2 Non-chains
Non-chains can be considered as the transition format from “Medium Market and
Groceries” to supermarkets. They usually have one or two stores which are small. They
do not have hyper or mega markets. The targeted consumers are especially households
living near the stores. These supermarkets can also sell cheaper brands but their service
quality is usually higher than the discounters. These supermarkets are operational around
Turkey like National chains.
3.5.2.3 Local chains
Local chains are the supermarkets which are more organized than Non-chains. They can
have several stores in a city and be operational in other cities belonging to the same
region. It can be expected that their operational capacity is higher than the Non-chains
with higher institutionalization and bargaining power with suppliers. It can be also
expected that their service quality is better than Non-chains with more sophisticated
personnel. Some of them also have bigger stores converging to hypermarkets.
3.5.2.4 National chains
These are the corporations dispersed around Turkey with different store sizes including
hypermarkets. The corporations considered under this classification are the biggest
players in FMCG retailing. They have different types of stores in different sizes
operational in neighborhoods and as hypermarkets out of the city. Most of the time, their
service quality is better than the other supermarket formats, Non-chains, Local chains,
15
Discounters. Having hypermarkets enable them to give place a wide range of products
and brands on their shelves varying from cheaper brands to luxury products.
Different supermarket types should have different impacts on price levels. With the
information given above, it is clear that the discounters can sell goods with lower service
quality like longer queues by employing fewer cashiers so that they can decrease the
prices of the same goods further. On the other hand, National chains can be more
productive with more sophisticated logistics and exercise market power while gathering
goods from suppliers at cheaper levels. However, their higher service quality can lead to
higher price levels. On the other hand, local chains can offer prices lower than Non-
chains with their higher organizational capacity. For these reasons, each supermarket
type must be considered as different entities in order to measure their impacts.
3.5.3 City-based supermarket types In addition to the classifications above, another variable set is also created to classify the
chains for making the chain classification time varying. In the previous definitions,
supermarket types are constant variables which do not change for different time periods.
However, Turkey as an emerging market economy has a dynamic retailing market. This
brings the fact that some chains can enlarge, local and regional chains can become
National chains in another time. For this reason, the store classification methodology
used by Jarmin et al. (2005) is used. In that methodology, a chain is assumed to be a
“one-city chain” if retail chain is operational at one city and called “multi-city chain”
if it operates at more than one city. With this methodology, Non-chains will be
classified in one-city supermarket while Local chains and Discounters can be classified
as both one-city and multi-city supermarket classifications. Certainly National chains are
grouped under multi-city supermarkets.
Some elimination procedures are developed in order to classify supermarkets as one-city
and multi-city. Since data are collected at household level and not at retail basis, a
household can shop in another city. For instance, a household living in Izmir can travel
to Istanbul and shop there. After he/she turns back to Izmir and fill the form, he will
write the name of the supermarket that he has visited in Istanbul but does not exist in
Izmir. However, dataset give the name of the city that household lives as the basic
16
geographical unit and the cities that different supermarket chains operate is not given.
Therefore matching cities household lives in with the shop-names does not give true
information about the cities that a supermarket chain operates. Therefore, the number of
cities and regions where a retail chain is operational cannot be found by using the dataset
directly. To overcome this problem, a retail chain is assumed to be existent in a city at
the month in question if it is also observed in each of the 11 months after that
observation. After determining the cities that each supermarket is observed by this
methodology, the results are checked by evidence from other sources. Then, the number
of cities and regions that a retail chain operational in are calculated and the type of
chains are determined.
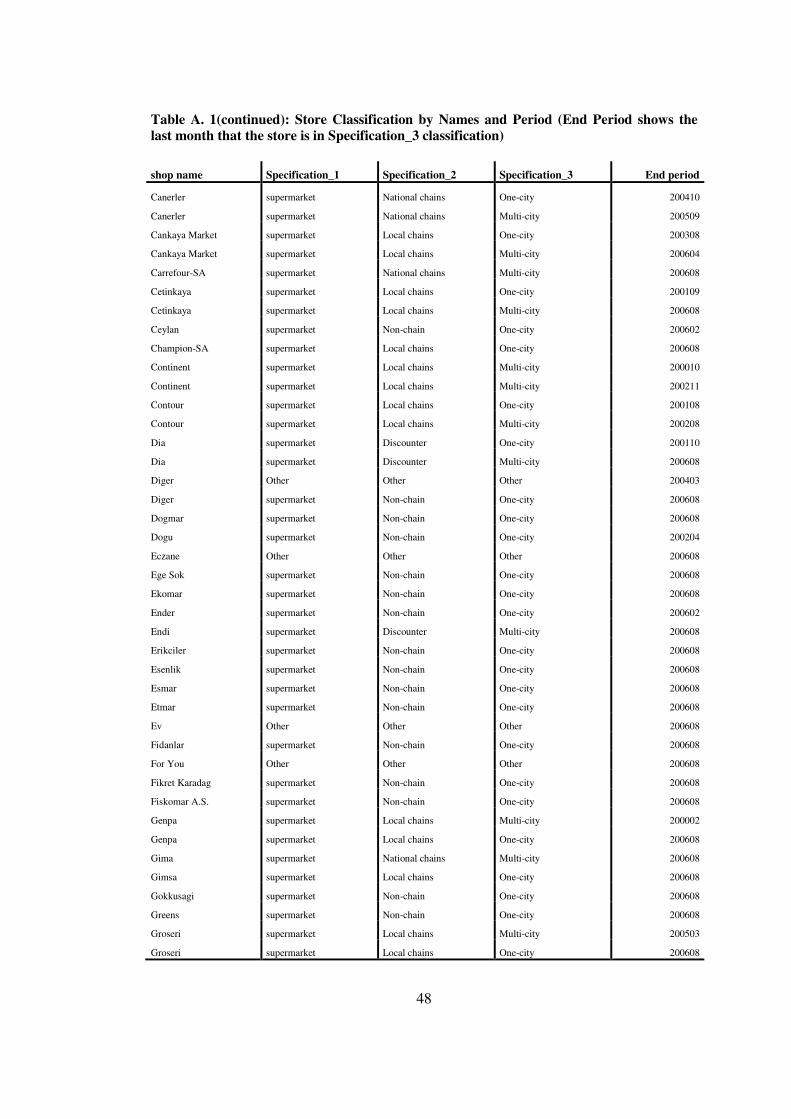
Table A.2 summarizes entire of these store classifications. First column gives the brand
name of the supermarkets if it is stated (there can be also other stores that are not
considered as brands) and general names of traditional retailers such as Bakkal, Orta
Market, Ev (for the goods produced at home and sold to consumers), Bufe, Kuruyemisci.
In the second column called specification1, the retailer category given to the specific
shop-names by the company is shown. Specification 2 gives additional information for
the supermarkets by showing the format of them as Discounters, Non-chains, Local
chains and National chain. Specification 3 is the classification that point out that a
supermarket operates at one or more than one city. Since this property changes in time
the last month that a supermarket is observed as one-city supermarket or multi-city
supermarket is shown in “End period” column.
In the study, the FMCG consumption data will be used in most of the analysis. For
descriptive and econometric analysis, data described above will be used according to the
classifications above. However, in case of any other data source usage it is indicated.
17
CHAPTER 4
MARKET OVERVIEW FOR FAST MOVING CONSUMER GOODS
The transformation process in the retail market has the capacity to decrease general price
level in FMCG market. Turkish retailing sector transform itself to larger supermarket
formats and gains economies of scale advantage. The transformation process of FMCG
retailing is a reflection of this general process and shows the same properties. Especially
in these larger markets the price levels of the same branded products are cheaper with
some exceptions. In addition to the lower prices, the market power of supermarkets in
the sector also increases in the whole country. Therefore, it might be expected that the
combination of these two effects will have negative impact on general price levels of
traditional retailers in average.
4.1 A general outlook to the transformation of retailing sector in Turkey The transformation of retailing in Turkey has been going on since 1990s. The changes in
consumer perceptions and the transition of Turkish economy to a more liberal economy
have been important factors for the structural changes in the retailing sector. As a result
of these, the number of larger retailers has increased substantially while smaller ones are
trying to survive in the new economic environment.
There is an important increase in the number of modern retailers in Turkey since 90s.
The number of supermarkets increased significantly while the number of hypermarkets
reached 55 in eight years time until 1997. It shows that there is a significant
transformation process undergoing where small retailers living their places to larger ones
while all market formats are increasing their numbers (Table 4.1). However, the
traditional stores (especially convenience stores and specialties) were still dominant
players in the market (Tokatli and Boyaci, 1998).
18
Table 4. 1: Breakdown for number of markets according to size, 1990-1997
Hypermarkets
+2500 m2
Large supermarkets 1200-2500 m2
Small supermarkets 800-1200 m2
Large markets 400-800 m2
Small markets 100-400m2
1990 0 15 8 59 1095
1991 0 21 11 70 1195
1992 2 26 18 81 1291
1993 16 30 25 92 1407
1994 27 36 31 117 1630
1995 35 44 48 157 1903
1996 42 70 74 251 2244
1997 55 83 78 301 2678
Source: Tokatli and Boyaci (1998)
The liberalization process after mid 1980s and some internal dynamics are important
factors for this transformation process in retailing. With liberalization process, Turkish
economy has changed the trade regime and supported private sector development in a
competitive economy. This process created a new domestic economic environment more
open to international effects. With the entrance of the large corporations and foreign
retailers to the open economy, the structure of the market has been altered. Tokatlı and
Boyacı (1998) point out two reasons for the transformation in the market. First, the
increase in urban population increases demand for products while in supply side there
are improvements related to the increase in manufacturing and import liberalization
policy. The second effect triggering domestic corporations for entering to the sector is
the high cash flow from retailing in a high interest economy like Turkey and the value of
real estate property of these retail stores.
The favorable domestic environment also had impacts on the transformation process.
First, the consumer habits have changed with the introduction of mass media. Western
consumer habits have become effective in large cities like Istanbul, Izmir and Ankara.
However, the existence of traditional formats is still a fact in Turkey especially in rural
areas. Especially high transportation costs and traditional consumptions habits can still
be effective on the store choice of consumers by guiding consumers towards traditional
retailers. In addition to the change in the demand conditions, the absence of a regulatory
19
framework as an entry barrier created a favorable environment for the market share of
retailers (Çelen et al. 2005).
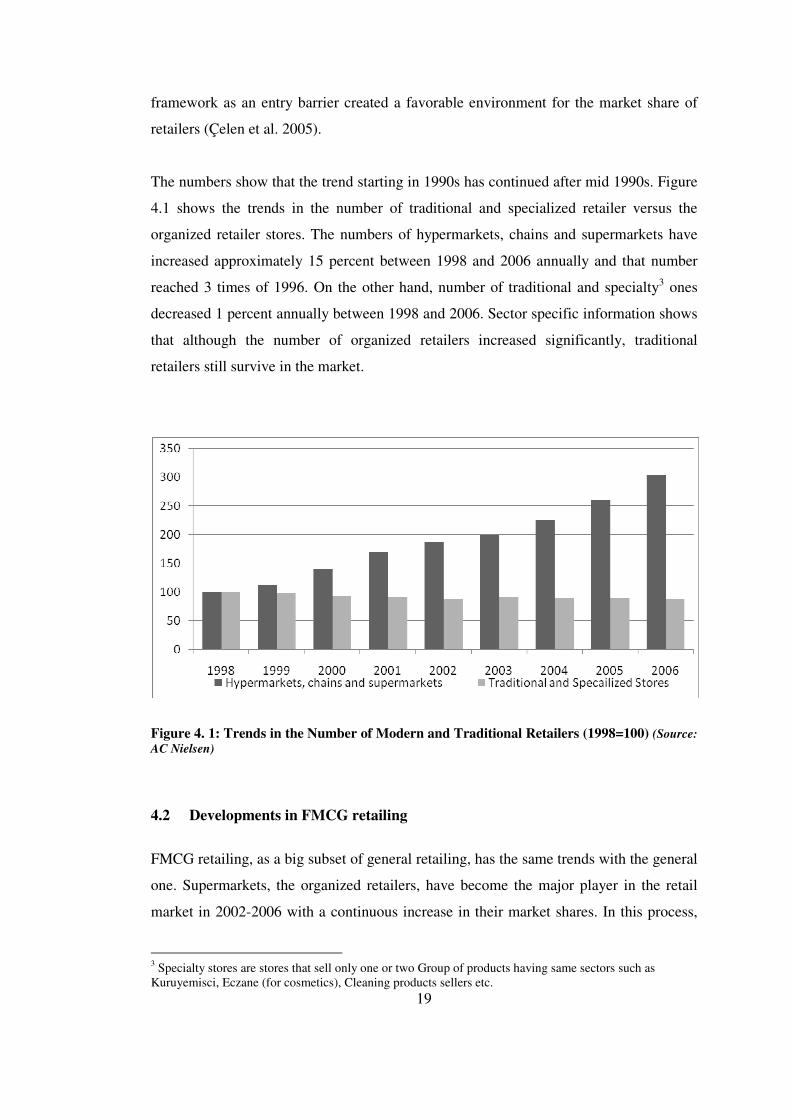
The numbers show that the trend starting in 1990s has continued after mid 1990s. Figure
4.1 shows the trends in the number of traditional and specialized retailer versus the
organized retailer stores. The numbers of hypermarkets, chains and supermarkets have
increased approximately 15 percent between 1998 and 2006 annually and that number
reached 3 times of 1996. On the other hand, number of traditional and specialty3 ones
decreased 1 percent annually between 1998 and 2006. Sector specific information shows
that although the number of organized retailers increased significantly, traditional
retailers still survive in the market.
Figure 4. 1: Trends in the Number of Modern and Traditional Retailers (1998=100) (Source:
AC Nielsen)
4.2 Developments in FMCG retailing
FMCG retailing, as a big subset of general retailing, has the same trends with the general
one. Supermarkets, the organized retailers, have become the major player in the retail
market in 2002-2006 with a continuous increase in their market shares. In this process,
3 Specialty stores are stores that sell only one or two Group of products having same sectors such as Kuruyemisci, Eczane (for cosmetics), Cleaning products sellers etc.
20
especially Non-chain supermarket is the dominant supermarket type that derived the
transformation process in entire Turkey and other supermarket types could not improve
their market share to significant levels like Non-chains. However, the importance of
multi-city supermarket chains in the transformation shows that analysis is highly
dependent on the definition of retailer types and any analysis that will be made should
use different definitions to explain the impacts of the transformation. At regional level,
there is a dynamic process in market shares that must be taken into account and although
the trends are similar to the results for Turkey. Finally, the absolute numbers show that
the transformation process does not change the leadership of Medium Market and
Groceries, a traditional format, in most of the regions.
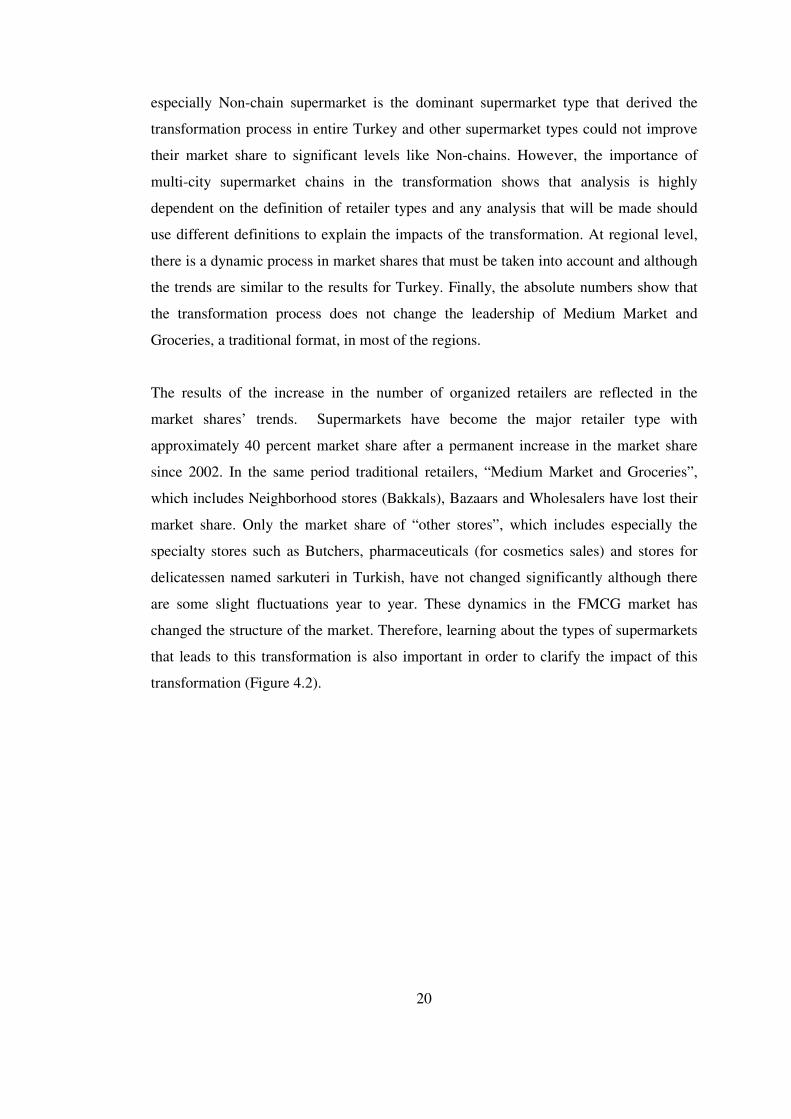
The results of the increase in the number of organized retailers are reflected in the
market shares’ trends. Supermarkets have become the major retailer type with
approximately 40 percent market share after a permanent increase in the market share
since 2002. In the same period traditional retailers, “Medium Market and Groceries”,
which includes Neighborhood stores (Bakkals), Bazaars and Wholesalers have lost their
market share. Only the market share of “other stores”, which includes especially the
specialty stores such as Butchers, pharmaceuticals (for cosmetics sales) and stores for
delicatessen named sarkuteri in Turkish, have not changed significantly although there
are some slight fluctuations year to year. These dynamics in the FMCG market has
changed the structure of the market. Therefore, learning about the types of supermarkets
that leads to this transformation is also important in order to clarify the impact of this
transformation (Figure 4.2).
21
Bazaars
DFV Kisok
Medium market
& Groceries
Others
Wholeslalers
Supermarkets
0%
5%
10%
15%
20%
25%
30%
35%
40%
45%
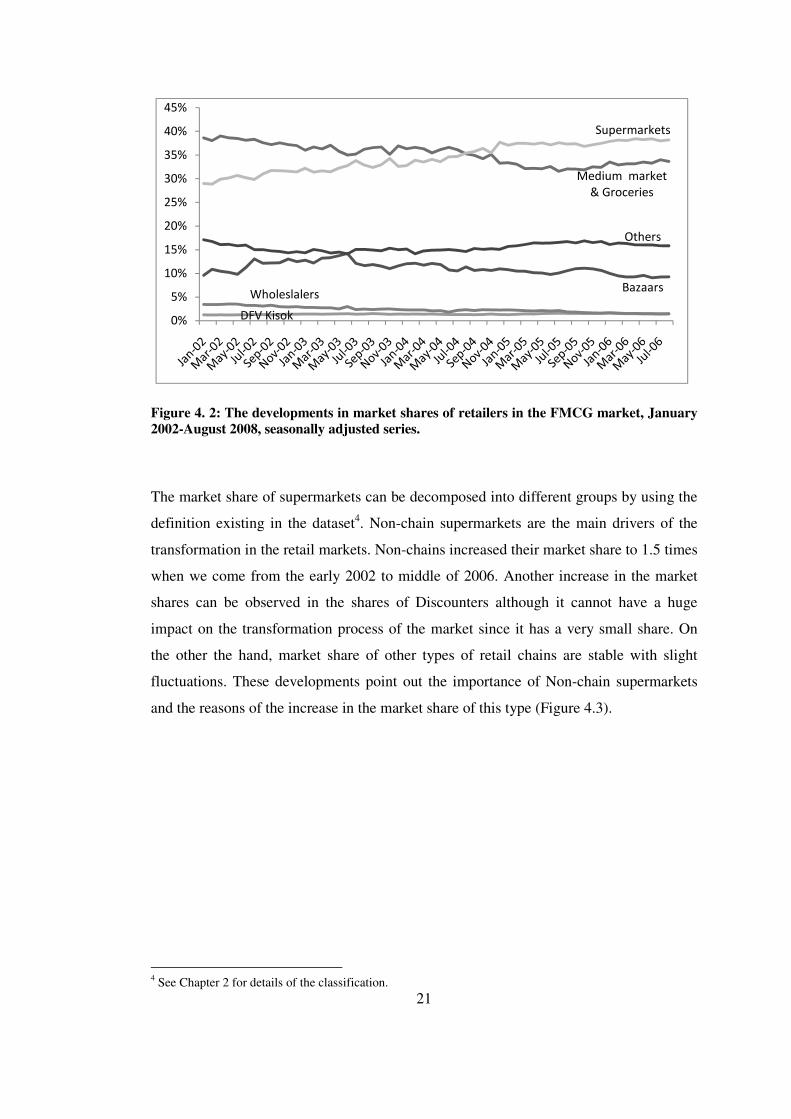
Figure 4. 2: The developments in market shares of retailers in the FMCG market, January 2002-August 2008, seasonally adjusted series. The market share of supermarkets can be decomposed into different groups by using the
definition existing in the dataset4. Non-chain supermarkets are the main drivers of the
transformation in the retail markets. Non-chains increased their market share to 1.5 times
when we come from the early 2002 to middle of 2006. Another increase in the market
shares can be observed in the shares of Discounters although it cannot have a huge
impact on the transformation process of the market since it has a very small share. On
the other the hand, market share of other types of retail chains are stable with slight
fluctuations. These developments point out the importance of Non-chain supermarkets
and the reasons of the increase in the market share of this type (Figure 4.3).
4 See Chapter 2 for details of the classification.
22
Discounters
Local Chains
Non-Chains
National Chains
0%
2%
4%
6%
8%
10%
12%
14%
16%
18%
20%
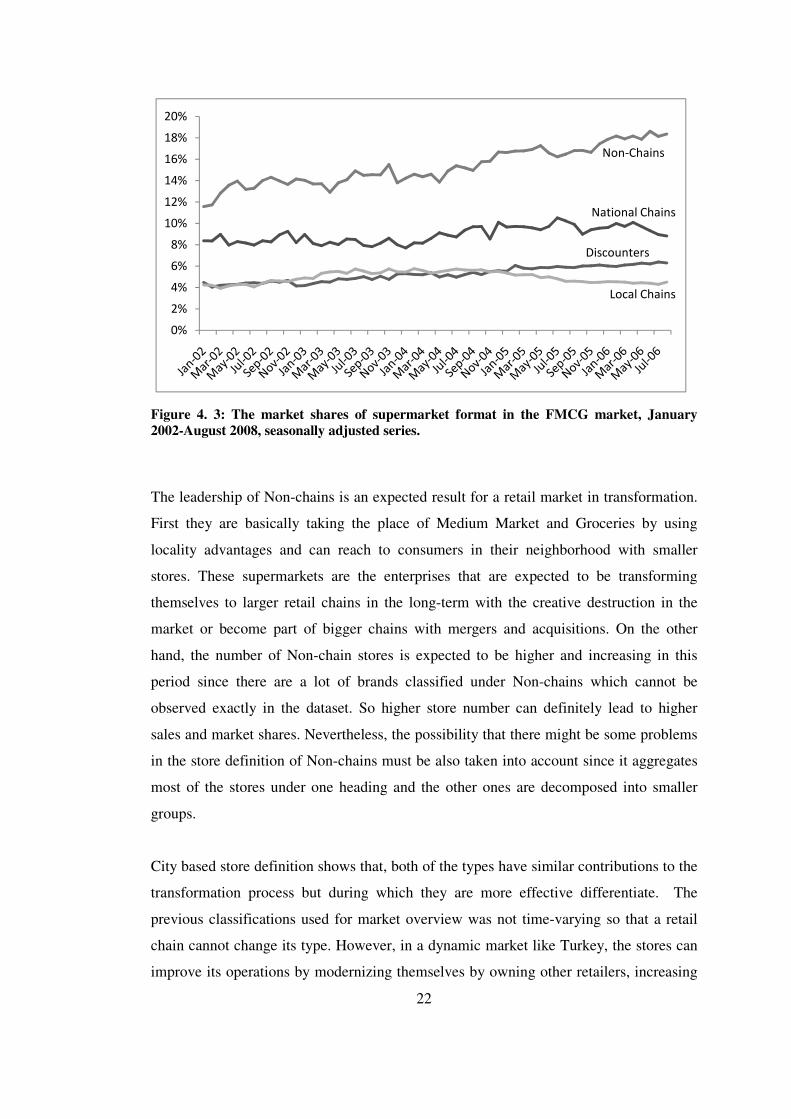
Figure 4. 3: The market shares of supermarket format in the FMCG market, January 2002-August 2008, seasonally adjusted series. The leadership of Non-chains is an expected result for a retail market in transformation.
First they are basically taking the place of Medium Market and Groceries by using
locality advantages and can reach to consumers in their neighborhood with smaller
stores. These supermarkets are the enterprises that are expected to be transforming
themselves to larger retail chains in the long-term with the creative destruction in the
market or become part of bigger chains with mergers and acquisitions. On the other
hand, the number of Non-chain stores is expected to be higher and increasing in this
period since there are a lot of brands classified under Non-chains which cannot be
observed exactly in the dataset. So higher store number can definitely lead to higher
sales and market shares. Nevertheless, the possibility that there might be some problems
in the store definition of Non-chains must be also taken into account since it aggregates
most of the stores under one heading and the other ones are decomposed into smaller
groups.
City based store definition shows that, both of the types have similar contributions to the
transformation process but during which they are more effective differentiate. The
previous classifications used for market overview was not time-varying so that a retail
chain cannot change its type. However, in a dynamic market like Turkey, the stores can
improve its operations by modernizing themselves by owning other retailers, increasing
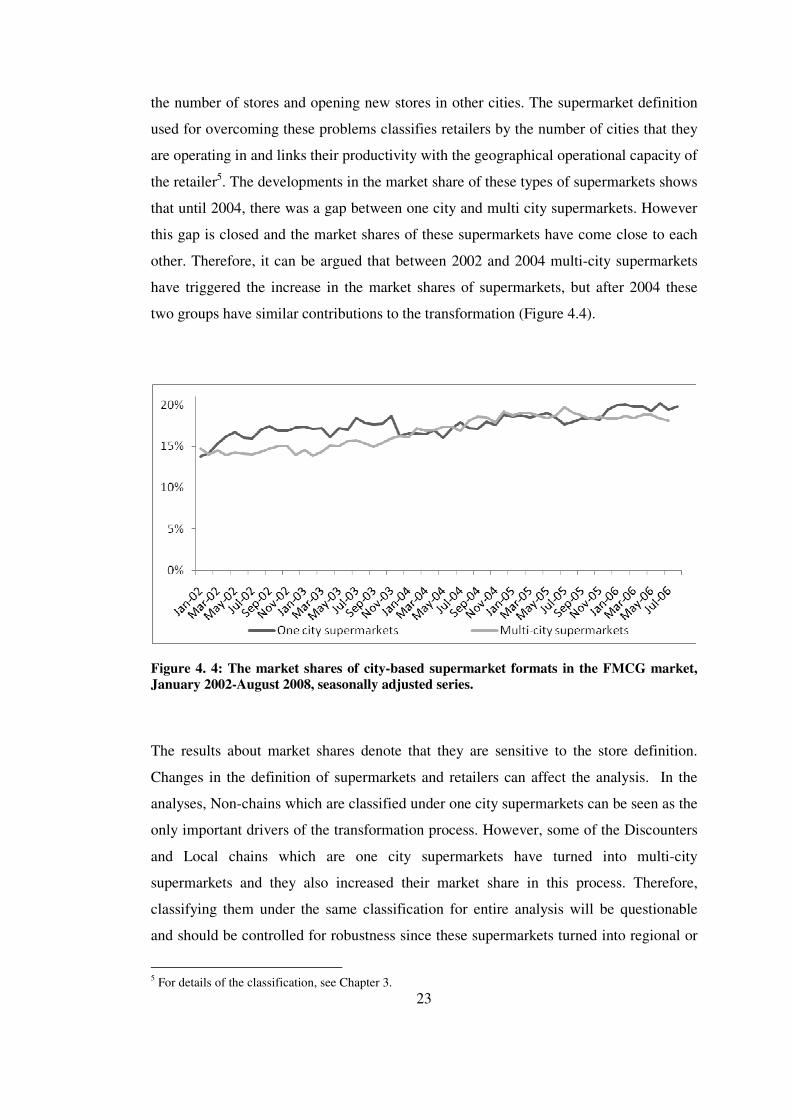
23
the number of stores and opening new stores in other cities. The supermarket definition
used for overcoming these problems classifies retailers by the number of cities that they
are operating in and links their productivity with the geographical operational capacity of
the retailer5. The developments in the market share of these types of supermarkets shows
that until 2004, there was a gap between one city and multi city supermarkets. However
this gap is closed and the market shares of these supermarkets have come close to each
other. Therefore, it can be argued that between 2002 and 2004 multi-city supermarkets
have triggered the increase in the market shares of supermarkets, but after 2004 these
two groups have similar contributions to the transformation (Figure 4.4).
Figure 4. 4: The market shares of city-based supermarket formats in the FMCG market, January 2002-August 2008, seasonally adjusted series. The results about market shares denote that they are sensitive to the store definition.
Changes in the definition of supermarkets and retailers can affect the analysis. In the
analyses, Non-chains which are classified under one city supermarkets can be seen as the
only important drivers of the transformation process. However, some of the Discounters
and Local chains which are one city supermarkets have turned into multi-city
supermarkets and they also increased their market share in this process. Therefore,
classifying them under the same classification for entire analysis will be questionable
and should be controlled for robustness since these supermarkets turned into regional or
5 For details of the classification, see Chapter 3.
24
National chains in the process, and they become important players of the transformation
process.
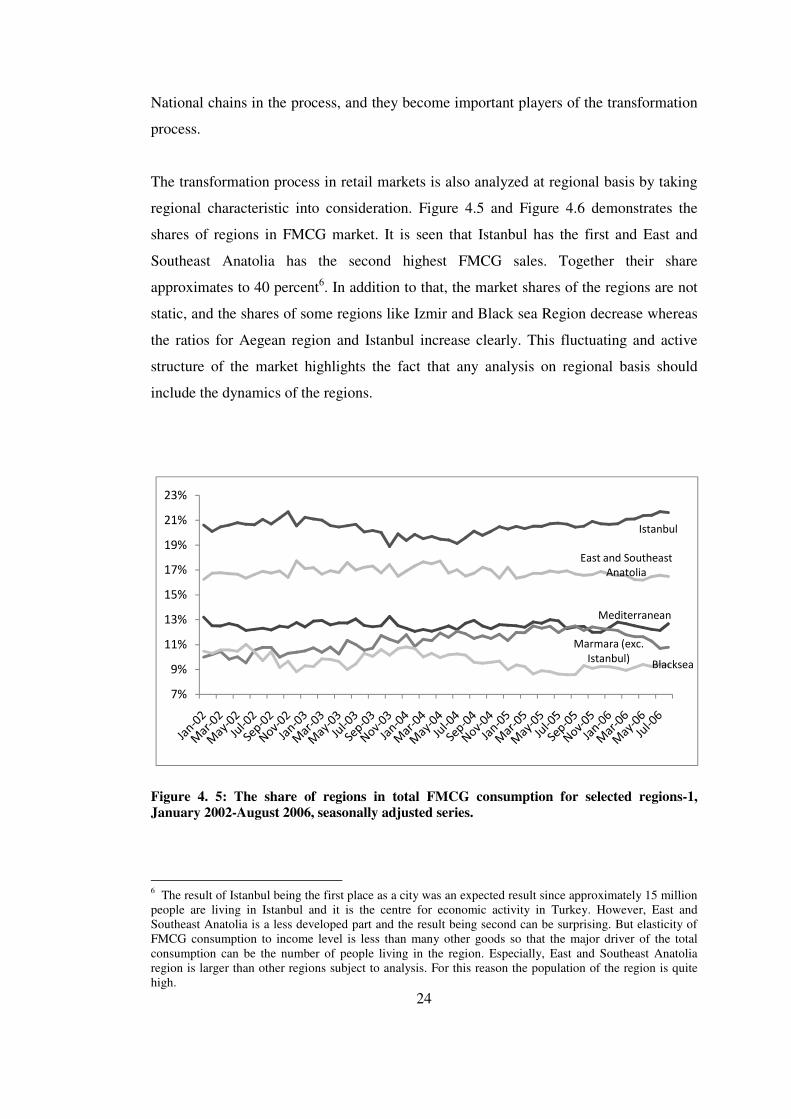
The transformation process in retail markets is also analyzed at regional basis by taking
regional characteristic into consideration. Figure 4.5 and Figure 4.6 demonstrates the
shares of regions in FMCG market. It is seen that Istanbul has the first and East and
Southeast Anatolia has the second highest FMCG sales. Together their share
approximates to 40 percent6. In addition to that, the market shares of the regions are not
static, and the shares of some regions like Izmir and Black sea Region decrease whereas
the ratios for Aegean region and Istanbul increase clearly. This fluctuating and active
structure of the market highlights the fact that any analysis on regional basis should
include the dynamics of the regions.
Istanbul
Mediterranean
Marmara (exc.
Istanbul)
East and Southeast
Anatolia
Blacksea
7%
9%
11%
13%
15%
17%
19%
21%
23%
Figure 4. 5: The share of regions in total FMCG consumption for selected regions-1, January 2002-August 2006, seasonally adjusted series.
6 The result of Istanbul being the first place as a city was an expected result since approximately 15 million people are living in Istanbul and it is the centre for economic activity in Turkey. However, East and Southeast Anatolia is a less developed part and the result being second can be surprising. But elasticity of FMCG consumption to income level is less than many other goods so that the major driver of the total consumption can be the number of people living in the region. Especially, East and Southeast Anatolia region is larger than other regions subject to analysis. For this reason the population of the region is quite high.
25
Ankara
Izmir
Central Anatolia
Agean (exc. Izmir)
5,0%
5,5%
6,0%
6,5%
7,0%
7,5%
8,0%
8,5%
9,0%
9,5%
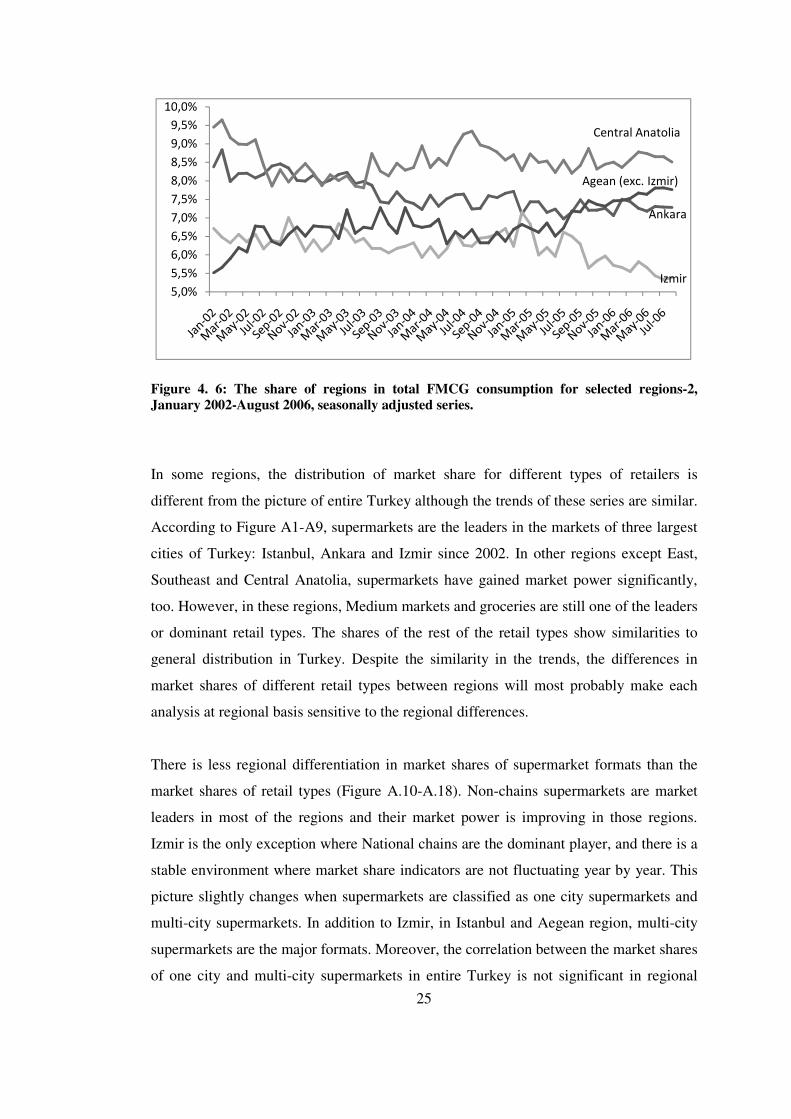
10,0%
Figure 4. 6: The share of regions in total FMCG consumption for selected regions-2, January 2002-August 2006, seasonally adjusted series. In some regions, the distribution of market share for different types of retailers is
different from the picture of entire Turkey although the trends of these series are similar.
According to Figure A1-A9, supermarkets are the leaders in the markets of three largest
cities of Turkey: Istanbul, Ankara and Izmir since 2002. In other regions except East,
Southeast and Central Anatolia, supermarkets have gained market power significantly,
too. However, in these regions, Medium markets and groceries are still one of the leaders
or dominant retail types. The shares of the rest of the retail types show similarities to
general distribution in Turkey. Despite the similarity in the trends, the differences in
market shares of different retail types between regions will most probably make each
analysis at regional basis sensitive to the regional differences.
There is less regional differentiation in market shares of supermarket formats than the
market shares of retail types (Figure A.10-A.18). Non-chains supermarkets are market
leaders in most of the regions and their market power is improving in those regions.
Izmir is the only exception where National chains are the dominant player, and there is a
stable environment where market share indicators are not fluctuating year by year. This
picture slightly changes when supermarkets are classified as one city supermarkets and
multi-city supermarkets. In addition to Izmir, in Istanbul and Aegean region, multi-city
supermarkets are the major formats. Moreover, the correlation between the market shares
of one city and multi-city supermarkets in entire Turkey is not significant in regional
26
analyses for most of the regions (Figure A.19-A.27). These results also point out that
there are also some slight differences in the shares of different supermarkets for different
regions.
4.3 Price levels in different supermarkets Organized retailers have competitive prices in the same branded goods. The relative
price levels observed in organized retailers are lower than the ones in traditional retailers
on average. However, there is a variation both in the price levels of products in each
supermarket and the average price level between supermarket types. It might be the
result of changing characteristic of supermarket formats and its reflection to the unit cost
level of these supermarkets. Especially, store choice characteristics of households from
different socioeconomic groups prove that there is a differentiation between supermarket
formats’ service quality and surely the cost structure.
In order to calculate average price levels, common observations are found with a simple
methodology. The goods having same brands are used for calculating the average price
levels in different retailers. These products’ average unit price levels sold in the
organized retailers are compared with the price level of the same goods in traditional
stores by considering the ones which can be observed at each month for each of the
retailers and traditional stores. However, these products are not by each supermarket
type at each month. For that reason, a second elimination procedure has been conducted
in order to find the months common for branded goods in which price levels for each
product and supermarket type exist. Finally, the average unit price levels have been
calculated, and results are divided to the average unit price level of traditional retailers.
The results show that organized retailers have lower price levels with some exceptions.
The relative price levels are quite close to each other. It is seen that, on average, the unit
price level of products are lowest in Local chains. For discounters, the standard deviation
is higher than the others showing that there exists both higher and lower priced brands
which can also be examined in Table 4.2.
27
Table 4. 2: Average relative price level of organized retailers relative to traditional stores
Supermarkets Discounter Local chain
Non-chains
National chains
One city Supermarket
Multi-city supermarket
Arithmetic Average
0.948 0.970 0.947 0.959 0.961 0.955 0.952
Standard deviation
0.046 0.152 0.052 0.039 0.088 0.039 0.079
4.4 Store choice of households according to socio-economic groups The analysis shows that socioeconomic status is an important determinant of the retail
store choice. For all socioeconomic groups the shares of supermarkets are increasing.
However, the level of these shares varies according to the socioeconomic groups. The
average share of supermarkets decreases while socioeconomic groups range from AB
(upper socioeconomic group) to DE (lower socioeconomic group). The Bazaars and
Medium Markets and Groceries take place of supermarkets for lower socioeconomic
groups (Figure A.28-A31).
Non-chain supermarkets have high shares for all groups, and Discounters and Local
chains have above ten percent market share for all groups and does not fluctuate from
one year to another significantly. Furthermore, discounters increased their market share
in the total amount of shopping for DE group which is also an expected result. On the
other hand, National chains have the highest share in socioeconomic group AB and
lowest in DE group (Figure A.32- Figure A.35). Considering that National chains’
service quality is better than the other supermarket types and luxurious and expensive
products can be found in these stores, it can be stated that the choice of AB group whose
income level and education level are higher than the other socioeconomic groups is
logical.
The pattern of choice according to socio-economic groups can be seen easily when the
one city and multi-city supermarkets’ shares according to socio-economic groups are
analyzed. It is seen in Figure A.36-A.39 that the share of multi-city supermarkets is
higher in the consumption bundles of group AB but it decreases when we go through C1,
28
C2, DE. This result is consistent with the fact that higher socio-economic groups will
shop from the stores where they can find luxury goods and high service quality.
Three important points arises from the socioeconomic analyses. First, the supermarkets
gain market share for all socioeconomic groups showing that the consumers groups have
a common reason to shift from traditional stores supermarkets. Second, especially
socioeconomic group AB, which most probably prefers luxury goods or higher service
quality chooses National chains showing that this type of supermarkets offer the services
higher socioeconomic groups prefer. Finally, with the decrease in the income level of
households and education level, one-city supermarkets gain market power.
Finally, the transformation in retail market is significant, and it will certainly have
impacts on the market. It is expected that the increasing market power of supermarkets
must have increased the general productivity level in the market and have created
important competitive pressure over traditional retailers. There is also evidence that
organized retailers have lower price levels in average. These effects should cause a fall
in the price levels of the FMCG market with a decrease in the price levels. However,
larger supermarkets, especially National chains, multi-city supermarkets can be preferred
because of their higher service and product quality. Therefore, their contribution to the
fall in prices may be smaller.
29
CHAPTER 5
THE MODEL AND ESTIMATION RESULTS
In this section, an econometric analysis is performed by using Household Panel Data to
estimate the effects of modern retailing on the price levels that consumers face in
traditional retailers. It is expected that the increasing market share organized retailers
will lead to a fall in the price levels of traditional retailers. The estimations are done for
12 sectors mentioned in Chapter 3.
5.1 Model To estimate the effects, panel data analyses are used. The time horizon of the research is
the period January 2002-August 2006 consisting of 56 months. The analyses are
conducted for entire Turkey with brand level products for 12 sectors.
To test the hypothesis that increasing market shares of different types of supermarkets
have a negative impact on price levels of the products sold in traditional stores, Hausman
and Leibtag (2005) model utilized. Hausman and Leibtag (2005) used a model
explaining average price level of each good by using market shares of Wal-Mart stores.
To estimate the aggregate effect of supermarkets the following models is used:
j
ti
j
tij
j
tij
j
i
j
t
jj
ti ushareshareindexprice ,2
,,, )(_ +++++= λβθδα (1)
where subscript i denotes the product t denotes the month and j denotes supermarket
types explained in Chapter 3.
The dependent variable tiindexprice ,_ is the index of price level in traditional
stores for a specific good. The formula used for calculating it presented below:
30
(2)
The index for a product at brand level is formed by dividing each monthly observation of
the unit price of a product to the first observation.
(3)
The unit price of each item used in the calculation of the price indexes is calculated by
dividing total expenditure in nominal YTL to total transaction amount in grams or units.
The estimations are also redone for the natural logarithm of price_index as
ln(price_index) in order to see the percentage change in the price levels with one point
change in market share.
j
tishare , is the market share of the supermarkets in the total sales of product i at time t for
each type of supermarket. The market share of each supermarket type, Discounters,
Local chains, Non-chains, National chains, one-city and multi-city supermarkets as well
the aggregate share of supermarkets are calculated for each product.
It is expected that with the increase in the share of supermarket formats, β will take a
negative value. The increase in market share of modern supermarkets will create
competitive pressure against traditional retailers. In more competitive market, average
profit level will also be lower. In addition to that, traditional retailers are forced to
decrease their cost per sales by increasing their productivity levels.
2, )( j
tishare is added to the model in order to control for the non-linear relations between
the market share of supermarkets and price levels observed in traditional stores. If β is
lower (higher) than zero and λ is higher (lower) than zero it shows that market shares of
retailers lead to a lower decrease (increase) in the price levels of traditional retailers at
time t+1 than the decrease (increase) at time t. Although the increase in market share of
retailers is expected to have negative impact on the price level of the goods in traditional
stores, the rate of decrease per increase in market share can be lower in later months.
31
With the entrance and increase in the market share of the supermarkets, there must be an
increase in the competition level in the market. As the competition level in the market
changes, traditional retailers can sacrifice from their high level of profits in the market
and will also try to decrease their cost levels. However, reductions in price levels might
be lower in the future since the possibility of increasing productivity levels for
decreasing per unit costs can be lower as time passes. Because there is a frontier for the
service production of traditional retailers as these retailers can employ limited amount of
personnel for a limited amount of store area by definition. Without increasing their store
sizes their buyer power or productivity level can increase in limited terms. If they invest
for enlarging their stores, it means that they transform themselves from traditional
retailers to organized ones and cannot be named as traditional retailers in this study.
On the other hand, the competitive pressure that supermarkets create can be also lower as
time goes on. The frontier relevant for traditional retailers is also valid for the organized
retailers. The buyer power and productivity level of supermarkets might not increase in
time at the same rate. Therefore, the relative price levels in organized supermarkets may
decline with a decreasing rate converging to zero. That is why, increase in competitive
pressure on traditional retailers might not increase by the same level with every per unit
increase in market share of organized retailers. Therefore, the impact of one point
increase in the market share of a competitive supermarket can decrease the price level
for a specific good sold in traditional retailers at a lower rate.
There are also two control variables in the model inserted as dummy variables to control
for the changes in general economic activities in Turkey and product level effects.
Monthly effect variable, tδ , is used in the model to control for the effects of some
macroeconomic fluctuations, seasonality and changes in production costs in entire
Turkey. Especially the dataset consists of many monthly effects like consumption booms
in Ramadan7. Therefore, eliminating only seasonal effects is not satisfying and a dummy
variable is needed for each month. iθ is the control variable for the product specific
effects since each price level specific for a good can be affected at varying levels by the
changes in market shares.
7 Ramadan is the holy month where per capita consumption increases, and it has a direct impact on price levels. To learn about the impacts of Ramadan on inflation see Yucel (2007).
32
Relevant estimation methodology is used because of the presence of autocorrelation and
heteroscedasticity in the estimations. Wooldridge (2002) and Baltagi-Li (1995) test for
autocorrelation indicate that there is strong evidence of autocorrelation. In addition to
that there is also evidence of heteroscedasticity according to the test analyses developed
by Druker (2003)8. For these reasons, the significance of coefficients for entire models
without correction is under considerations. Therefore, to increase the efficiency of
estimation and eliminate autocorrelation and heteroscedasticity, panel level
heteroscedasticity-corrected GLS estimation methodology using first-order
autoregressive disturbances (AR1) is used in the estimations.
5.2 Estimation Results Results of the estimations are consistent with the evidence in the literature for most of
the sectors. Organized retailers have negative impact on the price level of selected fast
moving consumer goods in eight of the sectors. However, in rest of the sectors
increasing market share of supermarkets does not decrease the price level of traditional
retailers. In addition, the impact of each supermarket format varies for each sector and
there is no clear evidence that shows that one supermarket type has more impact on the
price levels of traditional retailers.
Estimations are done for 12 sectors separately in order to see varying impacts in different
sectors. The sectors mentioned in Chapter 3 might have different market structures. For
example, some sectors in Turkey highly concentrated by 2 or 3 firms might have more
oligopolistic market structure than the others. For this reason, the buyer power of
supermarkets can be restricted in these sectors because of the bargaining power of
suppliers. This fact surely limits the price reductions of supermarkets relative to the
traditional stores for the products belonging to these sectors. To see these impacts
estimations are done for each sector separately.
Analysis is conducted for 652 branded products for which price statistics can be derived
for both traditional retailers and supermarkets in each month. Total number of
observations reaches to 36,512 in dataset (Table 5.1). It is seen that for supermarket
8 In Druker (2003), heteroscedasticity consistent estimates and normal estimates from panel data GLS models are compared with LR test.
33
formats and city-based supermarket definitions the market share can take value of zero.
These observations for supermarkets are not considered as missing observations and it is
assumed that in these that brand product has not been sold at that specific month. This
assumption is also consistent with another assumption that dataset represents the FMCG
consumption characteristics of entire Turkey. For instance, if, for a biscuit of a specific
brand, the market share of discounters, sharediscounters, takes a value of “0” in the September
of 2005, it must show that no household in Turkey buy that brand biscuit at that month
from discounters. It can probably indicate either that biscuit brand does not exist on the
shelves of discounters or consumers choosing to shop in discounters do not prefer that
biscuit brand.
Table 5. 1: Descriptive statistics of the variables –entire dataset used in the analysis Variable Obs. Mean Std. Dev. Min Max price_index 36512 1.345 0.485 0.083 6.123 ln(price_index) 36512 0.239 0.338 -2.483 1.812
The model is estimated for 12 sectors separately as indicated before. Therefore,
descriptive statistics of each sector are also derived as shown in Table A.3-Table A.14.
These tables point out that number of products as well as other statistics considered in
each sector vary significantly. This factor also points out the importance of estimating
the model for each sector.
34
The model is estimated for each supermarket definition separately with two
specifications. In the former, only j
tishare , is used as explanatory variable whereas in the
later 2, )( j
tishare is added to the model. Estimation results of the model for each sector
are given in Table A.15-Table A.38. All estimations give jointly significant results
according to Wald Chi2 statistics. The results for time and product dummies are also
jointly significant for all estimations9.
The estimated coefficients of explanatory variables are given for 12 sectors by means of
four tables. Table 5.2 and Table 5.3 gives the estimates of the coefficients for “Other
products”, “Meat products”, “Food products”, “Beverages”, “Candies, Chocolates and
Deserts” and Dairy products sectors. The results for rest of the sectors are indicated in
Table 5.4 and Table 5.5. The estimates of the coefficients for j
tishare , and 2, )( j
tishare
are put into the tables if they are statistically significant at 10 percent significance level.
If the coefficients of j
tishare , and 2, )( j
tishare are jointly significant, the coefficients for
this specification are given in the tables below. However, if the j
tishare , has a significant
coefficient and 2, )( j
tishare does not have, former specification where j
tishare , is the only
dependent variable is checked. If its dependent variable has also significant coefficient,
this one is stated in the tables.
Estimation results for the specifications where price_index and ln(price_index) are the
dependent variables can differ. For instance, a coefficient can be statistically significant
in a specification price_index is the dependent variable whereas it is not significant when
ln(price_index) is the dependent variable. In order to use the robust results for
explanations, the coefficients which are significant in both specifications are put into the
tables. But, there are also “*” signs to show that there is a significant but not robust
coefficients. These coefficients can be found in the Appendix.
Increasing market shares of supermarkets have negative effects on the price levels of
traditional retailers on some sectors and the impacts of supermarket types also differ
from each other. In eight of the sectors, increasing market share of modern retailers has
9 Since 55 monthly dummies are used for all the models and there are also product dummies for each sector, the dummies are not reported in the tables.
35
decreased the price levels in traditional retailers. Also, supermarket types have varying
impacts in different sectors. The results of sector level analysis is as follows.
• In “other products” sector, one percentage point increase of the supermarkets
market share decrease the price level by 0.12 percent in average10. In the
decrease, Local and National chains and as a total multi-city chains are effective.
Local chains reduce the prices most according to the test results.
• Meat products’ prices in traditional stores do not negatively affected by the
increasing aggregate market share of supermarkets. Only, one percentage point
increase in the market share of Local chains decreases the prices by 0.05 percent.
• For food products, total effect of increasing market share supermarkets is an
increase the price levels of traditional retailers. With an increase in the market
share of supermarkets with one percentage point, the increase in price levels of
traditional retailers will be 0.0671 or lower since the coefficient for
(sharesupermarket)2 is below zero and shows that the increase will be in a decreasing
rate. However, national chains force traditional retailers to decrease the price
levels by 0.0567 percent at most with a percentage point increase in market share
and the rate of decrease declines with the increasing market share of national
chains because of the positive coefficient of (sharenational)2.
• In beverages sector, increasing market share of supermarkets cannot decrease the
price levels in traditional retailers, showing that these retailers does not have
enough room to decrease the price levels further.
• For chocolates, candies and deserts one percentage point increase in the market
share of supermarkets decrease the price levels by 0.025 percent. The decrease in
the prices mainly caused by the local chains and national chains. With one
percentage point increase in the market share local chains and national, the price
10 In this statement and in the following comments about the increase in prices the Results of Table 5.3 and Table 5.5 are used. It is important to remember that the market shares of supermarkets are bounded between 0 and 1. In the comments, for instance, if the coefficient for sharesupermarket 0.05 and market share at time t is 0.20, with a one percentage point increase in supermarket share, the market share will be increased from 0.20 to 0.21. Then, its impact on price level will be 0.05 percent. However, if market share is increased by one point (this is not possible in the case of market share as it is explained) from 0.20 to 1.21, the market share will be increased by 5 percent.
36
levels in traditional retailers will fall by 0.0478 and 0.0586 (with a decreasing
rate for national chains) respectively.
• The price levels of dairy products in traditional stores are negatively affected by
the increasing aggregate market share of supermarkets and Non-chain
supermarkets. One percentage point increase in the market share of supermarkets
decrease price levels of dairy products by 0.0287 percent while it is 0.0515
percent for Non-chain supermarkets
Table 5. 2: Summary results for the estimations-1 (price_index is the dependent variable)
The results show that for most of the sectors supermarkets have negative effect on the
price levels of traditional retailers. Especially, market share of Non-chain supermarkets
have negative effects on price levels within seven sectors. For beverages, increasing
market share of supermarkets cannot decrease the price levels in traditional retailers.
This fact brings questions about the product market structure of beverages because
traditional retailers are not affected by changing market structure in this sector or they do
not have enough room to decrease the price levels further. Moreover, in food products
sector higher market share of supermarkets leads increases in prices although the rate of
the increase decreases with increasing market share of organized retailers. Also there is
no evidence proving that any supermarket type contributes to the decreases in price
levels more than the others. The effects of different formats vary for each sector.
40
CHAPTER 6
CONCLUSION
Turkish retailing sector has been in a transformation process since 1990s. In this process,
modern organized retailers are gaining market power while the traditional ones have
been trying to survive in the market. The increase in the market share of non-chain
supermarkets is the major driving force behind this process, and this is more prominent
in the developed regions and cities. On the other hand, there is evidence about the fact
that supermarket formats charge lower prices relative to the traditional formats for most
of the products. That is why consumer can shop with the increasing market share of
modern retailers.
Previous works on this issue are mainly concentrated on the channels that can lead to a
decrease in the price level of households’ consumption bundles or only the effects of
hypermarkets on price levels. In this study a broader and more detailed definition for
supermarkets is used in order to investigate the different impacts of these formats on
price levels for different sectors. An extensive household panel data for FMCG
consumption is used for the study. By means of this data, product quality problem was
also eliminated with the use of brand level product definition.
The main result of the study is that increasing market share of supermarkets has a
negative impact on price levels of traditional retailers in most of the sectors but this
impact differs across each format for each sector. The estimates reveal that an increase in
the market share of supermarkets have a negative impact on the price level in traditional
retailers for 8 of the 12 sector examined in the study. Especially prices for food and
beverages are not negatively affected by the increasing market share supermarkets and
only some formats have negative impact on price levels of meat products. The impact of
organized retailers on the traditional retailers’ prices depends heavily on the sector
characteristics. Therefore, the impact of each format differs for each sector. But,
different characteristics supermarket formats create different impacts on the price levels
observed in traditional retailers.
41
There is also important space for future work in this area. First of all, the effective
channels that enable supermarkets to charge lower prices can be investigated separately
by using productivity and buyer power measures. Merging household panel and retailer
based data can enable to see the impacts of different channels on prices. Retailer based
data collected from retailer itself can make easier to monitor the changing structure and
productivity level of retailers subject to analysis and give more clear results for the
effects of these on price levels.
To conclude, the study found significant negative impact of increasing market share of
modern retailers on average price levels of traditional retailers in some sectors of FMCG.
The results point out that the presence and increasing market share of organized
supermarkets is important for consumer welfare. Results show that one of the reasons
that decrease the price levels that consumer face in traditional retailers is the existence of
organized retailers and increasing competition in the market. Previous literature shows
that inexistence of entry barriers to the markets has been one of the important factors that
enabled the entrance of these supermarkets. For this reason, it is important to protect this
competitive environment in order to maximize the welfare of the consumers as
regulations causing a decrease in the market share of supermarkets will cause increases
in price levels according to the results of the study.
42
REFERENCES
A.C Nielsen (2006). Bakkal Kim? Presentation in the Congress of AMPD, Istanbul,
Turkey. Aaditya, M. and Payton, L. (2007). Services Trade for Zambia's Development: An Overview. Services Trade & Development: The Experience of Zambia. Palgrave and
The World Bank, 22-24. Armstrong, M. And Vickers J. (1993). Price Discrimination, Competition and Regulation. Journal of Industrial Organization, 41, 335-360 Baltagi B. H. & Li., Q. (1995) Testing AR(1) against MA(1) Disturbances in An Error Component Model. Journal of Econometrics, 68, 133—151. Baltagi, B. H. and Li. ,Q. (1991). A transformation that will circumvent the problem of autocorrelation in an error-component model. Journal of Econometrics, 48, 385-393. Basker, E. (2005a). Job Creation or Destruction? Labor-Market Effects of Wal-Mart Expansion. Review of Economics Statistics, February 2005, 87(1), 174-183. Basker, E. (2005b). Selling a Cheaper Mousetrap, Wal-Mart Effect on Retail Prices. Journal of Urban Economics, September 2005, 58(2), 203-229. Bera, A.K.,Sosa-Escudero, W. & Yoon, M.J. (2001). Tests For The Error Component Model in The Presence of Local Misspecification. Journal of Econometrics, 101, 1-23. Boyaci, G. O. (2000). The Transformation of Turkish Retailing, Survival Strategies of Small and Medium-sized Retailers. Journal of Southern Europe and the Balkans, 2, 105-120. Boyaci, G. O. (2001). Pattern of Vertical and Horizontal Integration in Turkish Retailing. European Regional Digest, 32, 35-41. Cavelaars, P. (2003): Does Competition Enhancement Have Permanent Inflation Effects? Kyklos, 56(1), 69-94.
43
Cotterrill, R. W. (1986). Market Power in the Retail Food Industry: Evidence from Vermont. The Review of Economics and Statistics, 68(3), 379-386. Çelen, T. , Tarkan, E. & Taymaz, E. (2005). Fast Moving Consumer Goods: Competitive
Conditions and Power in Turkey. Ankara: TEPAV Dobson Consulting (1999). Buyer Power and Its Impact on Competition in The Food Retail Distribution Sector of the European Union. Report Prepared for the European
Commission DG IV. Dobson, P. & Waterson, M. (1997). Countervailing Power and Consumer Prices. Economic Journal, 107, 418–430. Dries, L., Reardon T. & Swinnen J. F. M. (2004). The Rapid Rise of Supermarkets in Central and Eastern Europe: Implications for the Agrifood Sector and Rural Development. Development Policy Review, 22(5), 525-56. Druker, D. M. (2003). Testing for Serial Correlation in Linear Panel-Data Models. Stata
Journal, 3, 168–177. ECB, (2001). Price Effects of Regulatory Reform in Selected Industries, March 2001. ECB, (2002). Monthly Bulletin, August 2002. Fernald, J. & Ramnath, S. (2004). The Acceleration in US Total Factor Productivity After 1995: The Role of Information Technology. Economic Perspectives, 28(1), 52-68. Goolsbee, A. & Syverson C. (2005). How do Incumbents Respond to The Threat of Entry? Evidence from Major Airlines. NBER Working Paper No. 11072. Greene, W. H. (1990). Econometric Analysis. New York: Prentice Hall, Inc. Hausman, J. & Leibtag E. (2004). CPI Bias from Supercenters: Does the BLS Know that Wal-Mart Exists? NBER Working Paper No.10712 Hausman, J. & Leibtag, E. (2005). Consumer Benefits from Increased Competition in Shopping Outlets: Measuring the Effect of Wal-Mart. NBER Working Paper No. 11809
44
Holmes T. (2001). Bar Codes lead to Frequent Deliveries and Superstores. Rand Journal
of Economics, 32 (4), 708-725. Jarmin, M., Klimek, S. D., & Miranda, J. (2005). The Role of Retail Chains: National, Regional, and Industry Results. US Census Bureau Center for Economic Studies Paper
No. CES-WP-05-30. Javorcik, S. Beata & Lie Y. (2008). Do The Biggest Aisles Serve a Brighter Future? Global Retail Chains and Their Implications for Romania. Centre for Economic Policy
Research Discussion Paper No:69,.
Lira, L. , Rivero, L. & Vergara, R. (2007). Entry and Prices: Evidence from the Supermarket Sector. Review of Industrial Organization, 31(4), 237-260 Marvel, H. P. (1978). Competition and Price Levels in the Retail Gasoline Market. The Review of Economics and Statistics, 60(2), 252-258. McKinsey Global Institute (2003). Türkiye, Verimlilik ve Büyüme Atılımının
Gerçekleştirilmesi. Istanbul, McKinsey Company. www.mckinsey.com/knowledge/cgi Minten, B., Randrianarison, L. & Swinnen, J. F.M. (2005). Global Retail Chains and Poor Farmers: Evidence from Madagascar. Working Paper, Contributed paper at the
IATRC Summer Symposium.
Neiss, K (2001). The Markup and Inflation: Evidence in OECD Countries. Canadian
Journal of Economics, 34, 570-587. Pagan, A. R. & Breusch, T. (1980). The Lagrange Multiplier Test and Its Applications to Model Specification in Econometrics. Review of Economic Studies, 47(1), 239-53. Przybyla M. & Roma M. (2005). Does Product Market Competition Reduce Inflation? Evidence from EU Countries and Sectors. Working Paper Series No:453, March.
European Central Bank.
Reardon T. & Hopkins R. (2006). The Supermarket Revolution in Developing Countries, Policies to Address Emerging Tensions Among Supermarkets, Suppliers and Traditional Retailers. The European Journal of Development Research, Vol. 18, Issue 4, 522-545.
45
Reardon, T. & Berdegue, J. (2002). The Rapid Rise of Supermarket in Latin American: Challenges and Opportunities for Development. Development Policy Review, 20(4), 371-88. Reardon, T., Timmer, C. P. , Barrett, C. B. & Berdegue, J. (2003). The Rise of Supermarkets in Africa, Asia, and Latin America. American Journal of Agricultural
Economics, 85(5), 1140-46. Sascha A. Weber & Sven M. Anders. (2007). Price Rigidity and market power in German retailing. Managerial and Decision Economics, 28(7), 737-749. Swinnen, J. F.M., Dries, L., Noeva, N. & Germenjia E. (2006). Foreign Investment, Supermarkets, and the Restructuring of Supply Chains: Evidence from Eastern European Dairy Sectors. Working Paper. Tokatlı, N. & Boyaci, G. O. (1998). The State and the Corporate Private Sector in the Recent Restructuring of Turkish Retailing. New Perspectives on Turkey. 18, 79-111. Tokatlı, N. & Boyaci, Y. (1997). Internalization of Retailing in Turkey. New Perspective
on Turkey, 17, 97-128. Tokatlı, N. & Boyaci, Y. E. (2002). Globalization and the Changing Political Economy of Distribution Channels in Turkey, 34, 217-238. Tokatlı, N. (1999).A Comparative Report on The Profiles of Retailing in the Emerging Markets of Europe, Turkey, Poland, Hungary, Portugal, and Greece. Journal of
Euromarketing, 8, 75-105. Vergara, R. and Rivero R. (2005). Productividad Sectorial en Chile, 1986-2001. Working
Paper No 286, Universidad Católica de Chile.
Wooldridge, J. M. 2002. Econometric Analysis of Cross Section and Panel Data. Cambridge, MA: MIT Press. Yucel, E. (2005). Does Ramadan Have Any Effect on Food Prices: A Dual-Calendar Perspective on the Turkish Data. University Library of Munich, Germany in its series
MPRA Paper with number 1141.
46
APPENDICES
APPENDIX A: TABLES
Table A. 1: Sector names and corresponding product groups for FMCG Sector name Product groups Sector name Product groups
Other products Band-aids Dairy products Cheese
Other products Batteries Dairy products Milks
Other products Garbage bags Dairy products Yogurts
[0.0520]*** [0.0519]*** [0.0520]*** [0.0516]*** [0.0512]*** [0.0513]*** [0.0515]*** [0.0516]*** Wald chi2 5803.40 5847.75 5767.44 5806.19 5733.78 5738.02 5704.04 5719.85 Log Likelihood 3114.11 3111.46 3116.78 3115.59 3117.70 3117.36 3119.53 3118.62 Observations 4424 4424 4424 4424 4424 4424 4424 4424 Number of products 79 79 79 79 79 79 79 79 Standard errors in brackets * significant at 10%; ** significant at 5%; *** significant at 1%
Table A. 18 (continued): Estimates for “beverages” (price_index is the dependent variable) (9) (10) (11) (12) (13) (14)
sharenational chain 0.0037 0.059
[0.0236] [0.0538]
(sharenational chain)2 -0.1181
[0.1033]
shareone_city 0.0115 -0.0351
[0.0355] [0.0547]
(shareone_city)2 0.0515
[0.0798]
sharemulti_city 0.0208 -0.0112 [0.0207] [0.0433] (sharemulti_city)2 0.0552 [0.0656] Constant 0.9304 0.926 0.9279 0.931 0.9215 0.9238 [0.0514]*** [0.0511]*** [0.0514]*** [0.0512]*** [0.0517]*** [0.0517]*** Wald chi2 5749.49 5813.20 5727.13 5773.26 5815.51 5830.99 Log Likelihood 3116.80 3113.55 3117.55 3114.70 3112.21 3111.96 Observations 4424 4424 4424 4424 4424 4424 Number of products 79 79 79 79 79 79 Standard errors in brackets * significant at 10%; ** significant at 5%; *** significant at 1%
62
Table A. 19: Estimates for “chocolates, candies and deserts” (price_index is the dependent variable) (1) (2) (3) (4) (5) (6) (7) (8) sharesupermarket -0.0296 0.0187
Log Likelihood 4445.22 4443.74 4449.47 4449.33 4441.78 4440.43 Observations 4424 4424 4424 4424 4424 4424 Number of products 79 79 79 79 79 79 Standard errors in brackets * significant at 10%; ** significant at 5%; *** significant at 1%
74
Table A. 31: Estimates for “Sugar, Candies and Deserts” (ln(price_index) is the dependent variable) (1) (2) (3) (4) (5) (6) (7) (8) sharesupermarket -0.025 0.0134
Log Likelihood 5703.64 5704.04 5699.49 5699.86 5701.47 5701.7 5706.45 5706.03 Observations 5040 5040 5040 5040 5040 5040 5040 5040 Number of products 90 90 90 90 90 90 90 90 Standard errors in brackets * significant at 10%; ** significant at 5%; *** significant at 1%
Table A. 31 (continued): Estimates for “Sugar, Candies and Deserts” (ln(price_index) is the dependent variable) (9) (10) (11) (12) (13) (14) sharenational chain 0.0016 -0.0586
Log Likelihood 834.34 836.11 838.94 839.70 836.27 839.74 Observations 1344 1344 1344 1344 1344 1344 Number of products 24 24 24 24 24 24 Standard errors in brackets * significant at 10%; ** significant at 5%; *** significant at 1%
82
APPENDIX B: FIGURES
Istanbul
0%
10%
20%
30%
40%
50%
60%
Jan-0
2
Mar
-02
May
-02
Jul-02
Sep
-02
Nov
-02
Jan-0
3
Mar
-03
May
-03
Jul-03
Sep
-03
Nov
-03
Jan-0
4
Mar
-04
May
-04
Jul-04
Sep
-04
Nov
-04
Jan-0
5
Mar
-05
May
-05
Jul-05
Sep
-05
Nov
-05
Jan-0
6
Mar
-06
May
-06
Jul-06
Bazaar Dfv-Kiosk Medium Market & Grocery Other Wholesalers supermarket
Figure A. 1: The market shares of specification1 stores in the FMCG market in Istanbul, January 2002-August 2006, seasonally adjusted series.
Ankara
0%
10%
20%
30%
40%
50%
60%
70%
Jan-0
2
Mar
-02
May
-02
Jul-0
2
Sep
-02
Nov-02
Jan-03
Mar
-03
May
-03
Jul-0
3
Sep
-03
Nov-03
Jan-0
4
Mar
-04
May
-04
Jul-0
4
Sep
-04
Nov-04
Jan-05
Mar
-05
May
-05
Jul-0
5
Sep
-05
Nov-
05
Jan-06
Mar
-06
May
-06
Jul-0
6
Bazaar Dfv-Kiosk Medium Market & Grocery Other Wholesalers supermarket
Figure A. 2: The market shares of specification1 stores in the FMCG market in Ankara, January 2002-August 2006, seasonally adjusted series
83
İzmir
0%
10%
20%
30%
40%
50%
60%
70%
Jan-02
Mar
-02
May
-02
Jul-02
Sep
-02
Nov-02
Jan-03
Mar
-03
May
-03
Jul-03
Sep
-03
Nov-03
Jan-04
Mar
-04
May
-04
Jul-04
Sep
-04
Nov-04
Jan-05
Mar
-05
May
-05
Jul-05
Sep
-05
Nov-05
Jan-06
Mar
-06
May
-06
Jul-06
Bazaar Dfv-Kiosk Medium Market & Grocery Other Wholesalers supermarket
Figure A. 3: The market shares of specification1 stores in the FMCG market in Izmir, January 2002-August 2006, seasonally adjusted series.
Mediterranean
0%
5%
10%
15%
20%
25%
30%
35%
40%
45%
50%
Jan-
02
Mar
-02
May
-02
Jul-0
2
Sep
-02
Nov-02
Jan-
03
Mar
-03
May
-03
Jul-0
3
Sep
-03
Nov-03
Jan-
04
Mar
-04
May
-04
Jul-0
4
Sep
-04
Nov-04
Jan-
05
Mar
-05
May
-05
Jul-0
5
Sep
-05
Nov-05
Jan-
06
Mar
-06
May
-06
Jul-0
6
Bazaar Dfv-Kiosk Medium Market & Grocery Other Wholesalers supermarket
Figure A. 4: The market shares of specification1 stores in the FMCG market in Mediterranean region, January 2002-August 2006, seasonally adjusted series
84
Marmara (excluding Istanbul)
0%
5%
10%
15%
20%
25%
30%
35%
40%
45%
50%
Jan-
02
Mar
-02
May
-02
Jul-0
2
Sep
-02
Nov
-02
Jan-
03
Mar
-03
May
-03
Jul-0
3
Sep
-03
Nov
-03
Jan-
04
Mar
-04
May
-04
Jul-0
4
Sep
-04
Nov
-04
Jan-
05
Mar
-05
May
-05
Jul-0
5
Sep
-05
Nov
-05
Jan-
06
Mar
-06
May
-06
Jul-0
6
Bazaar Dfv-Kiosk Medium Market & Grocery Other Wholesalers supermarket
Figure A. 5: The market shares of specification1 stores in the FMCG market in Marmara region, January 2002-August 2006, seasonally adjusted series.
East and Southeast Anatolia
0%
5%
10%
15%
20%
25%
30%
35%
40%
45%
50%
Jan-02
Mar
-02
May
-02
Jul-02
Sep
-02
Nov-
02
Jan-03
Mar
-03
May
-03
Jul-03
Sep
-03
Nov-03
Jan-04
Mar
-04
May
-04
Jul-04
Sep
-04
Nov-04
Jan-0
5
Mar
-05
May
-05
Jul-05
Sep
-05
Nov-
05
Jan-0
6
Mar
-06
May
-06
Jul-06
Bazaar Dfv-Kiosk Medium Market & Grocery Other Wholesalers supermarket Figure A. 6: The market shares of specification1 stores in the FMCG market in East and Southeast Anatolia January 2002-August 2006, seasonally adjusted series.
85
Central Anatolia (excluding Ankara)
0%
10%
20%
30%
40%
50%
60%
Jan-02
Mar
-02
May
-02
Jul-02
Sep
-02
Nov-02
Jan-0
3
Mar
-03
May
-03
Jul-03
Sep
-03
Nov-03
Jan-04
Mar
-04
May
-04
Jul-04
Sep
-04
Nov-
04
Jan-05
Mar
-05
May
-05
Jul-05
Sep
-05
Nov-05
Jan-0
6
Mar
-06
May
-06
Jul-06
Bazaar Dfv-Kiosk Medium Market & Grocery Other Wholesalers supermarket Figure A. 7: The market shares of specification1 stores in the FMCG market in Central Anatolia, January 2002-August 2006, seasonally adjusted series.
Blacksea
0%
10%
20%
30%
40%
50%
60%
Jan-02
Mar
-02
May
-02
Jul-02
Sep
-02
Nov-02
Jan-03
Mar
-03
May
-03
Jul-03
Sep
-03
Nov-03
Jan-04
Mar
-04
May
-04
Jul-04
Sep
-04
Nov-04
Jan-05
Mar
-05
May
-05
Jul-05
Sep
-05
Nov-05
Jan-06
Mar
-06
May
-06
Jul-06
Bazaar Dfv-Kiosk Medium Market & Grocery Other Wholesalers supermarket Figure A. 8: The market shares of specification1 stores in the FMCG market in Black sea region, January 2002-August 2006, seasonally adjusted series.
86
Agean Region (excluding Izmir)
0%
10%
20%
30%
40%
50%
60%
Jan-
02
Mar
-02
May
-02
Jul-0
2
Sep-0
2
Nov
-02
Jan-
03
Mar
-03
May
-03
Jul-0
3
Sep-0
3
Nov
-03
Jan-0
4
Mar
-04
May
-04
Jul-0
4
Sep-0
4
Nov-
04
Jan-
05
Mar
-05
May
-05
Jul-0
5
Sep-0
5
Nov
-05
Jan-
06
Mar
-06
May
-06
Jul-0
6
Bazaar Dfv-Kiosk Medium Market & Grocery Other Wholesalers supermarket
Figure A. 9: The market shares of specification 1 stores in the FMCG market in Central Anatolia, January 2002-August 2006, seasonally adjusted series.
Istanbul
0%
5%
10%
15%
20%
25%
Jan-
02
Mar
-02
May
-02
Jul-0
2
Sep
-02
Nov
-02
Jan-
03
Mar
-03
May
-03
Jul-0
3
Sep
-03
Nov
-03
Jan-
04
Mar
-04
May
-04
Jul-0
4
Sep
-04
Nov
-04
Jan-
05
Mar
-05
May
-05
Jul-0
5
Sep
-05
Nov
-05
Jan-
06
Mar
-06
May
-06
Jul-0
6
Discounter Local Chains Non-Chain National Chains Figure A. 10: The market shares of supermarket formats in Istanbul FMCG market, January 2002-August 2006, seasonally adjusted series
87
Ankara
0%
5%
10%
15%
20%
25%
30%
35%
Jan-
02
Mar
-02
May
-02
Jul-0
2
Sep
-02
Nov
-02
Jan-
03
Mar
-03
May
-03
Jul-0
3
Sep
-03
Nov
-03
Jan-
04
Mar
-04
May
-04
Jul-0
4
Sep
-04
Nov
-04
Jan-
05
Mar
-05
May
-05
Jul-0
5
Sep
-05
Nov
-05
Jan-
06
Mar
-06
May
-06
Jul-0
6
Discounter Local Chains Non-Chain National Chains
Figure A. 11: The market shares of supermarket formats in Ankara FMCG market, January 2002-August 2006, seasonally adjusted series
Izmir
0%
5%
10%
15%
20%
25%
30%
35%
40%
Jan-
02
Mar
-02
May
-02
Jul-0
2
Sep
-02
Nov
-02
Jan-
03
Mar
-03
May
-03
Jul-0
3
Sep
-03
Nov
-03
Jan-
04
Mar
-04
May
-04
Jul-0
4
Sep
-04
Nov
-04
Jan-
05
Mar
-05
May
-05
Jul-0
5
Sep
-05
Nov
-05
Jan-
06
Mar
-06
May
-06
Jul-0
6
Discounter Local Chains Non-Chain National Chains Figure A. 12: The market shares of supermarket formats in Izmir FMCG market, January 2002-August 2006, seasonally adjusted series
88
Mediterranean
0%
2%
4%
6%
8%
10%
12%
14%
16%
Jan-0
2
Mar
-02
May
-02
Jul-02
Sep
-02
Nov
-02
Jan-0
3
Mar
-03
May
-03
Jul-03
Sep
-03
Nov
-03
Jan-0
4
Mar
-04
May
-04
Jul-04
Sep
-04
Nov
-04
Jan-0
5
Mar
-05
May
-05
Jul-05
Sep
-05
Nov
-05
Jan-0
6
Mar
-06
May
-06
Jul-06
Discounter Local Chains Non-Chain National Chains Figure A. 13: The market shares of supermarket formats in Mediterranean FMCG market, January 2002-August 2006, seasonally adjusted series
Marmara (excluding Istanbul)
0%
5%
10%
15%
20%
25%
Jan-0
2
Mar
-02
May
-02
Jul-02
Sep
-02
Nov-02
Jan-03
Mar
-03
May
-03
Jul-03
Sep
-03
Nov-03
Jan-04
Mar
-04
May
-04
Jul-04
Sep
-04
Nov-04
Jan-0
5
Mar
-05
May
-05
Jul-05
Sep
-05
Nov-05
Jan-06
Mar
-06
May
-06
Jul-06
Discounter Local Chains Non-Chain National Chains Figure A. 14: The market shares of supermarket formats in Marmara FMCG market, January 2002-August 2006, seasonally adjusted series
89
East and Southeast Anatolia
0%
2%
4%
6%
8%
10%
12%
14%
16%
18%
20%
Jan-
02
Mar
-02
May
-02
Jul-0
2
Sep
-02
Nov
-02
Jan-
03
Mar
-03
May
-03
Jul-0
3
Sep
-03
Nov
-03
Jan-
04
Mar
-04
May
-04
Jul-0
4
Sep
-04
Nov
-04
Jan-
05
Mar
-05
May
-05
Jul-0
5
Sep
-05
Nov
-05
Jan-
06
Mar
-06
May
-06
Jul-0
6
Discounter Local Chains Non-Chain National Chains Figure A. 15: The market shares of supermarket formats in East and Southeast Anatolia FMCG market, January 2002-August 2006, seasonally adjusted series
Central Anatolia (excluding Ankara)
0%
2%
4%
6%
8%
10%
12%
14%
16%
18%
20%
Jan-0
2
Mar
-02
May
-02
Jul-0
2
Sep
-02
Nov-
02
Jan-0
3
Mar
-03
May
-03
Jul-0
3
Sep
-03
Nov-
03
Jan-0
4
Mar
-04
May
-04
Jul-0
4
Sep
-04
Nov-04
Jan-0
5
Mar
-05
May
-05
Jul-0
5
Sep
-05
Nov-
05
Jan-0
6
Mar
-06
May
-06
Jul-0
6
Discounter Local Chains Non-Chain National Chains Figure A. 16: The market shares of supermarket formats in Central Anatolia FMCG market, January 2002-August 2006, seasonally adjusted series
90
Blacksea Region
0%
5%
10%
15%
20%
25%
Jan-
02
Mar
-02
May
-02
Jul-0
2
Sep
-02
Nov
-02
Jan-
03
Mar
-03
May
-03
Jul-0
3
Sep
-03
Nov
-03
Jan-
04
Mar
-04
May
-04
Jul-0
4
Sep
-04
Nov
-04
Jan-
05
Mar
-05
May
-05
Jul-0
5
Sep
-05
Nov
-05
Jan-
06
Mar
-06
May
-06
Jul-0
6
Discounter Non-Chain National Chains Figure A. 17: The market shares of supermarket formats in Black sea FMCG market, January 2002-August 2006, seasonally adjusted series
Agean Region (excluding Izmir)
0%
5%
10%
15%
20%
25%
Jan-0
2
Mar
-02
May
-02
Jul-0
2
Sep-0
2
Nov-
02
Jan-0
3
Mar
-03
May
-03
Jul-0
3
Sep-0
3
Nov-
03
Jan-0
4
Mar
-04
May
-04
Jul-0
4
Sep-0
4
Nov-
04
Jan-0
5
Mar
-05
May
-05
Jul-0
5
Sep-0
5
Nov-
05
Jan-0
6
Mar
-06
May
-06
Jul-0
6
Discounter Local Chains Non-Chain National Chains
Figure A. 18: The market shares of supermarket formats in Aegean region FMCG market, January 2002-August 2006, seasonally adjusted series
91
Istanbul
0%
5%
10%
15%
20%
25%
30%
35%
Jan-
02
Mar
-02
May
-02
Jul-0
2
Sep
-02
Nov
-02
Jan-
03
Mar
-03
May
-03
Jul-0
3
Sep
-03
Nov
-03
Jan-
04
Mar
-04
May
-04
Jul-0
4
Sep
-04
Nov
-04
Jan-
05
Mar
-05
May
-05
Jul-0
5
Sep
-05
Nov
-05
Jan-
06
Mar
-06
May
-06
Jul-0
6
One city supermarkets Multi-city supermarkets Figure A. 19: The market shares of city-based supermarket formats in Istanbul FMCG market, January 2002-August 2006, seasonally adjusted series.
Ankara
0%
5%
10%
15%
20%
25%
30%
35%
40%
Jan-0
2
Mar
-02
May
-02
Jul-0
2
Sep
-02
Nov
-02
Jan-
03
Mar
-03
May
-03
Jul-0
3
Sep
-03
Nov
-03
Jan-
04
Mar
-04
May
-04
Jul-0
4
Sep
-04
Nov-
04
Jan-0
5
Mar
-05
May
-05
Jul-0
5
Sep
-05
Nov
-05
Jan-
06
Mar
-06
May
-06
Jul-0
6
One city supermarkets Multi-city supermarkets
Figure A. 20: The market shares of city-based supermarket formats in Ankara FMCG market, January 2002-August 2006, seasonally adjusted series.
92
Izmir
0%
10%
20%
30%
40%
50%
Jan-0
2
Mar
-02
May
-02
Jul-0
2
Sep
-02
Nov
-02
Jan-
03
Mar
-03
May
-03
Jul-0
3
Sep
-03
Nov
-03
Jan-
04
Mar
-04
May
-04
Jul-0
4
Sep
-04
Nov-
04
Jan-0
5
Mar
-05
May
-05
Jul-0
5
Sep
-05
Nov
-05
Jan-
06
Mar
-06
May
-06
Jul-0
6
One city supermarkets Multi-city supermarkets
Figure A. 21: The market shares of city-based supermarket formats in Izmir FMCG market, January 2002-August 2006, seasonally adjusted series.
Mediterranean
0%
2%
4%
6%
8%
10%
12%
14%
16%
18%
20%
Jan-
02
Mar
-02
May
-02
Jul-0
2
Sep
-02
Nov
-02
Jan-
03
Mar
-03
May
-03
Jul-0
3
Sep
-03
Nov
-03
Jan-
04
Mar
-04
May
-04
Jul-0
4
Sep
-04
Nov
-04
Jan-
05
Mar
-05
May
-05
Jul-0
5
Sep
-05
Nov
-05
Jan-
06
Mar
-06
May
-06
Jul-0
6
One city supermarkets Multi-city supermarkets Figure A. 22: The market shares of city-based supermarket formats in Mediterranean Region FMCG market, January 2002-August 2006, seasonally adjusted series.
93
Marmara (excluding Istanbul)
0%
5%
10%
15%
20%
25%
Jan-
02
Mar
-02
May
-02
Jul-0
2
Sep
-02
Nov
-02
Jan-
03
Mar
-03
May
-03
Jul-0
3
Sep
-03
Nov
-03
Jan-
04
Mar
-04
May
-04
Jul-0
4
Sep
-04
Nov
-04
Jan-
05
Mar
-05
May
-05
Jul-0
5
Sep
-05
Nov
-05
Jan-
06
Mar
-06
May
-06
Jul-0
6
One city supermarkets Multi-city supermarkets
Figure A. 23: The market shares of city-based supermarket formats in Marmara FMCG market, January 2002-August 2006, seasonally adjusted series.
East and Southeast Anatolia
0%
5%
10%
15%
20%
25%
Jan-
02
Mar
-02
May
-02
Jul-0
2
Sep
-02
Nov
-02
Jan-
03
Mar
-03
May
-03
Jul-0
3
Sep
-03
Nov
-03
Jan-
04
Mar
-04
May
-04
Jul-0
4
Sep
-04
Nov
-04
Jan-
05
Mar
-05
May
-05
Jul-0
5
Sep
-05
Nov
-05
Jan-
06
Mar
-06
May
-06
Jul-0
6
One city supermarkets Multi-city supermarkets Figure A. 24: The market shares of city-based supermarket formats in East and Southeast Anatolia FMCG market, January 2002-August 2006, seasonally adjusted series.
94
Central Anatolia (excluding Ankara)
0%
5%
10%
15%
20%
25%
Jan-
02
Mar
-02
May
-02
Jul-0
2
Sep
-02
Nov
-02
Jan-
03
Mar
-03
May
-03
Jul-0
3
Sep
-03
Nov
-03
Jan-
04
Mar
-04
May
-04
Jul-0
4
Sep
-04
Nov
-04
Jan-
05
Mar
-05
May
-05
Jul-0
5
Sep
-05
Nov
-05
Jan-
06
Mar
-06
May
-06
Jul-0
6
One city supermarkets Multi-city supermarkets
Figure A. 25: The market shares of city-based supermarket formats in Central Anatolia FMCG market, January 2002-August 2006, seasonally adjusted series.
Blacksea Region
0%
5%
10%
15%
20%
25%
Jan-
02
Mar
-02
May
-02
Jul-0
2
Sep
-02
Nov
-02
Jan-
03
Mar
-03
May
-03
Jul-0
3
Sep
-03
Nov
-03
Jan-
04
Mar
-04
May
-04
Jul-0
4
Sep
-04
Nov
-04
Jan-
05
Mar
-05
May
-05
Jul-0
5
Sep
-05
Nov
-05
Jan-
06
Mar
-06
May
-06
Jul-0
6
One city supermarkets Multi-city supermarkets Figure A. 26: The market shares of city-based supermarket formats in Black sea Region FMCG market, January 2002-August 2006, seasonally adjusted series.
95
Agean Region (excluding Izmir)
0%
5%
10%
15%
20%
25%
Jan-0
2
Mar
-02
May
-02
Jul-0
2
Sep-0
2
Nov-
02
Jan-0
3
Mar
-03
May
-03
Jul-0
3
Sep-0
3
Nov-
03
Jan-0
4
Mar
-04
May
-04
Jul-0
4
Sep-0
4
Nov-
04
Jan-0
5
Mar
-05
May
-05
Jul-0
5
Sep-0
5
Nov-
05
Jan-0
6
Mar
-06
May
-06
Jul-0
6
One city supermarkets Multi-city supermarkets
Figure A. 27: The market shares of city-based supermarket formats in Aegean Region FMCG market, January 2002-August 2006, seasonally adjusted series.
AB
0%
10%
20%
30%
40%
50%
60%
2002 2003 2004 2005 2006*
Bazaar Dfv-Kiosk Medium Market & Grocery Other Wholesalers supermarket
Figure A. 28: The shares of retailers in total FMCG consumption of socioeconomic group AB (2002-2006*, *first eight months are used for 2006)
96
C1
0%
5%
10%
15%
20%
25%
30%
35%
40%
45%
50%
2002 2003 2004 2005 2006*
Bazaar Dfv-Kiosk Medium Market & Grocery Other Wholesalers supermarket Figure A. 29: The shares of retailers in total FMCG consumption of socioeconomic group C1 (2002-2006*, *first eight months are used for 2006)
C2
0%
5%
10%
15%
20%
25%
30%
35%
40%
45%
2002 2003 2004 2005 2006*
Bazaar Dfv-Kiosk Medium Market & Grocery Other Wholesalers supermarket Figure A. 30: The shares of retailers in total FMCG consumption of socioeconomic group C2 (2002-2006*, *first eight months are used for 2006)
97
DE
0%
10%
20%
30%
40%
50%
60%
2002 2003 2004 2005 2006*
Bazaar Dfv-Kiosk Medium Market & Grocery Other Wholesalers supermarket
Figure A. 31: The shares of retailers in total FMCG consumption of socioeconomic group DE (2002-2006*, *first eight months are used for 2006)
AB
0%
5%
10%
15%
20%
25%
30%
35%
40%
45%
2002 2003 2004 2005 2006*
Discounter Local Chains NON-CHN National Chains
Figure A. 32: The shares of supermarket types as a share of total supermarket consumption of socioeconomic group AB (2002-2006*, *first eight months are used for 2006)
98
C1
0%
10%
20%
30%
40%
50%
60%
2002 2003 2004 2005 2006*
Discounter Local Chains NON-CHN National Chains
Figure A. 33: The shares of supermarket formats as a share of total supermarket consumption of socioeconomic group C1 (2002-2006*, *first eight months are used for 2006)
C2
0%
10%
20%
30%
40%
50%
60%
2002 2003 2004 2005 2006*
Discounter Local Chains NON-CHN National Chains
Figure A. 34: The shares of supermarket formats as a share of total supermarket consumption of socioeconomic group C2 (2002-2006*, *first eight months are used for 2006)
99
DE
0%
10%
20%
30%
40%
50%
60%
70%
2002 2003 2004 2005 2006*
Discounter Local Chains NON-CHN National Chains
Figure A. 35: The shares of supermarket formats as a share of total supermarket consumption of socioeconomic group DE (2002-2006*, *first eight months are used for 2006)
AB
0%
10%
20%
30%
40%
50%
60%
70%
2002 2003 2004 2005 2006*
One-city supermarket Multi-city supermarket Figure A. 36: The shares of supermarket formats with city classification as a share of total supermarket consumption of socioeconomic group AB (2002-2006*, *first eight months are used for 2006)
100
C1
0%
10%
20%
30%
40%
50%
60%
2002 2003 2004 2005 2006*
One-city supermarket Multi-city supermarket
Figure A. 37: The shares of supermarket formats with city classification as a share of total supermarket consumption of socioeconomic Group C1 (2002-2006*, *first eight months are used for 2006)
C2
0%
10%
20%
30%
40%
50%
60%
70%
2002 2003 2004 2005 2006*
One-city supermarket Multi-city supermarket
Figure A. 38: The shares of supermarket formats with city classification as a share of total supermarket consumption of socioeconomic group C2 (2002-2006*, *first eight months are used for 2006)
101
DE
0%
10%
20%
30%
40%
50%
60%
70%
2002 2003 2004 2005 2006*
One-city supermarket Multi-city supermarket
Figure A. 39: The shares of supermarket formats with city classification as a share of total supermarket consumption of socioeconomic group DE (2002-2006*, *first eight months are used for 2006)