The Impact of pH on p CO 2 Levels in Florida Lakes. Jenney L. Kellogg Florida LAKEWATCH Dept. of Fisheries and Aquatic Sciences University of Florida Gainesville, FL. Introduction. Growing research dealing with supersaturation of carbon dioxide in freshwater systems. (Cole et al. 1994) - PowerPoint PPT Presentation
The Impact of pH The Impact of pH on on p p CO CO 2 2 Levels in Levels in Florida Lakes Florida Lakes Jenney L. Kellogg Jenney L. Kellogg Florida LAKEWATCH Florida LAKEWATCH Dept. of Fisheries and Aquatic Dept. of Fisheries and Aquatic Sciences Sciences University of Florida University of Florida Gainesville, FL Gainesville, FL
Transcript
The Impact of pH on The Impact of pH on ppCOCO22 Levels in Florida Levels in Florida
LakesLakes
Jenney L. KelloggJenney L. Kellogg
Florida LAKEWATCHFlorida LAKEWATCHDept. of Fisheries and Aquatic SciencesDept. of Fisheries and Aquatic Sciences
University of FloridaUniversity of FloridaGainesville, FLGainesville, FL
IntroductionIntroduction
Growing research dealing with Growing research dealing with supersaturation of carbon dioxide in supersaturation of carbon dioxide in freshwater systems. (Cole et al. 1994)freshwater systems. (Cole et al. 1994)
Focus on heterotrophy in lakes.Focus on heterotrophy in lakes.
ObjectivesObjectives
Evaluate Evaluate ppCOCO22 levels in Florida Lakes. levels in Florida Lakes.
Examine factors that may influence Examine factors that may influence ppCOCO22
levels in Florida Lakes.levels in Florida Lakes.
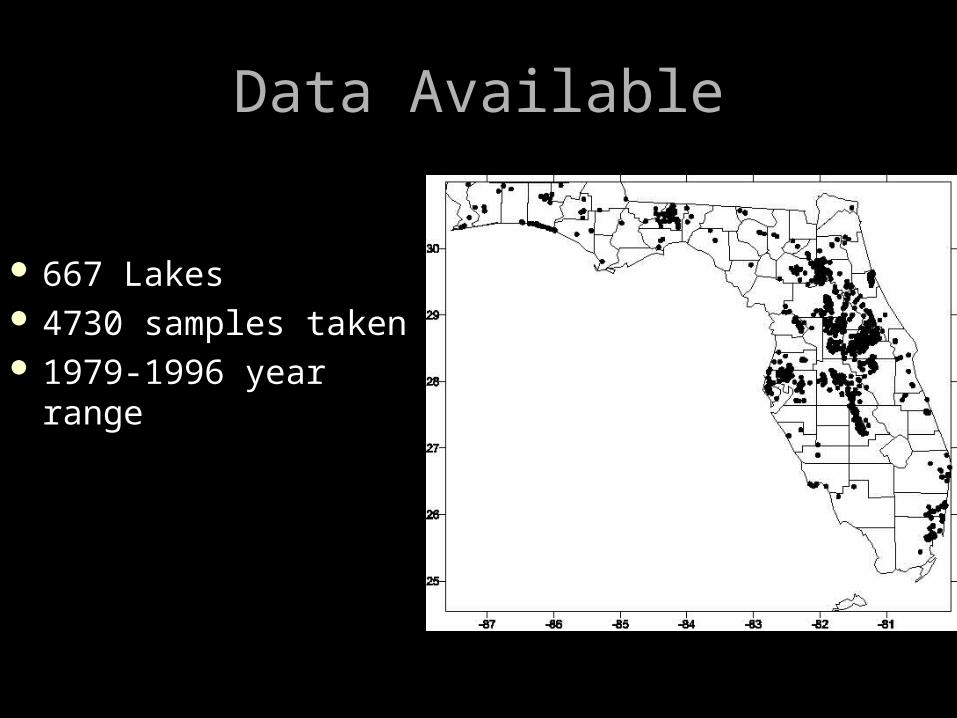
Data AvailableData Available
667 Lakes 667 Lakes 4730 samples taken4730 samples taken 1979-1996 year range1979-1996 year range
Summary of Lake ConditionsSummary of Lake Conditions
MethodsMethods
Data were compiled from various studies Data were compiled from various studies conducted in Florida from 1979-1996. (Canfield conducted in Florida from 1979-1996. (Canfield 1981, Canfield and Hoyer 1992, Florida 1981, Canfield and Hoyer 1992, Florida LAKEWATCH 1993,1996, and Greis 1995) LAKEWATCH 1993,1996, and Greis 1995)
Data included pH, Total Alkalinity, Specific Data included pH, Total Alkalinity, Specific Conductance, TP, TN, Chloride, Silicon, Sulfate, Conductance, TP, TN, Chloride, Silicon, Sulfate, Calcium, Magnesium, Sodium, Potassium, Iron, Calcium, Magnesium, Sodium, Potassium, Iron, Chlorophyll, Color, and Secchi Depth.Chlorophyll, Color, and Secchi Depth.
MethodsMethods
pCOpCO2 2 measured indirectly using:measured indirectly using:Total Alkalinity (Total Alkalinity (µequiv/L)µequiv/L)Specific Conductance (µS/cm)Specific Conductance (µS/cm)pHpHWater Temperature (°C)Water Temperature (°C)
Correlation AnalysisCorrelation AnalysisModel the effects of changes in pH, Model the effects of changes in pH,
Alkalinity, Temperature and Specific Alkalinity, Temperature and Specific ConductanceConductance
G. E. Hutchinson. 1975. A treatise on limnology, volume 2, part 2. Wiley, New York.C. Juday, E. A. Birge & W. W. Meloche. 1935. The carbon dioxide and hydrogen ion content of the lake waters of northeastern Wisconsin. Wisconsin Academy of Sciences, Arts, and Letters
ConclusionsConclusions
80% of Florida lakes sampled were 80% of Florida lakes sampled were supersaturated with carbon dioxide.supersaturated with carbon dioxide.
pH is the controlling factor for indirectly pH is the controlling factor for indirectly measured levels of measured levels of ppCOCO2 2 in Florida in Florida
freshwater lakes.freshwater lakes.
Is Is ppCOCO22 controlling pH or is pH controlling controlling pH or is pH controlling
ppCOCO22??
pH is the controlling factor for measured pH is the controlling factor for measured levels of levels of ppCOCO2.2.
Other Processes Leading to Other Processes Leading to Excess COExcess CO22
Net heterotrophy at the ecosystem scale.Net heterotrophy at the ecosystem scale. Injection of COInjection of CO22 rich groundwater. rich groundwater.Precipitation of dissolved carbonates.Precipitation of dissolved carbonates.Mixing of an in-lake source of acidity with Mixing of an in-lake source of acidity with
an input of bicarbonate.an input of bicarbonate.Emergent macrophytesEmergent macrophytes
Other ConsiderationsOther Considerations
Lakes supersaturated with Lakes supersaturated with ppCOCO22 may not may not
be heterotrophic.be heterotrophic.
AcknowledgementsAcknowledgements Florida LAKEWATCHFlorida LAKEWATCH NALMS Student Travel GrantNALMS Student Travel Grant Dr. Canfield, Mark Hoyer, Dr. Roger Dr. Canfield, Mark Hoyer, Dr. Roger
Bachmann, Department of Fisheries and Bachmann, Department of Fisheries and Aquatic Sciences, University of Florida; Aquatic Sciences, University of Florida; Florida LakewatchFlorida Lakewatch
Carlos Duarte, ICarlos Duarte, IMEDEA (CSIC-UIB), MEDEA (CSIC-UIB), Instituto Mediterráneo de. Estudios Instituto Mediterráneo de. Estudios AvanzadosAvanzados
Yves Prairie, Yves Prairie, Département des Sciences Département des Sciences biologiques, Université du Québec à biologiques, Université du Québec à MontréalMontréal