The Impact of Rail Trails on Nearby Residential Property Values: A Case Study of the Minuteman Bikeway and Lexington, Massachusetts Presented by Susanna Hilfer Salem State University GGR903, S1 December 18, 2007
Transcript
The Impact of Rail Trails on Nearby Residential Property Values:
A Case Study of the Minuteman Bikeway and Lexington,
Massachusetts
Presented by Susanna HilferSalem State University GGR903, S1
December 18, 2007
The Wayside Rail Trail
• Proposed multi-use rail trail to go through 7 towns from Waltham to Berlin, MA, including town of Weston
• After task force review, Weston town government voted against construction of the trail
• One of the primary concerns was the potential decrease in property values of abutters
Weston concerns not uncommon
• Crime and property values commonly sited concerns when trails are proposed
• Trail advocates argue that the opposite is true.
Studies on property values in relation to greenspace
• Anecdotal studies suggest that rail trails actually increase values (Rails to Trails Conservancy)
• Study of property values & urban parks found that property values decrease with proximity to parks due to negative elements like noise and crime
• 2 studies using hedonic analysis to isolate variables suggest values increase with nearness to trails, but that results may vary depending on the trail
• Real estate study of 2 Mass trails saw decreasing time on market with increased proximity to trails
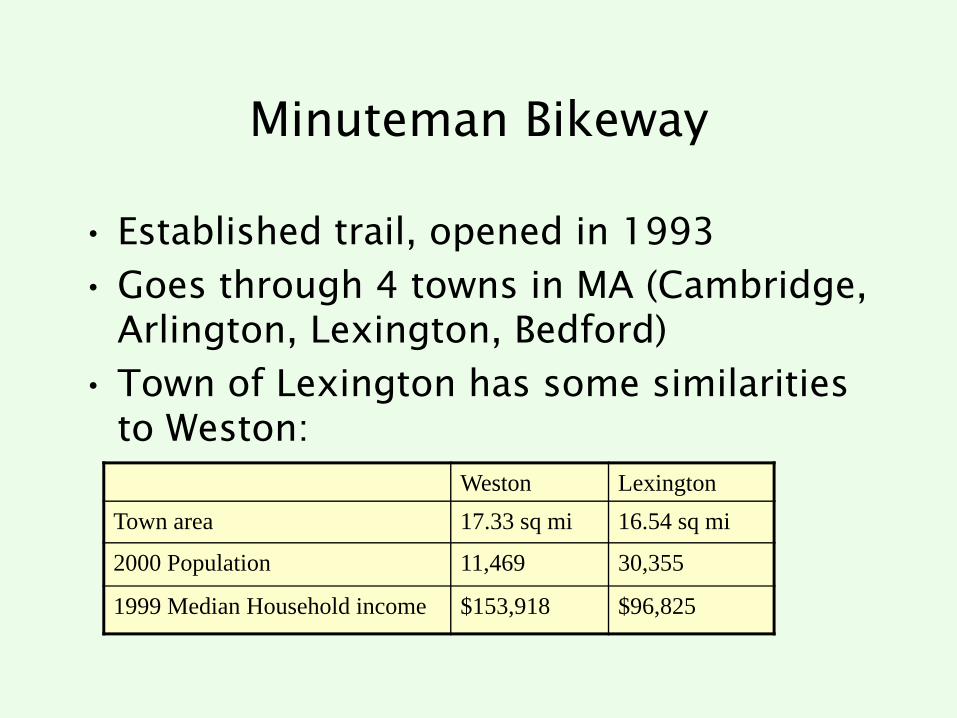
Minuteman Bikeway
• Established trail, opened in 1993• Goes through 4 towns in MA (Cambridge,
Arlington, Lexington, Bedford)• Town of Lexington has some similarities
to Weston:Weston Lexington
Town area 17.33 sq mi 16.54 sq mi
2000 Population 11,469 30,355
1999 Median Household income $153,918 $96,825
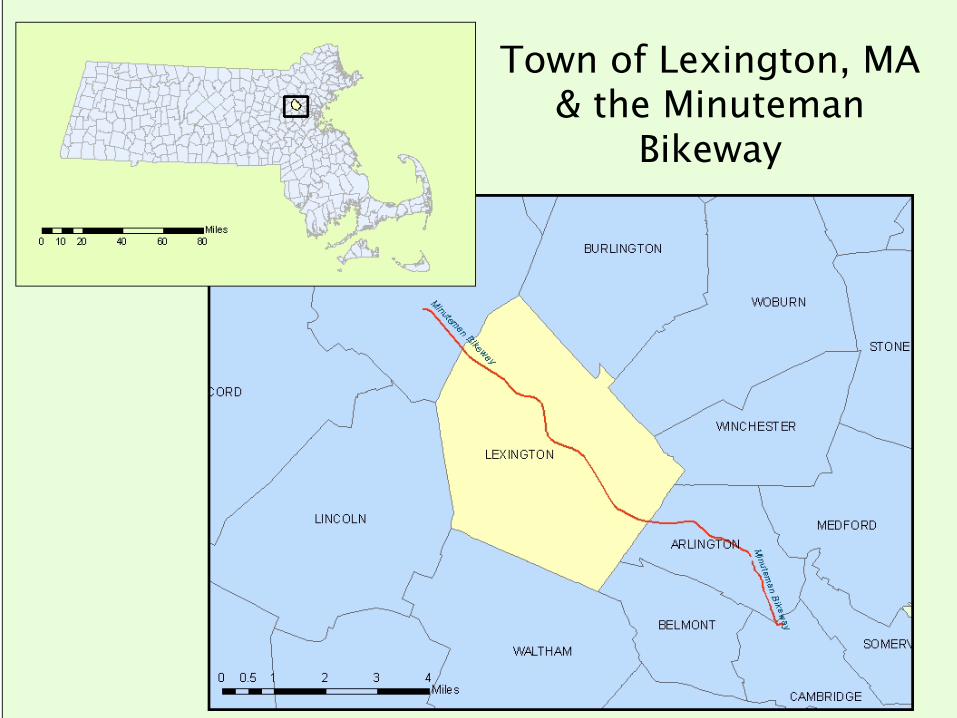
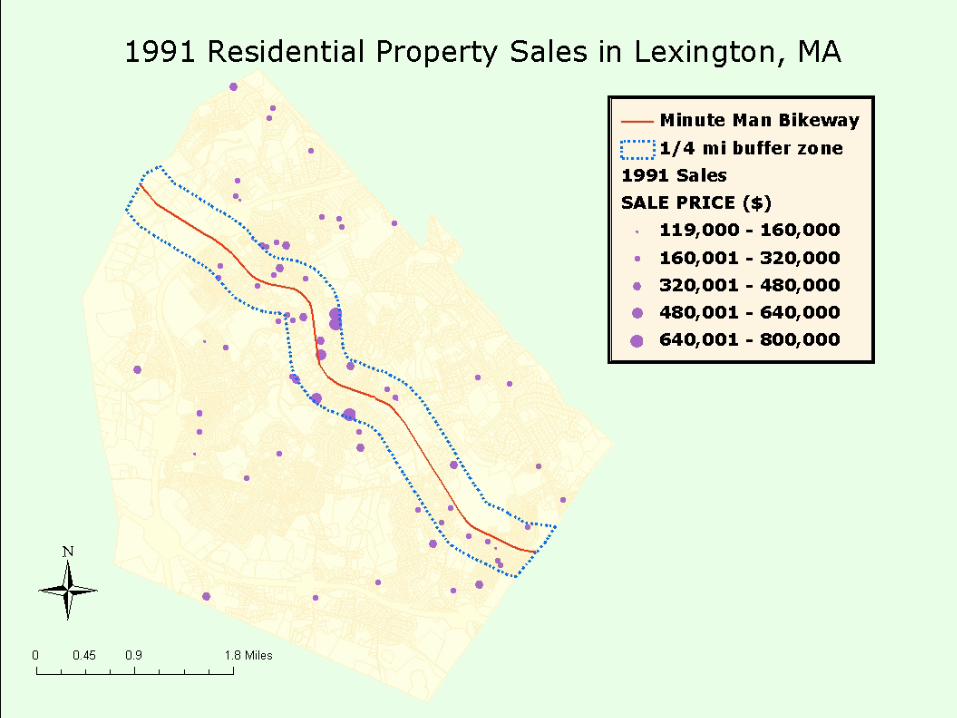
Town of Lexington, MA & the Minuteman
Bikeway
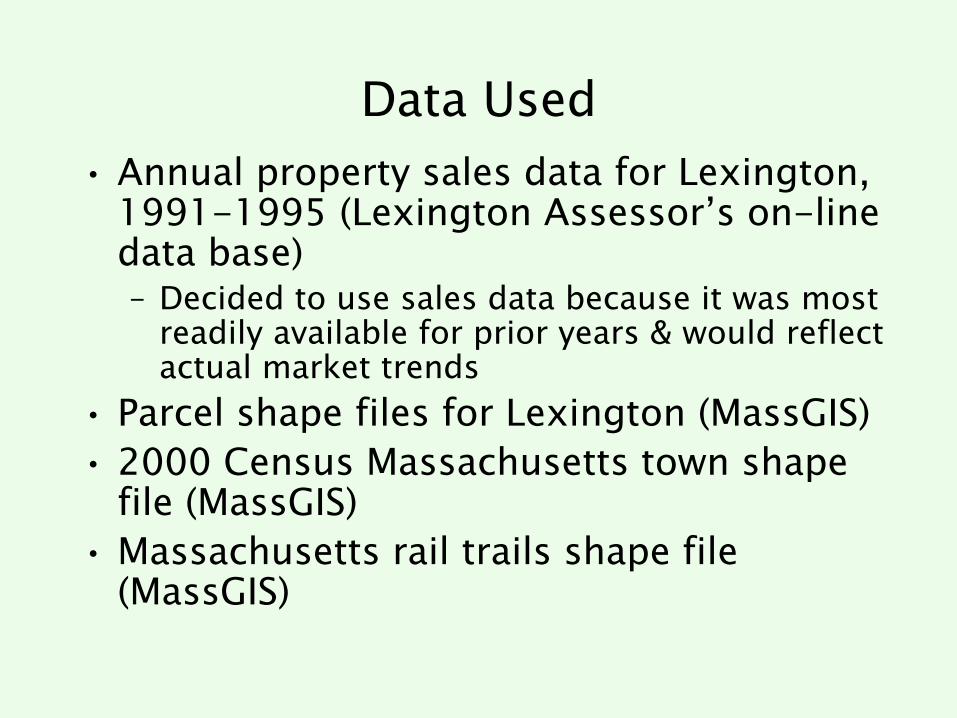
Data Used• Annual property sales data for Lexington,
1991-1995 (Lexington Assessor’s on-line data base)– Decided to use sales data because it was most
readily available for prior years & would reflect actual market trends
• Parcel shape files for Lexington (MassGIS)• 2000 Census Massachusetts town shape
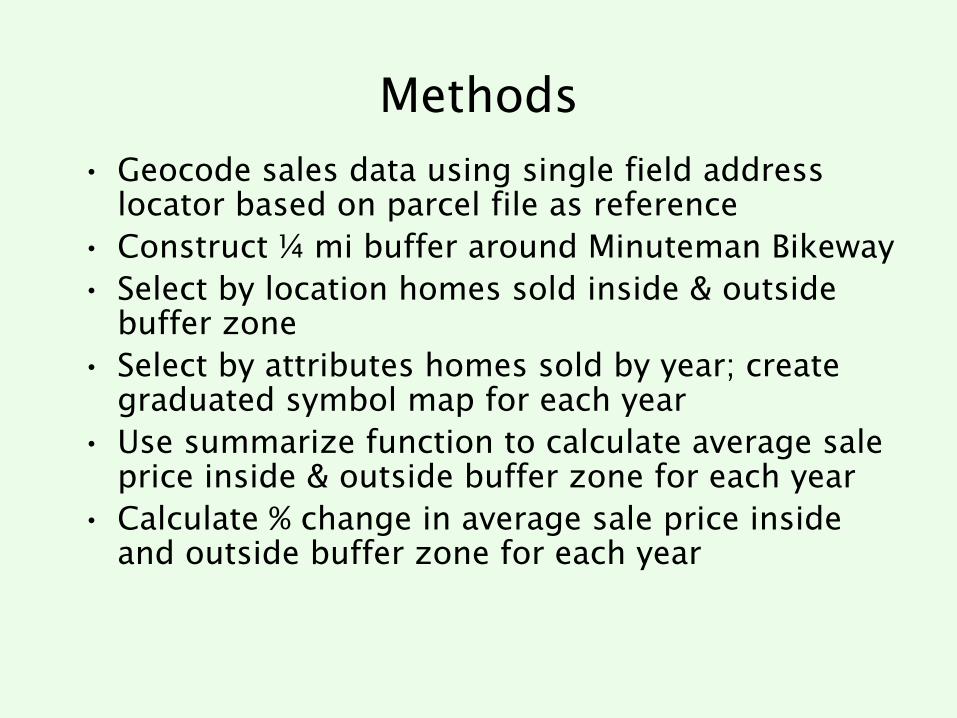
Methods• Geocode sales data using single field address
locator based on parcel file as reference• Construct ¼ mi buffer around Minuteman Bikeway• Select by location homes sold inside & outside
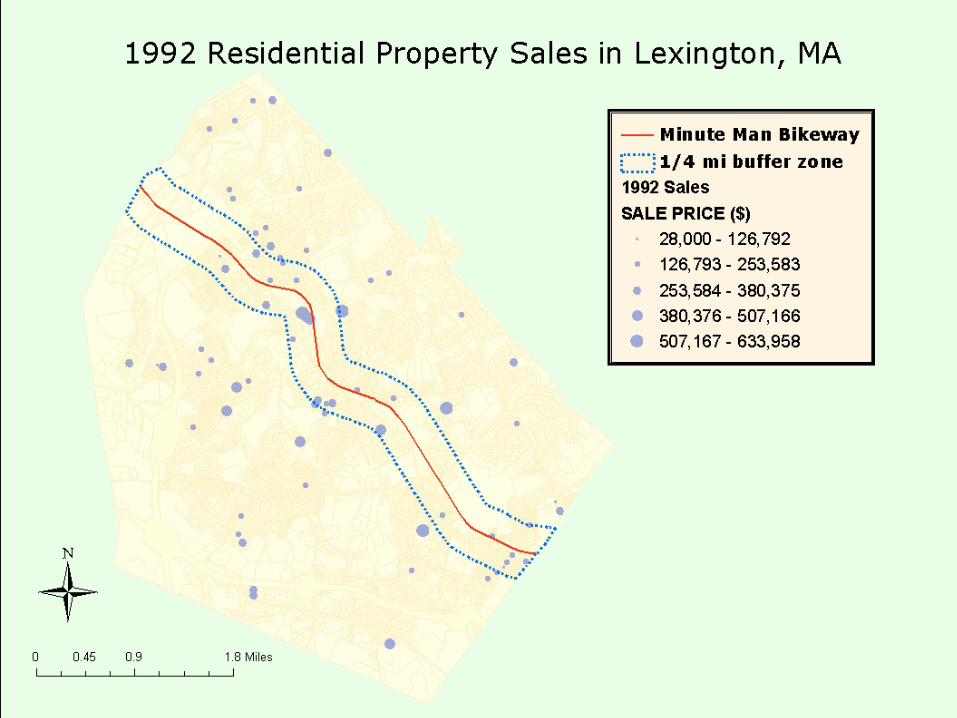
buffer zone• Select by attributes homes sold by year; create
graduated symbol map for each year• Use summarize function to calculate average sale
price inside & outside buffer zone for each year• Calculate % change in average sale price inside
and outside buffer zone for each year
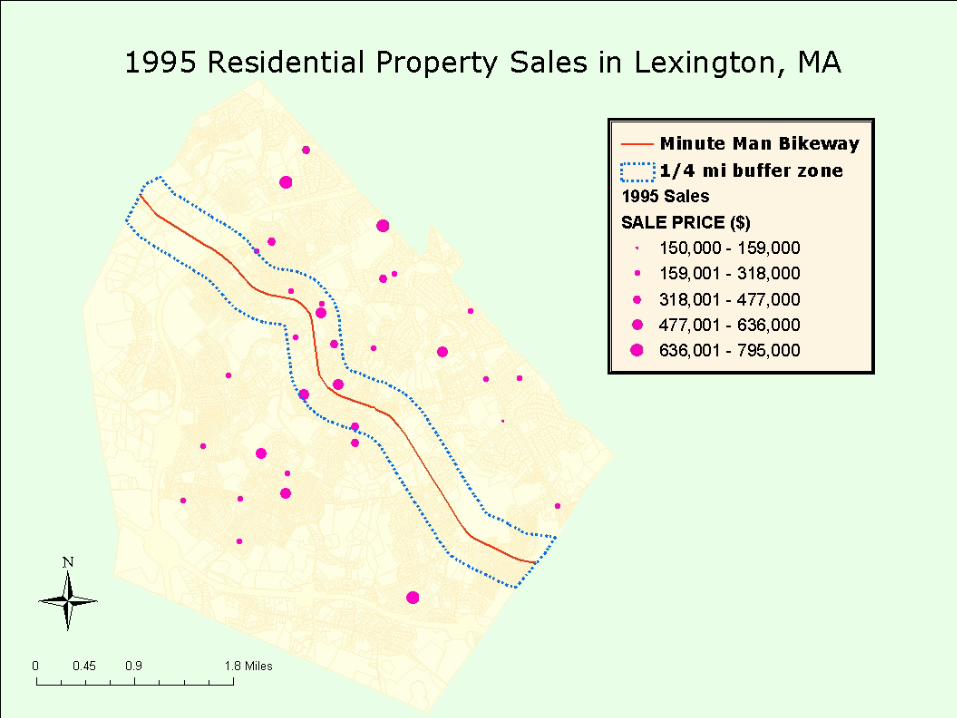
Study Goals
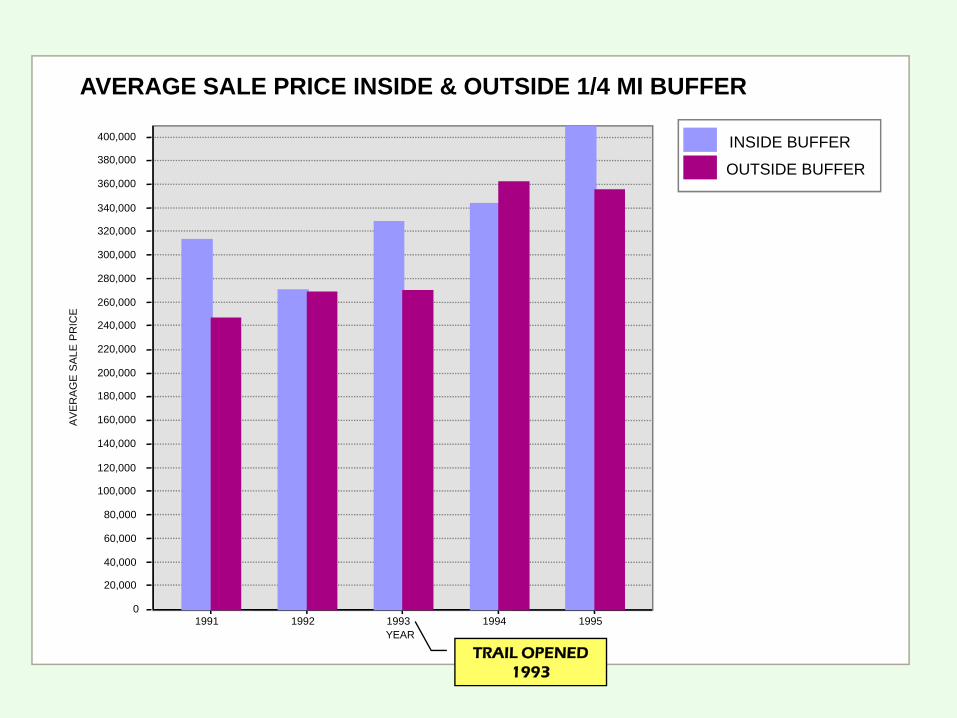
• Goal was to analyze the change in home sale prices inside the buffer before and after the opening of the trail, in comparison to change in average prices outside buffer
Results
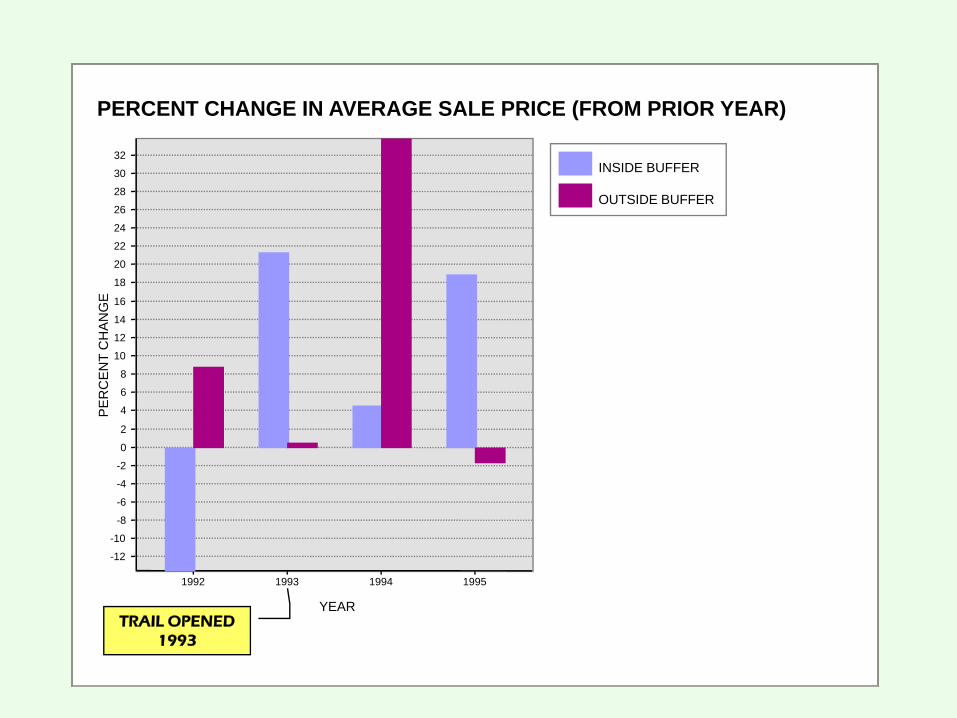
• Average sale price within buffer dropped one year prior to trail opening, but then came back up the year of the opening
• Steady climb of average price within buffer after actual trail opening.
• Prices outside buffer fluctuated.
INSIDE BUFFER
OUTSIDE BUFFER
AVERAGE SALE PRICE INSIDE & OUTSIDE 1/4 MI BUFFER
YEAR1991 1992 1993 1994 1995
AV
ER
AG
E S
ALE
PR
ICE
400,000
380,000
360,000
340,000
320,000
300,000
280,000
260,000
240,000
220,000
200,000
180,000
160,000
140,000
120,000
100,000
80,000
60,000
40,000
20,000
0
TRAIL OPENED 1993
INSIDE BUFFER
OUTSIDE BUFFER
PERCENT CHANGE IN AVERAGE SALE PRICE (FROM PRIOR YEAR)
YEAR
1992 1993 1994 1995
PE
RC
EN
T C
HA
NG
E
32
30
28
26
24
22
20
18
16
14
12
10
8
6
4
2
0
-2
-4
-6
-8
-10
-12
TRAIL OPENED 1993
Conclusions
• Overall inconclusive• Anticipation/fear of trail prior to
opening may have more affect than actual trail opening
• If trends continue, price growth within buffer may surpass growth outside
Thoughts for next time• Choose wider range of study years to better show
trends – 2 years before & after the trail opening not enough
to show solid trends. Why not add current data?• Choice of ¼-mile buffer was arbitrary
– smaller buffer (only abutting properties) might yield different results.
• Possibly use assessed property values instead of average sale prices.– increase the amount of data present– allow comparisons of values for particular
properties over a number of years.• Use mean values instead of averages
– might be more representative of the overall trend in each area.
Sources• http://www.mass.gov/mgis/massgis.htm• http://ci.lexington.ma.us/ • Buffington A:An Assessment of Urban Park Values and
Residential Properties Utilizng GIS in Rochester, Minnesota. Winona, MN, Saint Mary's University, 2000
• Economic Benefits of Trails and Greenways. Washington, DC, Rails to Trails Conservancy, 2002
• Public Choices and Property Values: Evidence from Greenways in Indianpolis. Center for Urban Policy and the Environment, 2003
• Nicholls S: The Impact of Greenways on Property Values: Evidence from Austin, Texis. Journal of Leisure Research 37:321-341, 2005
• Della Penna C:Home Sales near Two Massachusetts Rail Trails. Northampton, MA, The Murphys Realtors, Inc., 2006