Munich Personal RePEc Archive The impact of firm-type dominance on regional manufacturing growth Salvary, Stanley 23 August 2007 Online at https://mpra.ub.uni-muenchen.de/12440/ MPRA Paper No. 12440, posted 07 Jan 2009 05:24 UTC
Transcript
Munich Personal RePEc Archive
The impact of firm-type dominance on
regional manufacturing growth
Salvary, Stanley
23 August 2007
Online at https://mpra.ub.uni-muenchen.de/12440/
MPRA Paper No. 12440, posted 07 Jan 2009 05:24 UTC
THE IMPACT OF FIRM-TYPE DOMINANCE ON REGIONAL MANUFACTURING GROWTH
Stanley C. W. Salvary
ABSTRACT
Availability of financial capital and location decisions are variables that influence regional manufacturing output. This study maintains that a region’s manufacturing growth depends upon the region’s firm-type dominance. That is, the type of firms that dominate the region’s manufacturing output can be classified as non-local (national or foreign - NF) vs. local and large vs. small. Accordingly, for policy analysis, regions can be classified by firm-type dominance. This distinction is important since, invariably, location decision options and availability of financial capital are more favourable for the larger NF firms than for local firms. In an attempt to assess the impact of firm-type dominance, this study draws upon the dominant industry model [Salvary 1987] which has established that, in any given region, there is a dominant industry (the driving force of the region) to which a region’s manufacturing growth is linked. The information on the impact of firm-type
dominance on a region's manufacturing output may enable policy-makers to design workable (or revise existing) manufacturing diversification policies.
INTRODUCTION
The loss of jobs due to the relocation or liquidation of firms is the chief cause of a region's
economic instability. Based upon a briefing report prepared by the US General Accounting
Office, between 1979 and 1984, approximately 2.3 million US workers annually were dislocated.
This dislocation occurred primarily due to layoffs and plant closures in the manufacturing sector
[Stafford 1991:51]. Since manufacturing firms' location decisions have been a major
contributing factor accounting for regional economic instability, the seemingly logical solution is
for a region to develop a diversification policy (using portfolio theory) to attract manufacturing
firms into the region in such a manner as to create a diversified regional manufacturing structure.
According to Grose [1993:23], in the early 1980s, total states' incentives in the form of direct
outlays and taxes foregone to attract business amounted to $20 billion a year. Indubitably, a
diversification policy, that would attract a mix of manufacturing firms to ensure long term
regional economic stability or at least to minimize severe long term instability, is highly desirable.
As suggested by Conroy [1975], portfolio theory is a means to diversify away economic
instability as reflected in a region's rate of unemployment. Empirical findings on the New
England region of the US indicate some success with a diversification policy [Rosengren 1990].
Using portfolio variance analysis, Rosengren [1990] was able to establish that New England had
been able to attract a good mix of industries in its employment portfolio. During 1984-1988,
unemployment in New England was 3.9% on average as compared to the national average of
6.7%. However, cuts in defense spending and competition from outside the region had eroded
some of that success [Rosengren 1990]. Data accumulated by Grose [1993:27] revealed that six
of the New England states are ranked among the bottom ten states in: (a) 1991 for "New and
Expanded Corporate Facilities by State" (per million population), and (b) "State Economic
Momentum" given "State Business Incentives" at March 1992.
This study suggests that, with the aid of a firm-type dominance/industry region analysis,
state and federal levels of government can formulate productive regional economic policies.
RESEARCH OBJECTIVE
In an empirical study [Salvary 1977], it was established that while manufacturing growth of
a region is significantly related to the growth of the region’s dominant industry, leakage of
manufacturing growth/output from the region is attributed to the inability of the region’s
supportive industries to respond to the growth of the dominant industry. This study postulates
that firm-type dominance of regional manufacturing provides an explanation for regional leakage
of manufacturing output.
With the foregoing in mind, this research presents and tests a working hypothesis - the
firm-type dominance of regional manufacturing growth. The findings on firm-type dominance
can enable an assessment of the feasibility of particular strategies to combat regional instability.
In particular, this research attempts to enable an assessment of a region's ability to utilize the
intuitively appealing strategy of portfolio theory [Conroy 1975] in selecting and attracting
manufacturing firms.
Whether the firms desired to be attracted into the region are labour intensive or capital
intensive, an approach to enhance or stabilize a regional manufacturing output is needed. As
suggested by Ersenkal and Dillman [1984:38], if policymakers were to recognize that an
abundance of a particular industry is not desirable, an attempt should be made to alter some
aspects of the regional characteristics that could stimulate growth in [or attract] industries
dependent upon factors which have not been sufficiently developed.
The basic question is: Can diversification policy be effectively implemented by a region?
Data presented by Grose [1993:27] suggest an ambiguous response. Some states (e.g., North
Carolina, Nevada, and Wyoming) with fewer incentives to attract business firms have done better
than many states with far more incentives. It is important to note that tax wars among states
competing for the same industries [Committee of New England of the National Planning
Association 1954:651] can impede the implementation of such a policy. While it is likely for
regions to effectively utilize diversification policy, it would be somewhat difficult in the absence
of coordinated planning by state and federal policymakers.
Unmistakably, regional economic development is dependent upon a region’s ability to devise
means to influence location decisions of individual firms and the flow of financial capital into
the region [Salvary 2004]. This study maintains that the impact of these factors on any region is
determined to a great extent by the firm-type dominance of a region as opposed to the industrial
structure/mix of a region. Hence, the feasibility of a diversification policy hinges on the
adherence of policymakers to policies consistent with the specific region’s firm-type dominance.
MINIMALLY NECESSARY CONDITIONS FOR DIVERSIFICATION
Based upon their empirical study, Bremmer and Kesselring [1993:14] concluded that
education and public goods provided by state governments do have a positive impact on
investment and economic development. The availability of these public goods attracts new firms
to a given location and facilitates continued operations of existing firms, but attempts to entice
new firms with items such as industrial revenue bonds and equipment tax credits are ineffective.
This study postulates that to achieve an effective diversification policy, three conditions
must be satisfied: (1) incentives must be specifically designed to induce the desired mix of
manufacturing firms; (2) an infrastructure, which is conducive to the operations of the desired
mix of firms, must be built and maintained; and (3) the industrial climate must be nurtured by the
availability of financial capital and an adequately trained labour force. The ability to satisfy these
three conditions would enhance the ability of the region to attract and retain manufacturing firms.
Apparently, the findings of Coughlin and Segev (2000:346), which included labour force quality
and transportation infrastructure, in part do support the three conditions outlined above.
Unequivocally, tax wars among states competing for the same industries have to be
avoided. Therefore, cooperation and coordination of effort among the federal and state levels of
governments are essential to the regional success of a diversification policy. At this stage, the
concepts of the state regions and the industry regions are introduced.
STATE REGIONS AND INDUSTRY REGIONS
Some studies [Carlton 1983; McHone 1984] use the Standard Metropolitan Statistical Area
(SMSA) as the region, while other studies [Helms 1985; Steinnes 1984] use the state as the
region. In this study, two types of regions are used: state-regions and industry-regions. A state-
region is a region in physical space linked by a common administrative unit which influences
economic development. An industry-region is a region in economic space linked by a common
dominant industry which influences regional manufacturing growth [Salvary 1977].
Gertler [1984:74] posed two questions: (A) "How volatile is investment in a given industry
in a given place over time?” (B) "How consistent is this volatility from region to region?" With
regards to (A), the state-region permits an analysis of the volatility of financial capital flows. In
connection with (B), the industry-region (a different dimension to regional analysis) enables an
assessment of the consistency in the volatility of regional financial capital flows.
As indicated above, this study uses the state as the basic region.1 The state is chosen as the
basic region in this study for three reasons:
1. Unemployment insurance is administered at the state level. 2. The level and type of tax and other incentives necessary to undertake a diversification
policy can only be undertaken at the state level. 3. Infrastructure building, such as highways, conducive to the healthy economic climate
is undertaken primarily at the state level.
Apart from the normal response to market forces--internal economies of scale and
agglomeration--that affect the location decision problem, some regions grow faster than others
due to greater capital inputs into the state regions. The disparity in regional growth may be due
to a greater rate of investment or greater capital input-output ratio for the faster growing regions.
It is hypothesized that a stagnant region may have funds that are exported to another growing
region, in many instances to a region that is much more developed--the backwash effect [Myrdal
1957]. This condition would obtain since the mix of the firms in a region (local vs national
firms) - the firm-type dominance hypothesis - influences the flow of capital in and from the
region. Accordingly, the next section addresses the issue of the availability of financial capital -
the capital availability problem.
THE AVAILABILITY OF FINANCIAL CAPITAL
Invariably, firms obtain their financing from the national pool of investment funds [Salvary
2004]. Yet, all firms do not get their efficient share of the investment pool (the capital
availability problem). Large firms through corporate dividend policy escape the capital market
rationing process; hence, more efficient smaller firms are denied financing for expansion purposes.
Corporate earnings retention as the primary source of finance for manufacturing capital expenditures
is an ongoing trend [Rumelt 1974; Sherman 1968; Brittain 1966; Donaldson 1961; Cottle and
Whitman 1959; Meyer and Kuh 1959; Drobovolsky 1951; Lintner 1949]. Use of internally
generated funds significantly affects the rationing of financial capital because this financing is only
minimally subject to the scrutiny of the capital market [Rumelt 1974:155; Donaldson 1961:51-52].
Kalecki [1954:92-95] and Hamberg [1956:34] have clearly emphasized the significance of
capital availability in the investment decision and the inaccessibility of the capital market to
small firms. In this regard, Fotheringham [1985] (1) implicitly recognized the need to determine
the characteristics of the firms making the location decisions, and (2) proposed that an explanation
of regional growth should entail a modeling of the decision processes of individual firms.
Therefore, foreign direct investment in US manufacturing is a factor that has to be considered.
According to Stafford [1991:51]: "Although there is now a substantial literature on plant
closings, knowledge and theory still lag behind understandings of manufacturing investments and
the location of new plants." Like the core-periphery dichotomy to regional growth (the spread
effect and backwash), the firm-type dominance/industry region approach attempts to explain
regional growth variation (the responsiveness effect). At this stage, the dominant industry
hypothesis is introduced and the firm-type dominance hypothesis of regional manufacturing
growth, which reflects an integrated approach, is formulated.2
THE DOMINANT INDUSTRY AND FIRM-TYPE DOMINANCE HYPOTHESES
This study utilizes the concept of the dominant industry as introduced in the literature as a
causal factor [Salvary 1977]. An industry which accounts for 10% or more of a region's
manufacturing value added is a dominant industry. If that industry has not only met the 10%
requirement but is the largest single industry in the region, it is the dominant industry. "The role
of the dominant industry in regional manufacturing growth is a passive one, in that it is subsumed
under the caption of comparative advantage or industrial structure" [Salvary 1977:2]. The
dominant industry analytical approach was advanced in response to the criticism levelled at shift-
share analysis: "There can be no question that the degree and structure of past industrial activity
in a region will, . . . have a major influence on the degree and structure of future industrial
activity, but the magnitude and statistical significance of this influence could be one of the
objects of research, not one of the assumptions of research" [Burrows, et. al. 1971:16].
The concept of "growth poles" [Perroux (1955)1970] focuses on growth manifesting itself
at points or poles of growth with variable intensity spreading through different channels with
terminal effects on the whole economy. Whereas, the dominant industry hypothesis [Salvary
[1977:4-5], maintains that the dominant industry in a region is the industry which best responds
to the forces at play; as a result, this industry becomes the moving force of the region. The
growth of the region is then conditioned by the responsiveness of the supporting industries and
consequentially the industrial structure of the region emerges as a consequence.
The dominant industry hypothesis rests upon the following assumptions:
(1) The division of the economy into productive sectors: agricultural, industry, and service.
(2) The industry sector is comprised of m industries, which are contained in the finite set F. F = |f/f1,fc, ... , fm|. These m industries are dispersed over k regions; however, f1 (and
every f) is dispersed over n regions, where n < k.
(3) The output demand of f1 (as well as f2, ... fm) is not evenly distributed among the k
regions. Also, there is a difference in the intensity of demand for final and intermediate consumption of the m industries.
(4) The transportation needs of the m industries differ, and the transportation networks
differ among the k regions.3
(5) The availability of financial capital differs among the m industries and among the k regions. The manner in which capital is made available reflects an industry capital preference with significant regional impact.
The basic assumptions insinuate that the concept of the dominant industry brings together
the demand and supply determinants of regional economic expansion. The dominant industry
emerges in a region when: (i) there is a sustained increase in regional demand for an industry's
output, (ii) the region's capital investment preference favours that industry, and (iii) the
transportation network which services the region is capable of handling the increase without a
significant increase in cost [Salvary 1987:77-78]. In any given time period, any of several
industries are potential candidates for becoming a dominant industry in a region. Which industry
actually becomes the or a dominant industry is dependent upon: (a) the regional capital
investment preference, (b) the degree of capital saturation, and (c) the industry's degree of
dependence on and the intensity of use of the transportation network [Salvary 1987:78].
Concomitant with the development of the dominant industry is the emergence of the
industry region: a region in economic space linked together by a common dominant industry
[Salvary 1977:19]. Industry regions (e.g., chemical, etc.) were introduced to provide a means for
observing the impact of the dominant industries within an idealized spatial context. The industry
region approach is a controlled observational approach [Salvary 1987:79].
The firm-type dominance hypothesis of regional manufacturing growth (RMG) as developed
in this paper, which should have significant explanatory power, is expounded as follows.
A region's manufacturing output and development is conditioned by:
1. the size (measured by sales) of firms operating in the region (Fs);
2. the multiplier effect (elasticity) of the region's dominant industry (DIm
), and
3. the location choice options facing the firms (Ft: firm-type--national vs. local firms).
Equation 1 is the mathematical formulation of the hypothesis:
RMG = f(Fs, DI
m, F
t). (1)
In this working hypothesis, firm-type dominance maintains that a region's manufacturing
output is dominated by either national/foreign or local firms. The firm-type dominance
hypothesis postulates that if a region's manufacturing output is dominated by local firms, its
strategic posture is entirely different from that of a region dominated by national/foreign (N/F)
firms. The financial capital and the location decision options available to the large N/F firms are
more favourable than those of the comparatively small local firms. In particular, the larger N/F
firms can ensure, by means of a significant earnings retention policy, a greater share of capital to
satisfy its financial needs [Rumelt 1974:155; Brittain 1966:155]. Thus, financial capital is
endogenous to the "N/F firm dominated" regional model; whereas, it is an exogenous variable to
the "local firm dominated" regional model. Simply understood, in many instances capital is
simply not available to the invariably smaller local firms [Hamberg 1971:32-34; U.S. Congress
1971:1465]. Also, the location decision options are many for the large firms already operating
through several branch plants;3 whereas, the options are quite few for the local firms.
FIRM-TYPE DOMINANCE AND REGIONAL MANUFACTURING GROWTH
As developed by Salvary [1977], an industry region construct (a region in economic space
consisting of sub-regions having the same dominant industry), which enables the observation of
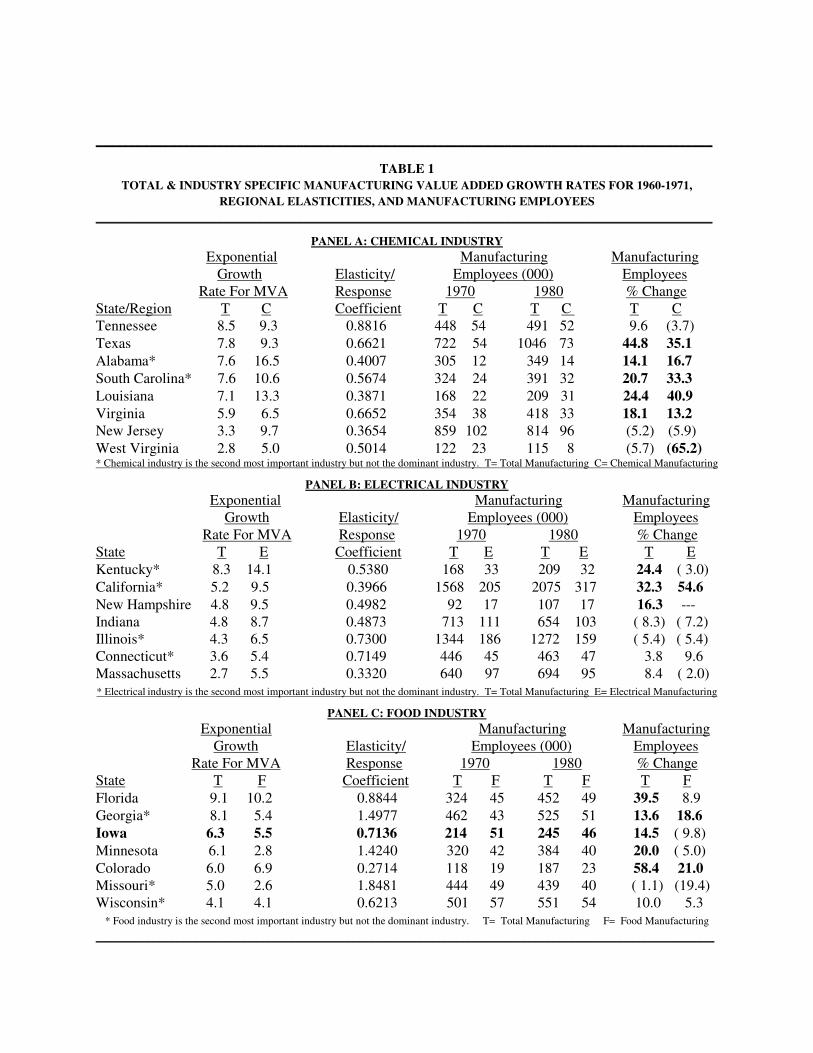
the varying response patterns to the dominant industry, is used in this study. The responsiveness
of a region's supportive industries to the growth of the region's dominant industry is measured by
means of the coefficient of elasticity. Low responsiveness of the supportive industries can be
attributed to either: (a) the unavailability of financial capital (local firm-type dominance) or (b)
the external (out of region) location decision of the supportive industries' expansion
Growth Elasticity/ Employees (000) Employees Rate For MVA Response 1970 1980 % Change State/Region T C Coefficient T C T C T C Tennessee 8.5 9.3 0.8816 448 54 491 52 9.6 (3.7)
Virginia 5.9 6.5 0.6652 354 38 418 33 18.1 13.2 New Jersey 3.3 9.7 0.3654 859 102 814 96 (5.2) (5.9)
West Virginia 2.8 5.0 0.5014 122 23 115 8 (5.7) (65.2) * Chemical industry is the second most important industry but not the dominant industry. T= Total Manufacturing C= Chemical Manufacturing
PANEL B: ELECTRICAL INDUSTRY
Exponential Manufacturing Manufacturing Growth Elasticity/ Employees (000) Employees Rate For MVA Response 1970 1980 % Change State T E Coefficient T E T E T E
LARGE AND SMALL FIRMS WITH PLANTS EMPLOYING 1,000 OR MORE EMPLOYEES ____________________________________________________________________________________________
1 9 6 0 1 9 7 0 1 9 8 0 State Plants Emps. % Plants Emps. % Plants Emps. % (000) of 3 (000) of 3 (000) of 3 ____________________________________________________________________________________________
Tennessee Large 19 63 39 104 50 111
Small 23 36 29 38 17 24
1. Total 42 99 32.1 68 142 31.5 67 135 27.5
2. Chemical Industry 39 12.7 54 12.0 52 10.5
3. All Manufacturing 308 100.0 448 100.0 491 100.0
Texas Large 27 137 55 157 78 156
Small 10 20 23 31 17 19
1. Total 37 157 32.2 78 188 26.0 95 175 16.8
2. Chemical Industry 40 8.2 54 7.5 73 7.0
3. All Manufacturing 486 100.0 722 100.0 1046 100.0
Virginia Large 20 59 34 117 42 88
Small 15 23 26 39 14 20
Total 35 82 30.0 60 156 44.1 56 108 25.9
2. Chemical Industry 30 11.1 38 10.7 33 7.8
3. All Manufacturing 273 100.0 354 100.0 418 100.0
Louisiana Large 14 35 18 42 19 42
Small 4 8 8 11 6 8
1. Total 18 43 37.9 26 53 31.3 25 50 23.9
2. Chemical Industry 16 13.9 22 13.3 31 15.0
3. All Manufacturing 113 100.0 168 100.0 209 100.0
New Jersey Large 65 196 82 223 83 191
Small 52 75 27 40 23 31
Total 117 271 33.2 109 263 30.7 106 222 27.3
2. Chemical Industry 81 9.9 102 11.9 96 11.7
3. All Manufacturing 816 100.0 859 100.0 813 100.0
West Virginia Large 14 43 24 42 17 36
Small 10 15 2 3 3 5
Total 24 58 48.9 26 45 36.4 20 41 35.6
2. Chemical Industry 22 19.0 23 18.7 8 6.9
3. All Manufacturing 117 100.0 122 100.0 115 100.0
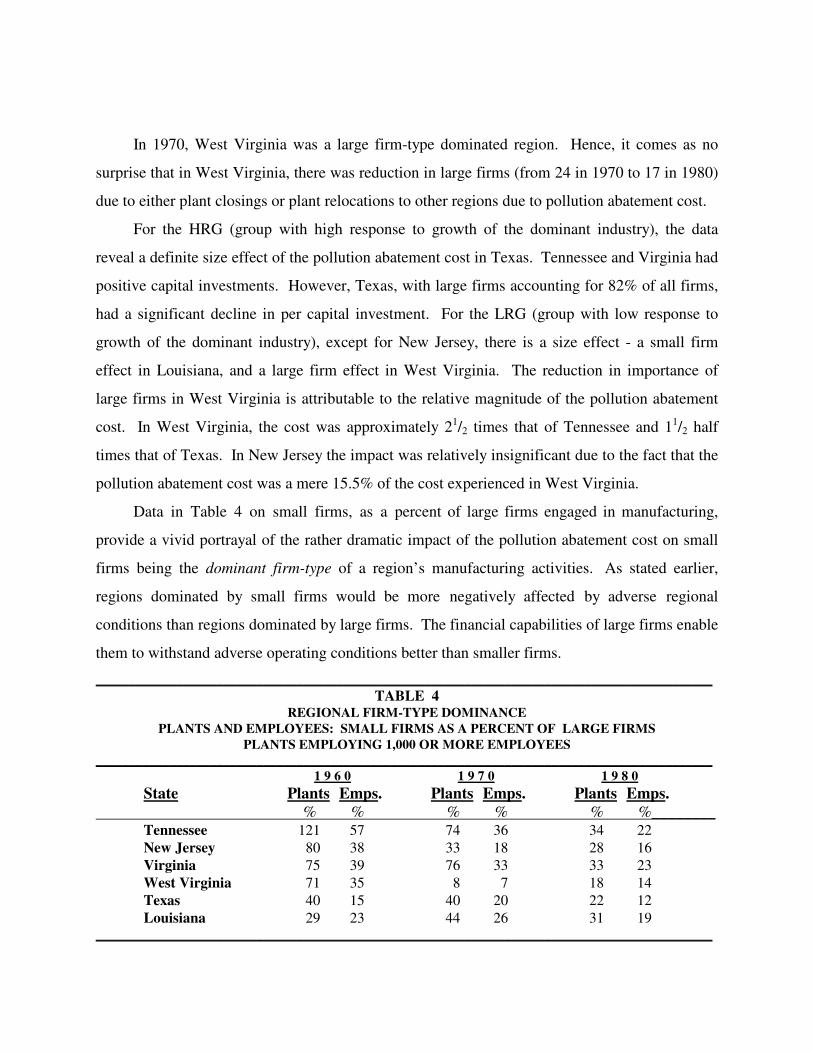
REGIONAL FIRM TYPE DOMINANCE LOCAL VERSUS NONLOCAL FIRMS MANUFACTURING PLANTS
(% of Plants Owned by Local Firms to Total Plants)
______________________________________________________________________________ Panel A: 1960 All Firms Local Firms Non-local Firms State Total Plants Total Large Small Total Large Small New Jersey 117 39 (33.3%) 8 31 78 57 21 Tennessee 42 11 (26.2%) 0 11 31 19 12 Texas 37 10 (27.0%) 5 5 27 22 5 Virginia 35 12 (34.3%) 3 9 23 17 6 West Virginia 24 3 (12.5%) 2 1 21 12 9 Louisiana 18 1 ( 5.5%) 0 1 17 14 3
______________________________________________________________________________ Panel B: 1970 All Firms Local Firms Non-local Firms State Total Plants Total Large Small Total Large Small New Jersey 109 34 (31.1%) 19 15 75 63 12 Texas 78 27 (34.6%) 12 15 51 43 8 Tennessee 68 16 (23.5%) 3 13 52 36 16 Virginia 60 16 (26.7%) 5 11 44 29 15 Louisiana 26 4 (15.4%) 1 3 22 18 4 West Virginia 26 0 ( 0.0%) 0 0 26 24 2
______________________________________________________________________________ Panel C: 1980 All Firms Local Firms Non-local Firms State Total Plants Total Large Small Total Large Small New Jersey 106 40 (37.8%) 31 9 66 52 14 Texas 95 35 (36.8%) 25 10 60 53 7 Tennessee 67 13 (20.0%) 5 8 54 45 9 Virginia 56 18 (32.1%) 10 8 38 32 6 Louisiana 25 5 (20.0%) 3 2 20 16 4
West Virginia 2.8 5.0 5.2 8.1 4.4 5.1 *Chemical industry is second most important industry but not the dominant industry. TM= Total Manufacturing CM= Chemical Manufacturing
VA = Value Added CE = Capital Expenditures CM = Chemical Manufacturing EM = Electrical Manufacturing FM = Food Manufacturing .
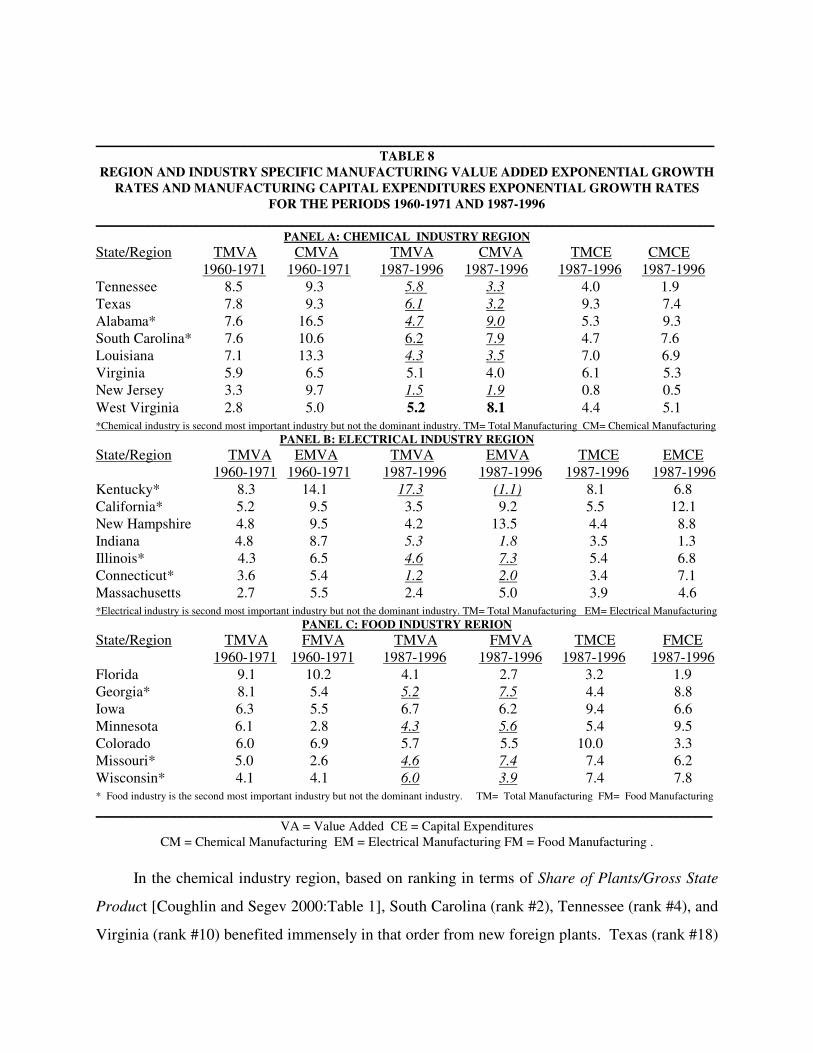
In the chemical industry region, based on ranking in terms of Share of Plants/Gross State
Product [Coughlin and Segev 2000:Table 1], South Carolina (rank #2), Tennessee (rank #4), and
Virginia (rank #10) benefited immensely in that order from new foreign plants. Texas (rank #18)
also benefited significantly but to a lesser extent than the three states mentioned above. This
finding is not surprising as Coughlin [1992:27] noted: the chemical industry is controlled by
foreign firms. In addition, other states belonging to other industry regions with very high
rankings were significant beneficiaries. In the electrical industry region, Kentucky, in which
chemical manufacturing is fourth in importance, was ranked #1, and Indiana, in which chemical
manufacturing is also fourth in importance, was ranked #7. In the food industry region, Iowa, in
which chemical manufacturing is fourth in importance, was ranked #8, and Georgia, in which
chemical manufacturing is third in importance, was ranked #9.
Apart from a decline in manufacturing employment in the national economy, the data
underlined and in script in Table 8 are suggestive of the significant structural shift during the
1980s in manufacturing across states and the composition of manufacturing within states. This
combination of occurrence can be attributed to both international trade as noted by Bauer and
Eberts [1990] and direct foreign investment in US manufacturing as documented by Coughlin
and Segev [2000] and Coughlin [1992]
SUMMARY
This paper suggests that regions can be classified by firm-type (national/foreign or local)
dominance of manufacturing output. This distinction is important for policy analysis, since two
critical variables (capital availability and location decision) can be identified with regional output
modeling. The impact on a particular region of these two variables depends upon the firm-type
dominance of that region's manufacturing output. This paper draws upon the dominant industry
model which has established that: (1) in any given region, there is a dominant industry (the
industry which is the driving force of the region), and (2) the manufacturing growth of a region is
linked to the growth of the region’s dominant industry.
An industry region construct (a region in economic space consisting of state regions
having the same dominant industry) is used to enable the observation of the varying response
patterns to the dominant industry. Leakage of manufacturing output from a state region, due to
the inability of a region's supportive industries to respond to the growth of the dominant industry,
can be explained by the firm-type dominance hypothesis. Elasticity coefficients of the state
regions within an industry region are utilized to measure a region's responsiveness to the
dominant industry. The elasticity coefficients (responsiveness) of the individual state regions’
manufacturing output to growth of the region's dominant industry can be used by regional
policymakers to assess the feasibility of manufacturing diversification policies a la portfolio
theory. Low responsiveness of supportive industries producing regional shifts in manufacturing
is identifiable with: (a) the unavailability of capital due to local firm-type dominance or (b) the
out of region location decision of the supportive industries' expansion due to national/foreign
firm-type dominance.
LIMITATIONS AND CONCLUSION
Given the limited amount of data employed in testing the hypothesis, the results only
provide some preliminary findings, which are subject to further verification. This study did not
attempt to assess the impact of foreign imports in the displacement of domestic output, thereby
decreasing domestic production. The impact of this variable has to be given full consideration in
policy analysis and development. Future research should focus on: (a) calibrating the model with
spatial data by expanding the number of industry regions, (b) changing the definition of large
firm size from the $100 million to $1 billion in sales, (c) assessing the regional displacement
impact of foreign imports, and (c) subjecting the hypothesis to rigorous statistical testing.
The preliminary findings suggest that, assuming portfolio theory is feasible, firm-type
dominance should be considered when implementing a diversification policy. Since there are far
more important determinants of industrial location than tax-breaks, a region should not expect
that a tax-break will induce firms to locate future manufacturing expansion in that region. Owing
to their friendly manufacturing environments - infrastructure, research facilities, trained labour
force, educational facilities, and other public goods - many state-regions have benefited from
foreign direct investment. If an appropriate operating environment is established in a region, N/F
firms will invite themselves into the region. Apparently analysis utilizing the Firm-Type
Dominance/Industry Region Model could provide a sound basis for understanding regional
manufacturing problems and aid in the formulation of relevant fiscal policies at the regional and
federal levels of government.
ENDNOTES 1 In one study of the influences on patterns of industrial location, McHone [1984] recognized the
limitation of the SMSA and the significance of the state as the region in this setting. Accordingly, McHone [1984] limited his observations to SMSAs that straddled more than one state to determine the impact of incentives on locational decisions. hUallachain [1989:1205] empirical study focused on economies of scale and as such justifies the use of the metropolitan statistical area as "the appropriate geographical scale for testing models of growth ... ."
2 Both Richardson [1978] and Gerking and Isserman [1981:465] are advocates of the integrated approach.
3 Overlapping concentric zones, which are comprised of a few contiguous regions and influence transportation-dependent industry location, are created by the transportation networks.
4 According to Moriarty [1991:1576], in 1982 76% of the US manufacturing workforce was employed by multi-plant firms; whereas in 1947 the portion employed by multi-plant firms was 56%.
BIBLIOGRAPHY
Bauer, Paul W. and Eberts, Randall W. (1990) “Exports and Regional Economic Restructuring.”
Journal of Regional Analysis and Policy (20.No1).
Brittain, John A. (1966) Corporate Dividend Policy. Washington, D.C.: Brookings Institution.
Bremmer, Dale S. and Kesselring, Randall G. (1993) “The Determinants of Regional Manufacturing Investment: A Simultaneous Equations Approach.” Journal of Regional and
Policy Analysis 23 No.2.
Burrows, James C.; Metcalf, Charles E.; and Kaler, John B. (1971) Industrial Location in the
United States. Lexington, Massachusetts: D. C. Heath and Company.
Business Week. (1976) “The Second War Between the States.” Business Week (May 17).
Carlton, Dennis W. (1983) "The Location and Employment Choices of New Firms: An Econometric Model with Discrete and Continuous Endogenous Variables." Review of
Economics and Statistics (August).
Committee of New England of the National Planning Association. (1954) The Economic State of
New England. New Haven: Yale University Press.
Conroy, Michael E. (1975) Regional Economic Growth: Diversification and Control. New York; Washington; London: Praeger Publisher.
Cottle, Sidney and Whitman, Tate. (1959) Corporate Earning Power and Market Valuation
1935-1955. Durham, North Carolina: Duke University Press.
Coughlin, Cletus C. (1992) “Foreign-owned companies in the United States: malign or benign?”
Federal Reserve Bank of St. Louis Review (May 1).
Coughlin, Cletus and Segev, Eran. (2000) “Location Determinants of New Foreign-Owned Manufacturing Plants” Journal of Regional Science (V.40 No.2).
Donaldson, Gordon. (1961) Corporate Debt Capacity. Boston: Harvard University Press.
Drobovolsky, Sergei P. (1951) Corporate Income Retention 1915-1943. New York: National Bureau of Economic Research, Inc.
Dun & Bradstreet. (1987) Million Dollar Directory. Parsippany, New Jersey: Dun & Bradstreet.
______________. (1980) Million Dollar Directory. Parsippany, New Jersey: Dun & Bradstreet.
______________. (1971) Million Dollar Directory. Parsippany, New Jersey: Dun & Bradstreet.
______________. (1964) Million Dollar Directory. Parsippany, New Jersey: Dun & Bradstreet.
Engerman, S. "Regional Aspects of Stabilization Policy." (1965) Essays in Fiscal Federalism. Edited by R.A. Musgrave. The Brookings Institution as cited in Regional Analysis. Edited by L. Needleman. Middlesex, England: Penguin Books, Ltd., 1968.
Ersenkal, Caryl R. and Dillman, B. L. (1984) “The Product Cycle and Shifts in the Location of Manufacturing.” Journal of Regional and Policy Analysis (14 No.1):30-39.
Feiock, Richard and Rowland, C. K. (1990) "Environmental Regulation and Economic Developmen: The Movement of Chemical Production among States." Western Political
Quarterly (September): 561-576.
Fotheringham, A. Stewart. (1985) "Modeling Firms: Locational Choices and Core-Periphery Growth." Growth and Change 16: 13-16.
Gerking, Shelby D. and Isserman, Andrew M. (1981) "Bifurcation and the Time Pattern of Impacts in the Economic Base Model." Journal of Regional Science 21:451-467.
Grose, Andrew P. (1993) "The Pros and Cons of Investment Incentives: How Do You Know You Get What You Pay For?" Spectrum (Summer): 21-28.
Hamberg, Daniel. (1971) Models of Economic Growth. New York; London: Harper & Row.
________. (1956) Economic Growth and Instability. New York: W.W. Norton & Company Inc.
Helms, L. Jay. (1985) "The Effect of State and Local Taxes on Economic Growth: A Time Series-Cross Section Approach." Review of Economics and Statistics (November).
hUallachain, B. O. (1990) "The Location of US Manufacturing: Some Empirical Evidence on Recent Geographical Shifts." Environment and Planning A. 22:1205-1222.
Kalecki, M. (1954) Theory of Economic Dynamics. London: George Allen & Unwin.
Lintner, John. (1949) Corporate Profits in Perspective. Washington, D.C.: American Enterprise Association, Inc.
Marketing Economics Institute. (1960) Key Plants Manufacturing Marketing Directory: 40,000
Plants with 100 or more Employees. New York: Marketing Economics Institute.
_________. (1969/1970) Key Plants Manufacturing Marketing Directory. New York: Marketing Economics Institute.
______________. (1979/1980) Key Plants Manufacturing Marketing Directory. New York: Marketing Economics Institute.
McHone, W. Warren. (1984) "State Industrial Development Incentives and Employment Growth in Multistate SMSAs." Growth and Change 15:8-15.
Meyer, John R. and Kuh, Edwin. (1959) The Investment Decision - An Empirical Study. Cambridge, Massachusetts: Harvard University Press.
Moriarty, B. M. (1991) "Urban Systems, Industrial Restructuring, and the Spatial-Temporal Diffusion of Manufacturing Employment." Environment and Planning A 23:1571-1588.
Perroux, Francois. "Note on the Concept of 'Growth Poles' ". (1955) (Translated from French: "Note sure la Notion de'pole de croissance." Economie Appliquee as cited in Regional
Economics: Theory and Practice. Edited by David L. McKee, Robert D. Dean and William Leahy. New York: The Free Press. London: Collier Macmillan Limited, 1970.
Richardson, Harry W. (1978) "The State of Regional Economics: A Survey Article." International Regional Science Review (Fall).
Rosengren, Eric S. (1990) "How Diversified is New England?" New England Economic Review (Nov./Dec.).
Rumelt, Richard P. (1974) Strategy, Structure and Economic Performance. Cambridge, Massachusetts: Harvard University Press.
Salvary, Stanley C. W. (2004) “The Neoclassical Model, Corporate Retained Earnings, and the Regional Flows of Financial Capital.” EconPapers. RePEc:wpa:wuwpur:0410007.
______________. (1987 "An Empirical Test of the Dominant Industry Hypothesis: Some Preliminary Evidence." Regional Science Perspectives (17:1).
______________. (1977) Regional Manufacturing Economic Growth: An Empirical Analysis of
the Impact of the Dominant Industry Hypothesis. Doctoral Dissertation. New York University.
Sherman, Howard J. (1968) Profits in the United States. New York: Cornell University Press.
Stafford, Howard A. (1991) "Manufacturing Plant Closure Selections within Firms." Annals of
the Association of the American Geographers (81-1: 51-65).
Steinnes, Donald N. (1984) "Business Climate, Tax Incentives, and Regional Economic Development." Growth and Change (15:38-57).
U.S. Congress, House, Committee on Interstate and Foreign Commerce. Institutional Investor
Study, Report of the Securities and Exchange Commission. Vol. 4. H. Doc. 92-64, Part 4, 92nd Congress, 1st sess., 1971.