Page 1
7/30/2019 The Impacts of Tariff Rate Import Quotas on Market Access 2
http://slidepdf.com/reader/full/the-impacts-of-tariff-rate-import-quotas-on-market-access-2 1/31
THE IMPACTS OF TARIFF-RATE IMPORT QUOTAS ON MARKET ACCESS
Xianghong Li and Colin A. Carter
Department of Agricultural Economics, Kansas State University, KS, USA
University of California, Davis, CA, USA
March 2009
ABSTRACT
The utilization of tariff-rate quotas (TRQs) for enhancing market access is a key component of
global agricultural trade negotiations. We identify factors affecting the performance of TRQs in
terms of improving market access. The analysis covers individual TRQs notified by 28 WTO
member countries from 1995 through 2000. Our results show that reducing in-quota tariffs will
significantly improve market access while the market access effect of any reduction in over-
quota tariffs is marginal. We also find that the empirical ranking of the efficiency of alternative
TRQ administration methods differs from the theoretical ranking.
JEL no. F13, Q17, Q18.
Key words: agricultural trade, market access, tariff-rate quotas, quota administration.
Please address correspondence to Colin A. Carter, Department of Agricultural And ResourceEconomics, University of California, Davis, One Shields Avenue, Davis, CA 95616, USA. E-
mail: [email protected] . Phone:+1 530 752 6054. Fax: +1 530 752 5614.
Page 2
7/30/2019 The Impacts of Tariff Rate Import Quotas on Market Access 2
http://slidepdf.com/reader/full/the-impacts-of-tariff-rate-import-quotas-on-market-access-2 2/31
1
THE IMPACTS OF TARIFF-RATE IMPORT QUOTAS ON MARKET ACCESS
Agriculture remains a holdout when it comes to global trade liberalization. The 1994 Uruguay
Round Agreement on Agriculture (URAA) set new rules for trade in agricultural products but
this agreement was a modest reduction in import protection (Anania et al 2004). A key
systematic change regarding market access was the replacement of quantitative trade restrictions
and other non-tariff barriers with tariffs known as tariffication. To ensure current and minimum
market access in the process of tariffication, a system of tariff rate quotas (TRQs) was instituted.
TRQs are two-tiered tariffs in which a limited volume of imports (i.e., the quota) is imported at a
lower tariff rate and all additional “above quota” imports are subject to a higher tariff. As a result
of the URAA, TRQs were broadly adopted in agricultural trade. For many importers, non-tariff
trade barriers were converted to TRQs as a way to manage trade and at the same time comply
with the URAA. These instruments now affect international trade in most agricultural
commodities, ranging from imports of wheat into the EU, pork into Japan, cotton into China,
milk powder into India, and sugar into the United States, for example. As of May 2005, there
were 1,434 different agricultural TRQs notified to the World Trade Organization (WTO), with a
total of 45 countries employing TRQs (WTO 2005).
TRQs were a compromise between exporters and importers. The introduction of TRQs
ensures one thing—that agricultural trade policies continue to be very complex. In principle,
TRQs can improve market access for exporters compared to simple quantitative restrictions
because under TRQs the import quantity is not limited and over-quota imports are permitted at
the higher tariff. However, TRQs can still be used as a significant barrier to trade and they have a
number of undesirable features. For instance, TRQs generate quota rents, legitimize a role for
state trading agencies, and allow importers to blatantly discriminate among exporting countries.
Page 3
7/30/2019 The Impacts of Tariff Rate Import Quotas on Market Access 2
http://slidepdf.com/reader/full/the-impacts-of-tariff-rate-import-quotas-on-market-access-2 3/31
2
Hence, from a theoretical point of view, it is questionable whether the implementation of TRQs
improves market access and global welfare.
So far, experience with agricultural TRQs suggests that the TRQ regime has failed as a
market access instrument (Abbott 2002) because agricultural TRQs are underutilized by a
significant margin (Podbury and Roberts 1999; WTO 2000 and 2001). For the implementation
period 1995-2002, the fill rates of more than one-quarter of all agricultural TRQs were below
20% (WTO 2005). The average yearly unweighted TRQ fill rate was less than 70%. In addition,
TRQ fill rates, on average, dropped from 66% in 1995 to 58% in 2002 (WTO 2005). The
relatively low average fill rates suggest that the agricultural TRQ regime has not led to a
significant improvement in market access.
The most effective way to further reform agricultural TRQs may be to change those
factors that reduce TRQ fill rates the most. Several studies have identified factors that impede
market access under specific TRQs and have singled out ideas for further TRQ reform. The
recommendations for the best way to liberalize agricultural TRQs vary across the different
studies. Abbott and Paarlberg (1998) argued that a reduction of the above-quota tariff on pork
would lead to more pork imports into the Philippines. Alternatively, it has been argued that
increasing quota volumes would result in greater welfare gains than would tariff reductions in the
EU (Bureau and Tangermann 2000). The combination of quota expansion and in-quota and over-
quota tariff reductions would achieve maximum liberalization results for the OECD countries
(OECD 2002). On the other hand, one study (IATRC 2001) advocated that further WTO
negotiations should focus on developing better rules for the administration of quota licenses.
The maximum gain from reforming TRQs would presumably be realized through
liberalizing those factors that influence the performance of TRQs the most. Trade theory offers
Page 4
7/30/2019 The Impacts of Tariff Rate Import Quotas on Market Access 2
http://slidepdf.com/reader/full/the-impacts-of-tariff-rate-import-quotas-on-market-access-2 4/31
3
several possible explanations for the poor performance of TRQs. Theoretical analysis can
provide a possible ranking of such factors, but cannot identify which factors are empirically the
most important. However, there is a lack of empirical evidence on the impacts of TRQ
implementation practices on market access. There are some case studies in the literature that are
country and commodity specific, but this previous work has failed to uncover general factors
governing implementation of TRQs. The commonly used descriptive approach in the literature
can provide general conclusions regarding the overall performance of agricultural TRQs, but
may exaggerate the effect of a single factor because it ignores complex interrelationships.
Only Monnich (2003) has attempted to empirically untangle explanations of TRQ fill
rates. However, her study only covered agricultural TRQs in the EU, which account for less than
7% of total global agricultural TRQs. Moreover, her model specification failed to capture the
double-censored nature of TRQ fill rates.
To expand the literature, we conduct a comprehensive study of agricultural TRQs. We
identify factors that impede market access under TRQs and draw out implications for reforming
current agricultural TRQs. Our analyses are conducted at the individual TRQ level in order to
avoid aggregation problems. Each TRQ notified to the WTO during the 1995-2000 time period
is included in this study. An empirical model is carefully specified to best capture trading
behavior under the TRQ regime and a two-limit random-effects Tobit model is used to deal with
the double censored nature of TRQ fill rates.
In policy circles, there is a difference of opinion whether or not institutional regulation is
a major factor hindering trade reform, without explicit measurement of its effects. For instance,
Brazil complained to the WTO that the EU import licensing procedures for poultry products
nullified or impaired any benefits from the TRQ regime. The U.S. has pressured China to reform
Page 5
7/30/2019 The Impacts of Tariff Rate Import Quotas on Market Access 2
http://slidepdf.com/reader/full/the-impacts-of-tariff-rate-import-quotas-on-market-access-2 5/31
4
its TRQs. Many economists have expressed concern that the benefits of TRQ access have been
reduced by administration methods (Abbott 2002; IATRC 2001; Skully 2001). In contrast, the
WTO (2001) and OECD (2002) have stated that quota administration methods have had only a
limited influence on fill rates. A major contribution of this paper is that we explicitly examine
whether administration methods affect market access of agricultural TRQs, and to what degree
these methods matter. We find that administration methods do matter in terms of granting market
access to exporters.
The Economics of TRQs
A TRQ scheme contains a low in-quota tariff (T1), a quota (Q0) that defines the maximum
volume of imports that are subject to the low in-quota tariff, and a relatively high over-quota
tariff (T2). Figure 1 shows the basic analytics of a TRQ mechanism. Here, we assume that the
importing country is small.1 For imports within quota, importers face the price Pw+T1. For
imports over quota, the import cost is Pw+T2. Hence, the excess supply curve is a step function
consisting of three sections: a horizontal section (Pw+T1)A for the in-quota tariff, a vertical
section AB for the quota, and another horizontal section BC for the over-quota tariff. Imports
under TRQs are determined where the excess demand curve in the home country intersects the
world excess supply curve.
A main quantifiable indicator of market penetration under a TRQ regime is the TRQ fill
rate. It is often constructed to assess the performance of TRQs relative to market access goals.
The TRQ fill rate is a simple descriptive statistic defined as the actual import volume through
TRQs relative to the scheduled quota volume (i.e., Q0 in Figure 1) and can range from 0 to +.
1The small country assumption is reasonable in the context of agricultural TRQs. For instance, the total TRQ quota
volume of a typical agricultural product in 1995 accounted only for 3% to 7% of the total world trade in that product
(FAO 2000). The quota volume of each individual TRQ for an individual country is even smaller. For instance, the
U.S. sugar TRQs accounts for less than 5% of world imports.
Page 6
7/30/2019 The Impacts of Tariff Rate Import Quotas on Market Access 2
http://slidepdf.com/reader/full/the-impacts-of-tariff-rate-import-quotas-on-market-access-2 6/31
5
Figure 1. Imports under TRQs
Four categories of TRQ fill rates can be identified: underfilled, just filled, overfilled, and
zero fill, respectively. If the excess demand curve lies between ED0 and ED4 in Figure 1(e.g.
ED1), the 1st
tier tariff is the binding instrument. The TRQ is said to be underfilled with a fill rate
(M1/Q0) between 0 and 1 and a portion of the quota is not utilized. If the quota regime is the
effective instrument (i.e., the excess demand curve falls within the range of ED4 to ED5 in Figure
1), then the quota fill rate will equal 1 as the quota is just filled. In the case of a strong import
demand, the 2nd tier tariff becomes effective. The fill rate (M3/Q0) is then greater than 1, and the
TRQ is said to be overfilled. It is also possible that the TRQ is not filled at all. If the excess
demand curve lies to the left of ED0 (including ED0), the fill rate equals zero and there are no
imports at the current in-quota tariff level.
Various administration methods have been adopted to implement TRQs, and TRQ
administration fundamentally is a rationing problem (Skully 2001). It determines the volume and
distribution of trade as well as the distribution of quota rents. Alternative administration methods
Pw
Pd
P
Q
ED2
ES
M0 M2=Q0 0
Pw+T1
Pw+T2
ED1
M1
A
B
M3
ED3
ED4
ED5
C
ED0
Page 7
7/30/2019 The Impacts of Tariff Rate Import Quotas on Market Access 2
http://slidepdf.com/reader/full/the-impacts-of-tariff-rate-import-quotas-on-market-access-2 7/31
6
typically result in different hidden costs and fill rates. The introduction of TRQs in the EU
banana market, for instance, induced a high degree of rent seeking (Herrmann et. al. 2001).
Moreover, it is possible for the government to assign a large number of small quotas so that any
one quota is commercially infeasible to import. Furthermore, administration methods may
allocate TRQs to high-cost third country producers and thereby cause inefficiency (Herrmann et.
a.l 2001; Boughner et. al. 2000) .
The impact of administration methods can be depicted in Figure 1 as a leftward shift of
ED by the amount of the transactions costs. The weakening of import demand reduces the import
quantity. The magnitude of the shift in the excess demand curve determines how the fill rate is
affected. If the transactions costs are relatively high, they could even change the binding
instrument. For instance, if ED2 in Figure 1 shifts to ED1 due to administration costs, the quota is
no longer effective, and the 1st-tier tariff will instead become binding. As a result, the TRQ
moves from being just filled to being underfilled.
Ten principal TRQ administration methods have been identified by the WTO and are
defined in the Appendix below. Each method has its own advantages and disadvantages, incurs
transactions costs of different magnitudes, and affects imports differently. The “applied tariffs”
method is the most commonly employed and accounts for almost 50% of the total TRQs. The
“licenses on demand” method serves as the second most popular approach, accounting for about
one-quarter of the total TRQs. “Producer groups” and “other” methods are seldom used The
“non-specified” method was used only once and was dropped from our regression analysis.
Four “additional conditions” and certain combinations of these conditions are used to
help administer TRQs, in addition to the ten principal administration methods. These “additional
requirements” are applied to more than 22% of the TRQs each year. Among these four methods,
Page 8
7/30/2019 The Impacts of Tariff Rate Import Quotas on Market Access 2
http://slidepdf.com/reader/full/the-impacts-of-tariff-rate-import-quotas-on-market-access-2 8/31
7
“limits on tariff quota shares per allocation (LA)” is the most intensively used, and is applied to
more than 45% of the TRQs that have additional conditions. In addition, the “domestic purchase
requirement” and “past trading performance requirement” together account for more than 40% of
those TRQs with additional conditions.
The Model
We define the TRQ fill rate of a commodity i in year t , *
it y , as
0
*
*
Q
Y y it
it = . (1)
where
*
it Y
is imports of commodity i in year t , and 0Q is the scheduled or notified quota quantity
for this commodity in year t .
The TRQ scheduled (notified) quota for a specific commodity is set in multilateral
negotiations and predetermined before implementation of the TRQ. In practice, importers have
rarely changed the notified quota quantity during our study period. Hence, the only random
component in a TRQ fill rate is actual imports. Consequently, we start the model construction by
modeling a country’s importing behavior. If the domestic price deviates from the world price,
arbitrage opportunities should exist and result in imports. Hence, import demand, Y , is modeled
as a function of the domestic price, Pd , the world price, Pw, and a vector of other exogenous
demand shifters, XD,2
d wY = f(P , P , XD) . (2)
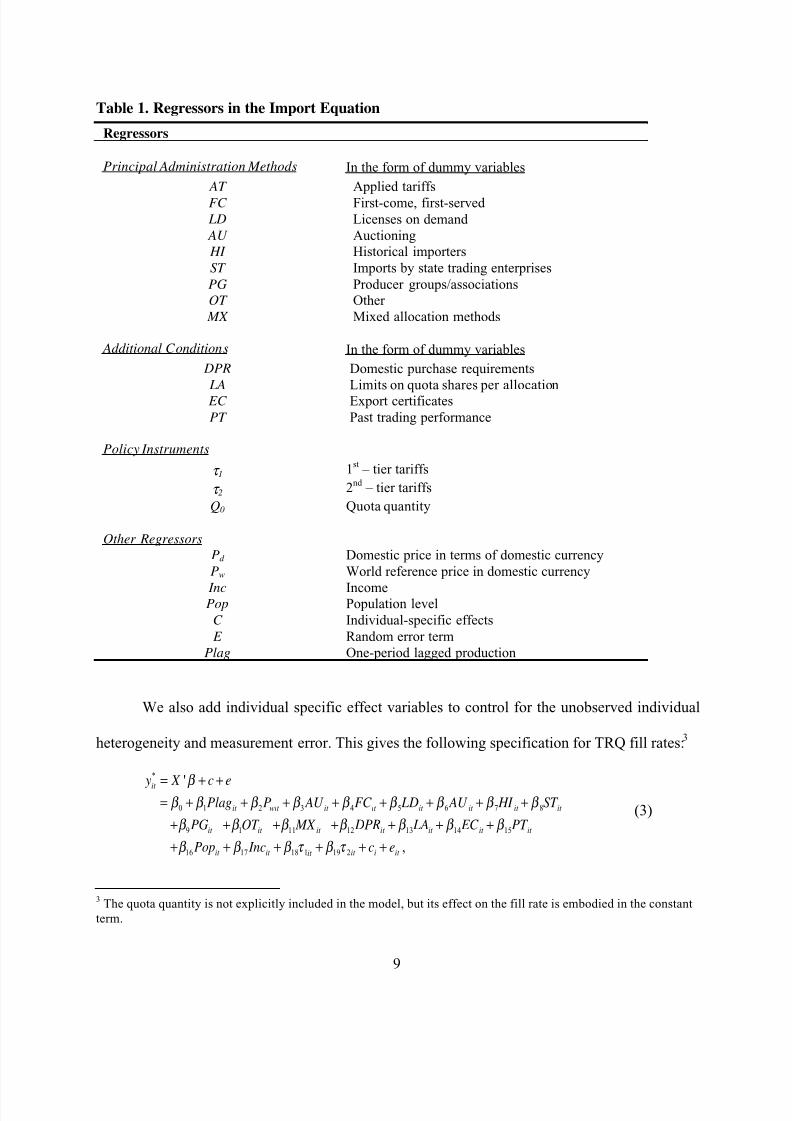
Four sets of variables are included in the exogenous demand shifters, XD, and these
variables are defined in Table 1. The first two sets of demand shifters include both principal
administration methods and “additional” conditions as per the above discussion. Three policy
2 Both the world price and the domestic price are included in the model because the included policy instruments can
not fully account for the imperfect transmission between these two prices.
Page 9
7/30/2019 The Impacts of Tariff Rate Import Quotas on Market Access 2
http://slidepdf.com/reader/full/the-impacts-of-tariff-rate-import-quotas-on-market-access-2 9/31
8
instruments—the 1st-tier tariff (
1 ), the 2
nd -tier tariff (
2 ), and quota volume ( 0Q )—are included
in the model as the third set of demand shifters. The last set of variables includes each country’s
income (Inc) and population (Pop).
Because prices and import quantities are simultaneously determined, it is quite possible
that some factors embodied in the random error term, eit , are also correlated with those
explanatory variables representing prices. Assuming that the international market is perfectly
competitive and that every importing country is simply a price taker in the world market, the
world price can be treated as an exogenous variable. However, the domestic price is likely
serially correlated with the random error term. To deal with this endogenous variable problem, a
one-period lagged production variable is used to proxy the domestic price. Thus, net imports are
estimated as a function of world price, lagged domestic supply, trade policies, and administration
method.
The effects of principal administration methods and additional conditions are represented
by two groups of dummy variables in our specification. To avoid perfect multicollinearity, the
“applied tariffs method” dummy is dropped. This administration method does not impose
quantitative restrictions on imports and requires the least administrative effort. Therefore, this
method is considered the most efficient way to administer TRQs. Choosing this dummy as the
benchmark facilitates the interpretation of the results. The alternative “additional” administration
methods variables do not cause a multicollinearity problem because more than one-half of the
global agricultural TRQs are not subject to these additional requirements.
Page 10
7/30/2019 The Impacts of Tariff Rate Import Quotas on Market Access 2
http://slidepdf.com/reader/full/the-impacts-of-tariff-rate-import-quotas-on-market-access-2 10/31
9
Table 1. Regressors in the Import Equation
Regressors
Principal Administration Methods In the form of dummy variables
AT Applied tariffs
FC First-come, first-served
LD Licenses on demand
AU Auctioning HI Historical importers
ST Imports by state trading enterprises
PG Producer groups/associationsOT Other
MX Mixed allocation methods
Additional Conditions In the form of dummy variables
DPR Domestic purchase requirements
LA Limits on quota shares per allocation EC Export certificates
PT Past trading performance
Policy Instruments
1 1st
– tier tariffs
2 2nd
– tier tariffs
Q0 Quota quantity
Other Regressors
Pd Domestic price in terms of domestic currency
Pw World reference price in domestic currency
Inc IncomePop Population level
C Individual-specific effects
E Random error term
Plag One-period lagged production
We also add individual specific effect variables to control for the unobserved individual
heterogeneity and measurement error. This gives the following specification for TRQ fill rates:3
*
0 1 2 3 4 5 6 7 8
9 1 11 12 13 14 15
16 17 18 1 19 2
'
,
it
it wit it it it it it it
it it it it it it it
it it it i it it
y X c ePlag P AU FC LD AU HI ST
PG OT MX DPR LA EC PT
Pop Inc c e
= + +
= + + + + + + + +
+ + + + + + +
+ + + + + +
(3)
3 The quota quantity is not explicitly included in the model, but its effect on the fill rate is embodied in the constant
term.
Page 11
7/30/2019 The Impacts of Tariff Rate Import Quotas on Market Access 2
http://slidepdf.com/reader/full/the-impacts-of-tariff-rate-import-quotas-on-market-access-2 11/31
10
where ci is the unobserved individual specific effect.
The dependent variable, the TRQ fill rate, is censored. It is left-censored at 0 because no
imports occur for some TRQs during some years either due to insufficient demand or a
prohibitive in-quota tariff. It is also censored from the right because the quota is binding for
some TRQs with fill rates equal to 1. As in Figure 2, the observed fill rate equals 1 for any
demand curve lying from ED1 to ED3. Hypothetically, if there was no quota, a fill rate of 1
would be observed only with demand curve ED1. Excess demand curves other than ED1 would
lead to imports higher than Q0 and the quota fill rate greater than 1. For instance, imports for
demand ED2 in Figure 2 would occur at M2 and would result in a fill rate higher than 1,0
2
Q M , if
the quota instrument was not contained in the TRQ regime.
Figure 2. Imports under TRQs When the Quota is Binding
Hence, the TRQ fill rate, *
it y , is a latent variable. Theoretically, the observed fill rate, yit ,
can be defined as:
Pw
Pd
P
Q
ED2
ES
M=Q0 0
Pw+1
Pw+2
A
B
M2
ED1
ED3
C
M3
Page 12
7/30/2019 The Impacts of Tariff Rate Import Quotas on Market Access 2
http://slidepdf.com/reader/full/the-impacts-of-tariff-rate-import-quotas-on-market-access-2 12/31
11
3
0
19 2 3
0 0
0 * 0
* 0 * 1
1 1 *
* * ,
it
it it
it it
it it
if y
y if y
M if y y
Q
M y if yQ Q
< <
=
+ >
(4)
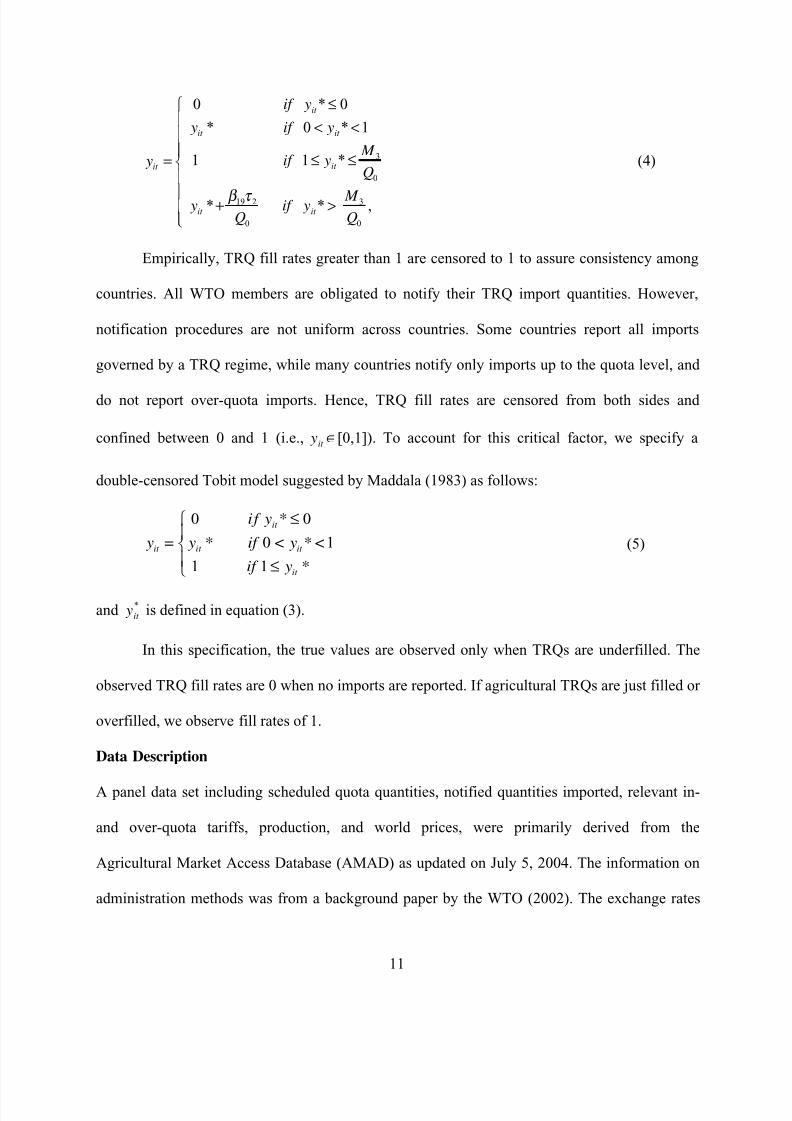
Empirically, TRQ fill rates greater than 1 are censored to 1 to assure consistency among
countries. All WTO members are obligated to notify their TRQ import quantities. However,
notification procedures are not uniform across countries. Some countries report all imports
governed by a TRQ regime, while many countries notify only imports up to the quota level, and
do not report over-quota imports. Hence, TRQ fill rates are censored from both sides and
confined between 0 and 1 (i.e., it y [0,1]). To account for this critical factor, we specify a
double-censored Tobit model suggested by Maddala (1983) as follows:
0 0
0 1
1 1
it
it it it
it
i f y *
y = y * if < y * <
if y *
(5)
and *
it y is defined in equation (3).
In this specification, the true values are observed only when TRQs are underfilled. The
observed TRQ fill rates are 0 when no imports are reported. If agricultural TRQs are just filled or
overfilled, we observe fill rates of 1.
Data Description
A panel data set including scheduled quota quantities, notified quantities imported, relevant in-
and over-quota tariffs, production, and world prices, were primarily derived from the
Agricultural Market Access Database (AMAD) as updated on July 5, 2004. The information on
administration methods was from a background paper by the WTO (2002). The exchange rates
Page 13
7/30/2019 The Impacts of Tariff Rate Import Quotas on Market Access 2
http://slidepdf.com/reader/full/the-impacts-of-tariff-rate-import-quotas-on-market-access-2 13/31
12
were obtained from the International Financial Statistical Yearbook by the International
Monetary Fund (2005). Other data, including population and national income, were obtained
from the 2004 World Development Indicator published by the World Bank. Harmonized system
(HS) codes were used as the concordance tool to map the information from different sources. In
the case of changing HS codes, descriptions of HS codes were carefully inspected and the
concordance was drawn based on similarities between descriptions.
Our data set includes every TRQ notified by twenty-eight member countries that
scheduled TRQs from 1995 to 2000.4
This time period coincides with the TRQ implementation
period as part of the URAA for developed countries. To some extent, this period can be viewed
as the trial period for agricultural TRQs, providing valuable information for possible reform of
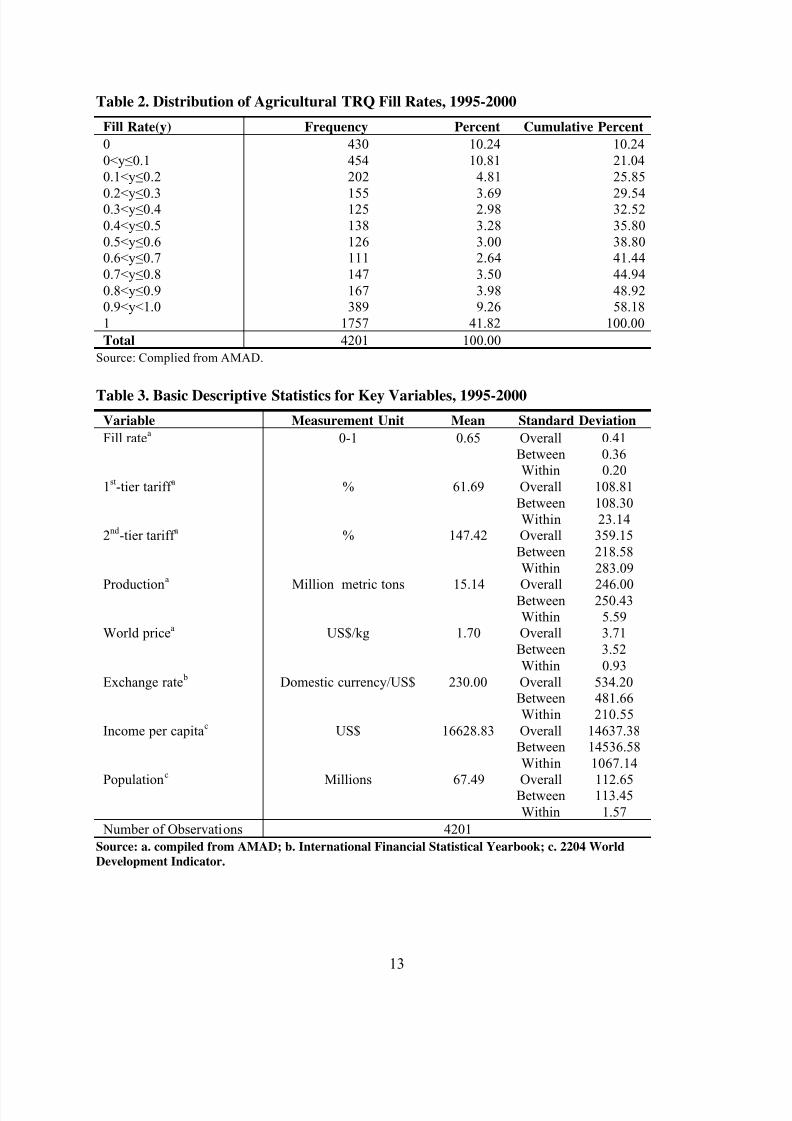
this trade regime. The sample descriptive statistics are reported in Tables 2 and 3. Table 2 shows
that the dependent variable, the TRQ fill rate, is censored from both sides. No imports were
reported for 10.2% of the 4,201 agricultural TRQs covered in this paper. At the same time,
41.8% of the covered agricultural TRQs were just filled or overfilled. This double-censored
feature suggests that a two-limit Tobit model specification rather than a simple linear
specification is appropriate.
The majority of agricultural TRQs are employed by developed countries that can afford
to protect their agricultural sector. TRQs provide rich countries with considerable flexibility in
terms of managing imports. Moreover, agricultural TRQs are heavily used in the trade of
politically sensitive commodities. A large number of the TRQs apply to trade in fruits and
4Five additional countries also scheduled TRQs beginning in 1995 but were not included in this study. El Salvador
and Nicaragua did not notify any TRQs because they did not offer quotas for any of the products on their schedules.
Malaysia, Mexico and Romania only notified a few of their scheduled TRQs, for one or two years. Hence, these five
countries were dropped from this study.
Page 14
7/30/2019 The Impacts of Tariff Rate Import Quotas on Market Access 2
http://slidepdf.com/reader/full/the-impacts-of-tariff-rate-import-quotas-on-market-access-2 14/31
13
Table 2. Distribution of Agricultural TRQ Fill Rates, 1995-2000 Fill Rate(y) Frequency Percent Cumulative Percent
0 430 10.24 10.24
0<y0.1 454 10.81 21.040.1<y0.2 202 4.81 25.85
0.2<y0.3 155 3.69 29.540.3<y0.4 125 2.98 32.52
0.4<y0.5 138 3.28 35.800.5<y0.6 126 3.00 38.800.6<y0.7 111 2.64 41.44
0.7<y0.8 147 3.50 44.94
0.8<y0.9 167 3.98 48.920.9<y<1.0 389 9.26 58.18
1 1757 41.82 100.00
Total 4201 100.00
Source: Complied from AMAD.
Table 3. Basic Descriptive Statistics for Key Variables, 1995-2000
Variable Measurement Unit Mean Standard Deviation
Fill ratea
0-1 0.65 Overall 0.41Between 0.36Within 0.20
1st-tier tariff
a% 61.69 Overall 108.81
Between 108.30Within 23.14
2nd -tier tariff a % 147.42 Overall 359.15
Between 218.58
Within 283.09
Production
a
Million metric tons 15.14 Overall 246.00Between 250.43Within 5.59
World pricea US$/kg 1.70 Overall 3.71
Between 3.52
Within 0.93
Exchange rate b
Domestic currency/US$ 230.00 Overall 534.20Between 481.66Within 210.55
Income per capitac
US$ 16628.83 Overall 14637.38Between 14536.58
Within 1067.14
Population
c
Millions 67.49 Overall 112.65Between 113.45
Within 1.57
Number of Observations 4201
Source: a. compiled from AMAD; b. International Financial Statistical Yearbook; c. 2204 World
Development Indicator.
Page 15
7/30/2019 The Impacts of Tariff Rate Import Quotas on Market Access 2
http://slidepdf.com/reader/full/the-impacts-of-tariff-rate-import-quotas-on-market-access-2 15/31
14
vegetables, dairy products, meat products, and cereal crops. Historically, these products have
received more protection than other agricultural commodities. Furthermore, agricultural TRQs
are subject to high tariff protection, with an average in-quota tariff of 62%. The average over-
quota tariff is 147%. Such high tariff protection is not surprising if we consider why these TRQs
are in place.
Summary statistics for the important regressors are reported in Table 3. The standard
deviation is decomposed into between and within components (see the last column of Table 3).
Clearly, variation of the regressors mainly arises from variation between individual TRQs, as any
variation of an individual TRQ over the years is relatively small.
Estimation
The pooled Tobit model without individual specific effects can be estimated by maximizing the
log-likelihood function. When the unobserved effects are included, either a fixed-effects
approach or a random-effects approach can be used. As the cross section dimension increases
and the time dimension is fixed, the estimators of limited dependent variable models with fixed
effects using panel data are, in general, inconsistent due to the “incidental parameters problem”
(Greene 2004). The problems are most acute when the time dimension of the panel is short.5
In contrast, the estimates of random-effects limited dependent variable models are
consistent even when the length of the panel is short, if the model is specified correctly.
Therefore, the individual specific variable ci enters the fill rate model (3) as a random-effects
variable in this study. Assume that the random-effects variable ci is not correlated with other
5 Honore (1992) developed trimmed least squares estimators, a semi-parametric method, to obtain consistent
estimates of a fixed-effects Tobit model in a short panel,. However, this method cannot be used to estimate the
consistent coefficients of variables that lack variation over time. Hence, this method is not appropriate for our model
because, principal and additional administration methods do not change over time once they are first specified.
Page 16
7/30/2019 The Impacts of Tariff Rate Import Quotas on Market Access 2
http://slidepdf.com/reader/full/the-impacts-of-tariff-rate-import-quotas-on-market-access-2 16/31
15
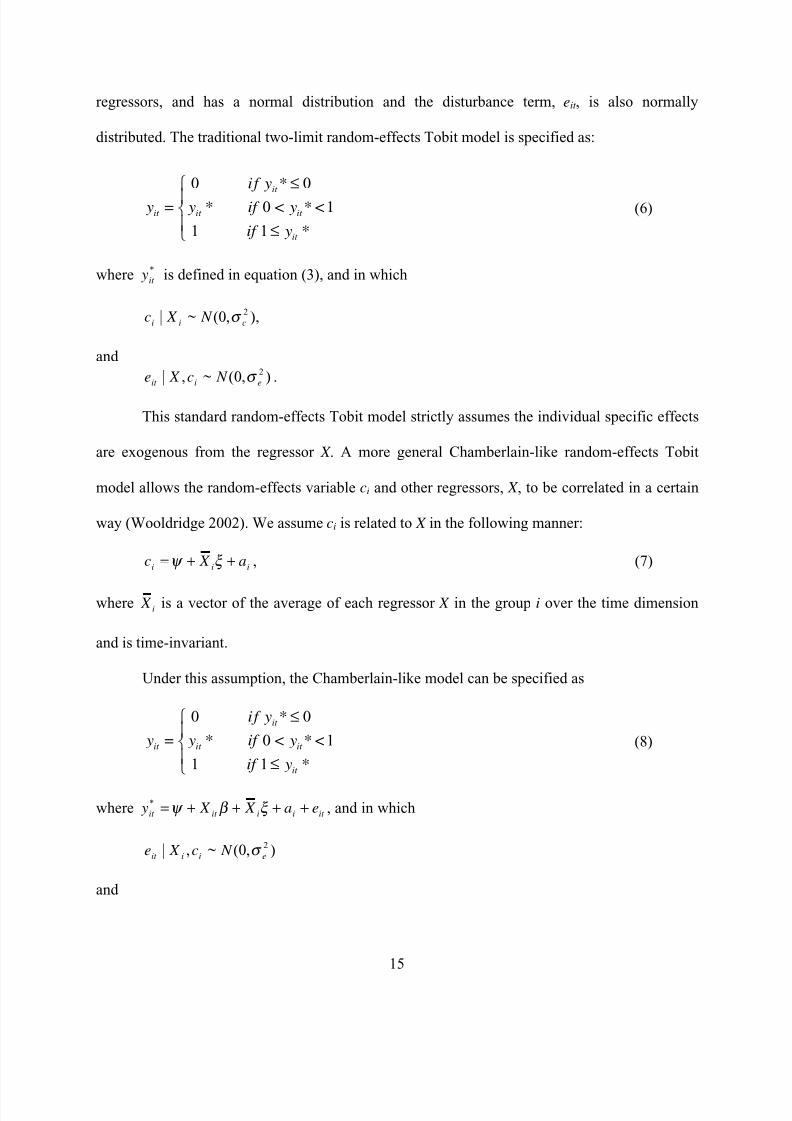
regressors, and has a normal distribution and the disturbance term, eit , is also normally
distributed. The traditional two-limit random-effects Tobit model is specified as:
0 0
0 1
1 1
it
it it it
it
i f y *
y = y * if < y * <
if y *
(6)
where *
it y is defined in equation (3), and in which
),,0(~| 2cii
N X c
and
),0(~,| 2eiit
N c X e .
This standard random-effects Tobit model strictly assumes the individual specific effects
are exogenous from the regressor X . A more general Chamberlain-like random-effects Tobit
model allows the random-effects variable ci and other regressors, X , to be correlated in a certain
way (Wooldridge 2002). We assume ci is related to X in the following manner:
iiia X c ++= , (7)
wherei
X is a vector of the average of each regressor X in the group i over the time dimension
and is time-invariant.
Under this assumption, the Chamberlain-like model can be specified as
0 0
0 1
1 1
it
it it it
it
i f y *
y = y * if < y * <
if y *
(8)
where it iiit it ea X X y ++++= * , and in which
),0(~,| 2eiiit
N c X e
and
Page 17
7/30/2019 The Impacts of Tariff Rate Import Quotas on Market Access 2
http://slidepdf.com/reader/full/the-impacts-of-tariff-rate-import-quotas-on-market-access-2 17/31
16
),0(~| 2aii
N X a .
Moreover, we assume that the set of error terms, {eit }, is serially independent conditional
on ( X i , ai). Hence, the Chamberlain-like random-effects two-limit Tobit model is the traditional
random-effects Tobit model with an additional set of time-constant explanatory variables.
Results
Three models—a simple pooled two-limit Tobit model, a standard random-effects two-limit
Tobit model, and a Chamberlain-like random-effects two-limit Tobit model—were estimated.
The results are presented in Table 4. A likelihood ratio test was performed to compare the
standard random-effects model with the pooled model. A Chi-square test statistic of 2,547.70
with 1 degree of freedom clearly rejects the null hypothesis that individual specific effects are
not present. Therefore, the random-effects model is preferred to the simple pooled model. In the
Chamberlain-like model, the time-invariant means of the continuous variables are added to the
standard random-effects model. The Chi-square test statistic of 56.13 with 7 degrees of freedom
indicates that the null hypothesis is rejected and that the time-invariant variables are jointly
significant. Individual significance tests of the time-invariant variables show that some
coefficient estimates are statistically different from zero. The results of these tests therefore
indicate that the Chamberlain-like random-effects model best fits the data. Hence, the following
discussion is based on that model.
The estimate of the world price coefficient has a negative sign as expected but is not
significantly different from zero, suggesting that the world price is not an important determinant
of fill rates. This result seems a bit surprising. One possible explanation is that variation in the
world commodity prices over the six year study period was relatively small and this results in the
insignificant coefficient. A higher exchange rate makes imports more expensive in terms of the
Page 18
7/30/2019 The Impacts of Tariff Rate Import Quotas on Market Access 2
http://slidepdf.com/reader/full/the-impacts-of-tariff-rate-import-quotas-on-market-access-2 18/31
17
domestic currency, discouraging imports and leading to lower fill rates.6
This negative estimate
helps explain the import price story because world transactions prices of most commodities are
in U.S. dollars.
A one-period lagged production variable is included as the instrument for the domestic
price. Its estimated coefficient has the correct sign. When domestic supply is higher, the demand
for imports is lower and the fill rate decreases. But this estimated coefficient is statistically
insignificant, which suggests a weak link between the domestic and the international market,
implying that other factors may play a more important role in determining imports. However,
production data is more aggregate than trade data for many TRQ commodities, and the
aggregated data may also reduce the estimated production effect.
The estimated impacts of the population and per capita GDP variables on fill rates are
found to be trivial. The coefficient estimate of population is statistically different from zero only
at the 10% significance level while that of income is insignificant. This result is not surprising
given the short panel nature of the data. During the period under study, the standard deviations of
these two variables over time are quite small (Table 3) and hence their influence on the fill rate
may not be fully picked up in such a short time period. At the same time, most TRQs are used by
rich countries, where population and income growth are not strong drivers of food imports.
Two policy instruments, the in-quota and the over-quota tariffs, are both subject to
pressure for reduction as part of the WTO trade negotiations. These two tariffs increase the
import price and should reduce fill rates. Surprisingly, the coefficient estimates seem to show
that neither of these two tariff rates play an important role in determining fill rates and that the
6 The exchange rates used in the study are defined as the amount of domestic currency that can be exchanged for one
U.S. dollar. Hence, a higher exchange rate means a weaker domestic currency.
Page 19
7/30/2019 The Impacts of Tariff Rate Import Quotas on Market Access 2
http://slidepdf.com/reader/full/the-impacts-of-tariff-rate-import-quotas-on-market-access-2 19/31
18
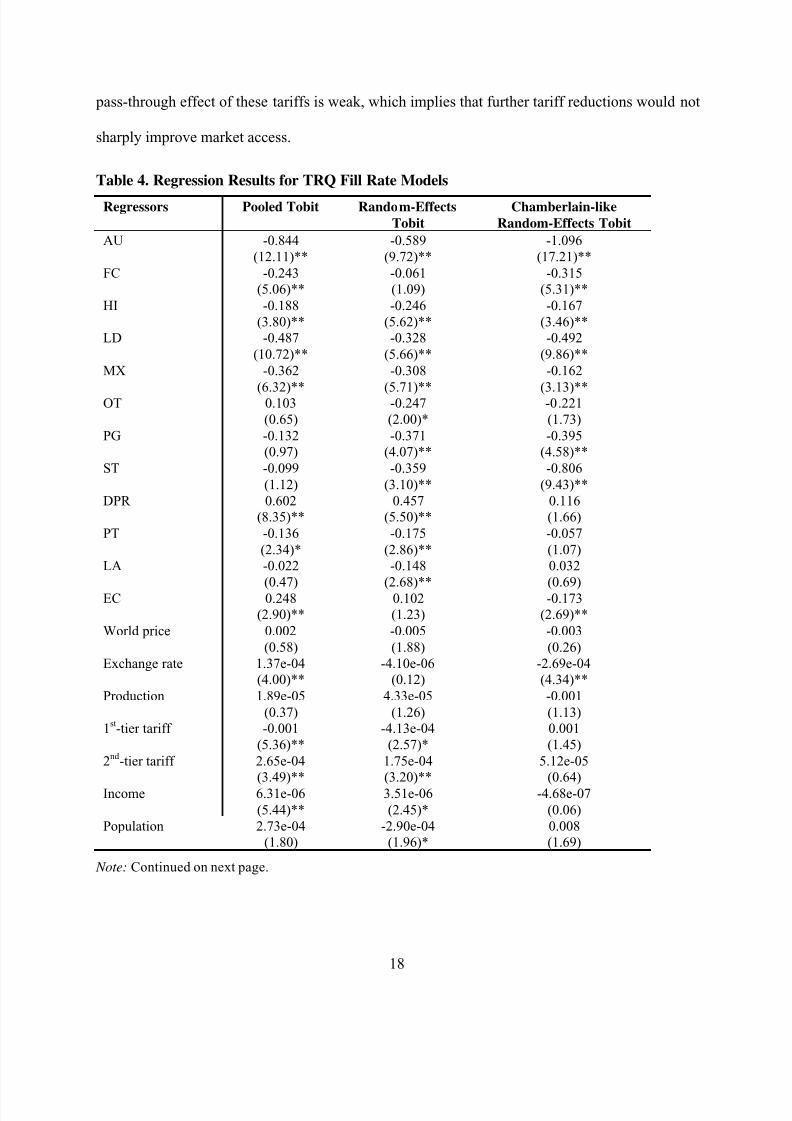
pass-through effect of these tariffs is weak, which implies that further tariff reductions would not
sharply improve market access.
Table 4. Regression Results for TRQ Fill Rate Models
Regressors Pooled Tobit Random-Effects
Tobit
Chamberlain-like
Random-Effects Tobit
AU -0.844 -0.589 -1.096
(12.11)** (9.72)** (17.21)**
FC -0.243 -0.061 -0.315
(5.06)** (1.09) (5.31)**
HI -0.188 -0.246 -0.167
(3.80)** (5.62)** (3.46)**
LD -0.487 -0.328 -0.492
(10.72)** (5.66)** (9.86)**
MX -0.362 -0.308 -0.162
(6.32)** (5.71)** (3.13)**OT 0.103 -0.247 -0.221
(0.65) (2.00)* (1.73)
PG -0.132 -0.371 -0.395
(0.97) (4.07)** (4.58)**
ST -0.099 -0.359 -0.806
(1.12) (3.10)** (9.43)**
DPR 0.602 0.457 0.116
(8.35)** (5.50)** (1.66)
PT -0.136 -0.175 -0.057
(2.34)* (2.86)** (1.07)
LA -0.022 -0.148 0.032
(0.47) (2.68)** (0.69)EC 0.248 0.102 -0.173
(2.90)** (1.23) (2.69)**
World price 0.002 -0.005 -0.003
(0.58) (1.88) (0.26)
Exchange rate 1.37e-04 -4.10e-06 -2.69e-04
(4.00)** (0.12) (4.34)**
Production 1.89e-05 4.33e-05 -0.001
(0.37) (1.26) (1.13)
1st-tier tariff -0.001 -4.13e-04 0.001
(5.36)** (2.57)* (1.45)
2nd
-tier tariff 2.65e-04 1.75e-04 5.12e-05
(3.49)** (3.20)** (0.64)
Income 6.31e-06 3.51e-06 -4.68e-07
(5.44)** (2.45)* (0.06)
Population 2.73e-04 -2.90e-04 0.008
(1.80) (1.96)* (1.69)
Note: Continued on next page.
Page 20
7/30/2019 The Impacts of Tariff Rate Import Quotas on Market Access 2
http://slidepdf.com/reader/full/the-impacts-of-tariff-rate-import-quotas-on-market-access-2 20/31
19
Table 4. Regression Results for TRQ Fill Rate Models (Continued) Regressors Pooled Tobit Random-Effects
Tobit
Chamberlain-like
Random-Effects Tobit
1st-tier tariff -0.002
(average) (3.54)**
2nd
-tier tariff 0.001(average) (5.82)**
World Price -0.002
(average) (0.20)
Exchange rate 0.001
(average) (9.16)**
Production 0.001
(average) (1.16)
Income 9.18e-06
(average) (1.25)
Population -0.007
(average) (1.51)
Constant 0.903 0.936 0.792(28.09)** (23.07)** (21.56)**
Log likelihood -3897.99 -2624.14 -2595.07
Observations 4201 4201 4201
Note: 1. Absolute value of t statistics in parentheses
2. *significant at 5%; ** significant at 1%
3. AU = Auctioning, FC = First-come, first-served, HI = Historical importers, OT = Other,
LD = Licenses on demand, MX = Mixed allocation methods, PG = Producer groups,
ST = Imports by state trading enterprises, DPR = Domestic purchase requirement,
LA = Limits on quota shares per allocation, PT = Past trading performance,
EC = Export certificates.
The results from the corresponding time-invariant estimated coefficients for these two
tariffs, however, prevent us from reaching such a strong conclusion. The coefficient estimate for
the time-invariant average of each TRQ’s 1st-tier tariff is statistically significant and negative.
However, changes in the in-quota tariff of each TRQ over time do not strongly influence TRQ
fill rates. The dominant effect of average in-quota tariff is plausible because the annual changes
in each in-quota tariffs are small since the 1
st
-tier tariffs were not subject to reduction during the
URAA implementation period. The significance of the average in-quota tariff also indicates that
some unobserved factors related to the in-quota tariff serve to reduce fill rates. For instance,
strong domestic pressure for protecting a commodity can lead governments to deliberately set the
Page 21
7/30/2019 The Impacts of Tariff Rate Import Quotas on Market Access 2
http://slidepdf.com/reader/full/the-impacts-of-tariff-rate-import-quotas-on-market-access-2 21/31
20
in-quota tariff so high that the fill rate is significantly lowered. In summary, the regression
results regarding the in-quota tariff imply that further reductions of the 1st-tier tariffs will
increase agricultural TRQ fill rates.
On the other hand, the coefficient estimates for the time-invariant average of each TRQ’s
over-quota tariff are positive, which at first seems counterintuitive but is plausible. For instance,
an important factor, the quota rent, is closely linked to the over-quota tariffs but is not
observable. A higher 2nd -tier tariff can generate a higher per unit quota rent, which tends to
encourage importers to use the quota to gain windfall profits. As a result, TRQs are more likely
to be filled and fill rates may go up. This result does not imply that the 2
nd
-tier tariff rate should
be increased, however.
In interpreting the impacts of the in-quota and over-quota tariffs on market access, it is
worth noting that the estimated effects of tariffs could be underestimated due to the possible
positive impact of fill rates on tariff levels. Tariffs and fill rates could mutually affect each other
rather than one-way causation where tariffs only affect fill rates. It is well known that higher
tariff rates raise import costs and thereby result in lower fill rates. However, an expected high
TRQ fill rate may motivate the government to intentionally set high tariffs in order to prevent the
fill rate from becoming too high. Hence, two factors may be present-the negative effect of tariffs
on fill rates and the positive effect of fill rates on tariffs. The signs of the estimated impacts of
tariffs on fill rates depend on the relative magnitude of these two effects.
The potential presence of the positive effect has two implications for the results. First, the
actual fill-rate-reducing effect of the first-tier tariff should be higher than the estimated
coefficient, if fill rates also positively affect tariffs. Moreover, this possible positive effect of fill
rates provides another plausible explanation for the positive estimated coefficient of the over-
Page 22
7/30/2019 The Impacts of Tariff Rate Import Quotas on Market Access 2
http://slidepdf.com/reader/full/the-impacts-of-tariff-rate-import-quotas-on-market-access-2 22/31
21
quota tariff. The data show that the average over-quota tariff for TRQs that are just filled or
overfilled is higher than that of TRQs that are underfilled, which suggests that positive causation
is very possible. Hence, in addition to the quota rent story, it is possible that the positive effect of
fill rates on over-quota tariffs is stronger than the negative effect, so that we observe the
surprising result that a higher over-quota tariff may lead to a higher fill rate.
Regarding the principal administration methods, the regression results show that
“administration” affects the implementation of TRQs and plays an important role in determining
fill rates. The coefficient estimates on all of the principal administration method dummy
variables with the exception of the “other” method are statistically significant and have a
negative sign. These results suggest that, in practice, the costs generated by administration
methods are high enough to reduce fill rates.
The estimation results indicate that the benchmark method, “applied tariffs”, has the least
negative effect on market access. Under the “applied tariffs” method, imports are allowed in
unlimited quantities at the in-quota tariffs. No quantitative component is specified under this
method, so that no foreign market shares are allocated and no quota rents are generated. TRQs
managed by this method are actually equivalent to simple tariffs. Hence, this administration
method is transparent and the most efficient.
It is surprising that the “auctioning” method has the largest negative (estimated) effect on
market access, given that it is the second most efficient administration method in theory.
However, in practice the capacity of the “auctioning” method to function as a price-discovery
mechanism is hindered if the market is not sufficiently liquid (Skully 2001). If markets are thin,
transactions costs for this method can be very high, which in turn leads to low fill rates. The
different bidding systems designed by governments adopting “auctioning” methods can affect
Page 23
7/30/2019 The Impacts of Tariff Rate Import Quotas on Market Access 2
http://slidepdf.com/reader/full/the-impacts-of-tariff-rate-import-quotas-on-market-access-2 23/31
22
the competitiveness of bidding and thereby reduce imports. For example, Switzerland’s auctions
are based on a principle of “maximum bid, maximum share”. This auctioning system allows one
group to purchase the entire import quota, and that group can then limit imports to maximize its
revenue, which in turn often results in relatively low fill rates (Khorana 2004).
The “first come, first served (FC)”, “license on demand (LD)”, and “historical importer
(HI)” methods all belong to the “quasi-market” allocation group. However, their estimated
impacts on market access differ because each method allocates import rights in different ways.
Of the three methods, our estimates show that LD has the strongest negative influence on fill
rates. Under this method, licenses are issued among applicants based on quantities requested. It
is the uncertainty surrounding the actual share that a firm will realize that probably leads to low
fill rates. To try to obtain a larger share, importers have an incentive to exaggerate their quota
requests. Moreover, the eventual market shares from the pro rata allocation can be so small that
individual importers choose not to import in order to avoid high transportation costs per unit.
Hence, some quota may not be filled. The estimated negative effect of the FC method is slightly lower than that of the LD
method. The FC method places a premium on timing because the timing of imports determines
the applicable tariff. If an importer is caught importing over the quota, then he will incur huge
costs through a prohibitive tariff, storing the product outside the border, or trans-shipping the
product to another country. This inherent risk of being caught over quota is probably the main
reason for the low fill rates for this method.
The “historical importers” method has the least negative impact on fill rates of the three
methods. Under this method, quotas are allocated to firms primarily based on their past market
shares. The main concern over this method is its discriminatory nature. Historical suppliers are
Page 24
7/30/2019 The Impacts of Tariff Rate Import Quotas on Market Access 2
http://slidepdf.com/reader/full/the-impacts-of-tariff-rate-import-quotas-on-market-access-2 24/31
23
given market share irrespective of whether or not they have a cost advantage and whether they
even have surplus production for export. On the other hand, this method has the advantage of
predictability and brings certainty into the exporters’ planning processes. Licensed exporters
have an incentive to fill the quota to secure future market shares, which helps raise the fill rate.
Compared with the “applied tariffs” method, the “other” method does not run much risk
of lowering fill rates, given that the coefficient estimate for this method is only statistically
different from 0 at the 10% significance level. Any discussion of the effects of this method is
difficult because the definition of this method is ambiguous and detailed information is lacking.
One known “other” method is a scheme that allocates import rights through some form of lottery.
The lottery mechanism is similar to other “quasi-market” methods. However, it does not involve
the risk of being caught over quota the way the “first come first served” method does. Moreover,
every competitor has the opportunity of obtaining an import license, which is an improvement
over the rigidity of the “historical importers” method. Hence, it is not too surprising that this
mechanism actually performs better than “quasi-market” allocation methods.
The negative effect of the “mixed” allocation method is mild. Similarly, it is difficult to
provide a convincing explanation for this result, because of a lack of information. This method
involves more than one administration method and no one single method is dominant. It is
possible that none of the individual methods employed under this administration procedure are
too restrictive, so that the combined effect on the fill rate is relatively small.
Under the last two methods, the “producer groups (PG)” method and the “state trading
(ST)” method, the import-sourcing decisions are made by a specific domestic group. Many
factors that may have nothing to do with economic considerations are involved in import
decisions in these cases and they could easily bias imports away from low-cost suppliers. The
Page 25
7/30/2019 The Impacts of Tariff Rate Import Quotas on Market Access 2
http://slidepdf.com/reader/full/the-impacts-of-tariff-rate-import-quotas-on-market-access-2 25/31
24
estimation results reveal that state trading has a large negative effect on fill rates, while the
“producer groups” method only moderately impedes imports.
Although all of the principal administration methods have negative impacts on TRQ fill
rates, the magnitudes of their impacts differ. We tentatively rank the effects of each method on
fill rates according to the size of the empirically estimated coefficients (see Table 5).
Surprisingly, the empirical ranking is quite different from the theoretical ranking by
Skully(2001). It is the “auctioning” method, the second best method in theory that results in the
lowest fill rates of all the principal methods. The “producer groups” method has a medium
influence on fill rates. Moreover, the most discriminatory method, the “historical importers”
method, has a rather small impact on TRQ fill rates.
Table 5. Rank of the Impacts on Fill Rates across Administration Methods Impacts on Fill Rates Theoretical Ranking Empirical Results
Low Market allocation AT
methods AU
AT
OT
MX
HI
Medium Quasi-market FC
methods LD
HI
FC
PG
LD
High Discretionary PG
methods ST
ST
AU
Note: AT = Applied tariffs, AU = Auctioning, FC = First-come, firs- served,
HI = Historical importers, LD = Licenses on demand, PG = Producer groups,
ST = Imports by state trading enterprises.
Fulfilling additional conditions places additional costs on imports and can potentially
decrease TRQ fill rates. Hence, it is not surprising that “export certificates (EC)” and “past
trading performance (PT)” conditions are negatively related to quota fill rates. The former
condition requires export certificates in addition to import licenses so it significantly increases
Page 26
7/30/2019 The Impacts of Tariff Rate Import Quotas on Market Access 2
http://slidepdf.com/reader/full/the-impacts-of-tariff-rate-import-quotas-on-market-access-2 26/31
25
import costs and reduces fill rates. The “past trading performance” condition is quite similar to
the “historical importers” method. Under this condition, import licenses are allocated only to
established importers. Given the small magnitude of the estimated impact of the “historical
importers” method, it is reasonable that the effect of this additional condition is also
insignificant. The “limits on quota shares per allocation (LA)” condition does not impose
additional significant effects on the fill rates.
The coefficient estimate on the “domestic purchase requirement (DPR)” condition is
significant at the 10% level. This additional condition requires the purchase or absorption of
domestic production of the imported product in order to gain eligibility for a share of the import
quota. This requirement obviously increases costs for some firms. However, the estimation
results show that this additional condition can actually promote higher fill rates, which is a bit
puzzling. One possible reason for this result is that firms are perhaps more likely to commit to
imports once they obtain their quota share because they are involved in the domestic industry,
which leads to higher overall fill rates.
Robustness of Results
We estimated several additional models to test the sensitivity of our results and found our results
to be rather robust.7 In the first set of these models, applied bound tariffs rather than applied base
tariffs were used. In the second set of models, dummy variables for country or product that
represent characteristics of each TRQ were included. The main conclusions remain valid and the
results are statistically reliable. Greene’s results (2004) also provide support for the robustness of
our results. His results showed that, even in the extreme case in which traditional random-effects
models are clearly inappropriate, they do not perform too badly. In particular, the dummy
variable coefficients are essentially correctly estimated.
7 The results of these additional models are not reported here because they are similar to those in Table 4.
Page 27
7/30/2019 The Impacts of Tariff Rate Import Quotas on Market Access 2
http://slidepdf.com/reader/full/the-impacts-of-tariff-rate-import-quotas-on-market-access-2 27/31
26
Other issues could potentially weaken the robustness of our estimation results. First, the
empirical analysis pertains to calendar years that may differ from crop years for some
agricultural products. The discrepancy between crop and calendar years could lead to a scenario
in which calendar-year imports and fill rates do not reflect domestic demand cycles. However, if
the harvest is normal, the seasonality disguised by calendar-year annual data will not cause the
calendar-year fill rates to differ from the crop-year fill rates, because the bias is averaged out
given the time series nature of the data. But if the harvest in a particular crop year is poor,
calendar-year fill rates will deviate from crop-year fill rates and may not reflect true market
access in that year. In that case, dramatic fluctuations in fill rates for a specific TRQ could be
observed over time. However, significant systematic fluctuations in fill rate patterns do not
appear in our data set, suggesting that discrepancies between crop years and calendar years do
not bias our empirical results in any significant way.
In addition, this study covers only the 1995-2000 time period due to data availability. For
several reasons, we believe that the estimation results based on these six years would not change
much even if data for the years after 2000 were added. First, no significant trends in agricultural
TRQ fill rates were observed during the study period. Moreover, the estimated coefficient for a
time trend variable is statistically insignificant if it is included in the model. Furthermore,
implementation of TRQs since 2000 has not changed much for developed countries because no
consensus has been reached about TRQ reform in the Doha round. At the same time,
implementation of TRQs in developing countries has not changed much either because the
URAA implementation period for developing countries ended in 2004 and no new agreement has
been reached.
Summary and Conclusion
Page 28
7/30/2019 The Impacts of Tariff Rate Import Quotas on Market Access 2
http://slidepdf.com/reader/full/the-impacts-of-tariff-rate-import-quotas-on-market-access-2 28/31
27
The 1994 Uruguay Round Agreement on Agriculture (URAA) marked a historic turning point in
reform of the global trading system. As part of the URAA process of tariffication, over 1,400
tariff-rate quotas (TRQs) emerged as a mechanism to manage agricultural imports. TRQs
combine elements of both tariffs and quotas in a complex way. An examination of the
implementation of agricultural TRQs from 1995 to 2000 confirms the a priori belief that TRQs
effectively protect agricultural commodities from foreign competition. The relatively low fill
rates raise an interesting question. What factors limit market access the most under TRQs and
what is the best way to reform the TRQ regime to achieve greater market access?
We conduct a systematic analysis to find explanations for the relatively low TRQ fill
rates. Our results show that under the general TRQ regime, the linkage between the domestic and
international market is weak due to many non-market factors. Imports of TRQ protected
commodities do not respond well to changes in domestic production. Our results suggest that
high in-quota tariffs serve to reduce fill rates, which means that further reducing in-quota tariffs
will improve market access. It is surprising that we find the current over-quota tariffs have a
positive effect on TRQ fill rates. But this result is most likely explained by the existence of
unobserved quota rents. This does not imply that the over-quota tariffs should be left untouched.
It simply means that the over-quota tariffs are not currently as relevant as the in-quota tariffs in
terms of affecting market access.
Reforming TRQ administration methods is a key issue in future WTO trade negotiations.
Participants in the negotiations generally accept that there is no single best method for
administering TRQs. However, the negotiations could potentially sort out which allocation
methods should be encouraged and which should not (WTO 2004). Our empirical results suggest
that all administration methods reduce market access compared to the “applied tariffs” method of
Page 29
7/30/2019 The Impacts of Tariff Rate Import Quotas on Market Access 2
http://slidepdf.com/reader/full/the-impacts-of-tariff-rate-import-quotas-on-market-access-2 29/31
28
quota allocation. We find that the effects of alternative administration methods on fill rates differ
in practice, implying that the choice of the TRQ administration method is important. Moreover,
the empirical ranking of their impacts on fill rates deviates from the theoretical ranking.
We conclude that WTO negotiation efforts devoted to making agricultural TRQ
administration simpler and more transparent will surely improve market access. The result that
the “applied tariff” method is superior to other administration methods and has the least impact
on market access suggests that the sooner the transitional TRQ regime is phased out and replaced
by a tariff-only regime, the greater will be market access.
References
Abbott, P. C. 2002. “Tariff-rate Quotas: Failed Market Access Instruments?” European Review
of Agricultural Economics, 29:109-130.
Abbott, P. C., and P. L. Paarlberg. 1998. “Tariff Rate Quotas: Structural and Stability Impacts inGrowing Markets.” Agricultural Economics, 19(3): 257-267.
Anania, G., M.E. Bohman, C.A. Carter, and A.F. McCalla, ed. 2004. Agricultural Policy Reform
and the WTO: Where Are We Heading?. Cheltenham, UK: Northampton, MA : Edward Elgar.
Boughner, D., H. de Gorter, and I. M. Sheldon. 2000. “The Economics of Two-Tier Tariff-RateImport Quotas in Agriculture.” Agricultural and Resource Economics Review, 29(1):58-69.
Bureau, J.C., and S. Tangermann. 2000. “Tariff Rate Quotas in the EU.” Agricultural and
Resource Economics Review, 29(1): 70-80.
Greene, W. 2004. “Fixed Effects and Bias Due to the Incidental Parameter Problems in the TobitModel” Econometric Reviews, 23(2):125-47.
Herrmann, R., M. Kramb, and C. Mönnich. 2001. “Tariff rate quotas and the economic impact of
agricultural trade liberalization in the world trade organization.” International Advances in
Economic Research, 7(1):1-19.
Honore, B. 1992. “Trimmed LAD and Least Squares Estimation of Truncated and Censored
Regression Models with Fixed Effects.” Econometrica, 60 (3):533-65.
Page 30
7/30/2019 The Impacts of Tariff Rate Import Quotas on Market Access 2
http://slidepdf.com/reader/full/the-impacts-of-tariff-rate-import-quotas-on-market-access-2 30/31
29
International Agricultural Trade Research Consortium. 2001. “Agriculture in the WTO: Issues inReforming Tariff-Rate Import Quotas in the Agreement on Agriculture in the WTO.”
Commissioned Paper 13, IATRC, University of Minnesota.
International Monetary Fund. 2005. International Financial Statistical Yearbook 2004. IMF,
Washington DC.
Khorana, S. 2004 “Tariff Rate Quotas: A Market Access Barrier for Developing Countries
Products? The Case of Switzerland”.www.aes.ac.uk/downloads/conf_papers_04/Khorana.pdf .
Maddala, G. S. 1983. Limited Dependent and Qualitative Variables in Econometrics. New York:Cambridge University Press.
Monnich, C. 2003. “Tariff Rate Quotas: Does Administration Matter?” Paper presented at the
International Conference on Agricultural Policy Reform and the WTO: Where Are WeHeading?, Capri, Italy, June 23-26.
Organization for Economic Cooperation and Development. 2002. Agriculture and Trade
Liberalisation: Extending the Uruguay Round Agreement. Paris OECD.
Podbury, T. and I. Roberts. 1999. “WTO Agricultural Negotiations: Important Market AccessIssues.”, ABARE Research Report 99.3, Canberra.
Skully, D. 2001. “Economics of Tariff-Rate Quota Administration: Economic Analysis of TRQ
Administrative Methods.” Economic Research Service/USDA.http://www.ers.usda.gov/publications/tb1893/tb1893d.pdf .
United Nations, Food and Agriculture Organization. 2000. Multilateral Trade Negotiations on
Agriculture-a Resource Manual/Agreement on Agriculture, Rome.http://www.fao.org/documents/show_cdr.asp?url_file=/docrep/003/x7353e/x7353e05.htm.
Wooldridge, J. 2002. Econometric Analysis of Cross Section and Panel Data. Cambridge,
Massachusetts: MIT Press.
World Bank. 2004. 2004 World Development Indicator. World Bank, Washington DC.
World Trade Organization. 2000. Tariff Quota Administration Methods and Tariff Quota Fill.Background Paper by the Secretariat, G/AG/NG/S/8, May.
____. 2001. Tariff Quota Administration Methods and Tariff Quota Fill, Revision. Background
Paper by the Secretariat, G/AG/NG/S/8/Rev. 1, May.
____. 2002. Tariff and Other Quotas. Background Paper by Secretariat, TN/AG/S/5, 22 March.
____. 2004. WTO Agricultural Negotiations: the Issues, and Where We Are now. December 1.http://www.wto.org/english/tratop_e/agric_e/agnegs_bkgrnd_e.pdf .
Page 31
7/30/2019 The Impacts of Tariff Rate Import Quotas on Market Access 2
http://slidepdf.com/reader/full/the-impacts-of-tariff-rate-import-quotas-on-market-access-2 31/31
____. 2005. Tariff Quota Fill. Note by the Secretariat, TN/AG/S/20, 4 July.
Appendix. WTO’s Definition of Principal Administration Methods
Administration Methods Description
Applied Tariffs (AT) No shares are allocated to importers. Imports of the products
concerned are allowed into the territory of the Member in
unlimited quantities at the in-quota tariff rate or below.
Auctioning (AU) Importers' shares are allocated, or licenses issued, largely on
the basis of an auctioning or competitive bid system.
First-come, First-served (FC) No shares are allocated to importers. Imports are permitted
entry at the in-quota tariff rates until the tariff quota is f illed;
then the higher tariff automatically applies. The physical
importation of the good d etermines the order and hence the
applicable tariff.
Historical Importers (HI) Importers' shares are allocated, or licenses issued, principally
in relation to past imports of the product concerned.
Licenses on Demand (LD) Importers' shares are generally allocated, or licenses issued,
in relation to quantities demanded and often prior to the
commencement of the period during which the physicalimportation is to take place. This includes methods involving
licenses issued on a first-come, first-served basis and those
systems where license requests are reduced pro rata where
they exceed available quantities.
Producer Groups (PG) Import shares are allocated entirely or mainly to a producer
group or association which imports (or has direct control of
imports undertaken by the relevant Member) the product
concerned.
State Trading Entities (ST) Import shares are allocated entirely or mainly to a state
trading entity which imports (or has direct control of imports
undertaken by intermediaries) the product concerned.
Other (OT) Administration methods which do not clearly fall within any
of the above categories.
Mixed Allocation (MX) Administration methods involving a combination of the
methods as set out above with no one method being
dominant.
Non-specified (NS) Tariff quotas for which no administration method has been
notified.