The Importance of Streetscapes and Servicescapes in Tourist Shopping Villages: A Case Study of Two Arizona Communities by Jordan Cox A Thesis Presented in Partial Fulfillment of the Requirements for the Degree Master of Science Approved July 2013 by the Graduate Supervisory Committee: Dallen Timothy, Chair Deepak Chhabra, Co-chair David Carlson ARIZONA STATE UNIVERSITY August 2013
Transcript
The Importance of Streetscapes and Servicescapes in Tourist Shopping
Villages: A Case Study of Two Arizona Communities
by
Jordan Cox
A Thesis Presented in Partial Fulfillment of the Requirements for the Degree
Master of Science
Approved July 2013 by the Graduate Supervisory Committee:
Dallen Timothy, Chair
Deepak Chhabra, Co-chair David Carlson
ARIZONA STATE UNIVERSITY
August 2013
i
ABSTRACT
Many communities that once relied on the extractive industries have since turned
to tourism to find another source of income. These communities are primarily old mining
towns. Since these towns have started to reinvent themselves, they have become
important places of study. Previous literature has found specific factors that are common
in tourist shopping villages. Currently, there is not much research that has explored the
affect the streetscape and servicescape have on visitor experiences. Existing research
focuses on urban shopping settings such as shopping malls. This study interviewed
employees and surveyed visitors in two suburban tourist shopping villages in Arizona.
More specifically, it is aimed to explore how the streetscapes and servicescapes in tourist
shopping villages influence visitors’ overall experience, intent to return to the village, and
their purchasing behavior. This study adds to the current literature on tourist shopping
villages and the streetscapes and servicescapes as there is a limited amount of
information available. To date, the majority of scholarly information available describes
the factors of tourist shopping villages and does not attempt to identify their importance
for tourists. This study may serve as a stepping platform for future research. The
findings of this study offer important implications for destination marketing
organizations, different stakeholders of tourism, and the policy makers. This study
primarily focuses on the tourists’ view of tourist shopping villages, and can offer insight
into how to increase visitor spending.
ii
TABLE OF CONTENTS
Page
LIST OF TABLES ................................................................................................................. vi
LIST OF FIGURES .............................................................................................................. vii
[S]mall towns and villages that base their tourist appeal on retailing, often in a pleasant setting marked by historical or natural amenities. They are found along touring routes, in destination areas and near urban centres, but are markedly different from urban business and shopping districts in terms of their small scale, specialty retailing and distinct ambiance (p.15).
Shopping is a complex subject and one of the oldest and most important activities
undertaken by tourists (Lehto, Cai, O’Leary, and Huan, 2004; Goss, 1993; Murphy,
and Reisinger, 2001; Wilkins, 2011). Moscardo’s (2004) study found that 49% of
tourists she surveyed said that they went shopping for souvenirs (local arts and crafts),
and 62% said that they went shopping in general.
Some researchers have suggested that shopping enhances a site and the
experience of the visitor (Murphy et. al, 2010). However, there is some disagreement
among researchers on this subject. Timothy (2005) references 11 studies after stating that
shopping is a universal activity and that it does, indeed, enhance destinations globally.
Getz (1993) stated that there has been research done in historic inner cities that has
confirmed that “historic settings and shopping together present an inviting leisure
environment,” (1993, pg. 17). Also in the article, Getz stated that while shopping is a
very common tourist activity, “it does not necessarily mean that shopping heightens an
area’s relative attractiveness,” (1993, p.17). While this discrepancy should be
acknowledged, most of the existing literature leans toward the notion that shopping
improves a tourism area.
Due to the complexity of this subject, the current literature on leisure shopping is
vast and covers a wide range of topics, yet relatively little is known about tourists’
7
experiences in tourist shopping villages and how TSVs can influence the visitors’
experiences.
Murphy et. al. (2010) identified several needs for future research on tourist
shopping villages, claiming that shopping is a very important visitor activity, but it is
poorly researched in TSV settings. While onsite visitor experiences, including the
influences of servicescapes and other elements of the retail environment, have been
thoroughly researched in urban retail centers and tourist attractions (Timothy, 2005), they
are poorly understood in the context of TSVs. How do intangible elements, such as
service quality and experiencing new cultures, affect the visitor experience? Research is
needed to understand the linkage of elements that are consistent with the overall theme of
the village, including the interior and exterior environment of shops. These concepts
should be applied to TSVs and other outdoor shopping areas. It is also worth researching
whether or not visitors are more interested in the environment and the theme of the
village rather than the products offered. Additionally, Bäkström, (2006) suggested that
future studies focus on the importance that individuals attach to the physical aspects of
store environments while they are partaking in leisure shopping, and what meanings
those individuals attribute to these aspects. She also recommended researching the role
these aspects play in creating the satisfaction derived from leisure shopping.
These issues are all important in understanding how TSVs become tourist
attractions and how their physical environments affect visitors’ experiences. This study
aims to examine the role of streetscapes and servicescapes in the experiences of tourists,
8
how they influence visitors’ purchasing behavior, and their intent to return to the TSV.
TSVs, however, as already noted, are different from other shopping environments in that
they typically derive most of their appeal from their historic origins. Their cultural or
natural heritage, therefore, provides the foundations for tourism development, while
shopping becomes the secondary product down the road. In the end, however, the
heritage and shopping elements tend to become equal in importance for attracting
tourists.
Attractiveness of Tourist Destinations
Ritchie and Zins (1978) presented a model aimed at determining the variables that most
influence the attractiveness of a tourism region. This is a two-stage model; the first stage
includes the general factors that determine the overall attractiveness of a tourism region,
and the second stage includes the social and cultural elements contributing to the
attractiveness of a tourism region, shown in Figure 1. While both stages may apply to
TSVs, this study will only include the first stage. The first stage of the model lists eight
variables that determine the overall attractiveness of a tourism region, shown in Figure 1
and described in Figure 2. These variables are sport, recreation and educational facilities,
shopping and commercial facilities, price levels, infrastructure of the region, attitudes
towards tourists, accessibility of the region, cultural and social characteristics, and natural
beauty and climate. The inclusion of shopping and commercial facilities in this model
9
supports the idea that shopping does increase a tourism area’s attractiveness. The
remaining factors will be further discussed later in this study.
Figure 1. Variables influencing the attractiveness of a tourism region
STAGE 1
STAGE 2 -
10
Source: Ritchie and Zins (1978)
. Variables influencing the attractiveness of a tourism region
STAGE 1 - General factors which determine the overall attractiveness of a tourism region
Sport, recreation and educational facilities
Natural beauty and climate
Cultural and social characteristics
Accessibility of the region
Attitudes towards tourists
Infrastructure of the region
Price levels
Shopping and commercial facilities
Social and cultural elements contributing to the attractiveness of a tourism region
Work
Dress
Architecture
Handicrafts
History
Language
Religion
Education
Traditions
Leisure Activities
General factors which determine the overall
Sport, recreation and educational facilities
Natural beauty and climate
Cultural and social
Accessibility of the region
Attitudes towards tourists
Infrastructure of the region
Shopping and commercial
Social and cultural elements contributing to the
Work
Dress
Architecture
Handicrafts
History
Language
Religion
Education
Traditions
Leisure Activities
Figure 2. General Factors Influencing the Attractiveness of a Tourism Region
Natural beauty and climate
•which includes the general topography; flora and fauna; proximity to lakes, rivers and sea; mountains; islands; hot and mineral water springs; waterfalls; as well as; amount of sunshine; temperature; winds; precipitation; discomfort index
Culture and social characteristics
•which includes language; traditions; gastronomic practices; art; sculpture; music; architecture; work; religion; education; dress; leisure behavior; history; museums; and festivals
Sport, recreation and educational facilities
•which includes golf courses; tennis courts; swimming; skiing; horseback riding; sailing; movies; casinos; health spas; picnic grounds; hiking trails; zoos; aquariums; and botanical gardens
Shopping and commercial facilities
•which includes souvenir and gift shops; boutiques; shopping malls; commercial displays
Infrastructure of the region
•which includes the quality and availability of differenct means of communication; auto routes; lodging; health services; information; food services; and level of personal and material safety
Price levels
•which involves the value received for money spent on major services, food, lodging and transportation within the region
Attitudes towards tourists
•which involves the warmth of reception by the local population; ease of communication; willingness to privide information; and a lack of hostility towards tourism activities
Accessibility of the region
•which includes the physical distance to the region; the time involved in reaching the region; and practical barriers due to customs and security inspections
11
Source: Ritchie and Zins (1978)
General Factors Influencing the Attractiveness of a Tourism Region
which includes the general topography; flora and fauna; proximity to lakes, rivers and sea; mountains; islands; hot and mineral water springs; waterfalls; as well as; amount of sunshine; temperature; winds; precipitation; discomfort index
Culture and social characteristics
which includes language; traditions; gastronomic practices; art; sculpture; music; architecture; work; religion; education; dress; leisure behavior; history; museums; and festivals
Sport, recreation and educational facilities
which includes golf courses; tennis courts; swimming; skiing; horseback riding; sailing; movies; casinos; health spas; picnic grounds; hiking trails; zoos; aquariums; and botanical
Shopping and commercial facilities
which includes souvenir and gift shops; boutiques; shopping malls; commercial displays
which includes the quality and availability of differenct means of communication; auto routes; lodging; health services; information; food services; and level of personal and material safety
which involves the value received for money spent on major services, food, lodging and transportation within the region
which involves the warmth of reception by the local population; ease of communication; willingness to privide information; and a lack of hostility towards tourism activities
which includes the physical distance to the region; the time involved in reaching the region; and practical barriers due to customs and security inspections
General Factors Influencing the Attractiveness of a Tourism Region
which includes the general topography; flora and fauna; proximity to lakes, rivers and sea; mountains; islands; hot and mineral water springs; waterfalls; as well as; amount of sunshine;
which includes language; traditions; gastronomic practices; art; sculpture; music; architecture;
which includes golf courses; tennis courts; swimming; skiing; horseback riding; sailing; movies; casinos; health spas; picnic grounds; hiking trails; zoos; aquariums; and botanical
which includes souvenir and gift shops; boutiques; shopping malls; commercial displays
which includes the quality and availability of differenct means of communication; auto routes; lodging; health services; information; food services; and level of personal and material safety
which involves the value received for money spent on major services, food, lodging and
which involves the warmth of reception by the local population; ease of communication;
which includes the physical distance to the region; the time involved in reaching the region;
12
The first factor from Ritchie and Zins’ (1978) model is ‘natural beauty and
climate.’ This includes the flora and fauna, which is part of the vegetation of an area, and
the temperature of the area. In this study, as it is being conducted in Arizona, the
temperature of the region can be very important. Day trippers from the Phoenix area
usually enjoy a break from the summer heat, making at least one of the two sites in this
study, Jerome, an ideal place to go, as the temperature tends to be much lower than that in
Phoenix.
The second factor is ‘cultural and social characteristics,’ including language and
tradition. Languages and traditions are part of intangible heritage, and are usually found
in TSVs. Museums and festivals can serve as anchor attractions in a TSV. Also in this
category are architecture and art, which are tangible heritage.
The next factor in Ritchie and Zins’ (1978) model is the availability of ‘sport,
recreation, and educational facilities.’ Amenities such as golf courses, swimming, skiing
and horseback riding are interactive, participatory activities for visitors. Casinos, health
spas, zoos, and hiking trails can be anchor attractions that entice tourists to visit a village.
‘Shopping and commercial facilities’ includes souvenir and gift shops, boutique
shops, and displays. This is the foundation of a TSV, as the majority, if not all, of the
shops in a TSV are unique, boutique style stores.
The ‘infrastructure of the region’ is important to any tourist attraction. This
includes parking and easy public access, which TSVs sometimes struggle with. TSVs are
often located in old towns that were not built to sustain a heavy traffic flow, which leads
13
town managers to be creative with the space available. Also in this category are lodging
and food services. Both of these are important components in TSVs, as they can lure
visitors to stay longer and spend more money.
Of the eight factors listed in Ritchie and Zins’ (1978) model, one of them, ‘price
levels,’ is not very relevant to TSVs. While this may be somewhat applicable to any
lodging properties in a village, people are more willing to spend money on items that are
unique to a location, such as artwork and handicrafts, typically found in TSVs (Murphy
et. al., 2010).
Ritchie and Zins’ (1978) model includes a factor called ‘attitudes towards
tourists,’ which is echoed in Mitchell’s (1998) creative destruction model. Ritchie and
Zins found that of the eight factors that contribute to the attractiveness of a tourism
region, ‘attitudes towards tourists’ was ranked third most important to tourists. While
this study focused on warm, helpful and friendly attitudes, it is safe to assume that
negative attitudes towards tourists would be just as important. Mitchell’s creative
destruction begins with positive attitudes towards tourists, but as tourism takes over, the
locals’ views of tourists begins to worsen, ending with an extremely negative attitude
towards visitors. Drawing from both models, it is necessary to find a happy medium in
which the locals do not feel threatened by tourism, and the visitors feel welcomed by the
locals.
Finally, ‘accessibility of the region’ refers to the distance and time travelled to
arrive at the tourist destination, as well as any barriers to entrance. Murphy et. al. (2010)
14
stated that in order to have a busy TSV, it needs to be located close enough to a large
base market where visitors can make a day trip to the village. It should also be relatively
easy for visitors to access from main roads; signage can be helpful to guide visitors to the
village.
Post-Industrialism and the Development of TSVs
Many regions of the world have undergone an economic transition from extractive
economies (e.g. mining, hunting, gathering, agriculture), to manufacturing/industrial
economies, to post-industrial economic activities (e.g. services and information
technology). In pre-industrial societies, more than 60% of the labor force is engaged in
extractive industries, which include mining, fishing, forestry, and agriculture. These
industries were, and still are, exceptionally important to the global economy (Bell, 1976).
By the late 1970s, some areas of the world were still in the pre-industrial period,
including parts of Asia, Africa, and South America. Some areas of the world, such as
Japan and the United States, have moved on to become industrial and post-industrial
societies. In an industrial society, the mass production of goods prevails, and workers
rely more heavily on machinery for production. Post-industrial societies are based on
services rather than the production of goods. In the US in 1950, half of the labor force
was involved in the production of goods, with 34% directly manufacturing products
(Bell, 1976). The 2010 US Census found that only 18.6% of the population was
employed in the agriculture, mining, construction, and manufacturing industries. By
2010, over one third of the US population, 34.4%, was employed in the retail trade and
15
educational and health services industry (U.S. Bureau of Labor Statistics, 2011; U.S.
Census Bureau, 2010). Table 2 shows the percentage of the labor force that was
employed in each major industry in the US in 2010; the smallest industries pertain to
Information 3,149,000 2.2% Financial Activities 9,350,000 6.7%
Professional and Business Services
15,253,000 10.9%
Education and Health Services
32,062,000 23.0%
Leisure and Hospitality 12,530,000 9.0% Other Services 6,769,000 4.8%
Government Workers 6,983,000 5.0% Source: US Census (2010)
16
The production of goods will continue to be an important component in the
United States as long as the public yearns for a higher standard of living. However, goods
are being produced by fewer and fewer people (U.S. Census Bureau, 2010).
The transition from an industrial society to a post-industrial society has roughly
followed the economic shift from Fordism to post-Fordism (Apostolakis, 2003). The
concept of Fordism began in the 1920s, and was based on Henry Ford’s approach to mass
production (Ioannides and Debbage, 1997). Ford used an assembly line and broke down
complex tasks into simpler tasks by the use of specialized tools. By doing so, Ford was
able to increase the volume of goods produced, while at the same time reducing the cost
of producing the goods (Antonio and Bonanno, 2000; Sayer, 1989). The major
characteristics of Fordism include mass production and consumption, standardization of
products, unskilled laborers, and most everything being crafted by a machine rather than
by hand (Clarke, 1990; Ioannides and Debbage, 1997).
The Fordist economy was at its highest point in the 1960s. The 1970s marked a
time of crisis for Fordist economies, and during the 1980s the economy began to shift
towards post-Fordist service economies (Clarke, 1990; Ioannides and Debbage, 1997).
Rather than mass production, post-Fordism uses small batch production. Goods and jobs
are more specialized, and luxury and custom goods are more important. Mass marketing
is replaced by market segmentation in which consumers are treated as different groups
who seek different goods and services. Production of goods is based on demand, rather
than relying on a mass stock of standardized goods (Ioannides and Debbage, 1997; Sayer,
17
1989), and the economic focus shifts from manufacturing to more service-oriented
economies such as technology, tourism, and finance.
One area of historic economic importance that has undergone a radical change, or
de-industrialization, is mining. Mining in the US southwest began in 1849 during the
California Gold Rush. When the output of gold decreased, the price of silver increased.
Copper did not become very important or valuable until the 1890s. Copper camps were
usually camps that had previously mined for other minerals, such as gold or silver.
Nikola Tesla introduced alternating current (AC) electricity at the World Exposition in
Chicago in 1893. The AC system relied on copper as a conductor for electricity, causing
the copper industry to boom. By 1910, Arizona had become the country’s leader in
copper mining (Arizona Mining Association, 2013), and by 1970 the US had become the
largest copper producer in the world (Tilton and Landsberg, 1999).
By 1790, a mere 5% of Americans lived in cities that had a population of 2,500 or
more. By 1995, that number had increased to over 80% of the American population.
Rural North America was heavily dependent on the extractive industries until the 1970s.
During this time, an economic restructuring was occurring, shifting from pre-
industrial/industrial society with a Fordist economy to a post-industrial society with a
post-Fordist economy. The US started to move away from the extractive economy to a
more service-based economy. This caused a rise in rural unemployment, which forced
people to have to find new sources of income. Many turned to service-based activities,
such as tourism. Areas that were once heavily production based have now become
18
consumption areas (Litvin, 2005; Daugstad, 2008). One manifestation of this
phenomenon was socio-economic change in rural America, and the development of what
Getz (1993) terms ‘tourist shopping villages.’
In most cases, TSVs began as agricultural or mining settlements that possessed cultural and/or natural heritage features that were of interest to outsiders. As part of a natural process, then, tourism began to grow, transforming them into boutique communities where shopping dominates the tourism scene (Timothy, 2005 p. 48).
As previously noted, Getz (1993) defines TSVs as small towns that attract tourists by
unique shopping opportunities, and historic or natural amenities. The primary appeal of
TSVs is heritage or natural surroundings, but they also offer specialty shops,
accommodations, and restaurants designed around a specific theme, all of which create a
unique rural shopping appeal. TSVs are often set in important historic areas that offer
additional attractions and services for visitors. These attractions may consist of
museums, guided tours, historic buildings, bed and breakfast establishments, and
shopping (Getz, 1993; Lew, 1989). Businesses typically found in TSVs include cafes,
antique shops, gift shops, art galleries, book stores, and restaurants (Timothy, 2005). A
combination of these amenities, together with the villages’ heritage ambience, attracts
tourists to these towns (Murphy et. al., 2010).
As the above paragraphs note, TSVs tend to spring up in attractive areas. There
are three ways in which TSVs develop: natural/organic evolution, entrepreneur-driven,
and planned. In the case of natural evolution, tourist-oriented services develop in
response to tourist demand, which usually appears and grows as a result of an area’s
19
natural or cultural aesthetics (Getz, 1993; Lew, 1989). There is no single individual or
business that dominates the area, only several small businesses. Although growth begins
organically, local planning and environmental controls are needed to conserve the
heritage and natural amenities in the area (Getz, 1993).
In an entrepreneur-driven TSV, there is a dominant business or individual that
takes initiative, and others may follow suit. The first businesses act as catalysts in hopes
that tourism demand will be stimulated. There is a risk of selling out to non-residents and
a loss of authentic heritage in the area (Getz, 1993).
The final strategy of TSV development is a planned site. A developer may be
enticed by the heritage or natural attractiveness of an area, and create a TSV where one
does not exist. This would result in a built heritage site, with a high risk of a negative
reaction due to its lack of authenticity (Getz, 1993).
Souvenir shops are a common result of tourism growth. As tourism becomes
more concentrated in an area, souvenir shops are established to capitalize on tourists’
need to spend. As tourism increased throughout the 20th century, tourists’ demand for
local handicrafts increased and souvenir shops began to open around major attractions.
Besides meeting tourist demand, shopping adds attractiveness to most tourist
destinations, which can increase the flow of traffic through an area (Timothy, 2005). As
TSVs develop, the entire leisure experience should be taken into consideration to attract
(1974) termed the interior elements of stores ‘atmospherics,’ and divided them into four
categories: visual, aural, olfactory and tactile (softness, smoothness, temperature). Later,
Bitner (1992) coined the term servicescapes, which is generally the same as atmospherics
(Areni, 1994; Aubert-Gamet, 1999). As the atmospherics in a retail environment change,
consumers’ perceptions, behaviors and attitudes also tend to change (Turley and Chebat,
2002).
Many of the aforementioned elements of a store have been thoroughly researched
in the retail context; however, most of this research has been conducted in malls and
other urban shopping areas and has not focused on shopping in heritage villages
(Bäckström, 2006). Music has been found to influence the speed in which consumers
26
shop, the amount of time spent in the store, and the amount of money spent. The slower
the tempo, the more customers tend to linger in the store. Also, if consumers perceive the
music as favorable, their perceptions of wait times are influenced, and they find waiting
in line to be less stressful (Baker, 2002; Bitner, 1992; Yüksel, 2007). While music tends
to influence shoppers’ moods positively, other noises can have the opposite effect. In
more rural areas, mechanical/unnatural sounds are not as accepted as they are in
developed areas. Loud vehicles, tools, motorcycles, car horns, sirens, etc. can detract
from the environment and negatively affect consumers’ image of the store. Sounds such
as birds, wind, water, and other natural sounds usually have a positive effect on shoppers
(Anderson, 1983).
Lighting can also have an impact on consumer purchase behavior. Bright lights
can cause shoppers to be more aroused and influence more impulse buys, while soft
lighting is less stimulating and causes shoppers to spend more time in the store (Areni,
1994). Lighting can be so influential that there is a Lighting Handbook, which lays out
the three main goals of lighting in retail. These goals are 1) to attract the customer, 2) to
allow for evaluation of the merchandise, and 3) to facilitate completion of the sale.
Lighting can affect people’s mood and emotional state, which can influence their
purchasing behavior (Park, 2007).
Smell also plays an important role inside of stores. Different smells elicit
different feelings and emotions, which again, can affect shoppers’ purchasing behaviors
and intentions (Bitner, 1992; Chebat, 2003). Artificial smells are often used to induce
27
specific feelings in customers, depending on the store. For example, a room in the Epcot
Center in Walt Disney World smells like freshly baked chocolate chip cookies to make
visitors feel relaxed and comfortable. Bakeries have used synthetic scents to increase
sales, Dunkin’ Donuts and Starbucks infuse their shops with potent coffee smells, and
similar tactics have been utilized in Las Vegas, NV (Chebat, 2003). While these
elements have been well researched in typical retail settings, they have not been
excessively applied to TSV settings.
While the servicescape has been thoroughly researched, the importance of the
streetscape has been given less attention by researchers (Murphy et. al., 2010). It has
been well established that the atmospherics and design of store are very important, but
little research exists that explains how or why they are important (Bäckström, 2006).
This study will help to minimize this deficiency, and will focus on the streetscape of
TSVs. The streetscape is the exterior environment in a TSV; it is what the tourists are
drawn to. The exterior shopping environment is evaluated by tourists before entering the
shops, it is important that their first impression of the village is pleasing in order to draw
visitors into the shops (Bäckström, 2006; Yüksel, 2007; Frost, 2006; Murphy et. al.,
2011; Ward et. al, 1992). When the streetscape is well designed, it becomes an amenity
zone and attractive shopping area. However, sometimes the money spent to improve
streetscapes is considered a waste, often keeping the spending to a minimum (Fukahori
and Kubota, 2003). The streetscape is made up of vegetation, signage, street furniture,
water features, roadside buildings, road paving, and other aesthetic elements (Fukahori
28
and Kubota, 2003). Social, physical, and ambient factors are also included in the
streetscape.
Vegetation is an important factor in improving a TSV streetscape. Trees can be
used to break up continuous rows of buildings. Flowers add color and can take away
from more unsightly areas of a TSV. Vegetation has been found to evoke feelings of
calmness and reduce stress and anxiety. Aside from the aesthetic appeal, vegetation
including trees, shrubs and flowers can enhance the scent of an area (Smardon, 1988).
Visitors in areas that have many trees are found to spend more money in retail settings.
Architectural styles also play an important part in the physical presentation of a
streetscape. Consistency throughout the village is crucial in maintaining the heritage
aesthetic. A single building that looks modern can greatly take away from the heritage
aesthetic of a village. Creating buildings that are no more than two stories high creates a
feeling of quaintness and nostalgia.
Benches, trash cans, water fountains, lamp posts, etc. should all be consistent with
the theme. Consistently themed signage is also important. Often, government agencies
issue ordinances to set rules for signage. Preserving nostalgic forms of transportation,
such as steam trains and horses and carts can add to the heritage aesthetic.
A variety of shops in a TSV helps attract visitors and keep them interested in the
village. Too many similar shops selling the same types of products may become boring
for the visitors. In addition to a variety of shops, TSVs should have dining
establishments including restaurants, bakeries, coffee shops, pubs, ice cream parlors,
29
candy stores, etc. While many vendors extend their window displays to the exterior of
the shop to lure customers, they should to be careful not to make the area look cluttered
(Yüskel, 2007). Street vendors, greeters, guides, and street performers can add to the
liveliness of the streetscape.
The design and comfort of pedestrian pathways is also an important factor in the
physical presentation of a TSV. Raised pedestrian crossways, wide walkways, and
walkways that are separated from the road add to pedestrian comfort and their perception
of their safety (Murphy et. al., 2010).
30
Table 2
Environmental and Social Cues Found in TSV Streetscapes Environmental Cues Typical Features Physical/design factors
Vegetation Well-maintained small to medium street trees with wide canopies, woody flowering perennials, bright perfumed annuals, climbers on buildings, hardy drought tolerant species, fragrant herbs
Architectural Style Heritage facades, distinct rural or ethnic styles, use of natural materials (stone and timber), use of color
Use of Space Low built forms, set back from road, separation between buildings
Store Variety Restaurants, pubs, cafes, bakeries, local produce, arts and crafts, galleries, antiques & collectibles, toy shops, boutique clothing, Christmas shops, fudge & lolly shops
Signage Small, quaint, country-style, old-style lettering, use of rustic materials. Themed entrance signage, directional signs and interpretation
Street Decoration Consistent presentation of amenities such as lamp posts, bins and seating, street art, pavement art, water features, picket fences, café-style umbrellas
Pedestrian Areas Separation from road, wide walkways, arcades, frequent crossings, consistent use of paving in natural tones to add interest and texture
Displays Prominent street and window displays of products
Water Running water, fountains, streams
Social factors
People Street theatre, music, costumed/uniformed ‘actors’
Transport Nostalgic modes of transport, stream trains, horse& cart, vintage cars, removal of modern transport and parking from main streetscape
Ambient factors
Soundscape Birdsong, livestock, running water, breeze through vegetation, street music, absence of urban noises
Olfactory Village smells, cafes, bakeries, coffee shops, fragrant flowers & herbs, smoke from log fires, absence of urban pollution
Source: Murphy et. al. (2010)
31
Table 3 Environmental Cues Found in TSV Servicescapes
Environmental Cues Typical Features Physical/design factors
Use of Space Small, narrow walkways, often cluttered with products, limited use of tall shelving
Product Variety Individual stores specialize in particular product categories, breadth of products but often one of a kind or limited number of the same product, local handcrafted products or produce
Signs & Labels Small, quaint, country-style, old-style lettering, labels often hand written, emphasis on products themselves not elaborate labeling
Displays Low to eye level displays, emphasis on showcasing products and produce with great care taken in placing products, organic rather than orderly arrangement of displays, products often not grouped
Color & Texture Earthy tones (e.g. timber, stone) or heritage schemes, walls sometimes textured (e.g. stone, timber)
Floor Coverings Hard surfaces, tiles, timber, stone, slate
Furnishings & Shelving Usually timber, sometimes glass, rarely metallic
Social factors
Hosts Traditional outfits, ethnic clothing styles or costume
Visitors Expectations are for an uncrowded experience
Ambient factors
Lighting Natural light, supplemented by warm, soft lighting schemes
Sound Quiet music, slow tempo, relaxation, classic or jazz styles, rarely pop or rock
intent to return and servicescape purchasing behavior were all significantly, positively
correlated to satisfaction with the current visit. This indicates that the higher the rating in
these categories, the higher the visitor satisfaction with their visit to Wickenburg. Gender
is a significant factor in each model for satisfaction of current visit and length of stay. It
is positively correlated to each dependent variable for every model, meaning females
rated their satisfaction higher than males, and they planned to spend more time in town
than males.
57
Chapter 5
CONCLUSIONS
This study surveyed visitors to two TSVs in Arizona. The purpose was to find out
what, if any, importance the streetscape and servicescape have on visitors’ experiences
with the town, their intent to return to the town and their purchasing behavior while in the
town. It was found that streetscapes and servicescapes are influential in visitors’
experiences in TSVs. Certain factors were more important than others, but they were the
same in both towns.
Conceptual Implications
This study adds to the current literature on TSVs and streetscapes and
servicescapes as there is a limited amount of information available that goes beyond
listing ambient factors found in TSVs. To date, most of the scholarly information
available describes the ambient factors of a TSV and does not attempt to identify their
importance for tourists. It is important to determine which elements make a TSV more
attractive in the eyes of a tourist. This study may serve as a stepping platform for future
research.
This study has validated previous research on TSV environments (Murphy et. al.,
2010; Murphy et. al., 2011). Many of the factors that have been understood to be
important in a TSV setting have been confirmed in this study. Similar to Murphy et. al.
(2011), this study puts a value on the level of importance each factor holds to visitors.
However, the current study utilized different factors than Murphy et. al. (2011), and they
58
were applied to visitors’ overall experience, intent to return and purchasing behavior.
This study used a modified model based on Murphy et. al.’s (2010) important factors of a
TSV (Tables 2 and 3). It was modified according to the initial observations and
interviews conducted for this study, which resulted in new models appropriate for Jerome
and Wickenburg (Tables 4 and 5). This research will allow future studies to be
conducted to further validate these findings in other locations.
Additionally, this study focused on the tourists’ perspective of TSVs and how
certain feature influence their overall experience, intent to return to the TSV and their
purchasing behavior while in the TSV. Due to the demand perspective provided, the
findings from this study have economic implications for TSVs. The findings will help to
identify what should be enhanced or emphasized in the village in order to increase visitor
spending.
This study also validates the statement that historic settings and shopping go hand
in hand (Getz, 1993), which also confirms two of the elements on Ritchie and Zins’
(1978) model, ‘culture and social characteristics’ and ‘shopping and commercial
facilities.’ Knowing that this applies to modern TSVs, more research can be done
utilizing these models.
Real World Recommendations
The most influential factors relating to visitors’ overall experience and intent to
return were architecture, store variety, range of products, parking, ease of navigation
through the town, visual appeal, well maintained public spaces and cleanliness. Making
59
certain that these items are updated and kept to what the visitors want can help to increase
the amount of return visitors.
Architecture was important to visitors in both Jerome and Wickenburg, and is a
major attraction for many visitors. City officials, preservation societies and shopkeepers
can work together to create a set of standards that should be applied to all of the buildings
in the village, and ensure that each building meets these standards.
Making sure that there are not too many of the same types of shops in town will
help attract repeat visitors. If there are many similar stores, shopkeepers may possibly
work together to spread out the variety of products they offer so that each store does
differ from the rest, as range of products was also important to visitors’ experience and
intent to return.
Parking was an issue for both employees and visitors in Jerome, and during
special events in Wickenburg. It was noted in Jerome during the interviews that some
businesses have lost customers due to the parking situation. While it may not be possible
to add parking space, it is worth reevaluating it to see if there is a feasible solution.
Ease of navigation through the town was important in both locations.
Additionally, Murphy et. al. (2011) came to the same conclusion. To aid in visitors’
navigation, signs, maps, arrows and information booths would be beneficial.
Visual appeal was important to visitors’ overall experience and intent to return.
Further studies should focus on exactly what visitors find visually appealing in TSVs and
make any necessary changes in the villages.
60
Well maintained public spaces and cleanliness of public areas were both found to
be important in this study as well as in Murphy et. al.’s (2011) study. The towns may
hire someone to maintain the cleanliness on the streets, in the parking lots and in the
recreational areas. Also, shopkeepers should make sure the interior of the stores are kept
clean and orderly.
The most influential factors on visitors’ purchasing behavior are variety of stores,
range of products, easy to navigate through town, signage, street and window displays,
product displays, and alluring colors. Maintaining these factors can be financially
beneficial to shop owners as they may entice people to spend more money.
Varieties of stores, range of products and ease of navigation through the town
have already been discussed, and their implications are the same for purchasing behavior.
Stores should feature clear signage both inside and outside of the shops so visitors
know what kinds of products are available in the store, pricing information, and any other
relevant information about the products, such as if it was made locally.
Street and window displays should be visually appealing and show the products
that the store offers. Similarly, product displays within the shop should also be visually
appealing. The products should be easy to see, within reach (no tall shelving), be neat
and organized, and be labeled with the prices and other information about the products.
Further studies should be conducted to find out exactly what about product displays in
TSVs is visually appealing to visitors.
61
Alluring colors was significant to visitors’ purchasing behavior. Additional
studies should be conducted to determine which colors bring about certain feelings, and
where they should be placed in TSV shops in order to encourage people to spend more
money.
Additionally, it was found that gender has a significant relationship with visitors’
overall satisfaction, and age has a positive correlation to the frequency of visits to
Jerome. The overall satisfaction with Wickenburg’s streetscape and people’s intent to
return based on the servicescape has a positive correlation with the frequency of visits.
The higher visitors rated the servicescape and streetscape, the higher they rated their
satisfaction with the town. Gender is a positive factor in Wickenburg. Females rated
their satisfaction higher and planned on spending more time in the town. By finding out
what each age group and gender group’s preferences are, marketing managers can better
serve these market segments.
Word of mouth was the most common way that participants heard about the
TSVs. This has implications for marketing managers, and gives them the opportunity to
increase visitor traffic through town. Marketing managers should assure that visitors are
receiving correct and thorough information about the town. Shopkeepers can ensure that
visitors are receiving a consistently good experience so that they tell their friends and
family about it. People are more likely to tell others about a bad experience, so it is
imperative that visitors do not have a negative experience in the TSVs. Also, social
media should be utilized to spread the word of the towns and their activities.
62
There were several participants that said they found the town by accident, were
driving through and decided to stop or were brought there for a reason other than tourism.
These participants can be categorized as incidental visitors, and marketing managers
should find a way to appeal to them.
The majority of respondents said that they participated in multiple activities
during their visit. Town officials and shopkeepers should work together to ensure there is
always a variety of activities available to visitors. Murphy et. al. (2010) stated that it is
better for TSVs to have more than one anchor attraction to attract more visitors.
More than half of the respondents were repeat visitors. The local CVBs should
offer a newsletter or email club to visitors to keep them informed of any local events,
new shop openings, etc. to entice people to come back.
Only 18% of participants in Jerome and 6% in Wickenburg were planning to
spend the night. There is a great opportunity to increase overnight visits in these towns.
Owners of lodging properties should push their advertising and possibly use social media
networks as a platform to do so. These owners may partner with other businesses and
tourism officials to offer incentives to visitors that spend the night.
The internet was the most common tool used for trip planning. Tourism officials
should make sure that the information presented to potential visitors is always correct and
thorough. The websites should advertise upcoming events, new store openings, etc.
The Chamber of Commerce and Tourism Bureau were not utilized by any
participants when planning their trip. These offices may use social media to reach
63
potential visitors, particularly younger people. As the internet was the most popular way
to plan a trip, and social media is incredibly common, this would be beneficial to let
people know what they offer.
Limitations/Future Research
This study is not without its limitations. Future studies should attempt to validate
these findings. This study assumes that respondents answered the survey questions
honestly, accurately and without any biases. It is possible that survey questions were
interpreted differently by different participants. Furthermore, this study is not
representative of age. It should be repeated during the winter months to see if there is a
difference in visitors’ age, and if so, if there is a difference in their responses.
Future studies may be more heavily qualitative in nature. By doing more in depth
interviews and adding more open ended questions to visitor surveys, it is likely that new
information will be discovered. In depth surveys with the employees and shop owners
can give more information about the supply side of TSVs. A look at how TSVs are
portrayed in guidebooks, magazines and other print media compared to how the town
portrays itself and visitors’ opinions of the TSV would also offer new insight.
Additionally, ethnography may shed new light on the TSVs.
This study was only conducted in two towns in one southwestern state in the
United States, and the results did vary between the two towns. It is possible that answers
will be different in every town since none of them are identical in their history and
64
activities offered. While the findings may only specifically relate to Jerome and
Wickenburg, they may still have implications for similar sites.
Also, the sample size for this study is rather small with a total of 130 surveys and
30 interviews. Additional studies that replicate the current study with larger sample sizes
would be beneficial in helping to validate the findings of this study.
65
REFERENCES
Akhter, S. D., Andrews, J.C. and Durvasula, S. (1994) The influence of retail store environment on brand-related judgments. Journal of Retailing and Consumer Services, 1 (2): 67-76. Anderson, L.M., Mulligan, B.E., Goodman, L.S. and Regen, H.Z. (1983) Effects of sounds on preferences for outdoor settings. Environment and Behavior, 15 (5): 539-566. Antonio, R. J. and Bonanno, A. (2000) A new global capitalism? From “Americanism and Fordism” to “Americanism-Globalization.” American Studies, 41 (2/3): 33-77. Apostolakis, A. (2003) The convergence in heritage tourism. Annals of Tourism Research, 30 (4): 795-812. Areni, C.S and Kim, D. (1994) The influence of in-store lighting on consumers’ examination of merchandise in a wine store. International Journal of Research in Marketing, 11: 117-125. Arnold, M.J, Reynolds, K.E., Ponder, N and Lueg, J.E. (2005) Customer delight in a retail context: Investigating delightful and terrible shopping experiences. Journal of Business Research, 58: 1132-1145. Andreu, L., Bigné, E., Chumpitaz, R. and Swaen, V. (2006) How does the perceived retail environment influence consumers’ emotional experience? Evidence from two retail settings. International Review of Retail, Distribution and Consumer Research, 16 (5); 559-578. Arizona Mining Association (2013) Arizona mining association: Minerals make it possible. Retrieved from http://www.azmining.com/ Aubert-Gamet, V. and Cova, B. (1999) Servicescapes: From modern non-places to postmodern common places. Journal of Business Research, 44: 37-45. AZJerome (2013) Jerome, Arizona. Retrieved from http://www.azjerome.com/jerome/ Babin, B.J. and Attaway, J.S. (2000) Atmospheric affect as a tool for creating value and gaining share of customer. Journal of Business Research, 49: 91-99. Baker, J., Grewal, D. and Parasuraman, A. (1994) The influence of store environment on quality inferences and store image. Journal of the Academy of Marketing Science, 22 (4): 328-339.
66
Baker, J., Parasuraman, A., Grewal, D. and Voss, G.B. (2002) The influence of multiple store environment cues on perceived merchandise value and patronage intentions. Journal of Marketing, 66 (2): 120-141. Bäckström, K. (2006) Understanding recreational shopping: A new approach. International Review of Retail, 16 (2): 143-158. Bell, D. (1976) The coming of the post-industrial society. The Educational Forum, 40 (4): 574-579. Bitner, M.J. (1992) The impact of physical surroundings on customers and employees. Journal of Marketing, 56 (2): 57-71. Brown, A. (n.d.) Town of Wickenburg, AZ. Retrieved from http://www.ci.wickenburg.az.us/ Caton, K. and Santos, C. A. (2007) Heritage tourism on Route 66: Deconstructing nostalgia. Journal of Travel Research, 45 (4): 371-386. Chebat, J.C. and Michon, R. (2003) Impact of ambient odors on mall shoppers’ emotions, cognition, and spending: A test of competitive casual theories. Journal of Business Research, 56: 529-539. Chhabra, D., Healy, R. and Sills, E. (2003) Staged authenticity and heritage tourism. Annals of Tourism Research, 30(3): 702-719. Clarke, S. (1990) What in the F---‘s name is Fordism? British Sociological Association Conference. Creswell, J. W. (2009) Research Design: Qualitative, Quantitative, and Mixed Methods Approaches. Thousand Oaks, CA: Sage Publications. Daugstad, K. (2008) Negotiating landscape in rural tourism. Annals of Tourism Research, 35 (2): 402-426. Decrop, A. (1999) Triangulation in qualitative tourism research. Tourism Management, 20 (1): 157-161. Frost, W. (2006) From diggers to baristsas: Tourist shopping villages in the Victorian goldfields. Journal of Hospitality and Tourism Management, 13 (2): 136-143.
67
Fukahori, K. and Kubota, Y. (2005) The role of design elements on the cost-effectiveness of streetscape improvement. Landscape and Urban Planning, 63 (2): 75-91. Garland, R. (1991) The mid-point on a rating scale: Is it desireable? Marketing Bulletin, 3:66-70. Getz, D. (1993) Tourist shopping villages: Development and planning strategies. Tourism Management, 14 (1): 15-26. Goeldner, C. R. and Ritchie, J.R.B. (2009) Tourism: Principles, Practices, Philosophies. Hoboken, NJ: John Wiley & Sons, Inc. Goss, J. (1993) The ‘magic of the mall’: An analysis of form, function, and meaning in the contemporary retail built environment. Annals of the Association of American Geographers, 83 (1): 18-47. Hartmann, R. (1988) Combining field methods in tourism research. Annals of Tourism Research, 15 (1): 88-105. Hunt, J.D. and Layne, D. (1991) Evolution of travel and tourism terminology and definitions. Journal of Travel Research, 29 (4): 7-11. Ioannides, D. and Debbage, K. (1997) Post-Fordism and flexibility: The travel industry polyglot. Tourism Management, 18 (4): 229-241. Jeromechamber.com Jorgensen, D. L. (1989) Participant Observation: A Methodology for Human Studies. Thousand Oaks, CA: Sage Publications. Komorita, S. S. (1963) Attitude content, intensity, and the neutral point on a Likert scale. The Journal of Social Psychology, 61(2): 327-334. Kotler, P. (1974) Atmospherics as a marketing tool. Journal of Retailing, 49 (4): 48-64. Lehto, X. Y., Cai, L. A., O’Leary, J. T., and Huan, T. C. (2004) Tourist shopping preferences and expenditure behaviours: The case of the Taiwanese outbound market. Journal of Vacation Marketing, 10 (4): 320-332. Lew, A. A. (1989) Authenticity and sense of place in the tourism development experience of older retail districts. Journal of Travel Research, 27 (4): 15-22.
68
Littrell, M.A., Baizerman, S., Kean, R., Gahring, S., Niemeyer, S., Reilly, R., and Stout, J. (1994) Souvenirs and tourism styles. Journal of Travel Research, 33 (3): 3-11. Litvin, S. W. (2005) Streetscape improvements in an historic tourist city a second visit to King Street, Charleston, South Carolina. Tourism Management, 26 (3): 421-429. Lloyd, A. E., Yip, L. S. C., and Luk, S. T. K. (2011) An examination of the differences in retail service evaluation between domestic and tourist shoppers in Hong Kong. Tourism Management, 32 (3): 520-533. Marshall, M. N. (1996) Sampling for qualitative research. Family Practice, 13 (6): 522-526. McKercher, B. and Chan, A. (2005) How special is special interest tourism? Journal of Travel Research, 44(1): 21-31. Mitchell, C.J.A. (1998) Entrepreneurialism, commodification and creative destruction: A model of post-modern community development. Journal of rural Studies, 14 (3): 273-286. Modell, S. (2205) Triangulation between case study and survey methods in management accounting research: An assessment of validity implications. Management Accounting Research, 16 (2): 231-254. Moscardo, G. (2004) Shopping as a destination attraction: An empirical examination of the role of shopping in tourists’ destination choice and experience. Journal of Vacation Marketing, 10 (4): 294-307. Murphy, L., Pearce, P., Benckendorff, P., and Moscardo, G. (2008) Tourist shopping villages: Challenges and issues in developing regional tourism. CAUTHE 2008 Conference: Where the Bloody Hell are We? Murphy, L., Benckendorff, P., Moscardo, G., and Pearce, P.L. (2010). Tourist Shopping Villages: Forms and Functions. New York, NY: Routledge. Murphy, L., Moscardo, G., Benckendorff, P., and Pearce, P. (2011) Evaluating tourist satisfaction with the retail experience in a typical tourist shopping village. Journal of Retailing and Consumer Services, 18: 302-310. Park, H.Y. (2010) Heritage tourism: Emotional journeys into nationhood. Annals of Tourism Research, 37 (1): 116-135.
69
Park, N.K. and Farr, C.A. (2007) The effects of lighting on consumers’ emotions and behavioral intentions in a retail environment: A cross-cultural comparison. Journal of Interior Design, 33 (1): 17-32. Phillimore, J. and Goodson, L. (2004) Progress in qualitative research in tourism: Epistemology, ontology and methodology. In J. Phillimore and L. Goodson (eds.) Qualitative Research in Tourism: Ontologies, Epistemologies and Methodologies (pp. 3-29). New York, NY: Routledge. Prideaux, B. R. and Kininmont, L.J. (1999) Tourism and heritage are not strangers: A study of opportunities for rural heritage museums to maximize tourism visitation. Journal of Travel Research, 37: 299-303. Richards, G. (2007) Introduction: Global trends in cultural tourism. In G. Richards (ed.) Cultural Tourism: Global and Local Perspectives (pp.1-9). Binghamton, NY: The Hawthorn Press Inc. Ritchie, J.R.B. and Zins, M. (1978) Culture as determinant of the attractiveness of a tourism region. Annals of Tourism Research, V (2): 252-267. Rodda, J. (1990) “Hizzoner” the governer, “Baking Powder” Bill and “Rawhide” Jimmy: The men who built Jerome: Jerome’s mining history to the great depression. In A. Caillou (ed) Experience Jerome: The mogules, miners, and mistresses of Cleopatra Hill (pp.1-22). Sedona, AZ: Thorne Enterprises, Inc. Sayer, A. (1989) Postfordism in question. International Journal of Urban and Regional Research, 13 (4): 666-695. Seidman, I. (2006) Interviewing as Qualitative Research: A Guide for Researchers in Education and the Social Sciences. New York, NY: Teachers College Press. Smardon, R.C. (1988) Perception and aesthetics of the urban environment: Review of the role of vegetation. Landscape and Urban Planning, 15: 85-106. Smith, I. (1964) Wickenburg: yesterday and today. Arizona Highways, 40 (2). Smith, N. R. (1990) Jerom’s billion dollar boom bustle and bust: 1898 to the present. In A. Caillou (ed) Experience Jerome: The mogules, miners, and mistresses of Cleopatra Hill (pp.1-22). Sedona, AZ: Thorne Enterprises, Inc. Snepenger, D. J., Murphy, L., O’Connell, R., and Gregg, E. (2003) Tourists and residents use of a shopping space. Annals of Tourism Research, 30 (3): 567-580.
70
Stocker, J. (1976) Tumbledown town with a love of life. Arizona Highways, 52 (5). Teddlie, C. and Yu, F. (2007) Mixed methods sampling: A typology with examples. Journal of Mixed Methods Research, 1 (1): 77-100. Tiltion, J.E. and Landsberg, H.H. (1999) Innovation, productivity growth, and the survival of the U.S. copper industry. In R.D. Simpson (ed.) Improvement Through Innovation (pp.109-140). Washington, DC: Resources for the Future.
Timothy, D. J., and Butler, R. W. (1995) Cross-border shopping: A North American perspective. Annals of Tourism Research, 22 (1): 16-34.
Toll, D. W. (1968) Touring Arizona’s yesterdays. Arizona Highways, 44 (10). Towner, J. (1984) The grand tour: Sources and a methodology for an historical study of tourism. Tourism Management, 5 (3): 215-222. Turley, L.W. and Chebat, J.C. (2002) Linking retail strategy, atmospherics design and shopping behavior. Journal of Marketing Management, 18 (1-2): 125-144. Turner, L. W. and Reisinger, Y. (2001) Shopping satisfaction for domestic tourists. Journal of Retailing and Consumer Services, 8: 15-27. UNWTO (n.d.) World tourism organization UNWTO. Retrieved from htto://www2.unwto.org U.S. Bureau of Labor Statistics (2011) Employment and earnings online. Retrieved from http://www.bls.gov/opub/ee/home.htm U.S. Census Bureau (2010) United States census 2010: It’s in our hands. Retrieved from http://www.census.gov/2010census/ Ward, J.C., Bitner, M.J., and barnes, J. (1992) Measuring the prototypicality and meaning of retail environments. Journal of Retailing, 68 (2): 194-220.
71
Wickenburg Chamber of Commerce (n.d.) Visit Wickenburg Arizona. Retrieved from http://outwickeburgway.com Wilkins, H. (2011) Souvenirs: What and why we buy. Journal of Travel Research, 50 (3): 239-247. Yale, P. (1991) From Tourist Attraction to Heritage Tourism. Huntingdon, UK: Elm Publications. Yüksel, A. (2007) Tourism shopping habitat: Effects on emotions, shopping value and bahaviors. Tourism Management, 28: 58-69. Zeppel, H., Hall, C.M., and Weiler, B. (1992) Special Interest Tourism. London, UK: Belhaven Press.
72
APPENDIX A
MODIFIED STREETSCAPE & SERVICESCAPE FACTORS
73
Table 4
Environmental and Social Cues Found in Jerome and Wickenburg Streetscapes
Environmental Cues Typical Features Physical/design factors
Landscaping Trees, flowers, bushes or any other plant life located throughout the street
Architecture/Historic Buildings Heritage facades, distinct rural or ethnic styles, use of natural materials (stone and timber), use of color
Layout of town Aesthetically pleasing, easy to find one’s way around
Variety of store types Restaurants, pubs, cafes, bakeries, local produce, arts and crafts, galleries, antiques & collectibles, toy shops, boutique clothing, Christmas shops, candy shops
Signage Small, quaint, country-style, old-style lettering, use of rustic materials. Themed entrance signage, directional signs and interpretation
Street Decorations Lamp posts, trash cans, seating, fences
Pedestrian Areas/Front Street Well maintained, seating, shading, wide walkways
Street and Window Displays Prominent street and window displays of products
Social factors
Crowding Streets may be overpopulated with tourists
Parking Parking lots are set away from buildings and main streets, but it is still available on the streets
74
Table 5 Environmental Cues Found in Jerome and Wickenburg Servicescapes
Environmental Cues Typical Features Physical/design factors
Layout Organized shelving and product displays
Product Variety Variety of products throughout different shops, products unique to town
Signs & Labels Small, quaint, country-style, old-style lettering, labels often hand written, emphasis on products themselves not elaborate labeling
Displays Low to eye level displays, emphasis on showcasing products and produce with great care taken in placing products
Color & Texture Earthy tones (e.g. timber, stone) or heritage schemes, walls sometimes textured (e.g. stone, timber)
Furnishings Usually timber, sometimes glass, rarely metallic
Social factors
Crowding Shops may be crowded with tourists, making it difficult to see all products available
75
APPENDIX B
VISITOR SURVEY & INTERVIEW
76
Jerome/Wickenburg Visitor Survey
Thank you for agreeing to help us with this important study. This study is being conducted to understand visitors’ experiences in Jerome. Your participation in this survey is completely voluntary, and you are free to withdraw at any time. Your anonymity will be assured, as no names will be included in the study. If you have any questions, please feel free to contact Dr. Dallen Timothy, who is supervising this study (602) 496 1566 (email: [email protected]). Part 1- We would like to begin by asking you some questions about your current visit to Jerome. 1. Overall, how satisfied are you with your current visit?
o Extremely dissatisfied o Very dissatisfied o Dissatisfied o Neither satisfied or dissatisfied o Satisfied o Very satisfied o Extremely satisfied
2. How long do you plan to stay in Jerome?
o Less than one hour o One to three hours o Three to five hours o More than five hours o More than one day
3. Where did you learn about Jerome?
o Friends or relatives o Films o Books o Travel agent o Other (specify _______________________________)
4. How likely are you to make a return visit to Jerome in the next 12 months?
o Very unlikely o Unlikely o Neutral o Likely o Very likely o Not sure
5. What was the main purpose for your visit today? ___________________________________________________________ 6. Which activities did you participate in on this visit? Please mark all that apply.
o Museum/gallery o Winery
77
o Restaurant/café o Shopping o Bar/saloon o General sightseeing o Other (please specify ______________________________________________)
7. How many times have you been to Jerome in the past?
o Never o One o Two to three o Four to six o Seven or more
Part 2- Next, we would like to ask you about your thoughts and impressions of Jerome during your visit. 8. How would you rank the following as being an important part of your overall experience here today?
Strongly disagree
Disagree Slightly disagree
Neither agree nor
disagree
Slightly agree
Agree Strongly agree
The community’s landscaping
� � � � � � �
Architecture/historic buildings
� � � � � � �
Geographical layout of the town
� � � � � � �
Variety of store types and other businesses
� � � � � � �
Signage (e.g. quaint, rustic, historical)
� � � � � � �
Street decorations (e.g. fences, street lights)
� � � � � � �
Pedestrian areas/main street
� � � � � � �
Street and window displays
� � � � � � �
Cleanliness of the streets and public areas
� � � � � � �
78
9. To what extent do you think the shop-specific (in-shop) elements below played an important part of your overall experience here today? Strongly
disagree Disagree Slightly
disagree Neither agree nor
disagree
Slightly agree
Agree Strongly agree
alluring colors � � � � � � �
architectural/artistic merit
� � � � � � �
visual appeal � � � � � � �
building materials � � � � � � �
signs and windows � � � � � � �
layout of the shops, bars, cafes
� � � � � � �
range of products � � � � � � �
product displays � � � � � � �
furnishings � � � � � � �
overall ambience (e.g. lighting, sounds, smells)
� � � � � � �
10. To what extent do you agree with the statements below regarding your experience here today?
Strongly disagree
Disagree Slightly disagree
Neither agree nor disagree
Slightly agree
Agree Strongly agree
There was adequate parking
� � � � � � �
Well maintained public spaces
� � � � � � �
79
The town was too crowded
� � � � � � �
The shops were too crowded
� � � � � � �
It was easy to find my way around
� � � � � � �
11. How would you rank the following as influencing your intention to return to Jerome in the future? Strongly
disagree Disagree Slightly
disagree Neither agree nor
disagree
Slightly agree
Agree Strongly agree
The community’s landscaping
� � � � � � �
Architecture/historic buildings
� � � � � � �
Geographical layout of the town
� � � � � � �
Variety of store types and other businesses
� � � � � � �
Signage (e.g. quaint, rustic, historical)
� � � � � � �
Street decorations (e.g. fences, street lights)
� � � � � � �
Pedestrian areas/main street
� � � � � � �
Street and window displays
� � � � � � �
Cleanliness of the streets and public areas
� � � � � � �
Well maintained public spaces
� � � � � � �
80
12. To what extent do you think the shop-specific (in-shop) elements below have influenced your intention to return to Jerome in the future? Strongly
disagree Disagree Slightly
disagree Neither agree nor
disagree
Slightly agree
Agree Strongly agree
alluring colors � � � � � � �
architectural/artistic merit
� � � � � � �
visual appeal � � � � � � �
building materials � � � � � � �
signs and windows � � � � � � �
layout of the shops, bars, cafes
� � � � � � �
range of products � � � � � � �
product displays � � � � � � �
furnishings � � � � � � �
overall ambience (e.g. lighting, sounds, smells)
� � � � � � �
13. To what extent do you agree that the statements below have influenced your intention to return to Jerome in the future?
Strongly disagree
Disagree Slightly disagree
Neither agree nor disagree
Slightly agree
Agree Strongly agree
There was adequate parking
� � � � � � �
The town was too crowded
� � � � � � �
The shops were too crowded
� � � � � � �
81
It was easy to find my way around
� � � � � � �
14. How would you rank the following as being an important part of your purchasing behavior (souvenirs, food, etc.) here today? Strongly
disagree Disagree Slightly
disagree Neither agree nor
disagree
Slightly agree
Agree Strongly agree
The community’s landscaping
� � � � � � �
Architecture/historic buildings
� � � � � � �
Geographical layout of the town
� � � � � � �
Variety of store types and other businesses
� � � � � � �
Signage (e.g. quaint, rustic, historical)
� � � � � � �
Street decorations (e.g. fences, street lights)
� � � � � � �
Pedestrian areas/main street
� � � � � � �
Street and window displays
� � � � � � �
Cleanliness of the streets and public areas
� � � � � � �
Well maintained public spaces
� � � � � � �
15. To what extent do you think the shop-specific (in-shop) elements below played an important part of your purchasing behavior (souvenirs, food, etc.) here today?
82
Strongly
disagree Disagree Slightly
disagree Neither agree nor
disagree
Slightly agree
Agree Strongly agree
alluring colors � � � � � � �
architectural/artistic merit
� � � � � � �
visual appeal � � � � � � �
building materials � � � � � � �
signs and windows � � � � � � �
layout of the shops, bars, cafes
� � � � � � �
range of products � � � � � � �
product displays � � � � � � �
furnishings � � � � � � �
overall ambience (e.g. lighting, sounds, smells)
� � � � � � �
16. To what extent do you agree with the statements below regarding your purchasing behavior (souvenirs, food, etc.) here today?
Strongly disagree
Disagree Slightly disagree
Neither agree nor disagree
Slightly agree
Agree Strongly agree
There was adequate parking
� � � � � � �
The town was too crowded
� � � � � � �
The shops were too crowded
� � � � � � �
83
It was easy to find my way around
� � � � � � �
Part 3- In this final part, we would like to ask you some background information about you and your household. This information will be kept strictly confidential and used for statistical purposes only. The information is used to make sure we accurately represent visitors to Jerome. 17. Which of the following sources of information did you use when planning your trip? (check all that apply)
o Internet o Travel agent o Friends/Family o Guidebooks o Magazines o Films o Chamber of Commerce/Tourism Bureau o Local business people o From a previous trip o Other (please specify___________)
18. What is your gender?
o Male o Female
19. What is your age? ____ 20. Please indicate the highest level of education that you have attained. (check only one)
o Less than high school o High school graduate o Technical school or Associates degree o Bachelor’s degree o Master’s Degree o Ph.D., M.D., J.D., or equivalent
21. What was your employment status during the past year (check all that apply)
o Full-time student o Part-time student o Employed part-time o Employed full-time o Unemployed o Homemaker or caregiver o Retired o Other (please specify________)
22. With which racial group(s) do you identify?
o American Indian or Alaska Native o Latino/Latina o Asian
84
o African American o Native Hawaiian or other Pacific Islander o White
23. Which of the following broad categories best describes your total annual household income for the last calendar year?
o $25,000 or less o $25,001 - $50,000 o $50,001 – $75,000 o $75,001 - $100,000 o $100,001 - $125,000 o $125,001 - $150,000 o More than $150,000
Thank you for helping us with this important study. If there is anything else you would like to tell us, please do so in the space below.
85
INTERVIEW
What drew you to Jerome/Wickenburg?
What elements of a store do you think impact visitors the most?
Why do you think people come to Jerome/Wickenburg?
In what ways do you think the historic ambience of the town affects the tourist’s
experiences?
Do you think that carrying the historic theme into the stores is important? Does it affect
the tourist’s experience?
Have you seen any changes in the town since you have been here (aesthetic changes, new
stores, etc.)? How have they affected tourists?
If you could change one thing in town, what would it be and why?
86
APPENDIX C
SOCIO-DEMOGRAPHICS & TRAVEL BEHAVIOR
87
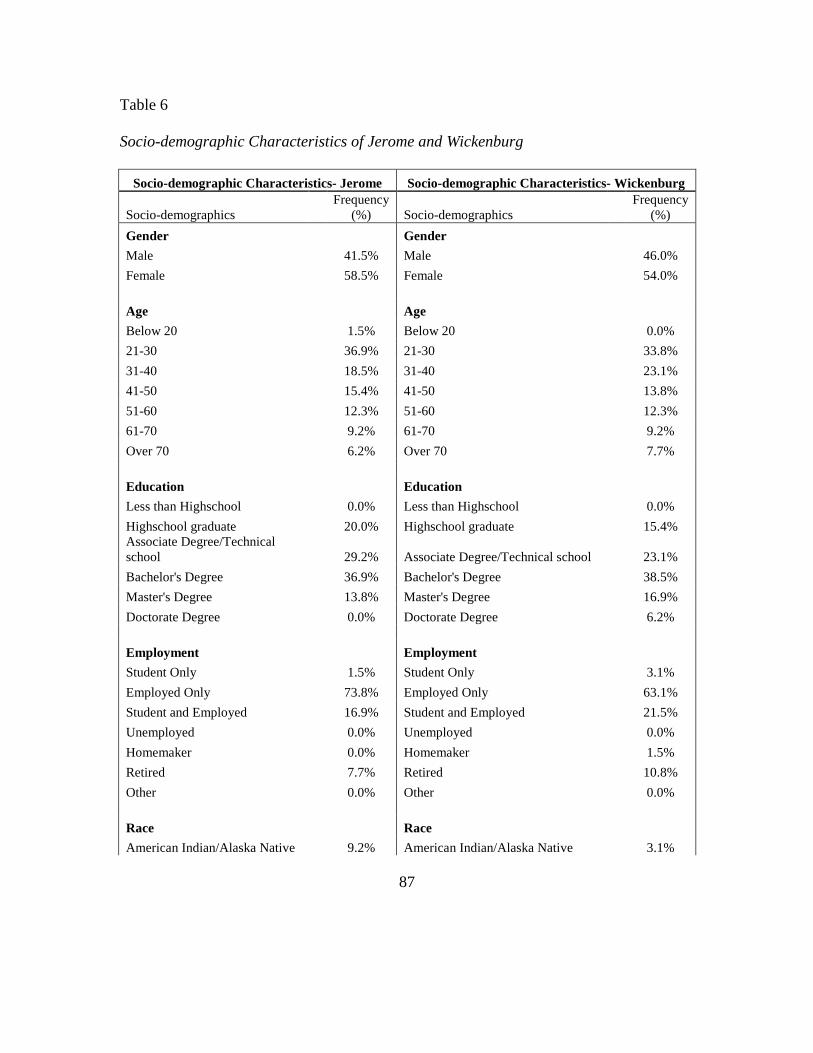
Table 6
Socio-demographic Characteristics of Jerome and Wickenburg
Length of Stay Other 3.1% Less than 1 hour 0.0% 1-3 hours 13.8% Previous Visit 3-5 hours 40.0% Never 46.2% More than 5 hours 27.7% One 23.1% More than 1 day 18.5% Two to three 16.9%
Four to six 7.7% Learned About Jerome Seven or more 6.2% Friends or Relatives 75.4% Films 1.5% Books 35.4% Travel Agent 0.0% Other 3.1%
Likely to Return Very Unlikely 1.5% Unlikely 4.6% Neutral 21.5% Likely 33.8% Very Likely 33.8% Not Sure 4.6%
Main Purpose for Visit
90
Shopping 13.8% Museums 4.6% Art 10.8% Historic Learning/Experience 4.6% Personal/work/school 4.6% Driving through 10.8% Daytrip/Staycation 9.2% Sightseeing 6.2% Winery/Restaurant 9.2% Ghost Town Experience 15.4% Friends/Relatives 6.2% No specific reason 4.6%
1-3 hours 18.5% Previous Visit 3-5 hours 46.2% Never 33.8% More than 5 hours 29.2% One 18.5% More than 1 day 6.2% Two to three 27.7%
Four to six 13.8% Learned About Wickenburg Seven or more 6.2% Friends or Relatives 78.5%
Films 3.1% Books 20.0% Travel Agent 1.5% Other 6.2%
Likely to Return Very Unlikely 3.1% Unlikely 4.6% Neutral 9.2% Likely 43.1%
92
Very Likely 29.2% Not Sure 10.8%
Main Purpose for Visit Shopping 13.8% Museums 7.7% Art 12.3% Historic Learning/Experience 10.8% Personal/work/school 12.3% Driving through 12.3% Daytrip/Staycation 9.2%
Sightseeing 7.7% Winery/Restaurant 3.1% Ghost Town Experience 0.0% Friends/Relatives 3.1% No specific reason 7.7%