The in silico human surfaceome Damaris Bausch-Fluck a,b,1 , Ulrich Goldmann a,1,2 , Sebastian Müller a,3 , Marc van Oostrum a,b , Maik Müller a,b , Olga T. Schubert a,4 , and Bernd Wollscheid a,b,5 a Institute of Molecular Systems Biology at the Department of Biology, ETH Zurich, 8093 Zurich, Switzerland; and b Biomedical Proteomics Platform, Department of Health Sciences and Technology, ETH Zurich, 8093 Zurich, Switzerland Edited by James A. Wells, University of California, San Francisco, CA, and approved October 2, 2018 (received for review May 24, 2018) Cell-surface proteins are of great biomedical importance, as dem- onstrated by the fact that 66% of approved human drugs listed in the DrugBank database target a cell-surface protein. Despite this biomedical relevance, there has been no comprehensive assessment of the human surfaceome, and only a fraction of the predicted 5,000 human transmembrane proteins have been shown to be located at the plasma membrane. To enable analysis of the human surfaceome, we developed the surfaceome predictor SURFY, based on machine learning. As a training set, we used experimentally verified high-confidence cell-surface proteins from the Cell Surface Protein Atlas (CSPA) and trained a random forest classifier on 131 features per protein and, specifically, per topological domain. SURFY was used to predict a human surfaceome of 2,886 proteins with an accuracy of 93.5%, which shows excellent overlap with known cell-surface protein classes (i.e., receptors). In deposited mRNA data, we found that between 543 and 1,100 surfaceome genes were expressed in cancer cell lines and maximally 1,700 surfa- ceome genes were expressed in embryonic stem cells and derivative lines. Thus, the surfaceome diversity depends on cell type and appears to be more dynamic than the nonsurface proteome. To make the predicted surfaceome readily accessible to the research community, we provide visualization tools for intuitive interroga- tion (wlab.ethz.ch/surfaceome). The in silico surfaceome enables the filtering of data generated by multiomics screens and supports the elucidation of the surfaceome nanoscale organization. surfaceome | SURFY | machine learning | cell surface protein | multiomics T he cell surface is the gateway that regulates information transfer from and to the outside world. Proteins at the cell surface connect intracellular and extracellular signaling networks and largely determine a cell’s capacity to communicate and in- teract with its environment. The entirety of all possible cell-surface proteins, the surface proteome or surfaceome, consists of recep- tors, transporters, channels, cell-adhesion proteins, and enzymes and is a source of potential diagnostic biomarkers of disease and therapeutic targets (1). We define the surfaceome as all plasma membrane proteins that have at least one amino acid residue exposed to the extracellular space. As such, the surfaceome is a subset of the plasma membrane proteome, which is a subset of the membrane proteome, the entirety of all membrane proteins. In- tegral monotopic membrane proteins that are attached to the extracellular lipid leaflet [e.g., via a glycosylphosphatidylinositol (GPI) anchor] are part of the human surfaceome, but most of the surfaceome consists of ɑ-helical transmembrane (TM) proteins (Fig. 1A). The bioinformatic differentiation between proteins re- siding in intracellular membranes (i.e., Golgi or endoplasmic re- ticulum), in the plasma membrane, and on the cell surface is not straightforward, and current classifications are mainly based on experimental or functional evidence (Fig. 1B). The lack of an accurate and comprehensive classification of all existing cell- surface proteins impedes their measurement and thereby nega- tively impacts research to better understand their role in biological processes and their clinical potential. Predicting that a protein resides at the cell surface requires (i ) the detection of a TM domain or a lipid anchor; (ii ) the definition of the orientation of a protein within the membrane, including the identification of an extracellular exposed domain; and (iii ) sub- cellular location prediction. (i ) Bioinformatic tools for predicting TM domains, signal peptides, and GPI-linked proteins are avail- able (2–9). (ii ) Prediction of the correct orientation of the protein within the membrane is computationally more challenging, and experimental evidence for TM topologies is scarce, as are atomic- resolution structures of human TM proteins. The Membrane Protein Data Bank (10) lists only 124 human membrane protein structures; this is only 2% of proteins for which structures are known (1). (iii ) Subcellular localization of a protein can to some extent be predicted by computational methods (11). Although multiple tools have been published for generalized subcellular localization prediction (12, 13), only two of these are specific for prediction of the subcellular localization of membrane proteins (14, 15). Both apply machine-learning algorithms, which rely on large training sets. Because of limited experimental data, the training sets used are based on annotations from the Gene On- tology Consortium, which are themselves frequently inferred or predicted (16). Previous attempts to compile a human surfaceome resource (17–19) integrated existing annotation and prediction of Significance Despite the fundamental importance of the surfaceome as a signaling gateway to the cellular microenvironment, it remains difficult to determine which proteoforms reside in the plasma membrane and how they interact to enable context-dependent signaling functions. We applied a machine-learning approach utilizing domain-specific features to develop the accurate sur- faceome predictor SURFY and used it to define the human in silico surfaceome of 2,886 proteins. The in silico surfaceome is a public resource which can be used to filter multiomics data to uncover cellular phenotypes and surfaceome markers. By our domain-specific feature machine-learning approach, we show indirectly that the environment (extracellular, cytoplasm, or vesicle) is reflected in the biochemical properties of protein domains reaching into that environment. Author contributions: D.B.-F., U.G., and B.W. designed research; D.B.-F., U.G., S.M., M.v.O., M.M., O.T.S., and B.W. performed research; D.B.-F., U.G., and B.W. contributed new re- agents/analytic tools; D.B.-F., U.G., S.M., M.v.O., M.M., O.T.S., and B.W. analyzed data; and D.B.-F., U.G., and B.W. wrote the paper. The authors declare no conflict of interest. This article is a PNAS Direct Submission. This open access article is distributed under Creative Commons Attribution-NonCommercial- NoDerivatives License 4.0 (CC BY-NC-ND). Data deposition: Data are available at wlab.ethz.ch/surfaceome. 1 D.B.-F. and U.G. contributed equally to this work. 2 Present address: CeMM Research Center for Molecular Medicine of the Austrian Academy of Sciences, A-1090 Vienna, Austria. 3 Present address: Biognosys, 8952 Schlieren, Switzerland. 4 Present address: Department of Human Genetics, University of California, Los Angeles, CA 90095. 5 To whom correspondence should be addressed. Email: [email protected]. This article contains supporting information online at www.pnas.org/lookup/suppl/doi:10. 1073/pnas.1808790115/-/DCSupplemental. Published online October 29, 2018. E10988–E10997 | PNAS | vol. 115 | no. 46 www.pnas.org/cgi/doi/10.1073/pnas.1808790115 Downloaded by guest on March 25, 2020
Transcript
The in silico human surfaceomeDamaris Bausch-Flucka,b,1, Ulrich Goldmanna,1,2, Sebastian Müllera,3, Marc van Oostruma,b, Maik Müllera,b,Olga T. Schuberta,4, and Bernd Wollscheida,b,5
aInstitute of Molecular Systems Biology at the Department of Biology, ETH Zurich, 8093 Zurich, Switzerland; and bBiomedical Proteomics Platform,Department of Health Sciences and Technology, ETH Zurich, 8093 Zurich, Switzerland
Edited by James A. Wells, University of California, San Francisco, CA, and approved October 2, 2018 (received for review May 24, 2018)
Cell-surface proteins are of great biomedical importance, as dem-onstrated by the fact that 66% of approved human drugs listed inthe DrugBank database target a cell-surface protein. Despite thisbiomedical relevance, there has been no comprehensive assessmentof the human surfaceome, and only a fraction of the predicted5,000 human transmembrane proteins have been shown to belocated at the plasma membrane. To enable analysis of the humansurfaceome, we developed the surfaceome predictor SURFY, basedon machine learning. As a training set, we used experimentallyverified high-confidence cell-surface proteins from the Cell SurfaceProtein Atlas (CSPA) and trained a random forest classifier on131 features per protein and, specifically, per topological domain.SURFY was used to predict a human surfaceome of 2,886 proteinswith an accuracy of 93.5%, which shows excellent overlap withknown cell-surface protein classes (i.e., receptors). In depositedmRNA data, we found that between 543 and 1,100 surfaceomegenes were expressed in cancer cell lines and maximally 1,700 surfa-ceome genes were expressed in embryonic stem cells and derivativelines. Thus, the surfaceome diversity depends on cell type andappears to be more dynamic than the nonsurface proteome. Tomake the predicted surfaceome readily accessible to the researchcommunity, we provide visualization tools for intuitive interroga-tion (wlab.ethz.ch/surfaceome). The in silico surfaceome enables thefiltering of data generated by multiomics screens and supports theelucidation of the surfaceome nanoscale organization.
The cell surface is the gateway that regulates informationtransfer from and to the outside world. Proteins at the cell
surface connect intracellular and extracellular signaling networksand largely determine a cell’s capacity to communicate and in-teract with its environment. The entirety of all possible cell-surfaceproteins, the surface proteome or surfaceome, consists of recep-tors, transporters, channels, cell-adhesion proteins, and enzymesand is a source of potential diagnostic biomarkers of disease andtherapeutic targets (1). We define the surfaceome as all plasmamembrane proteins that have at least one amino acid residueexposed to the extracellular space. As such, the surfaceome is asubset of the plasma membrane proteome, which is a subset of themembrane proteome, the entirety of all membrane proteins. In-tegral monotopic membrane proteins that are attached to theextracellular lipid leaflet [e.g., via a glycosylphosphatidylinositol(GPI) anchor] are part of the human surfaceome, but most of thesurfaceome consists of ɑ-helical transmembrane (TM) proteins(Fig. 1A). The bioinformatic differentiation between proteins re-siding in intracellular membranes (i.e., Golgi or endoplasmic re-ticulum), in the plasma membrane, and on the cell surface is notstraightforward, and current classifications are mainly based onexperimental or functional evidence (Fig. 1B). The lack of anaccurate and comprehensive classification of all existing cell-surface proteins impedes their measurement and thereby nega-tively impacts research to better understand their role in biologicalprocesses and their clinical potential.Predicting that a protein resides at the cell surface requires (i)
the detection of a TM domain or a lipid anchor; (ii) the definitionof the orientation of a protein within the membrane, including the
identification of an extracellular exposed domain; and (iii) sub-cellular location prediction. (i) Bioinformatic tools for predictingTM domains, signal peptides, and GPI-linked proteins are avail-able (2–9). (ii) Prediction of the correct orientation of the proteinwithin the membrane is computationally more challenging, andexperimental evidence for TM topologies is scarce, as are atomic-resolution structures of human TM proteins. The MembraneProtein Data Bank (10) lists only 124 human membrane proteinstructures; this is only 2% of proteins for which structures areknown (1). (iii) Subcellular localization of a protein can to someextent be predicted by computational methods (11). Althoughmultiple tools have been published for generalized subcellularlocalization prediction (12, 13), only two of these are specific forprediction of the subcellular localization of membrane proteins(14, 15). Both apply machine-learning algorithms, which rely onlarge training sets. Because of limited experimental data, thetraining sets used are based on annotations from the Gene On-tology Consortium, which are themselves frequently inferred orpredicted (16). Previous attempts to compile a human surfaceomeresource (17–19) integrated existing annotation and prediction of
Significance
Despite the fundamental importance of the surfaceome as asignaling gateway to the cellular microenvironment, it remainsdifficult to determine which proteoforms reside in the plasmamembrane and how they interact to enable context-dependentsignaling functions. We applied a machine-learning approachutilizing domain-specific features to develop the accurate sur-faceome predictor SURFY and used it to define the human insilico surfaceome of 2,886 proteins. The in silico surfaceome is apublic resource which can be used to filter multiomics data touncover cellular phenotypes and surfaceome markers. By ourdomain-specific feature machine-learning approach, we showindirectly that the environment (extracellular, cytoplasm, orvesicle) is reflected in the biochemical properties of proteindomains reaching into that environment.
Author contributions: D.B.-F., U.G., and B.W. designed research; D.B.-F., U.G., S.M., M.v.O.,M.M., O.T.S., and B.W. performed research; D.B.-F., U.G., and B.W. contributed new re-agents/analytic tools; D.B.-F., U.G., S.M., M.v.O., M.M., O.T.S., and B.W. analyzed data; andD.B.-F., U.G., and B.W. wrote the paper.
The authors declare no conflict of interest.
This article is a PNAS Direct Submission.
This open access article is distributed under Creative Commons Attribution-NonCommercial-NoDerivatives License 4.0 (CC BY-NC-ND).
Data deposition: Data are available at wlab.ethz.ch/surfaceome.1D.B.-F. and U.G. contributed equally to this work.2Present address: CeMM Research Center for Molecular Medicine of the Austrian Academyof Sciences, A-1090 Vienna, Austria.
3Present address: Biognosys, 8952 Schlieren, Switzerland.4Present address: Department of Human Genetics, University of California, Los Angeles,CA 90095.
5To whom correspondence should be addressed. Email: [email protected].
This article contains supporting information online at www.pnas.org/lookup/suppl/doi:10.1073/pnas.1808790115/-/DCSupplemental.
TM domains and signal peptides, but did not make use of thelatest experimental techniques or computational modeling.The experimental assessment of the surfaceome is complicated
by the hydrophobic nature of TM domains and the low abundanceof cell-surface proteins compared with intracellular proteins. Toovercome these hurdles, we previously developed the Cell SurfaceCapture (CSC) technology (20) that allows large-scale and highlyspecific identification and quantification of glycosylated cell-surface-residing proteins. The steps of the chemoproteomic CSCstrategy are highly specific chemical labeling of cell-surface pro-teins on living cells, subsequent purification of N-glycosylatedpeptides, and mass-spectrometric identification of extracellularlyexposed glycopeptides and their parent cell-surface proteins (21–33). By using this CSC strategy, an extensive experimental resourceon cell-surface-residing and extracellularly exposed proteins wasconstructed. The Cell Surface Protein Atlas (CSPA; wlab.ethz.ch/cspa/) is a public resource which contains experimental evidencefor cell-surface proteins identified in 41 human cell types (34).
Although the CSPA is an extensive biomedical resource, it onlyspans a limited number of cell types and cellular-activation stagesand is therefore unlikely to encompass all possible human surfa-ceome members. To obtain a comprehensive picture of the humansurfaceome, we set out to complement the experimental resourceusing computational prediction. Here, we present the machine-learning-based predictor SURFY, which leverages the CSPA asthe necessary basis for a high-quality training dataset. Machine-learning algorithms enable pattern recognition, classification, andprediction based on models derived from existing data (35). Ap-plied to the human proteome, SURFY predicted that the humansurfaceome includes 2,886 proteins across all human cell types anddevelopmental stages. The predicted set has excellent overlap withexisting annotation of bona fide cell-surface proteins, with 99% ofCluster of Differentiation (CD) proteins included.To understand the surfaceome variability between different
cell types, gene-expression profiles from two independent data-sets were analyzed according to our in silico surfaceome. From
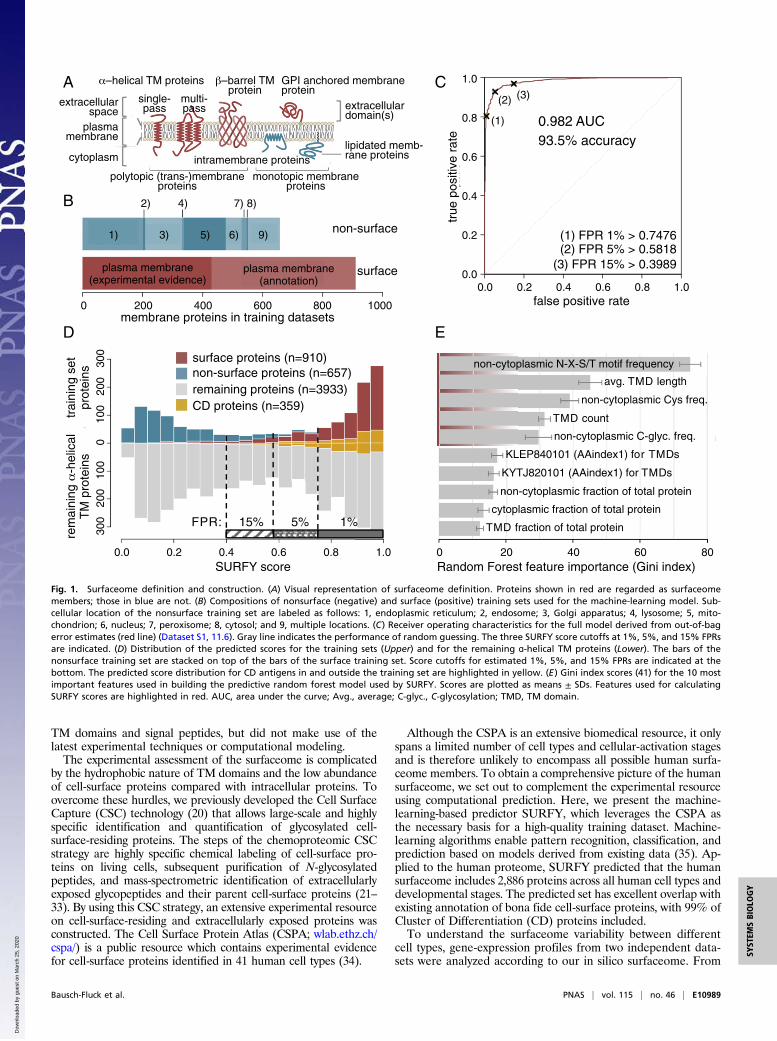
Fig. 1. Surfaceome definition and construction. (A) Visual representation of surfaceome definition. Proteins shown in red are regarded as surfaceomemembers; those in blue are not. (B) Compositions of nonsurface (negative) and surface (positive) training sets used for the machine-learning model. Sub-cellular location of the nonsurface training set are labeled as follows: 1, endoplasmic reticulum; 2, endosome; 3, Golgi apparatus; 4, lysosome; 5, mito-chondrion; 6, nucleus; 7, peroxisome; 8, cytosol; and 9, multiple locations. (C) Receiver operating characteristics for the full model derived from out-of-bagerror estimates (red line) (Dataset S1, 11.6). Gray line indicates the performance of random guessing. The three SURFY score cutoffs at 1%, 5%, and 15% FPRsare indicated. (D) Distribution of the predicted scores for the training sets (Upper) and for the remaining ɑ-helical TM proteins (Lower). The bars of thenonsurface training set are stacked on top of the bars of the surface training set. Score cutoffs for estimated 1%, 5%, and 15% FPRs are indicated at thebottom. The predicted score distribution for CD antigens in and outside the training set are highlighted in yellow. (E) Gini index scores (41) for the 10 mostimportant features used in building the predictive random forest model used by SURFY. Scores are plotted as means ± SDs. Features used for calculatingSURFY scores are highlighted in red. AUC, area under the curve; Avg., average; C-glyc., C-glycosylation; TMD, TM domain.
these analyses, we identified a set of housekeeping surfaceomeproteins. We also demonstrated that the surfaceome can beapplied to narrow down large datasets for defining candidatesets for further validation, which ultimately leads to relevanttherapeutic targets.In summary, our surfaceome predictor SURFY enabled de novo
prediction of surfaceome proteins. The in silico surfaceome is aunique public resource that, when combined with cell-type-specificexpression data, can be used for phenotyping of cells guidingsubsequent antibody development against prequalified targets andthat will serve as a hypothesis generator for more targeted analysesby single-cell proteotype analysis by mass or flow cytometry or bygenetically barcoded antibodies called phage-antibody next-generationsequencing (PhaNGS; ref. 36). The in silico surfaceome will allowunprecedented exploration of the surfaceome landscape within andacross human cell-type populations.
ResultsTraining Sets and Protein Topology Assessment for SurfaceomePrediction. Since the milieu in the extracellular space and in thecytoplasm differ in pH, redox state, and interaction partners, wehypothesized that this should be reflected in different biochemicalproperties of extracellular, TM, and intracellular domains ofmembrane proteins, which could inform a machine-learning ap-proach to discriminate between intracellular membrane and cell-surface-residing proteins. To calculate domain-specific featuresfor the machine-learning algorithm, we first needed to definethese domains. The TM topology is defined by a protein’s TMdomains, its orientation within the membrane, and locations ofadditional membrane attachment sites, if present (Fig. 1A). In ahierarchical approach, we combined topology information pro-vided by the CSPA in the form of noncytoplasmic identification ofN-glycopeptides for 1,309 proteins, by UniProt in the form of TMdomain annotations for 4,471 proteins, and by prediction usingPhobius (7) for 2,123 proteins. This yielded complete topologiesfor 7,903 human proteins, of which there were 5,500 ɑ-helical TMproteins, two β-barrel proteins, 12 proteins with intramembraneloops, and 2,389 proteins with a signal peptide but no TM domain.As only a small fraction of the proteins with just a signal peptideare expected to be membrane-anchored by some other means (e.g.,lipidation), we focused our machine-learning approach on theɑ-helical TM proteins. The exact borders of all ɑ-helical TM re-gions were reassessed by using Phobius (7). The ɑ-helical TMdomains of our final topologies were on average 21.9 ± 2.3 resi-dues (mean ± SD) in length.
Development of the Surfaceome Predictor SURFY.Machine-learningclassification requires a numerical representation of the objectsto be classified and negative and positive training sets. In con-trast to previous approaches for subcellular localization pre-diction, we calculated most protein features individually for eachtopological domain (noncytoplasmic, cytoplasmic, signal peptide,and TM domain). We selected the following sequence-, anno-tation-, and prediction-based features to represent each protein:number, average length, and relative fraction of ɑ-helical TMregions and signal peptides; frequencies of each of the 20 aminoacids; four carefully selected physicochemical properties fromAAindex1 (37); frequency of N-glycosylation consensus sequencemotifs (N-X-S/T); predicted numbers of C-, N-, and O-linkedglycosylation sites [GlycoMine (38)]; and 12 selected UniProtfeatures annotating functional domains such as EGF-like do-mains or protein kinase domains. Details of the selected featuresfrom AAindex1 and UniProt are discussed in Methods. The finalfeature matrix consisted of 131 numerical features for each ofthe 7,903 proteins. The positive and negative training sets(910 and 657 proteins, respectively; Dataset S1, 11.1 and 11.2)were composed of data from the CSPA and other annotationresources (Fig. 1B and SI Appendix, Fig. S1) and were generated
as described in Methods. The training sets were used to build arandom forest model that showed a predictive accuracy of 93.5%(Fig. 1C).Once trained, we used SURFY to calculate surface scores for
the 5,500 ɑ-helical TM proteins (Dataset S1, 11.3). The surface-score distribution showed a clear bimodal appearance, suggest-ing that the model successfully captured features that distinguishsurface from nonsurface proteins (Fig. 1D). Feature importancewas assessed by using the Gini index (39) and revealed fivefeatures to be most important (Fig. 1E and Dataset S1, 11.4 and11.5). The frequency of noncytoplasmic N-X-S/T motifs was byfar the most discriminative feature. Furthermore, the length andnumber of TM domains (Figs. 1E and 2 A and B), the frequencyof noncytoplasmic cysteines, and the frequency of predictednoncytoplasmic C-glycosylation sites substantially influenced thesurfaceome score calculated by SURFY.
Human Surfaceome Predicted by SURFY. To define the proteinsbelonging to the surfaceome, we compared datasets at differentestimated false positive rates (FPRs) of 1%, 5%, and 15% (Fig.1C); sensitivities of 96.9%, 92.7%, and 80.7% were obtained forthe 2,242; 2,756; and 3,284 proteins, respectively. We choose thesurfaceome with a 5% FPR as the representative human surfa-ceome (SURFY scores > 0.5818), as this dataset balanced sen-sitivity and specificity. In addition, 130 annotated GPI-linkedhuman proteins (UniProt keyword: GPI-anchor) that do nothave TM domains were included, resulting in a total surfaceomeset of 2,886 human proteins (Dataset S1, 11.7). The non-surfaceome set consisted of the 689 proteins from the negativetraining set and another 1,527 proteins with low SURFY scores(scores < 0.3989; 2,216 proteins in total). The 528 proteins withmidrange scores (0.3989 < score < 0.5818) were consideredborderline cases and were not included in further analyses. Thesurfaceome set contained 99% of all CD proteins (Fig. 1D),supporting the validity of the surfaceome prediction. Distribu-tions of the SURFY scores assigned to other protein classes suchas receptors and enzymes are plotted in SI Appendix, Fig. S2. Themodel was also applied to analyze the 2,403 proteins without ɑ-helical TM domains, including the 130 proteins with GPI an-chors (SI Appendix, Fig. S3), but predictions for these additionalclasses of proteins, most of them presumably secreted, should beconsidered speculative.
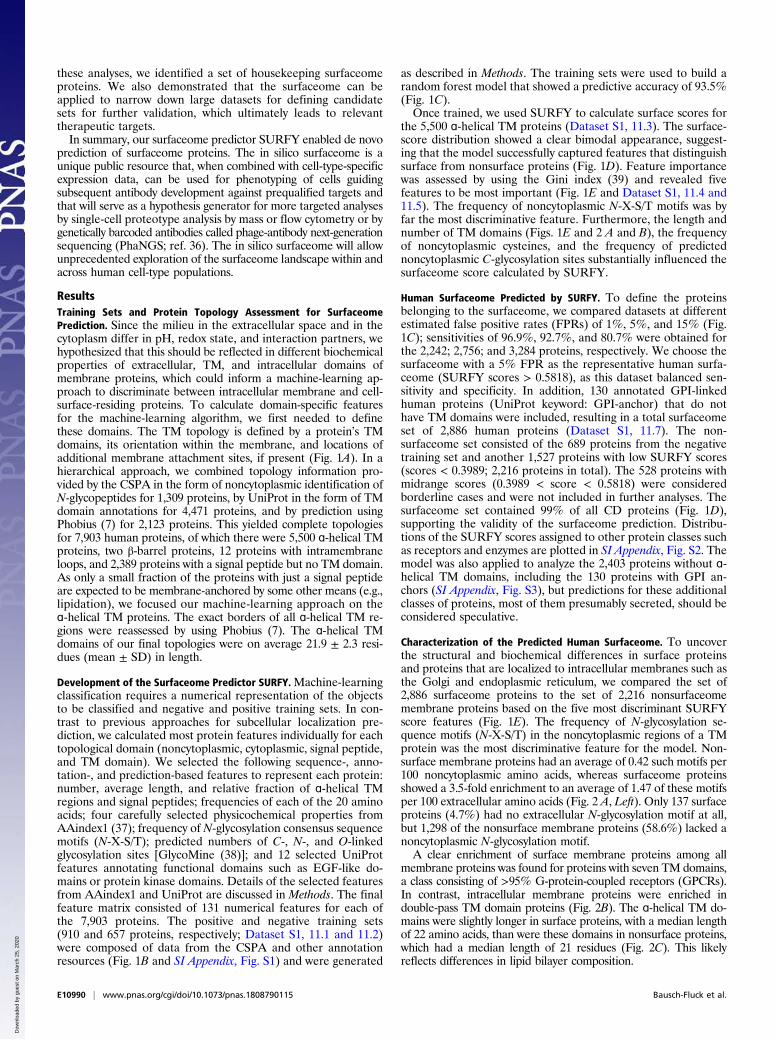
Characterization of the Predicted Human Surfaceome. To uncoverthe structural and biochemical differences in surface proteinsand proteins that are localized to intracellular membranes such asthe Golgi and endoplasmic reticulum, we compared the set of2,886 surfaceome proteins to the set of 2,216 nonsurfaceomemembrane proteins based on the five most discriminant SURFYscore features (Fig. 1E). The frequency of N-glycosylation se-quence motifs (N-X-S/T) in the noncytoplasmic regions of a TMprotein was the most discriminative feature for the model. Non-surface membrane proteins had an average of 0.42 such motifs per100 noncytoplasmic amino acids, whereas surfaceome proteinsshowed a 3.5-fold enrichment to an average of 1.47 of these motifsper 100 extracellular amino acids (Fig. 2 A, Left). Only 137 surfaceproteins (4.7%) had no extracellular N-glycosylation motif at all,but 1,298 of the nonsurface membrane proteins (58.6%) lacked anoncytoplasmic N-glycosylation motif.A clear enrichment of surface membrane proteins among all
membrane proteins was found for proteins with seven TM domains,a class consisting of >95% G-protein-coupled receptors (GPCRs).In contrast, intracellular membrane proteins were enriched indouble-pass TM domain proteins (Fig. 2B). The ɑ-helical TM do-mains were slightly longer in surface proteins, with a median lengthof 22 amino acids, than were these domains in nonsurface proteins,which had a median length of 21 residues (Fig. 2C). This likelyreflects differences in lipid bilayer composition.
E10990 | www.pnas.org/cgi/doi/10.1073/pnas.1808790115 Bausch-Fluck et al.
Fig. 2. Characterization of the predicted surfaceome. (A–C) Comparison of 2,886 surfaceome proteins in red, with 2,216 nonsurfaceome membrane proteinsin blue. (A) Distributions of sequence features in noncytoplasmic domains of surfaceome (upper graphs) and nonsurfaceome membrane (lower graphs)proteins, calculated as frequency per 100 amino acids. A, Left shows the distribution of numbers of N-glycosylation sequence motifs (N-X-S/T) per 100 aminoacids. Proteins with more than five motifs were excluded from this graph. A, Center shows the distribution of numbers of C-glycosylation sites per 100 aminoacids predicted by using GlycoMine. Proteins with more than four predicted sites were excluded. A, Right shows the distribution of numbers of cysteineresidues per 100 amino acids. Proteins with >10 cysteines were excluded. (B) Distribution of the number of ɑ-helical TM domains per protein. The pie chartshows the proportion of GPCRs within the set of surface proteins with seven TM domains (red bar). (C) Distribution of the length of ɑ-helical TM domains. (D)Classification of surface and nonsurface proteins into functional classes. *P < 10−2. Functional classes are numbered as follows: 1, GPCRs; 2, receptor-typetyrosine kinases; 3, receptors of the Ig superfamily; 4, scavenger receptors; 5, other receptors; 6, channels; 7, solute carrier superfamily; 8, active transporters;9, auxiliary transport proteins; 10, other transporters; 11, oxidoreductases; 12, transferases; 13, hydrolases; 14, lyases; 15, isomerases; 16, ligases; 17, structure/adhesion proteins; 18, ligand proteins; and 19, proteins of unknown function. (E) Overlap of proteins of the human surfaceome annotated in UniProt,predicted by YLoc (13), predicted by da Cunha et al. (17), and predicted by SURFY. (F) Protter image of human MEGF9. N-X-S/T motifs are marked in light blue,with the corresponding asparagine (N) in dark blue. CSC identified peptides are marked in purple. (G) Half-life distributions of surfaceome proteins, tran-scription factors (TF), and all quantified proteins from Mathieson et al. (45). Misc., miscellaneous.
C-linked mannosylation sites predicted by GlycoMine appearedalmost exclusively in the noncytoplasmic regions of surfaceomeproteins (Fig. 2 A, Center). Surface proteins also showed a twofoldenrichment in cysteine, with 3.38% cysteines in their extracellulardomains compared with 1.72% cysteines in nonsurface proteins(Fig. 2 A, Right). The compositions of intracellular domains ofsurface proteins resembled those of the intracellular domains ofnonsurface proteins with respect to the features analyzed, especiallyin the frequency of N-glycosylation sequence motifs, predicted C-glycosylation sites, and cysteine frequency. This observation couldhelp increase performance of TM topology prediction tools inprediction of the orientation of plasma membrane proteins (40).The functional classification showed that receptors and ligand
proteins were assigned nearly exclusively by SURFY to the sur-faceome set (Fig. 2D and Dataset S1, 11.7). This demonstrates theaccuracy of the SURFY-predicted surfaceome. Other functionalclasses are evenly distributed among different cellular membranestructures (e.g., transporters). Some are more prominent amongintracellular membrane proteins (e.g., enzymes).
Characteristics of Previously Unclassified Surface Proteins. The pre-dicted human surfaceome showed good overlap with currentsubcellular localization annotation resources [UniProt keyword“cell membrane,” YLoc subcellular localization prediction (13),and the bioinformatic surfaceome of da Cunha et al. (17)], with1,223 proteins appearing in all four surfaceome lists (Fig. 2E).Proteins with a cell membrane annotation in UniProt, but notpresent in our surfaceome (1,480 proteins), are mostly proteinsthat are attached or integrated into the plasma membrane fromthe intracellular side that do not have an extracellularly exposedamino acid. By our definition, these proteins do not belong to thesurfaceome and contain, for example, Ras/Rho-related proteins orphosphatidylinositol phosphate kinases. Conversely, a large ma-jority of the surfaceome proteins identified by SURFY that haveno cell membrane annotation are simply annotated in UniProt as“membrane” without further specification. YLoc is a machine-learning approach for the prediction of subcellular location (13)that does not consider features in a topological domain-specificmanner, which we found was critical. The bioinformatic surfa-ceome of da Cunha et al. (17) solely relies on Gene Ontologyannotations and shows limited accuracy for cell-surface proteins.Among the 142 proteins exclusively present in our surfaceome,
49 proteins belong to the family of HLA class I histocompatibilityantigens, and 26 proteins were identified in the CSPA. For67 proteins predicted by SURFY to be cell-surface proteins, thereis no evidence for cell-surface localization in UniProt, YLoc, orthe da Cunha surfaceome. As a proof-of-concept study, we vali-dated proteins, for which antibodies were available, by immuno-fluorescence, flow cytometry (SI Appendix, Fig. S4), and also adeep-coverage CSC experiment (Fig. 2F and Dataset S1, 11.8).Most of these proteins are not well characterized; however, wefound some additional proteins, to be present in the Cell Atlas ofthe Human Protein Atlas data and in recent publications,confirming cell-surface localization (41–43) (Dataset S1, 11.9).These lines of evidence underscore the value of our computa-tional approach to identify previously uncharacterized cell-surface proteins.
Surfaceome Proteostasis. Protein stability varies widely amongproteins in a cell, and a global assessment of gene-expressioncontrol revealed that cell-surface proteins have rather stablemRNAs but high protein turnover rates (44). In a recentlypublished dataset with protein turnover rates for surfaceomeproteins (45), we found half-lives for ∼300 surfaceome members.A comparison of the half-lives of surfaceome proteins to those oftranscription factors or to all proteins measured revealed sig-nificantly lower half-lives for the surfaceome proteins (Fig. 2G).The set of 300 surface proteins for which data were available
represents only 10% of the surfaceome, but their higher turnoverrates are in line with the findings of Schwanhäusser et al. (44)and support the hypothesis that high surfaceome turnover ratesreflect the cellular ability to react quickly to extracellular stimuli.
Cell-Surface Phenotyping Using Transcriptome Data. The availabilityof our predicted surfaceome set enables analyses of surfaceomesacross cell types and states. Even though quantitative proteomicdata can provide information about the actual abundance of aprotein of interest in a specific subcellular location, the high dy-namic range of protein abundances typically hinders the identifi-cation of low-abundance proteins (46). Transcriptome data aremore likely to include genes expressed at low levels due to the PCRamplification step and could therefore provide a blueprint of sur-faceome candidates present in a specific cell type that could then beinvestigated further by more sensitive targeted proteomics methodssuch as selected reaction monitoring/parallel reaction monitoring(PRM) (47) and/or untargeted data-independent acquisition (DIA)of all theoretical fragment ion spectra mass spectrometry analyses(48) or biochemical methods.To assess the overall variability of surfaceome across different
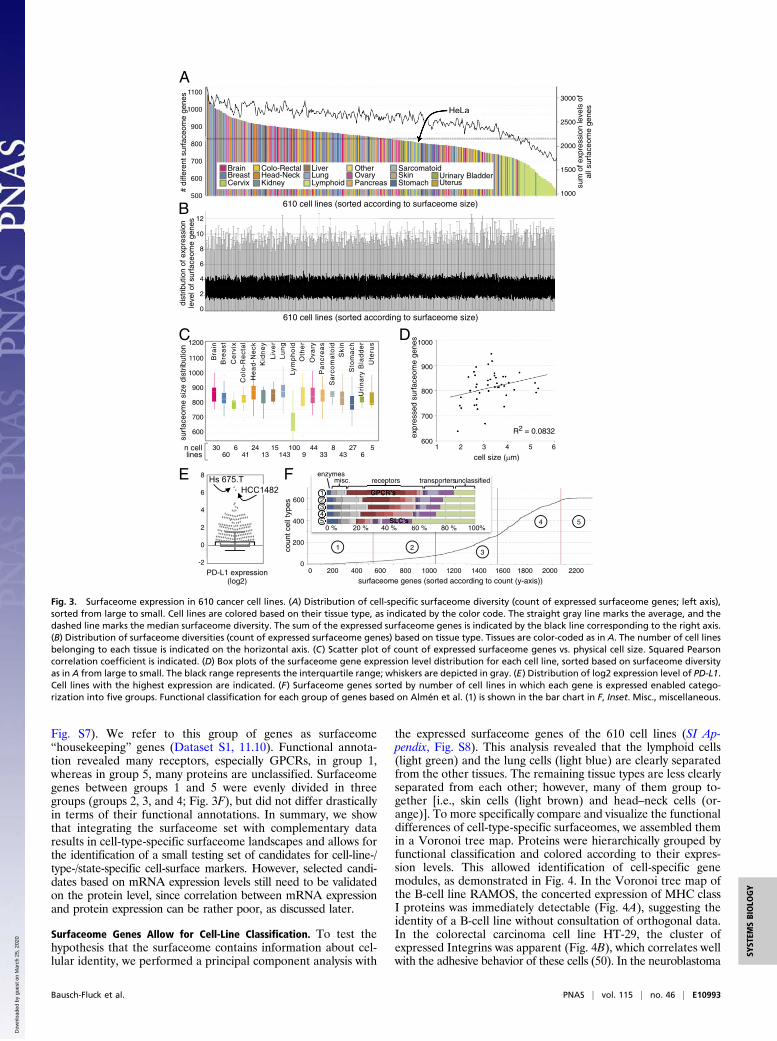
cell types, we matched the surfaceome with transcriptome datafrom 610 cancer cell lines (49). We found that 2,331 surfaceomegenes (of 2,704 matched IDs) were expressed in at least one cellline. Of the 373 surfaceome genes (13%) that were not expressedin any of these cell lines, the majority (297) encode olfactoryreceptors. The number of surfaceome genes expressed in indi-vidual cell lines ranged from 543 to 1,100 (Fig. 3A). The numberof CD genes expressed varied from 74 to 196. Interestingly,lymphoid cells had a substantially less diverse surfaceome ex-pression profile than cells from other tissues (Fig. 3 A and C).Lung and neuronal cells were among the cell types with the mostdiverse surfaceome profiles. The size of the surfaceome wascorrelated with the sum of expression levels of all surfaceomegenes (Fig. 3A), even though the sum of all expressed genes wasrather constant across cell lines (SI Appendix, Fig. S5). There wasnot a significant correlation between the size of the surfaceomeand the physical size of the cell (Fig. 3D). Notably, the distri-bution of expression levels of surfaceome genes per cell line wasrelatively constant (Fig. 3B). This means that, independent of thesize of the surfaceome (i.e., the number of different surfaceomegenes expressed) (Fig. 3A), the median amount of mRNA mol-ecules encoding for surfaceome genes stayed constant (Fig. 3B).It should be noted that gene expression numbers do not neces-sarily translate into quantity of protein at the cell surface due tocoexisting intracellular protein pools. Nevertheless, single genescan vary substantially in their gene expression level from cell lineto cell line, as exemplified by PD-L1 (Fig. 3E).To investigate how specific the expression of cell-surface
proteins is to individual cell types, we counted for each surfa-ceome member in how many different cell lines it was expressed.The occurrence of expressed surfaceome genes over the 610 celllines showed a sigmoidal shape, with many genes only expressedin one cell line (23%; 500 genes) and only 10% of genesexpressed in every cell line (240 genes) (Fig. 3F and Dataset S1,11.10). This distribution pattern shows that the surfaceome ishighly cell-line-specific, even compared with other gene sets thatare thought to be cell-type specific. For example, 44% of tran-scription factors are expressed in each of the 610 cell lines (SIAppendix, Fig. S6). To investigate functional differences betweenubiquitously expressed and cell-type-specific expressed genes, wegrouped them based on frequency of expression across the celllines evaluated (Fig. 3F and Dataset S1, 11.10). Group 1 hasrelatively low median gene expression levels (0.77 log2 RPKME;SI Appendix, Fig. S7), but, if proteins are detectable at the cellsurface, these proteins could serve as cellular markers. Group5 genes are expressed in most cell lines (Fig. 3F) and are gen-erally more strongly expressed (4.14 log2 RPKME; SI Appendix,
E10992 | www.pnas.org/cgi/doi/10.1073/pnas.1808790115 Bausch-Fluck et al.
Fig. S7). We refer to this group of genes as surfaceome“housekeeping” genes (Dataset S1, 11.10). Functional annota-tion revealed many receptors, especially GPCRs, in group 1,whereas in group 5, many proteins are unclassified. Surfaceomegenes between groups 1 and 5 were evenly divided in threegroups (groups 2, 3, and 4; Fig. 3F), but did not differ drasticallyin terms of their functional annotations. In summary, we showthat integrating the surfaceome set with complementary dataresults in cell-type-specific surfaceome landscapes and allows forthe identification of a small testing set of candidates for cell-line-/type-/state-specific cell-surface markers. However, selected candi-dates based on mRNA expression levels still need to be validatedon the protein level, since correlation between mRNA expressionand protein expression can be rather poor, as discussed later.
Surfaceome Genes Allow for Cell-Line Classification. To test thehypothesis that the surfaceome contains information about cel-lular identity, we performed a principal component analysis with
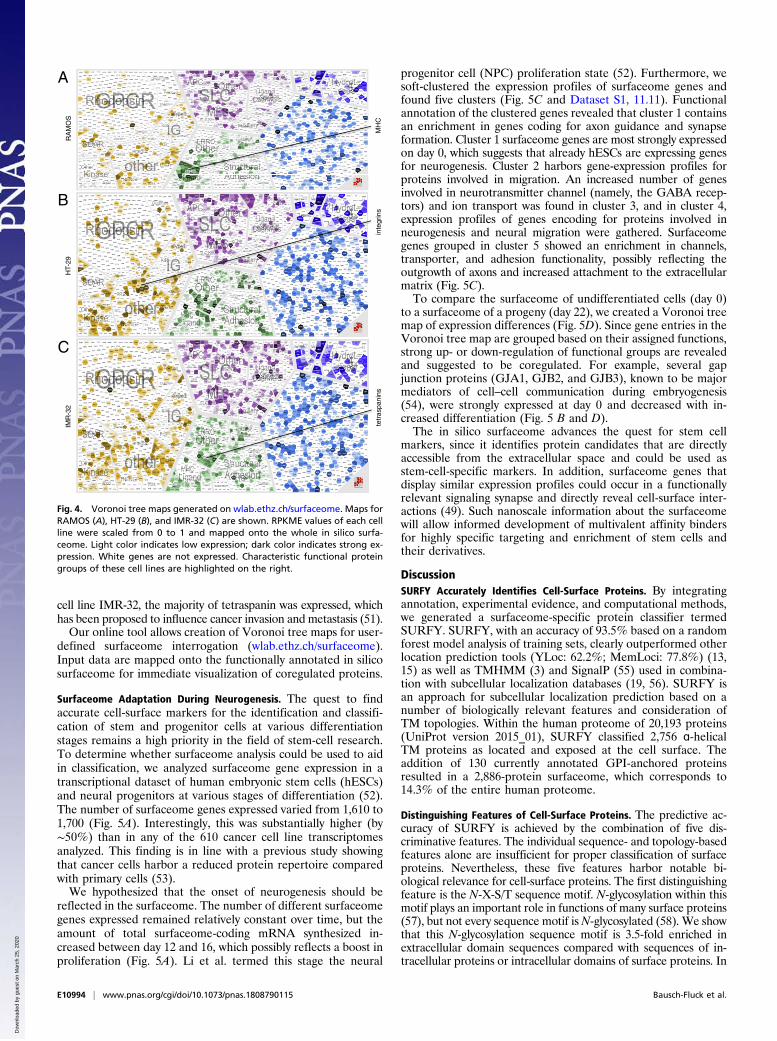
the expressed surfaceome genes of the 610 cell lines (SI Ap-pendix, Fig. S8). This analysis revealed that the lymphoid cells(light green) and the lung cells (light blue) are clearly separatedfrom the other tissues. The remaining tissue types are less clearlyseparated from each other; however, many of them group to-gether [i.e., skin cells (light brown) and head–neck cells (or-ange)]. To more specifically compare and visualize the functionaldifferences of cell-type-specific surfaceomes, we assembled themin a Voronoi tree map. Proteins were hierarchically grouped byfunctional classification and colored according to their expres-sion levels. This allowed identification of cell-specific genemodules, as demonstrated in Fig. 4. In the Voronoi tree map ofthe B-cell line RAMOS, the concerted expression of MHC classI proteins was immediately detectable (Fig. 4A), suggesting theidentity of a B-cell line without consultation of orthogonal data.In the colorectal carcinoma cell line HT-29, the cluster ofexpressed Integrins was apparent (Fig. 4B), which correlates wellwith the adhesive behavior of these cells (50). In the neuroblastoma
A
F
600 800 1000 1200 1400 1600 1800 2000 22004002000
200
400
600
0
23
4
1
5
coun
t cel
l typ
es
surfaceome genes (sorted according to count (y-axis))
Fig. 3. Surfaceome expression in 610 cancer cell lines. (A) Distribution of cell-specific surfaceome diversity (count of expressed surfaceome genes; left axis),sorted from large to small. Cell lines are colored based on their tissue type, as indicated by the color code. The straight gray line marks the average, and thedashed line marks the median surfaceome diversity. The sum of the expressed surfaceome genes is indicated by the black line corresponding to the right axis.(B) Distribution of surfaceome diversities (count of expressed surfaceome genes) based on tissue type. Tissues are color-coded as in A. The number of cell linesbelonging to each tissue is indicated on the horizontal axis. (C) Scatter plot of count of expressed surfaceome genes vs. physical cell size. Squared Pearsoncorrelation coefficient is indicated. (D) Box plots of the surfaceome gene expression level distribution for each cell line, sorted based on surfaceome diversityas in A from large to small. The black range represents the interquartile range; whiskers are depicted in gray. (E) Distribution of log2 expression level of PD-L1.Cell lines with the highest expression are indicated. (F) Surfaceome genes sorted by number of cell lines in which each gene is expressed enabled catego-rization into five groups. Functional classification for each group of genes based on Almén et al. (1) is shown in the bar chart in F, Inset. Misc., miscellaneous.
cell line IMR-32, the majority of tetraspanin was expressed, whichhas been proposed to influence cancer invasion and metastasis (51).Our online tool allows creation of Voronoi tree maps for user-
defined surfaceome interrogation (wlab.ethz.ch/surfaceome).Input data are mapped onto the functionally annotated in silicosurfaceome for immediate visualization of coregulated proteins.
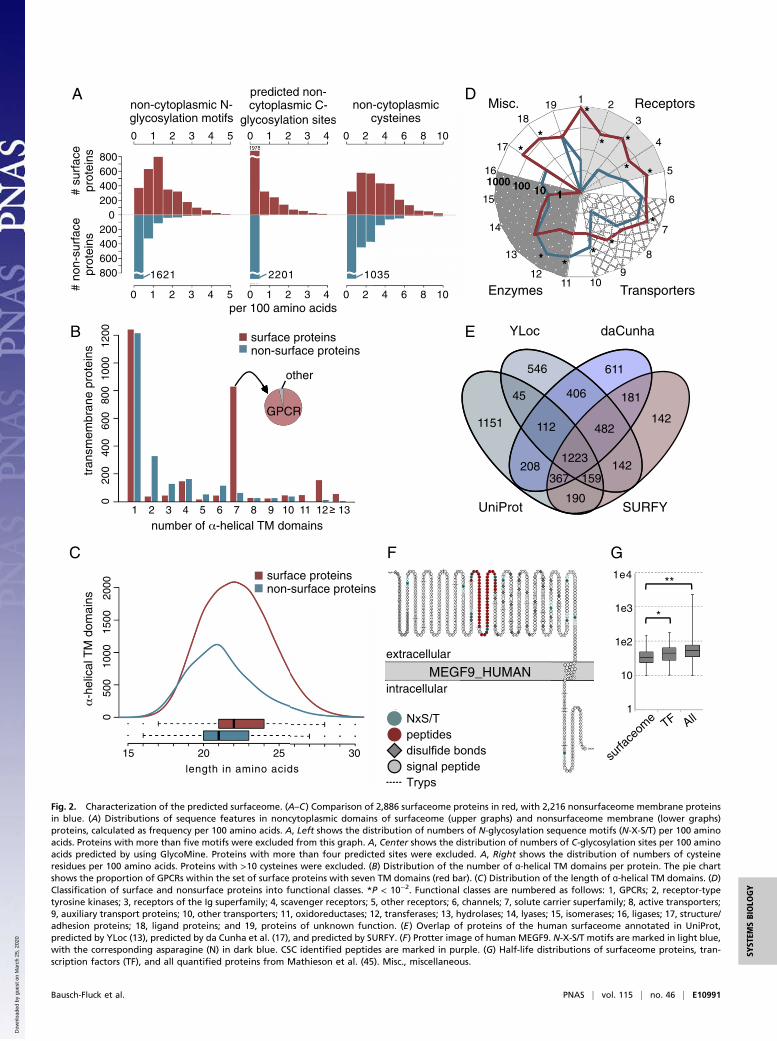
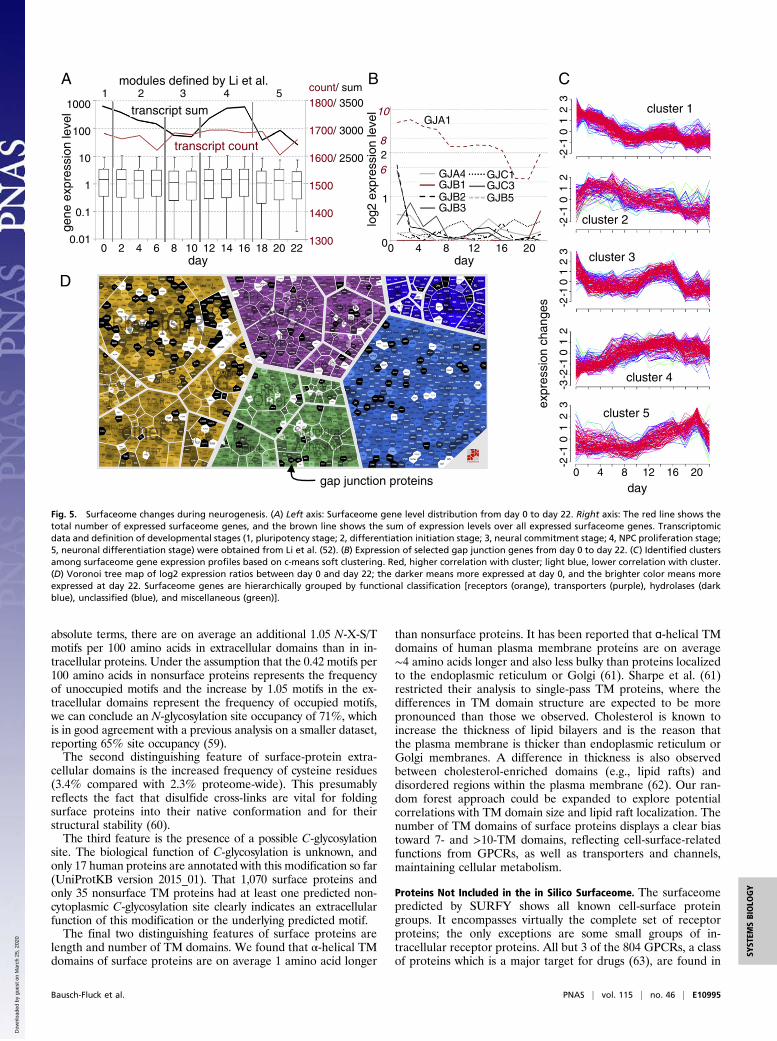
Surfaceome Adaptation During Neurogenesis. The quest to findaccurate cell-surface markers for the identification and classifi-cation of stem and progenitor cells at various differentiationstages remains a high priority in the field of stem-cell research.To determine whether surfaceome analysis could be used to aidin classification, we analyzed surfaceome gene expression in atranscriptional dataset of human embryonic stem cells (hESCs)and neural progenitors at various stages of differentiation (52).The number of surfaceome genes expressed varied from 1,610 to1,700 (Fig. 5A). Interestingly, this was substantially higher (by∼50%) than in any of the 610 cancer cell line transcriptomesanalyzed. This finding is in line with a previous study showingthat cancer cells harbor a reduced protein repertoire comparedwith primary cells (53).We hypothesized that the onset of neurogenesis should be
reflected in the surfaceome. The number of different surfaceomegenes expressed remained relatively constant over time, but theamount of total surfaceome-coding mRNA synthesized in-creased between day 12 and 16, which possibly reflects a boost inproliferation (Fig. 5A). Li et al. termed this stage the neural
progenitor cell (NPC) proliferation state (52). Furthermore, wesoft-clustered the expression profiles of surfaceome genes andfound five clusters (Fig. 5C and Dataset S1, 11.11). Functionalannotation of the clustered genes revealed that cluster 1 containsan enrichment in genes coding for axon guidance and synapseformation. Cluster 1 surfaceome genes are most strongly expressedon day 0, which suggests that already hESCs are expressing genesfor neurogenesis. Cluster 2 harbors gene-expression profiles forproteins involved in migration. An increased number of genesinvolved in neurotransmitter channel (namely, the GABA recep-tors) and ion transport was found in cluster 3, and in cluster 4,expression profiles of genes encoding for proteins involved inneurogenesis and neural migration were gathered. Surfaceomegenes grouped in cluster 5 showed an enrichment in channels,transporter, and adhesion functionality, possibly reflecting theoutgrowth of axons and increased attachment to the extracellularmatrix (Fig. 5C).To compare the surfaceome of undifferentiated cells (day 0)
to a surfaceome of a progeny (day 22), we created a Voronoi treemap of expression differences (Fig. 5D). Since gene entries in theVoronoi tree map are grouped based on their assigned functions,strong up- or down-regulation of functional groups are revealedand suggested to be coregulated. For example, several gapjunction proteins (GJA1, GJB2, and GJB3), known to be majormediators of cell–cell communication during embryogenesis(54), were strongly expressed at day 0 and decreased with in-creased differentiation (Fig. 5 B and D).The in silico surfaceome advances the quest for stem cell
markers, since it identifies protein candidates that are directlyaccessible from the extracellular space and could be used asstem-cell-specific markers. In addition, surfaceome genes thatdisplay similar expression profiles could occur in a functionallyrelevant signaling synapse and directly reveal cell-surface inter-actions (49). Such nanoscale information about the surfaceomewill allow informed development of multivalent affinity bindersfor highly specific targeting and enrichment of stem cells andtheir derivatives.
DiscussionSURFY Accurately Identifies Cell-Surface Proteins. By integratingannotation, experimental evidence, and computational methods,we generated a surfaceome-specific protein classifier termedSURFY. SURFY, with an accuracy of 93.5% based on a randomforest model analysis of training sets, clearly outperformed otherlocation prediction tools (YLoc: 62.2%; MemLoci: 77.8%) (13,15) as well as TMHMM (3) and SignalP (55) used in combina-tion with subcellular localization databases (19, 56). SURFY isan approach for subcellular localization prediction based on anumber of biologically relevant features and consideration ofTM topologies. Within the human proteome of 20,193 proteins(UniProt version 2015_01), SURFY classified 2,756 ɑ-helicalTM proteins as located and exposed at the cell surface. Theaddition of 130 currently annotated GPI-anchored proteinsresulted in a 2,886-protein surfaceome, which corresponds to14.3% of the entire human proteome.
Distinguishing Features of Cell-Surface Proteins. The predictive ac-curacy of SURFY is achieved by the combination of five dis-criminative features. The individual sequence- and topology-basedfeatures alone are insufficient for proper classification of surfaceproteins. Nevertheless, these five features harbor notable bi-ological relevance for cell-surface proteins. The first distinguishingfeature is the N-X-S/T sequence motif. N-glycosylation within thismotif plays an important role in functions of many surface proteins(57), but not every sequence motif isN-glycosylated (58). We showthat this N-glycosylation sequence motif is 3.5-fold enriched inextracellular domain sequences compared with sequences of in-tracellular proteins or intracellular domains of surface proteins. In
RA
MO
S
MH
C
IMR
-32
tetr
aspa
nins
HT-
29
inte
grin
s
A
B
C
Fig. 4. Voronoi tree maps generated on wlab.ethz.ch/surfaceome. Maps forRAMOS (A), HT-29 (B), and IMR-32 (C) are shown. RPKME values of each cellline were scaled from 0 to 1 and mapped onto the whole in silico surfa-ceome. Light color indicates low expression; dark color indicates strong ex-pression. White genes are not expressed. Characteristic functional proteingroups of these cell lines are highlighted on the right.
E10994 | www.pnas.org/cgi/doi/10.1073/pnas.1808790115 Bausch-Fluck et al.
absolute terms, there are on average an additional 1.05 N-X-S/Tmotifs per 100 amino acids in extracellular domains than in in-tracellular proteins. Under the assumption that the 0.42 motifs per100 amino acids in nonsurface proteins represents the frequencyof unoccupied motifs and the increase by 1.05 motifs in the ex-tracellular domains represent the frequency of occupied motifs,we can conclude an N-glycosylation site occupancy of 71%, whichis in good agreement with a previous analysis on a smaller dataset,reporting 65% site occupancy (59).The second distinguishing feature of surface-protein extra-
cellular domains is the increased frequency of cysteine residues(3.4% compared with 2.3% proteome-wide). This presumablyreflects the fact that disulfide cross-links are vital for foldingsurface proteins into their native conformation and for theirstructural stability (60).The third feature is the presence of a possible C-glycosylation
site. The biological function of C-glycosylation is unknown, andonly 17 human proteins are annotated with this modification so far(UniProtKB version 2015_01). That 1,070 surface proteins andonly 35 nonsurface TM proteins had at least one predicted non-cytoplasmic C-glycosylation site clearly indicates an extracellularfunction of this modification or the underlying predicted motif.The final two distinguishing features of surface proteins are
length and number of TM domains. We found that α-helical TMdomains of surface proteins are on average 1 amino acid longer
than nonsurface proteins. It has been reported that ɑ-helical TMdomains of human plasma membrane proteins are on average∼4 amino acids longer and also less bulky than proteins localizedto the endoplasmic reticulum or Golgi (61). Sharpe et al. (61)restricted their analysis to single-pass TM proteins, where thedifferences in TM domain structure are expected to be morepronounced than those we observed. Cholesterol is known toincrease the thickness of lipid bilayers and is the reason thatthe plasma membrane is thicker than endoplasmic reticulum orGolgi membranes. A difference in thickness is also observedbetween cholesterol-enriched domains (e.g., lipid rafts) anddisordered regions within the plasma membrane (62). Our ran-dom forest approach could be expanded to explore potentialcorrelations with TM domain size and lipid raft localization. Thenumber of TM domains of surface proteins displays a clear biastoward 7- and >10-TM domains, reflecting cell-surface-relatedfunctions from GPCRs, as well as transporters and channels,maintaining cellular metabolism.
Proteins Not Included in the in Silico Surfaceome. The surfaceomepredicted by SURFY shows all known cell-surface proteingroups. It encompasses virtually the complete set of receptorproteins; the only exceptions are some small groups of in-tracellular receptor proteins. All but 3 of the 804 GPCRs, a classof proteins which is a major target for drugs (63), are found in
A
D
C
gap junction proteins
expr
essi
on c
hang
es
cluster 1
0-1
1-2
23
cluster 2
0-1
1-2
2
cluster 3
0-1
1-2
23
cluster 4
0-1
12
-2-3
cluster 5
day 201612840
0-1
1-2
23
B
201612840
10
2
1
0
8
6
log2
exp
ress
ion
leve
l
GJA4GJB1GJB2GJB3
GJC1GJC3GJB5
GJA1
day
transcript sum
transcript count
1000
100
10
1
0.1
0.01
gene
exp
ress
ion
leve
l
1300
1800/ 3500
1400
1700/ 3000
1600/ 2500
1500
count/ sum
20181614121086420 22day
54321
Fig. 5. Surfaceome changes during neurogenesis. (A) Left axis: Surfaceome gene level distribution from day 0 to day 22. Right axis: The red line shows thetotal number of expressed surfaceome genes, and the brown line shows the sum of expression levels over all expressed surfaceome genes. Transcriptomicdata and definition of developmental stages (1, pluripotency stage; 2, differentiation initiation stage; 3, neural commitment stage; 4, NPC proliferation stage;5, neuronal differentiation stage) were obtained from Li et al. (52). (B) Expression of selected gap junction genes from day 0 to day 22. (C) Identified clustersamong surfaceome gene expression profiles based on c-means soft clustering. Red, higher correlation with cluster; light blue, lower correlation with cluster.(D) Voronoi tree map of log2 expression ratios between day 0 and day 22; the darker means more expressed at day 0, and the brighter color means moreexpressed at day 22. Surfaceome genes are hierarchically grouped by functional classification [receptors (orange), transporters (purple), hydrolases (darkblue), unclassified (blue), and miscellaneous (green)].
the in silico surfaceome. Inherent to every prediction is that acertain cutoff has to be selected as a tradeoff between sensitivityand specificity. The presented in silico surfaceome was definedwith an estimated 5% FPR. To better understand the FPR, wetook a closer look at the 33 proteins within the negative trainingset that have high SURFY scores, qualifying them as surfaceproteins and presumably false-positive hits. However, currentversions of UniProt and COMPARTMENTS annotations in-dicate that some of them (namely, LRRT1, SE6L1, TM130,TMM59, and TPC2) are expressed at the cell surface, indicatingthat our FPR estimate of 5% is rather conservative. We alsofound that a few proteins known to localize to the cell-surfaceproteins scored below the threshold and are thus not predictedto be at the cell surface. An example is TFR1 (score 0.3272).TFR1 has a large extracellular domain and also N-glycosylationsites, but the frequency of N-glycosylation sites (0.69) and ofcysteine (1.1) per 100 noncytoplasmic amino acids is low, and itsTM domain is rather short (18 amino acids). The combination ofthese features resulted in a low SURFY score. The frequency ofnoncytoplasmic N-glycosylation sites is the most discriminantfeature of the SURFY algorithm since the majority of surfa-ceome proteins are indeed glycosylated (57). Proteins with nononcytoplasmic N-X-S/T motif are not likely to score as surfa-ceome proteins (as was the case for CD3e); however, the in silicosurfaceome contains 59 proteins without the N-X-S/T motif.Based on the different assessments with known protein groups(i.e., CD proteins and receptors) and the characteristics of thepredicted surface proteins, we are confident that the surfaceomeencompasses to the most complete and most correct list of cell-surface proteins reported so far.
The Expressed Surfaceome. By matching the surfaceome to thetranscriptional profile of 610 cancer cell lines, we showed that2,331 predicted cell-surface proteins are expressed in at least onecell line, and the majority of surfaceome genes that are notexpressed in the cell lines analyzed encode olfactory receptors.Deep surfaceome profiling using CSC technology identified507 surfaceome proteins on HeLa cells (Dataset S1, 11.8),whereas RNA-sequencing data indicated that 801 surfaceomegenes are expressed (49). Surface proteins identified by CSC dis-played generally a stronger expression at the mRNA level, in-dicating that surfaceome genes with low expression are below thecurrent detection limit of mass-spectrometry-based methods (SIAppendix, Fig. S9). Surfaceome gene expression analysis thereforehas the possibility to identify low-abundance cell-surface proteinsto target them by more sensitive approaches (like PRM or DIA).Care must be taken when translating gene expression levels
into cell-surface protein abundance. Although it has been shownthat this derivation is possible with a gene-specific conversionfactor (64), it was also demonstrated that the mRNA–proteincorrelation is less accurate for cell surface than for cytoplasmicproteins (44). The comparison of abundance of surfaceomeproteins from the quantitative proteome of Beck et al. (65) withgene expression data from Klijn et al. (49) showed only a lowcorrelation (SI Appendix, Fig. S10). In addition, the total proteinpool of a cell-surface protein can differ from its actual abun-dance at the cell surface. For example, the glucose transporterGTR4 is stored in vesicles and only transported to the cell sur-face after insulin stimulation (66). Based on mRNA expressionlevels from a large screen, SURFY allows for the selection of asmall set of cell-specific precandidates, which are feasible tovalidate on the protein level.Interestingly, certain surfaceome proteins are expressed on
literally every cell line (231 proteins) or only on a single or veryfew cell lines (529 proteins) (Dataset S1, 11.10). We hypothesizethat the group of constitutively expressed proteins are encodedby surfaceome housekeeping genes. These genes are expressed atsubstantially higher median expression over all cell lines than are
those genes that encode surface proteins expressed by very fewlines (SI Appendix, Fig. S7). If the housekeeping surfaceomeproteins show stable abundance at the cell surface, they couldserve as a basis for normalization in absolute quantitative sur-faceome proteotype screens.In summary, we have presented a comprehensive description
of the in silico human surfaceome. This public resource of2,886 proteins can be used to query proteotype and tran-scriptomic datasets for context-dependent biomarkers and drug-target candidates (19, 56). Furthermore, the in silico surfaceomewill provide a guiding role in future studies assessing the plas-ticity and response of the cell-surface proteome to differentia-tion, perturbations, or other cellular processes. The recentlypublished GeneGini coefficient to compare expression levels willbe a helpful tool for such surfaceome studies (67). To interrogatethe in silico surfaceome, we developed a publicly accessibleonline tool enabling the interactive visualization of quantitativesurfaceomes based on a preconfigured Voronoi tree map. Thesurfaceome website allows for quantitative visual comparison ofexpressed surfaceomes on static background Voronoi tree mapsand will provide insights into the systemic and dynamic responseof a cell’s surfaceome to perturbations or drugs (wlab.ethz.ch/surfaceome). The human in silico surfaceome will further pro-vide the basis for dynamic interactome studies to decipher cell-surface-specific proximal interaction networks and cellularnanoscale organization, deepening our understanding of howcells sense and communicate with their microenvironment. Thecomputational machine-learning strategy shown here could also bedeveloped further to enable new insights into model organismsurfaceomes.
MethodsConsolidating TM Topologies for the Human Membrane Proteome. The basisand reference for the presented human surface proteome analysis was thehuman proteome in UniProtKB/Swiss-Prot (Version 2015_01) (68). We firstmatched the 8,010 human peptides from the CSPA to the reference proteome,generating a list of constraints for the topology of a total of 1,387 proteinsby enforcing identified N-glycosylation sites to be noncytoplasmic. Additionaldetails can be found SI Appendix, SI Methods.
Defining Training Sets for Predictive Modeling. The positive training set wascomposed of human ɑ-helical TM domain-containing proteins appearing inat least two of the following three datasets: (i) the “high confidence” subsetof the CSPA containing 735 proteins, (ii) the UniProtKB/Swiss-Prot (Version2015_01) containing 2,043 proteins attributed with the “cell membrane”keyword, and (iii) the subcellular localization database COMPARTMENTS(69) containing 826 high-confidence plasma membrane proteins (five stars),which belong to the COMPARTMENTS inherent “plasma membrane” posi-tive benchmark set and also belong to the COMPARTMENTS inherent neg-ative benchmark sets for each of the remaining subcellular locations (all but“extracellular space”). Additional details can be found in SI Appendix,SI Methods.
Derivation of a Numerical Feature Vector for Each Protein. Numerical featureswere defined as follows for each topological domain (cytoplasmic, non-cytoplasmic, TM, and signal peptide, if applicable): amino acid frequencies;the number, average length, and relative fraction of ɑ-helical TM regions; thepresence of and average length of a signal peptide; and the relative fractionof cytoplasmic and noncytoplasmic regions. Additional details can be foundin SI Appendix, SI Methods.
Supervised Learning and Predictive Modeling of Human Cell-Surface Proteins.We chose the random forest algorithm (70) as implemented in the “ran-domForest” package (71) of the statistical computing environment R (Ver-sion 3.1.0) (72) for supervised, binary classification. Additional details can befound SI Appendix, SI Methods.
ACKNOWLEDGMENTS. We thank the whole B.W. laboratory for suggestionsand support at all stages of the project. This work was supported by SwissNational Science Foundation Grant 31003A_160259 (to B.W.), the SwissInitiative in Systems Biology SystemsX.ch InfectX project (B.W.), and theCommission of Technology and Innovation (B.W.).
E10996 | www.pnas.org/cgi/doi/10.1073/pnas.1808790115 Bausch-Fluck et al.
1. Almén MS, Nordström KJV, Fredriksson R, Schiöth HB (2009) Mapping the humanmembrane proteome: A majority of the human membrane proteins can be classifiedaccording to function and evolutionary origin. BMC Biol 7:50.
2. Reeb J, Kloppmann E, Bernhofer M, Rost B (2015) Evaluation of transmembrane helixpredictions in 2014. Proteins 83:473–484.
3. Krogh A, Larsson B, von Heijne G, Sonnhammer ELL (2001) Predicting transmembraneprotein topology with a hidden Markov model: Application to complete genomes.J Mol Biol 305:567–580.
4. Jones DT (2007) Improving the accuracy of transmembrane protein topology pre-diction using evolutionary information. Bioinformatics 23:538–544.
5. Viklund H, Elofsson A (2008) OCTOPUS: Improving topology prediction by two-trackANN-based preference scores and an extended topological grammar. Bioinformatics24:1662–1668.
6. Nielsen H, Engelbrecht J, Brunak S, von Heijne G (1997) Identification of prokaryoticand eukaryotic signal peptides and prediction of their cleavage sites. Protein Eng 10:1–6.
7. Käll L, Krogh A, Sonnhammer ELL (2004) A combined transmembrane topology andsignal peptide prediction method. J Mol Biol 338:1027–1036.
8. Eisenhaber B, Bork P, Eisenhaber F (1999) Prediction of potential GPI-modificationsites in proprotein sequences. J Mol Biol 292:741–758.
9. Fankhauser N, Mäser P (2005) Identification of GPI anchor attachment signals by aKohonen self-organizing map. Bioinformatics 21:1846–1852.
10. Raman P, Cherezov V, Caffrey M (2006) The membrane protein data bank. Cell MolLife Sci 63:36–51.
11. Chou K-C, Shen H-B (2007) MemType-2L: A web server for predicting membraneproteins and their types by incorporating evolution information through Pse-PSSM.Biochem Biophys Res Commun 360:339–345.
12. Emanuelsson O, Nielsen H, Brunak S, von Heijne G (2000) Predicting subcellular lo-calization of proteins based on their N-terminal amino acid sequence. J Mol Biol 300:1005–1016.
13. Briesemeister S, Rahnenführer J, Kohlbacher O (2010) YLoc—An interpretable webserver for predicting subcellular localization. Nucleic Acids Res 38(Suppl 2):W497–W502.
14. Du P, Tian Y, Yan Y (2012) Subcellular localization prediction for human internal andorganelle membrane proteins with projected gene ontology scores. J Theor Biol 313:61–67.
15. Pierleoni A, Martelli PL, Casadio R (2011) MemLoci: Predicting subcellular localizationof membrane proteins in eukaryotes. Bioinformatics 27:1224–1230.
16. Rhee SY, Wood V, Dolinski K, Draghici S (2008) Use and misuse of the gene ontologyannotations. Nat Rev Genet 9:509–515.
17. da Cunha JP, et al. (2009) Bioinformatics construction of the human cell surfaceome.Proc Natl Acad Sci USA 106:16752–16757.
18. Díaz-Ramos MC, Engel P, Bastos R (2011) Towards a comprehensive human cell-surface immunome database. Immunol Lett 134:183–187.
19. Town J, et al. (2016) Exploring the surfaceome of Ewing sarcoma identifies a new andunique therapeutic target. Proc Natl Acad Sci USA 113:3603–3608.
20. Wollscheid B, et al. (2009) Mass-spectrometric identification and relative quantifica-tion of N-linked cell surface glycoproteins. Nat Biotechnol 27:378–386.
21. Gundry RL, Boheler KR, Van Eyk JE, Wollscheid B (2008) A novel role for proteomics inthe discovery of cell-surface markers on stem cells: Scratching the surface. ProteomicsClin Appl 2:892–903.
22. Schiess R, Wollscheid B, Aebersold R (2009) Targeted proteomic strategy for clinicalbiomarker discovery. Mol Oncol 3:33–44.
23. Gundry RL, et al. (2009) The mouse C2C12 myoblast cell surface N-linked glyco-proteome: Identification, glycosite occupancy, and membrane orientation. Mol CellProteomics 8:2555–2569.
24. Hofmann A, et al. (2010) Proteomic cell surface phenotyping of differentiating acutemyeloid leukemia cells. Blood 116:e26–e34.
25. Bock T, Bausch-Fluck D, Hofmann A, Wollscheid B (2012) CD proteome and beyond-technologies for targeting the immune cell surfaceome. Front Biosci 17:1599–1612.
26. Ziegler A, et al. (2012) Proteomic surfaceome analysis of mesothelioma. Lung Cancer75:189–196.
27. Boysen G, et al. (2012) Identification and functional characterization of pVHL-dependent cell surface proteins in renal cell carcinoma. Neoplasia 14:535–546.
28. Cerciello F, et al. (2013) Identification of a seven glycopeptide signature for malignantpleural mesothelioma in human serum by selected reaction monitoring. ClinProteomics 10:16.
29. Mirkowska P, et al. (2013) Leukemia surfaceome analysis reveals new disease-associated features. Blood 121:e149–e159.
30. Moest H, et al. (2013) Malfunctioning of adipocytes in obesity is linked to quantitativesurfaceome changes. Biochim Biophys Acta 1831:1208–1216.
31. Hofmann A, Bausch-Fluck D, Wollscheid B (2013) CSC technology: Selective labeling ofglycoproteins by mild oxidation to phenotype cells. Methods Mol Biol 951:33–43.
32. DeVeale B, et al. (2014) Surfaceome profiling reveals regulators of neural stem cellfunction. Stem Cells 32:258–268.
33. Kropp EM, et al. (2014) N-glycoprotein surfaceomes of four developmentally distinctmouse cell types. Proteomics Clin Appl 8:603–609.
34. Bausch-Fluck D, et al. (2015) A mass spectrometric-derived cell surface protein atlas.PLoS One 10:e0121314.
35. Tarca AL, Carey VJ, Chen X-W, Romero R, Draghici S (2007) Machine learning and itsapplications to biology. PLoS Comput Biol 3:e116.
36. Pollock SB, et al. (2018) Highly multiplexed and quantitative cell-surface proteinprofiling using genetically barcoded antibodies. Proc Natl Acad Sci USA 115:2836–2841.
37. Kawashima S, et al. (2008) AAindex: Amino acid index database, progress report 2008.
Nucleic Acids Res 36:D202–D205.38. Li F, et al. (2015) GlycoMine: A machine learning-based approach for predicting N-, C-
and O-linked glycosylation in the human proteome. Bioinformatics 31:1411–1419.39. Strobl C, Boulesteix A-L, Augustin T (2007) Unbiased split selection for classification
trees based on the Gini index. Comput Stat Data Anal 52:483–501.40. Tsirigos KD, Hennerdal A, Käll L, Elofsson A (2012) A guideline to proteome-wide
α-helical membrane protein topology predictions. Proteomics 12:2282–2294.41. Lu YC, et al. (2015) Structural basis of latrophilin-FLRT-UNC5 interaction in cell ad-
hesion. Structure 23:1678–1691.42. Heidmann O, et al. (2017) HEMO, an ancestral endogenous retroviral envelope pro-
tein shed in the blood of pregnant women and expressed in pluripotent stem cells
and tumors. Proc Natl Acad Sci USA 114:E6642–E6651.43. Thul PJ, et al. (2017) A subcellular map of the human proteome. Science 356:eaal3321.44. Schwanhäusser B, et al. (2011) Global quantification of mammalian gene expression
control. Nature 473:337–342.45. Mathieson T, et al. (2018) Systematic analysis of protein turnover in primary cells. Nat
Commun 9:689.46. Surinova S, et al. (2011) On the development of plasma protein biomarkers.
J Proteome Res 10:5–16.47. Peterson AC, Russell JD, Bailey DJ, Westphall MS, Coon JJ (2012) Parallel reaction
monitoring for high resolution and high mass accuracy quantitative, targeted pro-
teomics. Mol Cell Proteomics 11:1475–1488.48. Gillet LC, et al. (2012) Targeted data extraction of the MS/MS spectra generated by
data-independent acquisition: A new concept for consistent and accurate proteome
analysis. Mol Cell Proteomics 11:O111.016717.49. Klijn C, et al. (2015) A comprehensive transcriptional portrait of human cancer cell
lines. Nat Biotechnol 33:306–312.50. Schreiner C, Bauer J, Margolis M, Juliano RL (1991) Expression and role of integrins in
adhesion of human colonic carcinoma cells to extracellular matrix components. Clin
Exp Metastasis 9:163–178.51. Detchokul S, Williams ED, Parker MW, Frauman AG (2014) Tetraspanins as regulators
of the tumour microenvironment: Implications for metastasis and therapeutic strat-
egies. Br J Pharmacol 171:5462–5490.52. Li Y, et al. (2017) Transcriptome analysis reveals determinant stages controlling human
embryonic stem cell commitment to neuronal cells. J Biol Chem 292:19590–19604.53. Pan C, Kumar C, Bohl S, Klingmueller U, Mann M (2009) Comparative proteomic
phenotyping of cell lines and primary cells to assess preservation of cell type-specific
functions. Mol Cell Proteomics 8:443–450.54. Peiris TH, Oviedo NJ (2013) Gap junction proteins: Master regulators of the planarian
stem cell response to tissue maintenance and injury. Biochim Biophys Acta 1828:
109–117.55. Petersen TN, Brunak S, von Heijne G, Nielsen H (2011) SignalP 4.0: Discriminating
signal peptides from transmembrane regions. Nat Methods 8:785–786.56. Fonseca AL, et al. (2016) Bioinformatics analysis of the human surfaceome reveals
new targets for a variety of tumor types. Int J Genomics 2016:8346198.57. Moremen KW, Tiemeyer M, Nairn AV (2012) Vertebrate protein glycosylation: Di-
versity, synthesis and function. Nat Rev Mol Cell Biol 13:448–462.58. Mellquist JL, Kasturi L, Spitalnik SL, Shakin-Eshleman SH (1998) The amino acid fol-
lowing an asn-X-Ser/Thr sequon is an important determinant of N-linked core gly-
of the protein environment of N-glycosylation sites: Implications for occupancy,
structure, and folding. Glycobiology 14:103–114.60. Sevier CS, Kaiser CA (2002) Formation and transfer of disulphide bonds in living cells.
Nat Rev Mol Cell Biol 3:836–847.61. Sharpe HJ, Stevens TJ, Munro S (2010) A comprehensive comparison of transmembrane
domains reveals organelle-specific properties. Cell 142:158–169.62. Lundbaek JA, Andersen OS, Werge T, Nielsen C (2003) Cholesterol-induced protein
sorting: An analysis of energetic feasibility. Biophys J 84:2080–2089.63. Filmore D (2004) It’s a GPCR world. Mod Drug Discovery 7:24–28.64. Edfors F, et al. (2016) Gene-specific correlation of RNA and protein levels in human
cells and tissues. Mol Syst Biol 12:883.65. Beck M, et al. (2011) The quantitative proteome of a human cell line. Mol Syst Biol 7:
549.66. Rea S, James DE (1997) Moving GLUT4: The biogenesis and trafficking of GLUT4 stor-
age vesicles. Diabetes 46:1667–1677.67. O’Hagan S, Wright Muelas M, Day PJ, Lundberg E, Kell DB (2018) GeneGini: Assess-
ment via the Gini coefficient of reference “housekeeping” genes and diverse human
transporter expression profiles. Cell Syst 6:230–244.e1.68. The UniProt Consortium (2014) UniProt: A hub for protein information. Nucleic Acids
Res 43:D204–D212.69. Binder JX, et al. (2014) COMPARTMENTS: Unification and visualization of protein
subcellular localization evidence. Database (Oxford) 2014:bau012.70. Breiman L (2001) Random forests. Mach Learn 45:5–32.71. Liaw A, Wiener M (2002) Classification and regression by randomForest. R News 2:
18–22.72. R Core Team (2014) R: A Language and Environment for Statistical Computing, Ver-
sion 3.1.0. Available at www.R-project.org/. Accessed July 1, 2014.