Date post: | 08-Jan-2017 |
Category: |
Documents |
Upload: | james-scott |
View: | 214 times |
Download: | 0 times |
The Influence of Cobra-Venom on the Proteid MetabolismAuthor(s): James ScottSource: Proceedings of the Royal Society of London. Series B, Containing Papers of aBiological Character, Vol. 76, No. 508 (May 24, 1905), pp. 166-178Published by: The Royal SocietyStable URL: http://www.jstor.org/stable/80161 .
Accessed: 07/05/2014 18:22
Your use of the JSTOR archive indicates your acceptance of the Terms & Conditions of Use, available at .http://www.jstor.org/page/info/about/policies/terms.jsp
.JSTOR is a not-for-profit service that helps scholars, researchers, and students discover, use, and build upon a wide range ofcontent in a trusted digital archive. We use information technology and tools to increase productivity and facilitate new formsof scholarship. For more information about JSTOR, please contact [email protected].
.
The Royal Society is collaborating with JSTOR to digitize, preserve and extend access to Proceedings of theRoyal Society of London. Series B, Containing Papers of a Biological Character.
http://www.jstor.org
This content downloaded from 169.229.32.136 on Wed, 7 May 2014 18:22:57 PMAll use subject to JSTOR Terms and Conditions
166
The Influence of Cobra-venom on the Proteid Metabolism.
By JAMES SCOTT, M.D., C.M., B.Sc. Edin.
(Communicated by Sir Thomas R. Fraser, F.R.S. Received February 6,- Read April 6, 1905.)
(From the Research Laboratory of the Royal College of Physicians, Edinburgh.)
Although so much valuable work has been done upon the physiological action of Cobra-venom by Fraser, Calmette, Elliot and others,* so far no observations of its effects upon the metabolism have been recorded. While its
peculiarly selective action on the central nervous system would seem to
suggest the absence of any marked general action, the demonstration afforded by Elliot's work of its influence and the way in which peripheral nerve mechanism
may be attacked, and of its interference with respiration, and the direct local action on the tissues into which it is injected, seem to indicate that its toxic action may extend to protoplasm generally and that it may thus lead to modification of the proteid metabolism, whether in the direction of altering the rate of proteid metabolism or of modifying the synthetic processes in the liver by which urea is elaborated, as do the toxins of certain micro-organisms.
I have to thank Sir Thomas E. Fraser for his kindness in giving me the
Cobra-venom; and also to thank Dr. Noel Paton for much valuable assistance in this investigation.
General Plan of Investigation and Methods.
Dogs were used for this investigation. Before each experiment they were fed for some days on a fixed diet of oatmeal porridge and milk in order to establish nitrogenous equilibrium. The urine was collected by keeping the animal in a cage with a sloping bottom made of zinc under which a suitable vessel was placed. The floor was kept scrupulously clean, and feeces were removed as soon as possible after they were passed. The urine was collected
daily at 10 A.M.
When the animal came into nitrogenous equilibrium, sub-lethal and in some cases lethal doses of Cobra-venom were injected subcutaneously.
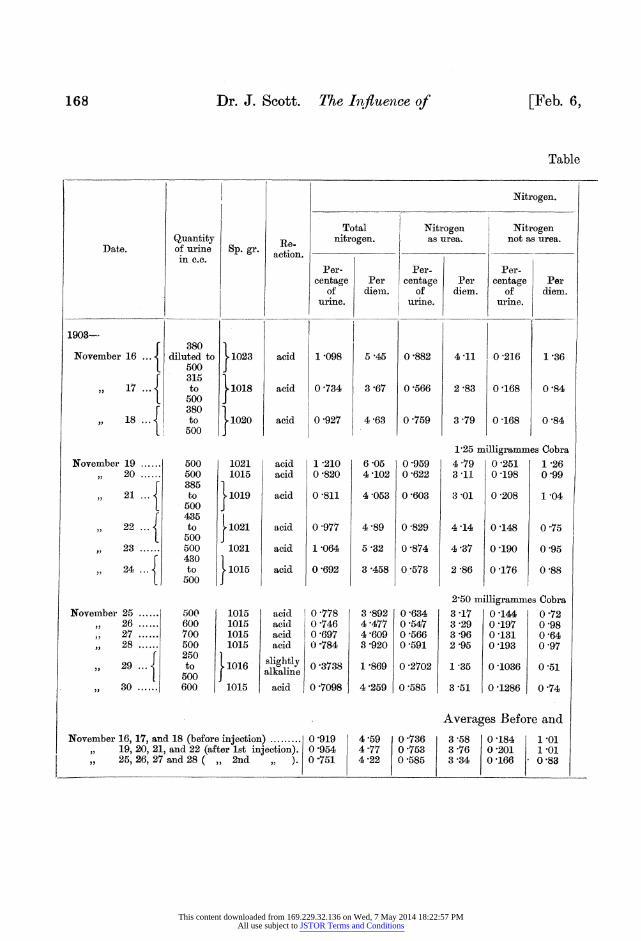
Urine.-The reaction and specific gravity were taken. The quantity collected was noted and the urine diluted to a convenient volume. The amounts of the following ingredients were determined by the methods
* See Fayrer: 'Thanatophidia of India'; Brunton and Fayrer, 'Roy. Soc. Proc., vol. 22, 1874; Wall, 'Indian Snake Poisons,' 1883; Nicholson, ' Ophiology,' 1893.
This content downloaded from 169.229.32.136 on Wed, 7 May 2014 18:22:57 PMAll use subject to JSTOR Terms and Conditions
Influence of Cobra-venom on the Proteid Metabolism. 167
enumerated, duplicate analyses were made in all cases and the mean of these taken :-
1. Total nitrogen by Argutinsky's modification of Kjeldahl's method. 2. Nitrogen in urea by Bohland's method by precipitating with phospho-
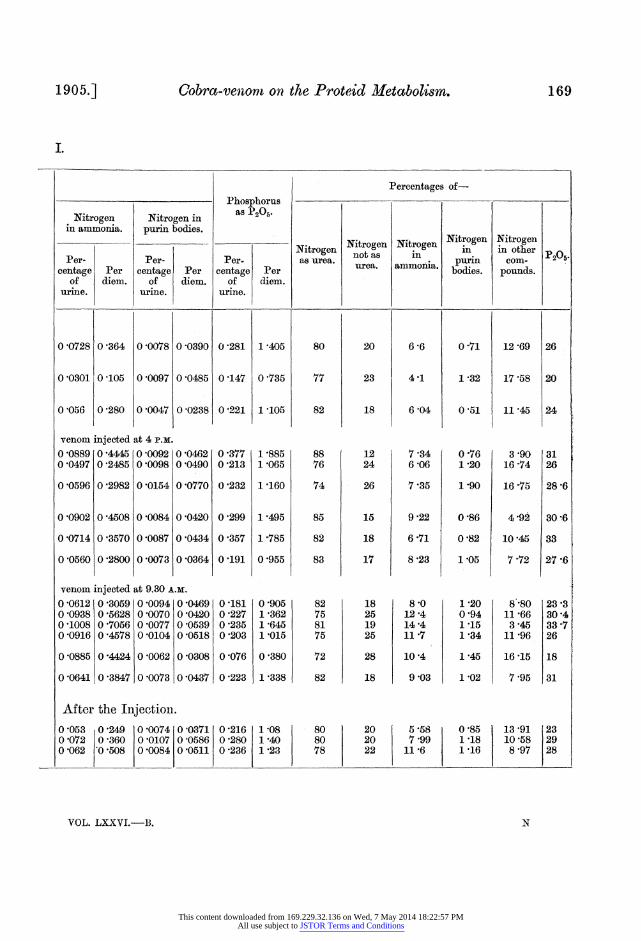
tungstic (Merck's) and hydrochloric acids. 3. Nitrogen of ammonia by Schlossing's method. 4. Nitrogen not in urea (non-urea nitrogen) was calculated by difference. 5. Nitrogen in purin bodies by Kriiger and Wulff's method.* 6. Phosphoric acid as PO25 by titrating with uraniun nitrate. 7. The percentages of nitrogen in urea, not in urea (non-urea nitrogen), in
ammonia, in purin bodies, in other compounds were calculated in terms of total nitrogen.
8. The percentages of PO25 were calculated in terms of total nitrogen. Averages of the figures before and after the injections were determined. Albumin was tested for by cold nitric acid and by heat and acetic acid. Some of the experiments were rendered valueless by the early development
of an abscess at the seat of inoculation, but the following were carried on, without disturbance from such accidents.
In all the experiments no marked symptoms were produced. In some cases after injection the dog lay very quiet for a few hours. In a few there was a local swelling observed next day, but it soon disappeared.
Experiment 1.
For this experiment a retriever weighing 18 kilogrammes was used. The dog was kept in its cage for two or three days before the examination of the urine was begun, so that it might get accustomed to its diet and nitrogenous equilibrium be established.
Food Analyses.
Analyses of the food given to the dog showed the amount of nitrogen to be:-
Daily diet: 500 c.c. milk ..................... = 1'83 grammes nitrogen 200 grammes oatmeal ......... = 4-30
Total intake of nitrogen per diem... = 6-13
Analyses of the urine were begun on November 16, 1903, and on the 19th, at 4 P.M., 1'25 milligrammes Cobra-venom dissolved in 0'5 c.c. sterilised normal saline solution was injected subcutaneously in the side.
* Cf. 'Zeit. fir Phys. Chem.,' vol. 20, p. 177, 1895.
This content downloaded from 169.229.32.136 on Wed, 7 May 2014 18:22:57 PMAll use subject to JSTOR Terms and Conditions
Dr. J. Scott. The Influence of
Nitrogen.
Total Nitrogen Nitrogen Quantity Re. nitrogen. as urea. not as urea.
Date. of urine Sp. gr. action in c.c.
Per- Per- Per- centage Per centage Per centage Per
of diem. of diem. of diem. urine. urine. urine.
November 19 ...... ,, 20 ......
,, 21 ...
27 ......
,, 23 ......
November 25 ...... ,, 26 ...... ,, 27 ...... ,, 28 ......
29 ...{
,, 30 ......
acid
acid
acid
1 '098
0'734
0 -927
acid 1 '210 acid 0 820
acid 0 '811
acid 0 '977
acid 1 '064
acid 0 -692
acid 1 0 778 acid 0 '746 acid 0 697 acid 0'784
slightly 0 3738 alkaline
acid 0 7098
5 -45
3 '67
4 -63
0 882
0 '566
0 759
6 -05 0 959 4 102 0-622
4 053 0 603
4'89 0 829
5 '32 0 '874
3 458 0 573
3 '892 0 634 4'477 0 547 4 609 0'566 3 920 0 591
1 '869 0 2702
4 259 0'585
4-11 0 216 1 36
2 83 0 168 0 84
3 79 0 168 0 84
1'25 milligrammes Cobra 4 '79 0 251 1 26 3'11 0 198 0 99
3 01 0 208 1 04
4114 0'148 0 75
4'37 0'190 0'95
2 -86 0 '176 088
2'50 milligrammes Cobra 3 17 0 144 0 72 3 29 0 197 0 98 3 96 0'131 0 64 2 95 0 193 0 97
1 35 0 1036 0 51
3'51 0'1286 0 74
November 16, 17, and 18 (before injection) .........0 919 , 19, 20, 21, and 22 (after 1st injection). 0 954
25, 26, 27 and 28 ( , 2nd ,, ). 0 751
Averages Before and
4'59 0'736 3 58 0-184 1 01 4 77 0 -753 3'76 0'201 1 01 4'22 0'585 3'34 0-166 0'83
168 [Feb. 6,
Table
1903-
Nov smber 16 ... {
,, 17 ... { 18 ... {,
380 diluted t
500 315 to
500 380 to
500
500 500 385 to
500 435 to
500 500 430 to
500
500 600 700 500 250 to
500 600
o }1023
}1018
} 1020
1021 1015
1019
}1021
1021
1015
1015 1015 1015 1015
1016
1015
"'
This content downloaded from 169.229.32.136 on Wed, 7 May 2014 18:22:57 PMAll use subject to JSTOR Terms and Conditions
Cobra-venom on the Proteid Metabolism.
I.
Percentages of-
Nitrogen in ammonia.
Per- centage Per
of diem. urine.
Nitrogen in purin bodies.
Per- centage Per
of diem. urine.
Phosphorus as P206.
Per- centage Per
of diem. urine.
Nitrogen Nitrogen Nitrogen not as in as urea. Ol v"^"l'.
Nitrogen Nitrogen in in other
purin bodies.
com- pounds.
0 0728 0-364
0-0301 0-105
0 '056 0 280
venom injected 0 -0889 '04445 0 0497 0 2485
0*0596 0-2982
0 0902 0-4508
0-0714 0-3570
0-0560 0 2800
0 -0078
0 -0097
0 0047
at 4 P.M.
0 0092 0 0098
0 0154
0 0084
0 0087
0 0073
0 0390
0 -0485
0 0238
0 0462 0 -0490
0 0770
0 -0420
0 0434
0 -0364
0 281
0 147
0 -221
0 -377 0 213
0 -232
0 -299
0 -357
0 -191
1 405
0 735
1 105
1 '885 1 065
1 160
1 495
1 -785
0 955
venom injected at 9.30 A.M.
0-0612 0 3059 0 0094 0 0469 0-181 0 905 0'0938 0'5628 0-0070 0-0420 0-227 1'362 0-1008 0-7056 0 0077 0 0539 0-235 1-645 0-0916 0-4578 0-0104 0 0518 0-203 1 015
0-0885 0-4424 0-0062 0-0308 0-076 0'380
0-0641 0-3847 0 0073 0 0437 0 223 1 -338
After the Injection. 0 053 0 249 0 072 0 '360 0 '062 '0 '508
0 0074 0 0107 0 0084
0 '0371 0 2161 -08 0 -0586 0 2801 -40 0 -0511 0 236 1 '23
VOL. LXXVI.-B.
1905.] 169
P205.
12 -69
17 -58
11 '45
26
20
24
20
23
18
12 24
26
15
18
17
6 6
41
6 04
7 -34 6 06
7 35
9 -22
6 71
8 '23
80
77
82
88 76
74
85
82
83
82 75 81 75
72
82
80 80 78
0-71
1 -32
0 51
0 -76 1 20
1 90
0 86
0 '82
1 05
1 20 0 94 1 15 1 '34
1 45
1 02
0 85 1 18 1 '16
3 90 31 16 74 26
16 -75 28 6
4 -92 30 6
10 45 33
7 72 27 '6
8 80 23-3 11 -66 30 4 3 45 33 -7
11 -96 26
16 15 18
7 -95 31
18 8'0 25 12-4 19 14-4 25 11-7
28 10 4
18 9-03
20 20 22
5 58 7 -99
11-6
13 91 10 58 8 97
23 29 28
IIUammolInlUa. urea.
I
N
This content downloaded from 169.229.32.136 on Wed, 7 May 2014 18:22:57 PMAll use subject to JSTOR Terms and Conditions
170 Dr. J. Scott. The Influence of [Feb. 6,
Table II.-Weight
Nitrogen.
Total Nitrogen Nitrogen Quantity e- nitrogen. as urea. not as urea.
Date. of urine Sp. gr. action. in c.c.
Per- Per- Per. centage Per centage Per centage Per
of diem. of diem. of diem. urine, urine. urine.
1904- 750 1
March 22........ diluted to 1015 acid 0 '552 5 '52 0 '455 4 '55 0 -097 0 '97 1000 f 710
3 23.......... to 1014 acid 0 '504 5 04 0 '434 4'34 0 '070 0 '70 1000 550
24 ......... to 1020 acid 0 '585 5 '85 0 '490 4 '90 0 '095 0 '95 1000 550
,, 25......... to } 1019 acid 0 '543 5 '43 0 '465 4 '65 0 '078 0 '78 L 1000
5 milligrammes Cobra 265 1 dark s
March 26 ......... to brown strongly 0 714 3 57 0 579 289 0 135 0 '675 1 500 J 1027 acid
f[ 610 yeow 27......... to yellow acid 0 '43 4 '03 0 '322 3 '22 0 '081 0 '81 J 1013 1000 28.......... 1000 1015 acid 0 -799 7 -99 0 -643 6 '43 0 -156 1 56
650 ,, 29 ......... to 1015 acid 0 '484 4 '48 0 '389 3 '89 0 '095 0 '95
1000 800
30 ......... to 1016 acid 0 711 7 -11 0 '601 6 -01 0 -110 1 '10 1000
Averages Before and
March 22 to 25 (inclusive) (before injection) ...... 0 546 5-46 0 -461 4'61 0 '085 0'85 26 to 29 ( ,, ) (after ,, ) ...... 0600 511 0'483 411 0-117 0 99
This content downloaded from 169.229.32.136 on Wed, 7 May 2014 18:22:57 PMAll use subject to JSTOR Terms and Conditions
1905.] Cobra-venom on the Proteid Metabolism.
of Dog, 17 Kilogrammes.
Nitrogen in ammonia.
Per- centage
of urine.
Per diem.
Nitrogen in purin bodies.
Per. Per
diem. centage
of urine.
0-0386 0 386 0'0059 0'059
0'0311 0-311 0-0055 0'055
0'0330 0'330 0-0069 0 069
0-0361 0'361 0-0064 0'064
venom injected at 11 A.M.
0'0434 0 217 0-0053 0 0265
0'0325 0-325 0'0130 0-130
0'0462 0'462 0-0087 0'087
0'0325 0'325 0-0073 0 073
0-0448 0'448 0-0102 0-102
Percentages of-
Phosphorus as P205.
Nitrogen Nitrogen Per- as urea.
Per diem.
1 85
1 58
1 87
1 '54
1 185
1 30
2 '34
1 '41
1 80
82
86
84
86
81
80
80
81
85
urea.
18
14
16
14
19
20
20
19
15
centage of
urine.
0 185
0 158
0 187
0 154
0 237
0 130
0 234
0 -141
0 180
Nitrogen in
ammonia.
7 0
6 2
5 6
6 7
6'1
8 1
5 8
6 7
6 -3
Nitrogen in
purin bodies.
1 06
1 '08
1 17
1 '18
0 75
3 '23
1 09
1 50
1 44
After the Injection. 0 '0347 0 347 0 0062 0 062 0'171 1 '71 0 0386 0 332 0 0086 0 079 0'185 1 56
84 16 6 '4 1 '12 81 19 6 -7 1 64
171
Nitrogen in other
com- pounds.
9 94
6 '72
9 '23
6 '12
12 '15
8 67
13 11
10 8
7 '26
33
31
32
28
33
32
29
29
25
8 0 31 11 -18 31
N 2
This content downloaded from 169.229.32.136 on Wed, 7 May 2014 18:22:57 PMAll use subject to JSTOR Terms and Conditions
172 Dr. J. Scott. The Influence of [Feb. 6,
Table
Nitrogen.
Total Nitrogen Nitrogen Quantity Re- nitrogen as urea. not as urea.
Date. of urine Sp. gr. a,cion. action. in c.c. Per- Per- Per-
centage Per centage Per centage Per of diem. of diem. of diem.
urine, urine. urine.
20 milligrammes Cobra venom (two minimum
1904- April 8 ............ No urine passed.
f 760
,
9 ......... to 1015 acid 0 603 6 03 0 518 5-18 0 085 0 -85 ' 1000 J
690 10 ......... to 1015 acid 0 483 4 -83 0 409 4 -09 0 -074 0 74
1000 500 }
,, 11 ......... to 1015 acid 0 440 4 40 0-372 3 72 0-068 0 68 L 1000
Averages after
April 9, 10, , nd 11 ....................................... 509 509 0433 433 0 076 076
The minimum lethal dose of the venom as determined is 0-00025 gramme per kilogramme of body weight. Aseptic precautions were used. The effects of this
injection were studied for five days and a second injection of 2-5 milligrammes Cobra venom dissolved in 1 c.c. saline solution was injected on the 25th at 9.30 A.M. and the examination of the urine carried on till November 30.
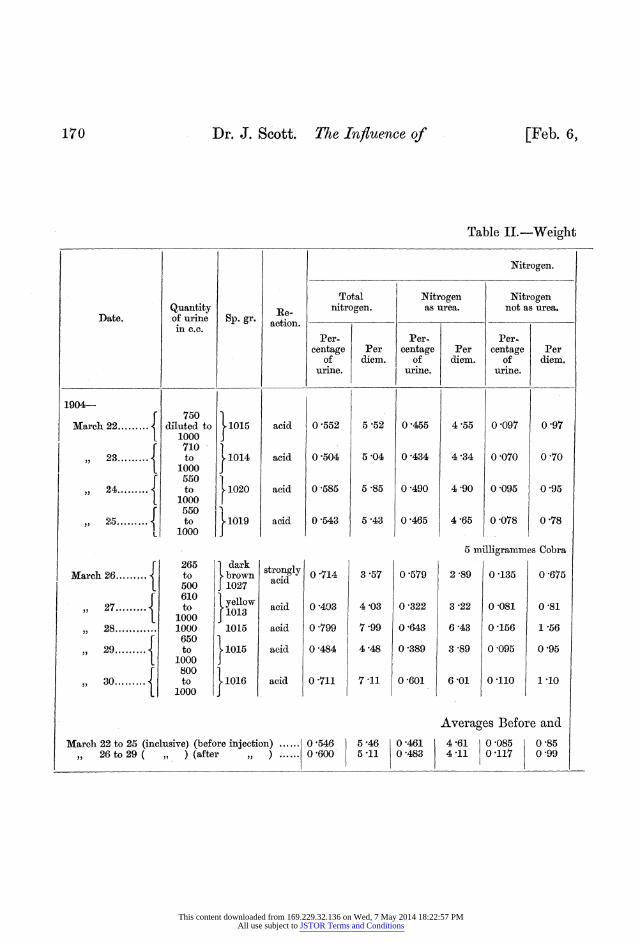
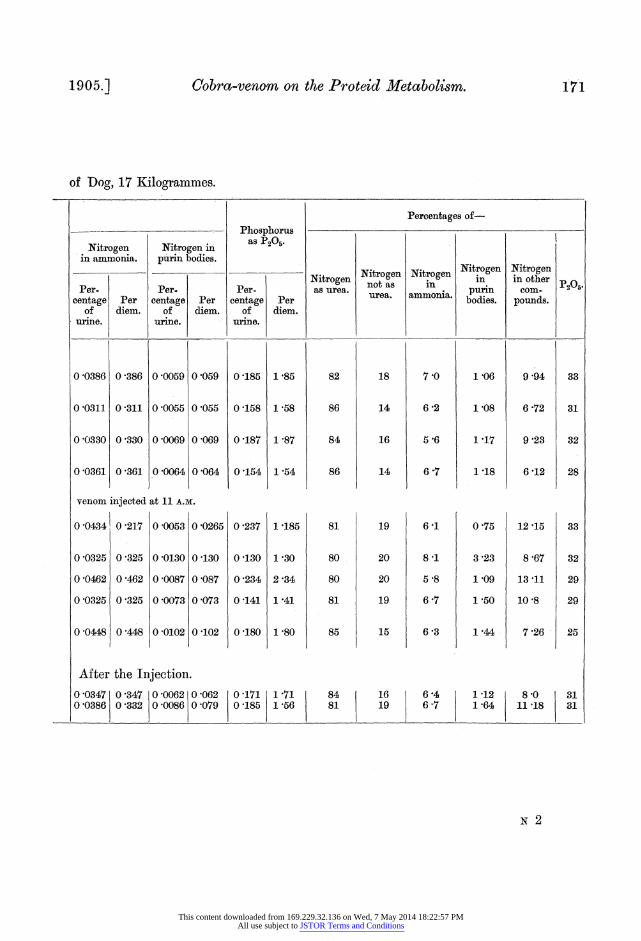
Experiment 2.
For this experiment a collie, weighing 17 kilogrammes, was used. The same precautions were taken and the same amount of food given.
The analyses of the urine were begun on March 22, 1904, and on the 26th 5 milligrammes Cobra venom in 0'5 c.c. sterilised normal saline solution were
injected subcutaneously in the side at 11 A.M. A few hours after the injection the dog vomited, but there was no other symptom. The effects of the venom weie studied till the 30th.
This content downloaded from 169.229.32.136 on Wed, 7 May 2014 18:22:57 PMAll use subject to JSTOR Terms and Conditions
1905.] Cobra-venom on the Proteid Metabolism. 173
III.
Percentages of-
Phosphorus as P205.
Nitrogen Nitrogen in P in ammonia. purin bodies.
....................... Nitrogen Nitrogen Nitrogen Nitrogen Nitrogen Nitrogen Nitroe in in other Per- Per- Per- as urea. not as in purin com- P2o5 urea. ammonia-
centage Per centage Per centage Per urea. amonia. bodies. pounds. of diem. of diem. of diem.
urine. urine, urine.
lethal doses) injected at 1 P.M. on April 8.
0-0408 0-408 0'0084 0-084 0-104 1 04 86 14 6'8 1 39 5'81 17
0-0314 0 314 0-0076 0-076 0-111 1 11 85 15 6 5 1-57 6-93 23
0 0316 0 316 0 0066 0 066 0 124 1 24 85 15 7 '2 1 50 6 30 28
the injection.
0-03461 0346 0-0075 0-075 0-113 1-13 85 15 638 1-49 6 35 23
Experiment 3.
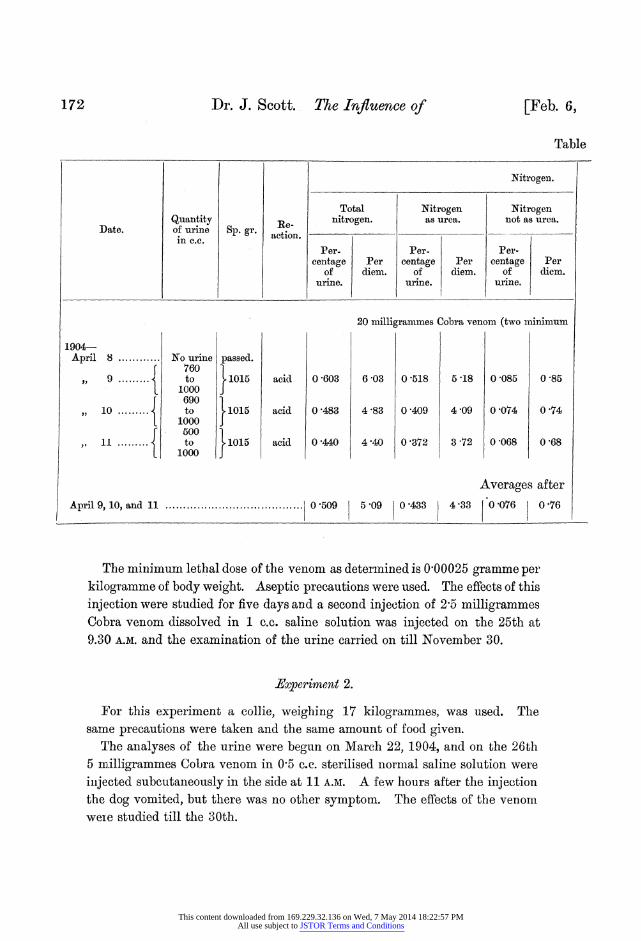
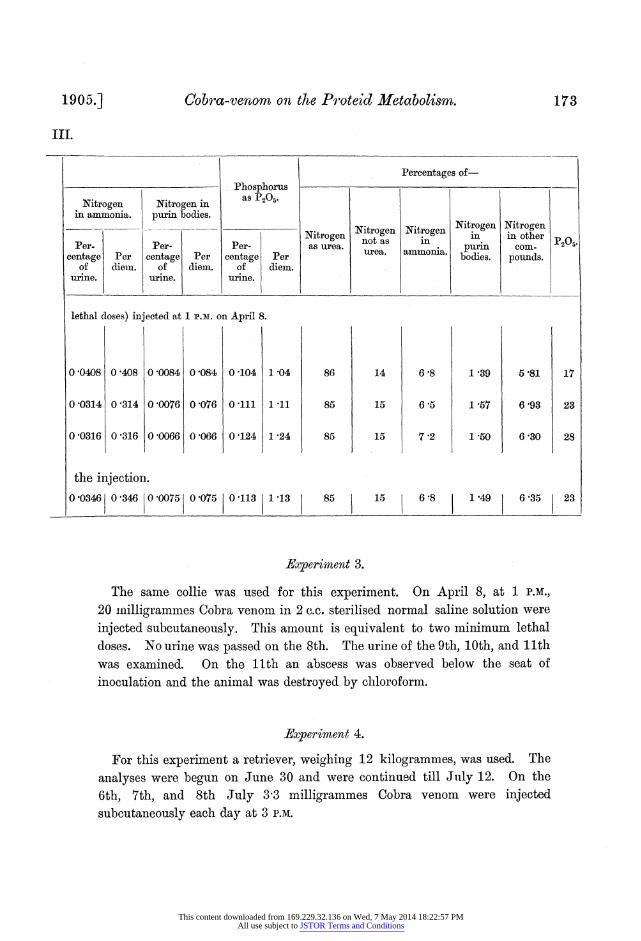
The same collie was used for this experiment. On April 8, at 1 P.M.,
20 inilligrammes Cobra venom in 2 c.c. sterilised normal saline solution were
injected subcutaneously. This amount is equivalent to two minimum lethal doses. No urine was passed on the 8th. The urine of the 9th, 10th, and 11th was examined. On the 11th an abscess was observed below the seat of inoculation and the animal was destroyed by chloroform.
Experiment 4.
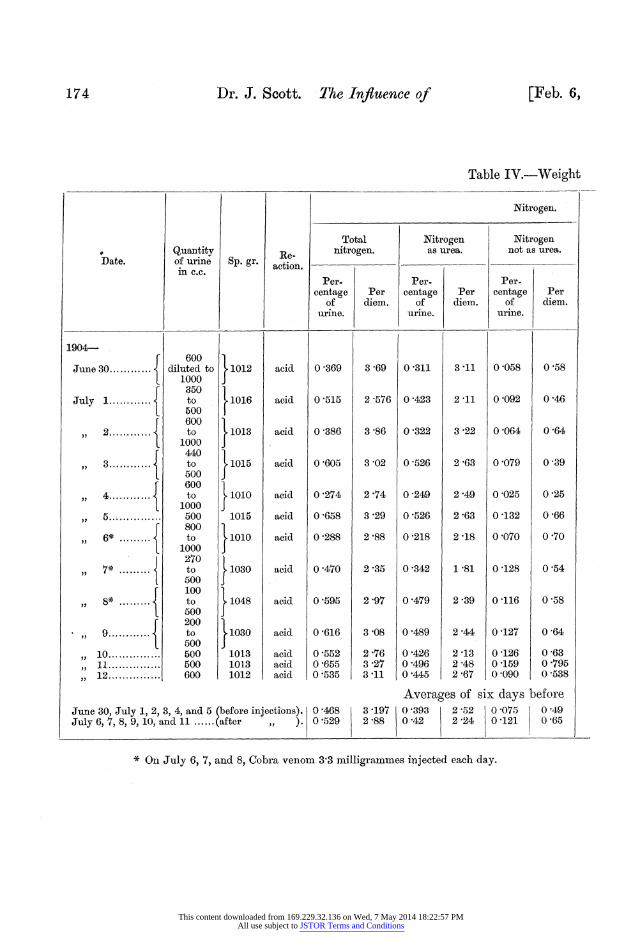
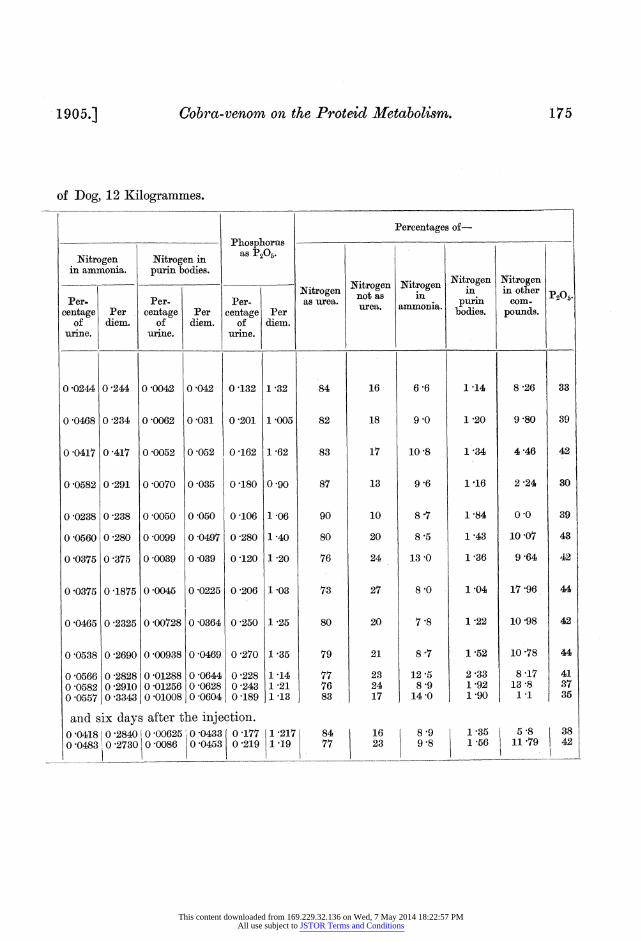
For this experiment a retriever, weighing 12 kilogrammes, was used. The
analyses were begun on June 30 and were continued till July 12. On the
6th, 7th, and 8th July 3-3 milligrammes Cobra venom were injected subcutaneously each day at 3 P.M.
This content downloaded from 169.229.32.136 on Wed, 7 May 2014 18:22:57 PMAll use subject to JSTOR Terms and Conditions
174 Dr. J. Scott. The Influence of [Feb. 6,
Table IV.-Weight
Nitrogen.
Total Nitrogen Nitrogen ,+ Quantity Re- nitrogen. as urea. not as urea.
Date. of urine Sp. gr. action in c.c.
Per- Per- Per- centage Per centage Per centage Per
of diem. of diem. of diem. urine. urine, urine.
1904---
June 30 ............
July 1............
2, 2 { ,,2 ............
8. 4 { ............
7*.
,, 8*
,,
9 ............
10............... 11............... 12...............
600 diluted to
1000 350 to 500 600 to
1000 440 to 500 600 to
1000 500 800 to
1000 270 to 500 100 to 500 200 to 500 500 500 600
1012
1016
1013
1015
1010
1015
1010
1030
1048
1030
1013 1013 1012
acid
acid
acid
acid
acid
acid
acid
acid
acid
acid
acid acid acid
0 369
0 515
0 386
0 605
0 274
0 658
0 -288
0 470
0 -595
0 -616
0 -552 0 -655 0 -535
3 -69
2 '576
3 86
3 02
2 -74
3 29
2 '88
2 '35
2 -97
3 08
2 76 3 27 3 11
0 311
0 423
0 '322
0 -526
0 '249
0 -526
0 218
0 -342
0 479
0 489
0 426 0 '496 0 445
3 '11
2 '11
3 -22
2 -63
2 '49
2 -63
2 -18
1 '81
2 '39
2 -44
2 -13 2 '48 2 -67
0 058
0 092
0 '064
0 '079
0 025
0 132
0 070
0 128
0 116
0 127
0 126 0 159 0 090
0 58
0 46
0 -64
0 39
0 25
0 -66
0 70
0'54
0 58
0 64
0 '63 0 795 0 538
June 30, July 1, 2, 3, 4, and 5 (before injections). 0 '468 July 6, 7, 8, 9, 10, and 11 ...... (after ,, ). 0 529
Averages of six days before 3 197 0 393 2 52 0 075 0 49 2-88 0'42 2-24 0-121 0 -65
* On July 6, 7, and 8, Cobra venom 3'3 milligrammes injected each day.
This content downloaded from 169.229.32.136 on Wed, 7 May 2014 18:22:57 PMAll use subject to JSTOR Terms and Conditions
1905.] Cobra-venom on the Proteid Metabolism. 175
of Dog, 12 Kilogrammes.
Percentages of-
Phosphorus as P205.
Nitrogen Nitrogen in in ammonia. purin bodies.
PNitrogen Nitrogen irogen itrogen Nitrogen nin in other
Per. Per- Per- as urea. not as n. purin co- centage Per centage Per centage Per bodies. pounds.
of diem. of diem. of diem. urine. urine, urine.
0-0244 0 244 0 0042 0 042 0 132 1-32 84 16 6 6 1 14 8 26 33
0-0468 0 234 0 0062 0 031 0 201 1 005 82 18 9 0 1 20 9 80 39
0-0417 0-417 0 0052 0 052 0-162 1-62 83 17 10-8 1 34 4-46 42
0-0582 0 291 0'0070 0-035 0-180 0-90 87 13 9-6 1 16 2 24 30
0-0238 0-238 0(0050 0-050 0'106 1-06 90 10 8 7 1-84 0-0 39
0 0560 0 280 0 0099 0 '0497 0 280 1 -40 80 20 8-5 1 43 10 -07 43
0 0375 0 375 0-0039 0-039 0 120 1 20 76 24 13 -0 1 36 9 64 42
0 0375 0 1875 0(0045 0 0225 0 206 1 -03 73 27 8 0 1 -04 17 -96 44
0 0465 0 2325 0 00728 0-0364 0 250 1 -25 80 20 7 8 1 -22 10 98 42
0-0538 0-2690 0-00938 0-0469 0-270 1 35 79 21 8 7 1 52 10 78 44
0 0566 0-2828 0-01288 0-0644 0-228 1 14 77 23 12*5 2 33 8-17 41 0-0582 0-2910 0 01256 0 0628 0-243 1-21 76 24 8 9 1 92 13 -8 37 0 0557 0 3343 0 01008 0-0604 0-189 1 13 83 17 14-0 1 90 1-1 35
and six days after the injection. 0 -0418 0 -28401 0 -00625 0 00433 0 177 1 217 84 16 8-9 1-35 5 -8 38 0-0483 0'273010 0086 0-0453 0 -219 1 77 23 9-8 1-56 11-79 42
This content downloaded from 169.229.32.136 on Wed, 7 May 2014 18:22:57 PMAll use subject to JSTOR Terms and Conditions
176 Dr. J. Scott. The Influence of
General Results.
No albumin was ever passed as the results of any injections.
[Feb. 6,
Experiments.
I. ; II. I III. IV.
Per- Per- Per- Per- centage Per centage Per centage Per centage Per
of diem. of diem. of diem. of diem. urine. urine. urine, urine.
Averages before injection of venom ........................ 0 919 4 59 0 546 5 46 0 546 5-46 4 68 3 197
Averages after 1st injection ... 0 954 4 77 0 600 5 11 - - - Averages after 2nd injection ... 0 -751 4-22 - - 0 509 5 09 - -
After three injections ............ 5 29 2 '88
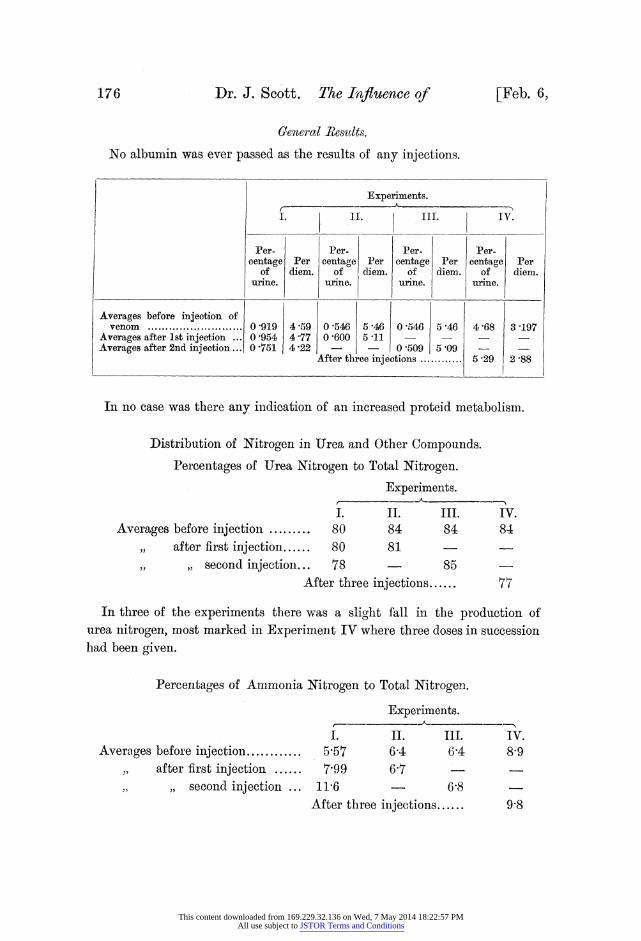
In no case was there any indication of an increased proteid metabolism.
Distribution of Nitrogen in Urea and Other Compounds.
Percentages of Urea Nitrogen to Total Nitrogen.
Experiments.
I. II. III. IV. Averages before injection ......... 80 84 84 84
,, after first injection ...... 80 81
7.,, second injection... 78 -85 After three injections...... 77
In three of the experiments there was a slight fall in the production of urea nitrogen, most marked in Experiment IV where three doses in succession had been given.
Percentages of Ammonia Nitrogen to Total Nitrogen.
Experiments.
I. II. III. Averages before injection ............ 5'57 6'4 6'4
,, after first injection ...... 7'99 6'7 ,, ,, second injection ... 11-6 - 68
After three injections......
IV. 89
9-8
This content downloaded from 169.229.32.136 on Wed, 7 May 2014 18:22:57 PMAll use subject to JSTOR Terms and Conditions
1905.] Cobra-venom on the Proteid Metabolism. 177
In Experiment I there was a marked rise and in Experiment IV a slight rise, while the changes in the other two were in the same direction.
Percentages of Nitrogen in Purin Bodies to Total Nitrogen.
Averages before injection............ ,, after first injection ......
, , , second injection ...
0 1 1
Experiments.
I. II. III. IV 1'85 1-12 1-12 1-3 ?18 164 - -
-16 - 1-49 After three injections...... 1-5
These changes show a slight rise in each experiment.
Percentages of Nitrogen in Other Compounds to Total Nitrogen.
Averages before injection............ ,, after first injection ...... ,, ,, second injection ...
Experiments.
I. II. III. IV. 13-91 8-11 8-11 5-8 10-58 11-18 - 8-89 - 635 -
After three injections...... 11-78
In two experiments there was a rise and in two a fall.
Percentages of P20 to Total Nitrogen.
Experiments.
Averages before injection ..........
,, after first injection....... ,. ,, second injection
I. II. III. .. 23 31 31
. 29 31 - 28 - 23
After three injections......
In two experiments a rise, in one no change, and in one a fall. The variations in the P20 do not correspond to the changes in the purin bodies.
Conclusions.
1. Practically no change in rate of proteid metabolism was induced by the administration, in spite of well marked local reaction.
5
6
IV. 38
42
This content downloaded from 169.229.32.136 on Wed, 7 May 2014 18:22:57 PMAll use subject to JSTOR Terms and Conditions
178 Influence of Cobra-venom on the Proteid Metabolism.
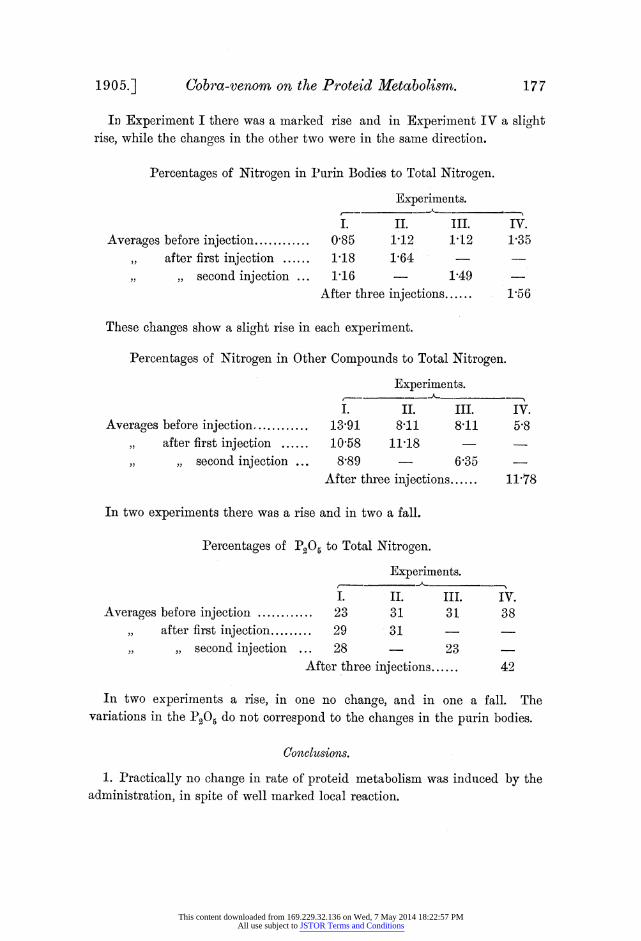
2. A slight decrease in the proportion of urea nitrogen, quite insignificant compared with that produced by diphtheria toxine and various drugs, was observed.
3. A slight rise in the proportion of ammonia nitrogen occurred. 4. There was a slight rise in the proportion of nitrogen in purin bodies. 5. The nitrogen in other compounds showed no constant change. 6. The P205 excreted showed no constant change, but in two experiments
there was a slight rise. The change produced in the proteid metabolism is, therefore, small, and
such as it is, being in the directions of decreased elaboration of urea and increase in the proportion of nitrogen excreted as ammonia, it seems to indicate a slight toxic action on the hepatic metabolism rather than a general action on the proteid changes; and tends to confirm the view that the poison acts chiefly upon the nervous system.
This content downloaded from 169.229.32.136 on Wed, 7 May 2014 18:22:57 PMAll use subject to JSTOR Terms and Conditions