274
THE INFLUENCE OF INCENTIVES AND REWARDS ON TEACHERS WORK PERFORMANCE IN MBEYA REGION, TANZANIA MSUSI, KELVIN LUSEKELO

i
THE INFLUENCE OF INCENTIVES AND REWARDS ON TEACHERS
WORK PERFORMANCE IN MBEYA REGION, TANZANIA
MSUSI, KELVIN LUSEKELO
A THESIS SUBMITTED IN FULFILMENT OF THE REQUIREMENTS FOR
THE DEGREE OF MASTER OF EDUCATION OF THE OPEN
UNIVERSITYOF TANZANIA
2016

ii
CERTIFICATION
The undersigned certifies that he has read and hereby recommends for acceptance by
the Open University of Tanzania a thesis entitled: “The Influence of Incentives and
Rewards on Teachers Work Performance in Mbeya Region, Tanzania”, in fulfilment
of the requirements for the award of degree of Masters of Education of the Open
University of Tanzania.
……………………………………….Prof. Issa Mcholo Omari
……………………………………..Date

iii
COPYRIGHT
No part of this thesis may be reproduced, stored in any retrieval system, or
transmitted in any form by any means, electronic, mechanical, photocopying,
recording or otherwise without prior written permission of the author or the Open
University of Tanzania in that behalf.

iv
DECLARATION
I, Msusi, Kelvin Lusekelo, do hereby declare that this thesis is my own original work
and that it has not, and will not be presented for a similar or any other award to any
other university.
……………………………………….Msusi, Kelvin Lusekelo
…………………..…………..Date

v
DEDICATION
I would like to dedicate this work to my children Ummy with her son Kelvin Jr., and
her twin sister and brother, Cynthia and Bill Msusi.
.

vi
ACKNOWLEDGEMENTS
May I give special thanks to Almighty God for giving me wisdom, knowledge, gift
of life and the capacity to be able to pursue my higher educational achieve.
My sincere and heartfelt thanks go to my lovely wife Lwiza K. Msusi for her moral
and financial support rendered to me throughout the course and my entire academic
journey. Without her support, help, advice, guidance and encouragement, the study
could not have been a success. Special thanks to my supervisor Prof. Issa Mcholo
Omari who helped me and kindly guided me throughout the research work from
research proposal development up to production of the report; I say may the
Almighty God continue to bless you abundantly.
Special thanks to my former students for the contributions toward my studies
namely, Sunday Charles, Mussa Msigwa, Semmy Yusuf Laiton, Pius Elias Msusi,
Veronica Mawila, and Omega Moses. I would like to thank also my friends for their
support namely, Juma Zakaria, Rehema Hamisi, Kiselelo Mwasandende, Bahati
Aden and Lugano Mwambaja.
Lastly, but not least, my thanks go to all teachers, district educational officers and
regional educational officers that are based in Mbeya region for their cooperation
and support during the field study.

vii
ABSTRACT
Teachers’ high performance in schools has been discussed lot throughout the world
by many researchers. The objective to the study in general was to explore the
influence of incentives and rewards on teachers’ work performance. The specific
objectives of the study were, to examine how teachers’ recognition as reward
influence teachers’ work performance, to assess how provision of accommodation as
incentives improves teachers’ work performance and to find out whether salary level
as incentive and salary increment as reward improve teachers’ work performance.
The study employed interview to 10 educational stakeholders including one
Regional Educational officer, three District Educational officers, four Heads of
schools and two Educational Administrative officers (TSD and School Inspector).
The main findings showed that; Teachers’ recognition influence work performance,
as most respondents agreed and from the interview done. Also the findings showed
that the provision of good and quality accommodation facilities improve teachers’
work performance. The salary level and increment has been found from the study
that it improve work performance. For the it was concluded that teachers’ work
performance is influenced by provision of incentives and rewards, thus it is
recommended that the government should introduce the recognition system to
teachers, maintain the teachers salary payment in time, build quality houses for
teachers and facilitate transport to and from schools, make teacher aware of their
rights, provide hardship allowance and the general teaching allowance.

viii
TABLE OF CONTENTS
CERTIFICATION.....................................................................................................ii
COPYRIGHT............................................................................................................iii
DECLARATION.......................................................................................................iv
DEDICATION............................................................................................................v
ACKNOWLEDGEMENTS......................................................................................vi
ABSTRACT..............................................................................................................vii
TABLE OF CONTENTS.......................................................................................viii
LIST OF TABLES..................................................................................................xiv
LIST OF FIGURES.................................................................................................xv
LIST OF ABBREVIATION..................................................................................xvii
CHAPTER ONE.........................................................................................................1
1.0 BACKGROUND TO THE PROBLEM.............................................................1
1.1 Introduction of the Chapter..............................................................................1
1.2 Background to the Problem..............................................................................1
1.3 Statement of the Problem.................................................................................5
1.3 Objectives of the Study....................................................................................6
1.3.1 General Objective.............................................................................................6
1.3.2 Specific Objectives...........................................................................................6
1.4 Research Questions..........................................................................................7
1.5 Scope of the Study and Delimitation................................................................7
1.6 Limitation of the Study....................................................................................7
1.8 Significance of the Study.................................................................................8
1.9 Organisation of the Thesis................................................................................8

ix
1.10 Conceptual Frame Work..................................................................................9
CHAPTER TWO......................................................................................................11
2.0 LITERATURE REVIEW..................................................................................11
2.1 Introduction of the Chapter............................................................................11
2.2 People Management and Work Performance.................................................11
2.3 Incentives and Work Performance.................................................................16
2.4 Rewards and Work Performance....................................................................21
2.4.1 Intrinsic Rewards............................................................................................21
2.4.2 Extrinsic Rewards..........................................................................................23
2.5. Differences between Incentives and Rewards................................................25
2.6 Effectiveness of Incentives and Rewards at Workplace................................26
2.7 Motivation and Work Performance.............................................................28
2.7.1 Intrinsic and Extrinsic Motivation...............................................................29
2.7.2 Theories of Motivation................................................................................31
2.7.2.1 Maslow's Hierarchy of Needs’ Theory........................................................31
2.7.2.2 Herzberg's Motivation- Hygiene Theory.....................................................33
2.7.2.3 Equity Theory of Motivation.......................................................................36
2.7.2.4 Alderfer’s Theory of Motivation.................................................................37
2.7.3 The Attention, Relevance, Confidence and Satisfaction
Model of Motivation...................................................................................38
2.7.4 Components of Human Motivation.............................................................40
2.7.5 Interaction between Intrinsic and Extrinsic Motivations............................43
2.8 Influence of Teachers’ Recognition and Work Performance......................48

x
2.9 Provision of Accommodation and Improvement of Teachers’
Work Performance......................................................................................50
2.10 Increase in Salaries and Allowances and Work Performance........................52
2.11 Synthesis and Research Gap..........................................................................60
CHAPTER THREE.................................................................................................61
3.0 RESEARCH METHODOLOGY......................................................................61
3.1 Introduction of the Chapter............................................................................61
3.2 Study Area......................................................................................................61
3.3 Research Approach........................................................................................61
3.4 Research Design.............................................................................................62
3.5 Sampling Procedures......................................................................................62
3.6 Sample and Sample Size................................................................................63
3.7 Respondents’ Profile......................................................................................63
3.7.1 Gender of Respondents..................................................................................64
3.7.2 Age of Respondents.......................................................................................65
3.7.3 Highest Education Level Attained by Respondents.......................................67
3.7.4 Employment Status of Respondents...............................................................69
3.8 Data Collection Instruments...........................................................................71
3.8.1 Primary Sources of Data................................................................................71
3.8.1.1 Interview for Heads of Schools and Districts Education Officers.................71
3.8.1.2 Questionnaires for Teachers...........................................................................72
3.8.2 Secondary Sources of Data............................................................................72
3.9 Validity and Reliability of Instruments..........................................................73

xi
CHAPTER FOUR....................................................................................................76
4.0 DATA PRESENTATION AND ANALYSIS...................................................76
4.1 Introduction of the Chapter.........................................................................76
4.2 Teachers’ Recognition and Work Performance..........................................76
4.3 Provision of Accommodation and Work Performance...............................78
4.4 Salary Levels and Allowances and Work Performance..............................80
4.5 Visual Presentation of Responses to Individual Items................................82
4.5.1 Incentives Items for Respondents...............................................................82
4.5.1.1 Medical Assistance to Family Members.....................................................82
4.5.1.2 Provision of Loans for Purchase of Vehicles..............................................83
4.5.1.3 Provision of Burial Support........................................................................84
4.5.1.4 Children Education Support........................................................................85
4.5.1.5 Given Accommodation According to Family Size.....................................86
4.5.1.6 Reasonable Distance from Teachers’ Residence to School........................87
4.5.1.7 Negotiated House Rent...............................................................................88
4.5.1.8 Secured Housing Provided..........................................................................89
4.5.1.9 Standard Toilet provided.............................................................................90
4.5.1.10 Availability of Garden at Teachers’ Houses...............................................91
4.5.1.11 Standard Kitchen Provided.........................................................................92
4.5.1.12 Security Guard Unit Available....................................................................93
4.5.1.13 Salaries Payment in Time............................................................................94
4.5.1.14 Regular Annual Increase of Salary and Wages...........................................95

xii
4.5.1.15 Doubling Transport Allowance................................................................96
4.5.1.16 Provision of Transfer Transport Allowance.............................................97
4.5.1.17 Provision of Hardship Settlement Allowance..........................................98
4.5.1.18 Provision of Education Studies Allowance..............................................99
4.5.2 Rewards Items for Respondents.............................................................100
4.5.2.1 Provision of Certificates of Appreciation...............................................100
4.5.2.2 Provision of Part Time Payments...........................................................101
4.5.2.3 Rewarding Better Teachers in Routine Duties performance..................102
4.5.2.4 Rewarding High Performers...................................................................104
4.5.2.5 Provision of Trips and Tours for High Performers................................105
4.5.2.6 Annual Announcements for Good Performers.......................................106
4.5.2.7 Assistance for Water Rent Paid..............................................................107
4.5.2.8 Assistance for Electricity Rent Paid.......................................................107
4.5.2.9 Provision of Hourly Allowances............................................................108
4.5.2.10 Doubling Teachers’ Salary.....................................................................109
4.5.2.11 Increase Teachers’ Salary by 50%.........................................................110
4.5.2.12 Provision of Annual Bonuses.................................................................111
CHAPTER FIVE....................................................................................................122
DISCUSSION OF THE FINDINGS.....................................................................113
5.1 Introduction of the Chapter....................................................................113
5.3.1 Incentives for Improvement of Work Performance...............................117
CHAPTER SIX.......................................................................................................122
SUMMARY, CONCLUSIONS AND RECOMMENDATIONS........................122
6.2 Summary of the Study...............................................................................122

xiii
6.3 Conclusions of the Study...........................................................................123
6.4 Recommendations for Actions and Further Research...............................126
REFERENCES.......................................................................................................128
APPENDICES........................................................................................................140

xiv
LIST OF TABLES
Table 2.1: Differences between Incentives and Rewards ........................................... 25
Table 2.2: Effectiveness of Incentives and Rewards for 165 US Executives ............ 27
Table 2.3: Motivator and the Hygiene Factors ........................................................... 34
Table 3.1: Distribution of Respondents by Gender .................................................... 65
Table 3.2: Distribution of Respondents by Age ......................................................... 67
Table 3.3: Distribution of Respondents by Educational Levels ................................. 69
Table 4.1 Specific objective (i) Responses: To Examine How Teachers’
Recognition Influence Teachers’ Work Performance .............................. 78
Table 4.2 Specific objective (ii) Responses: To Assess How Provision of
Accommodation Improves Teachers’ Work Performance ....................... 80
Table 4.3 Specific objective (iii) Responses: To Find Out if Salaries and
Allowances Improve Teachers’ Work performance ................................ 82

xv
LIST OF FIGURES
Figure 1.1: A Conceptual Framework for the Study ................................................. 11
Figure 2.1 Maslow’s Hierarchy of Human Needs ...................................................... 33
Figure 3.1: Distribution of Respondents by Gender .................................................. 65
Figure 3.2: Distribution of Respondents by Age ........................................................ 68
Figure 3.3: Distribution of Respondents by Highest Education
Level Attained .......................................................................................... 70
Figure 4.1: Respondents’ Opinion on Medical Assistance to
Family Members ...................................................................................... 84
Figure 4.2: Respondents’ Opinion on Provision of Loans for Purchase
of vehicles ................................................................................................ 85
Figure 4.4: Respondents’ Opinion on Children Education Support ........................... 87
Figure 4.5: Respondents’ Opinion on the Accommodation Given
According to Family Size ......................................................................... 88
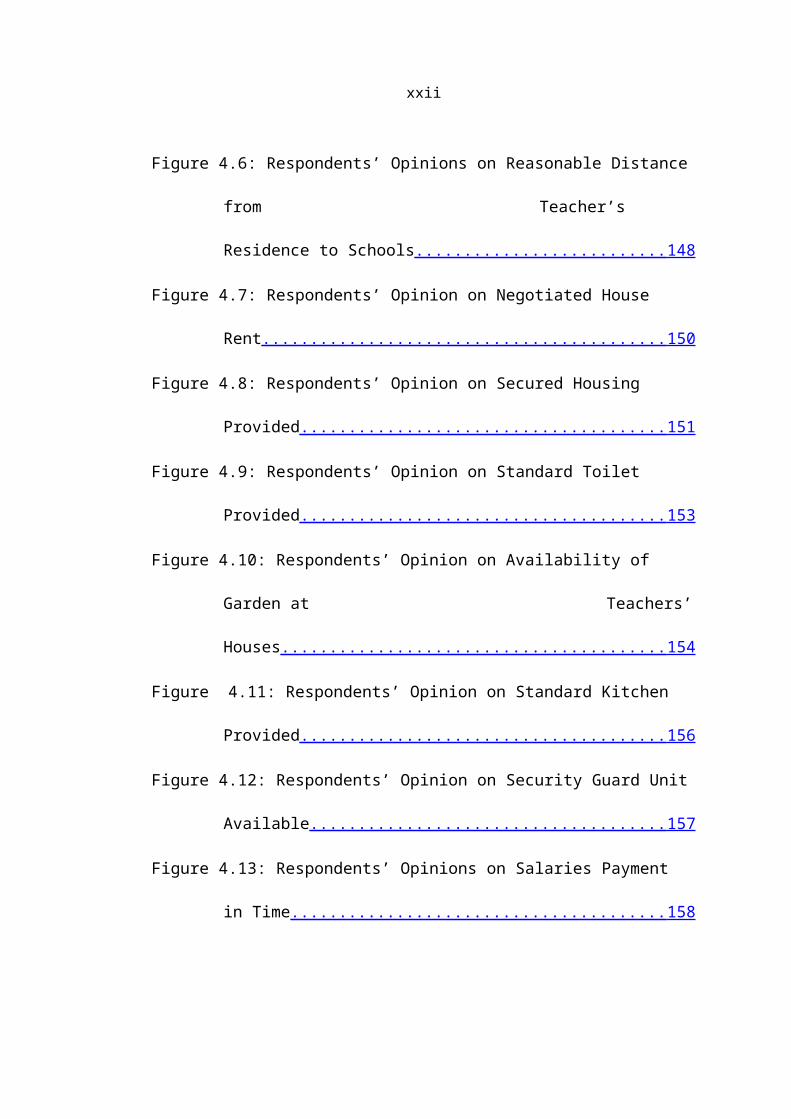
Figure 4.6: Respondents’ Opinions on Reasonable Distance from
Teacher’s Residence to Schools ............................................................... 89
Figure 4.7: Respondents’ Opinion on Negotiated House Rent .................................. 90
Figure 4.8: Respondents’ Opinion on Secured Housing Provided ............................. 91
Figure 4.9: Respondents’ Opinion on Standard Toilet Provided ............................... 92
Figure 4.10: Respondents’ Opinion on Availability of Garden at
Teachers’ Houses ..................................................................................... 93
Figure 4.11: Respondents’ Opinion on Standard Kitchen Provided ......................... 94
Figure 4.12: Respondents’ Opinion on Security Guard Unit Available .................... 95
Figure 4.13: Respondents’ Opinions on Salaries Payment in Time ........................... 96

xvi
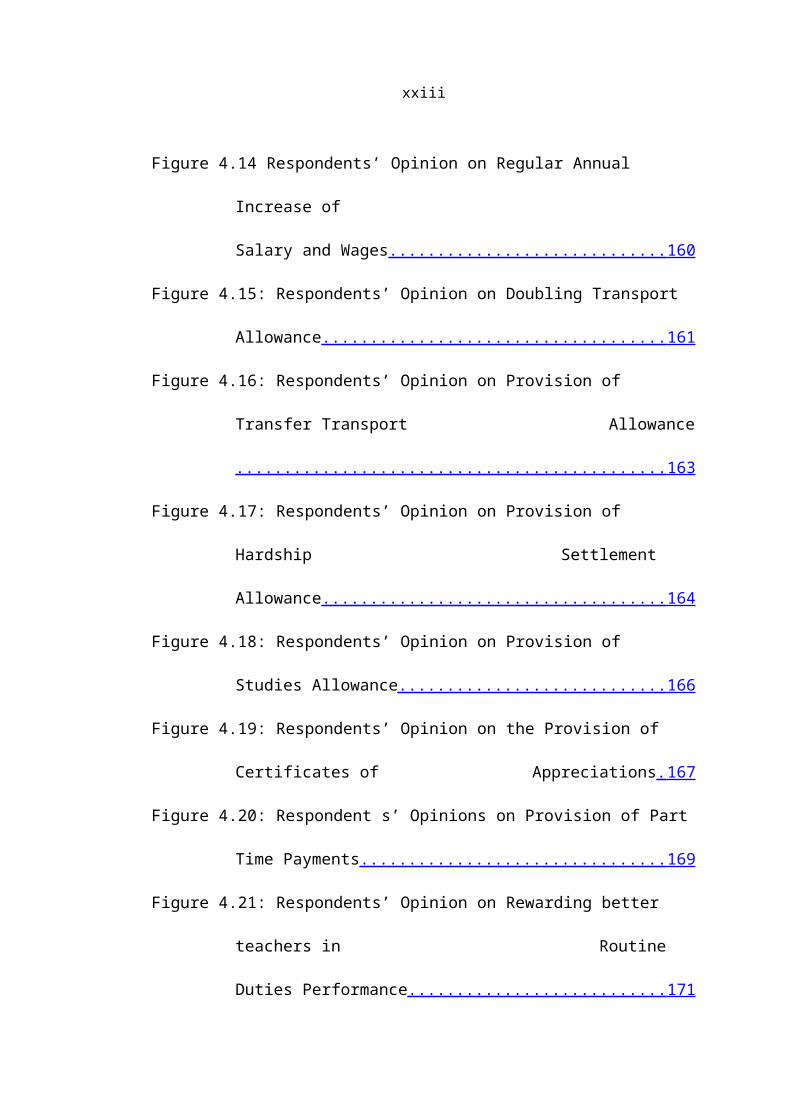
Figure 4.14 Respondents’ Opinion on Regular Annual Increase of
Salary and Wages .................................................................................. 97
Figure 4.15: Respondents’ Opinion on Doubling Transport Allowance ................... 98
Figure 4.16: Respondents’ Opinion on Provision of Transfer Transport
Allowance .............................................................................................. 99
Figure 4.17: Respondents’ Opinion on Provision of Hardship
Settlement Allowance ......................................................................... 100
Figure 4.18: Respondents’ Opinion on Provision of Studies Allowance ................. 101
Figure 4.19: Respondents’ Opinion on the Provision of Certificates of
Appreciations ...................................................................................... 102
Figure 4.20: Respondent s’ Opinions on Provision of Part Time Payments ............ 103
Figure 4.21: Respondents’ Opinion on Rewarding better teachers in
Routine Duties Performance ............................................................... 105
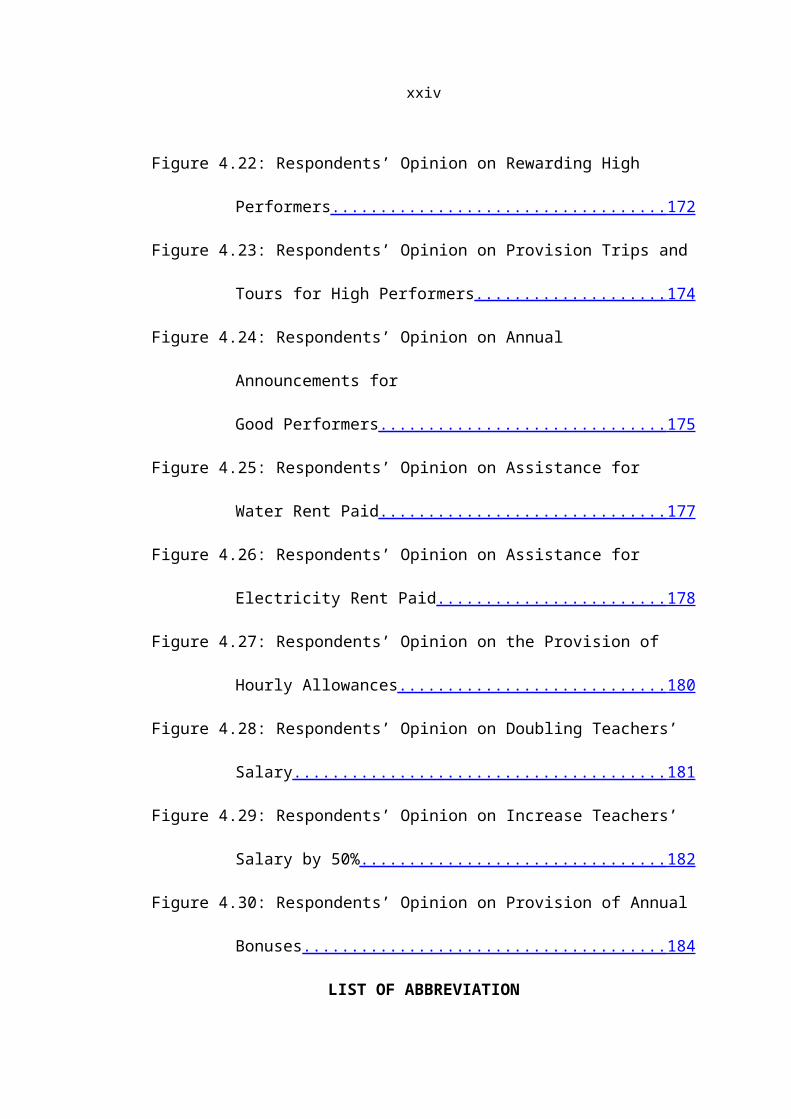
Figure 4.22: Respondents’ Opinion on Rewarding High Performers ...................... 106
Figure 4.23: Respondents’ Opinion on Provision Trips and Tours for High
Performers ........................................................................................... 107
Figure 4.24: Respondents’ Opinion on Annual Announcements for
Good Performers ................................................................................. 108
Figure 4.25: Respondents’ Opinion on Assistance for Water Rent Paid ................. 109
Figure 4.26: Respondents’ Opinion on Assistance for Electricity Rent Paid .......... 110
Figure 4.27: Respondents’ Opinion on the Provision of Hourly Allowances .......... 111
Figure 4.28: Respondents’ Opinion on Doubling Teachers’ Salary ........................ 112
Figure 4.29: Respondents’ Opinion on Increase Teachers’ Salary by 50% ............. 113
Figure 4.30: Respondents’ Opinion on Provision of Annual Bonuses .................... 114

xvii
LIST OF ABBREVIATION
ARCS Attention, Relevance, Confidence and Satisfaction
CIPP Context, Input, Process and Product
CIT Critical Incident Technique
DEO District Educational Officer
ERG Existence, Relatedness and Growth
GDP Gross Domestic Product
HR Human Resources
MoEVT Ministry of Education and Vocational Training
OECD Organisation for Economic Co-operation Development
REO Regional Educational Officer
TGTS Tanzania Government Teachers Salaries
TSD Teachers Service Department
US United States

CHAPTER ONE
1.0 BACKGROUND TO THE PROBLEM
1.1 Introduction of the Chapter
This chapter covers several pillars of the study. The chapter includes the background
to the problem, statement of the problem, objectives and the questions of the study,
significance of the study, organisation of the thesis and conceptual framework of the
study.
1.2 Background to the Problem
The world has experienced the results from research on teachers’ high performance in
schools thus had been discussed on the issue variously. Darling-Hammond (1997)
viewed that high performance of schools depends on highly skilled teacher for its
success. Increasingly, research confirms that teachers and teaching quality are the
most powerfully predictor of students success (Hammond, 2010). The study by
Bennell and Mukyanuzi (2005) indicates that, motivation and good working
conditions are the main factor for teacher’s high performance. Further, the study
added that most of the teachers were working under tremendous pressures that result
to poor quality of education. Today, one of the few areas of consensus among
education policy maker, practitioners, and general public is improving teacher’s
quality as one of the most direct and promising strategy for improving education
performance.
In most countries, the importance of education ranks higher than any other service, in
America and Europe for instance they recognize it as a key to human social and
economic development (Muze, 1987). Meanwhile human capital, especially teacher
1

quality, is believed to be one of the most important inputs into education (Roland and
Fryer, 2008). In the developing countries includes Africa and Asia the role played by
teachers remained quite central. This is because; teachers are perhaps more than any
other professional groups have served the country loyally, with sacrifice and
dedication. Yet, todays, matters concerning their welfare such as salaries, fringe
benefits, status and hours of work appear to have been grossly neglected (Muze,
1987).
Tanzania like other developing countries is experiencing serious challenge such as
high cost of living, inflation, unemployment, economic and social insecurities
(Mlynsi, 1991). Their impacts touch different categories of human life including
education system. As a result it has affected both teachers work performance and
student result as well. Most of secondary schools in Tanzania lack teachers’
incentives including lowly paid, poor accommodation and inadequacy of better
pension benefits. The study by Mlyasi (1991) revealed that the most important source
of income for most teachers in Tanzania is the salary.
Chilumba (1994) in the study of factors affecting occupational status of teachers in
Tanzania mainland observed that Tanzania has involved itself over the years in
developing social and cultural attributes among its people informally, and at a later
date through a formal pedagogy. An overview of the historical development of
formal education in Tanzania indicates how the status of teachers has been perceived
overtime. The findings showed that the government had to train and supply the
teachers some essential such as teaching materials, transport cost and teachers’
houses. Furthermore, the government had to pay boarding costs and teachers’
2

salaries; however, the commitment to pay salaries was the most burdensome and
never fully met. Social salaries for teachers follow rank and differ through entry
qualification. Also, salaries are awarded upwards in three ways; through promotions,
by means of annual fixed increments for each grade category or during an increase of
the salary and wages. The most critical finding that emerges from his study is that
very sizeable proportions of the teachers in Tanzania have low levels of job
satisfaction and are poorly motivated.
Moshi (1997) argues that Tanzania’s education has been expanding according to the
predetermined national plans. To date, Tanzanian government has made several
attempt to improve education system includes reforms of education polices,
increasing number of teachers through admitting more teachers in colleges and
universities, increase of public schools, curriculum reforms, and assessment system
(Oluoch, 2006). Despite of all these attempts, the current situation is consistence with
the 1990s World Bank report on teachers’ conditions of service concluded that ‘in
the absence of incentives to perform better, many teachers are currently providing
much less and lower quality education than they are capable of the de-motivation of
teachers is a major contributory factor to the abysmally poor learning achievements
of primary and secondary students’ (World Bank, 1990).
While good salaries and allowances are found to be the leading factors for teachers
considered important in the proper execution of their job (Ester et al., 2012). The
study by Roland and Fryer (2008) views that one potential method to increase
student achievement and improve the quality of individuals selecting teaching as a
profession is to provide teachers with financial incentives for student achievement.
3

Theoretically, teacher’s incentives could have effects: If teachers lack motivation or
incentive to put into important inputs to the education production function for
example lesson planning and parental engagement it would lead to low level of work
performance. Financial incentives for student achievement may have a positive
impact by motivating teachers to increase their effort. However, if teachers do not
know how to increase student achievement, the production function has important
complementarities outside their control, or the incentives are either confusing or too
weak, teacher incentives may have no impact on achievement.
Teachers have been and continue to be spearheading the countries fight against one
of its enemies such as ignorance. They participate fully in literacy education
campaigns and in disuniting the people from superstition (Muze, 1987: 8). The
author goes further stating that teachers in this country have been responsible for
wholesale national enlightenment, cultural rehabilitation, political awakening and
even economic progress. This must be said and due to appreciation extended to the
teachers, they must be constantly encouraged.
In spite of all what teachers do, editors’ point out that they have contributed to low
educational standards without considering their working conditions. Whereby some
working conditions, which have always been considered important as far as teachers’
welfare is concerned, are housing, workloads, geographical locations, school
equipment’s and materials, type of school, size of classes and the curriculum. While
Salaries and allowances/wages still remained a major if not completely adequate
motivator for employees, the desire for increasing earnings still serves as the
4

principal incentive to improve skills, win merit increase, collect larger take home pay
form wage incentive systems (Moshi, 1997). Currently, little had been established to
understand the role of incentives and rewards on teachers work performance.
Therefore, it is against this study that aimed to explore the relationship between
incentives and teachers work performance in Mbeya Region, Tanzania.
1.3 Statement of the Problem
Decline of quality education in Tanzania has created debates among education
stakeholders including the ordinary people, private institutions and government
particularly on the causes of the decline of quality education. One side of the debate
are arguing that the declining of the quality education is due to the students who are
not well committed to their studies but they do concentrate to other matters such as
social media like Facebook, Twitter, WhatsApp and others. Also they spent much of
their time listening to ‘Bongo flava’ songs. Furthermore, they argue that parents are
not 100% engaged in following up the student’s performance.
In a similar vein some of the education stakeholders are claiming that the decline of
quality education is facilitated by the government by not providing enough incentives
in order to motivate primary and secondary school’s teacher hence poor working
performance of the teachers. Such motivations include fringe benefits, increased
salaries and allowances, appreciation and provision of quality housing. Among the
effects of poor working performance for teachers include; poor performance of
students in their exams, high rate of absenteeism, non-commitment to effective
teaching of students and inability to cover the syllabus within the required time.
5
Thus, the study will reveal to government the role of incentives to the teachers in
improving the quality of education in Tanzania.
To combat the problem some scholars have suggested various incentives.
Mwakilembe (1981) surveyed the opinion of teachers regarding the relationship of
lack of motivation and the exodus of teachers. The study found-out that different
preferences or rather demands of teachers have not yet been implemented to the
maximum level: chance for further education, accommodation, and good
administration. Bangi (2008) studied the influence of non-salary factors in teachers’
mobility, and recognized that there are some incentives that are used by some
institutions to increase teachers’ mobility: provision of housing, lunch, transport and
medical service, participation in decision making and profession development. The
study intends to shed light to the Tanzanian education stakeholders on the ways that
teachers can be motivated so as to improve their working performances in their
working places. Therefore, the study explored how incentives and rewards influence
teacher’s work performance to improve the quality of education using the case of
Mbeya Region.
1.3 Objectives of the Study
1.3.1 General Objective
The general objective of this study is to explore the influence of incentives and
rewards on teachers’ work performance in Mbeya Region, Tanzania.
1.3.2 Specific Objectives
i) To examine how teachers’ recognition as reward, influence teachers’
work performance,
6
ii) To assess how provision of accommodation as incentives, improves
teachers’ work performance, and
iii) To find-out if salary levels as incentives and increase in salary as rewards
for improve teachers work performance.
1.4 Research Questions
i) How does teachers’ recognition influence teachers’ work performance?
ii) How does provision of accommodation improve teachers’ work
performance?
iii) At what instance do the increase in salaries and allowances improve
working performance?
1.5 Scope of the Study and Delimitation
This study is confined at Mbeya Region in Tanzania. Several line of evidence
supported this selection. First Mbeya Region has many secondary schools both
community (ward) and government. Secondly, Mbeya Region being part of Tanzania
experiences the then situation of poor performance in schools as far as the
background of the problem is concerned. Thus, this study covered both community
and government’s secondary schools in exploring the role of accommodation,
rewards, salaries and wages as incentives and rewards in teachers working
performance. The community schools are the commonly known as ward schools.
1.6 Limitation of the Study
Limitation of the study are drawback that researcher has no control over them
(Masele, 2007). Throughout this study, the major limitation is expected in the
7
process of data collections methods. Also it was not necessary have all teachers at
once hence it have to be done by going to re-visit the schools and obtaining a
recommended number to represent the all. I some cases when using using
questionnaire some of the respondents’ can provide wrong answers also other may
deny to complete and return the questionnaire forms in time, hence tractability had to
be applied in barrier to risk taking.
1.8 Significance of the Study
This study is significant because it shed light to the governments and ministries
responsible for education regarding the role of financial incentives and rewards in
increasing teacher’s performance. Also the study would generate motives required
toward promoting teachers in high working performance in secondary schools. On
the other side, the study may be helpfully to on the measures to be taken to improve
education system in the country. Further, this study also save source of information
for other researchers who are interested with studies concerning teachers and their
working conditions.
1.9 Organisation of the Thesis
The thesis is organised into six chapters. Chapter one covers introduction and the
back ground to the problem. Chapter two focuses on the review of literature relevant
to the study. Its major concern is to identify the knowledge gap. Chapter three is
dealing with methodological issues, including data collection. Chapter four is for
data presentation and analysing the data related to the study in order to address the
identified knowledge gap. Chapter five comprises of discussion on the finding from
8

the study and chapter six is the summary, conclusion and recommendations. At the
end there are references and appendices.
1.10 Conceptual Frame Work
This study draws much from theories of motivation namely, Herzberg’s two factors
theory, Maslow’s hierarchy of needs theory, Equity Theory and Alderfer’s Theory of
Motivation to form a conceptual framework that will guide this study. These theories
underscore the fact that motivation is a crucial component of enhancing the
effectiveness and efficiency of employees. For instance, Herzberg’s two factors
theory submit that job satisfaction and job dissatisfaction are a function of motivation
(intrinsic and extrinsic motivation) among employees. This means that the level of
motivation among employees determines their efficiency and effectiveness at work.
The underlying assumption of the study is that, the provision of incentives brings
motivation which also leads to improved employees performance in an organisation.
Therefore, improved work performance is regarded as dependent variable whereas
incentives and rewards are regarded as independent variable for this study. It is
assumed in this framework that if incentives and rewards including recognition,
accommodations, and an increase of salary and allowances are provided to teachers,
the expected work performances will be achieved in schools. On the other hand, if
incentives are not provided to teachers, it will lower their motivation to work and
hence affect their work performance.
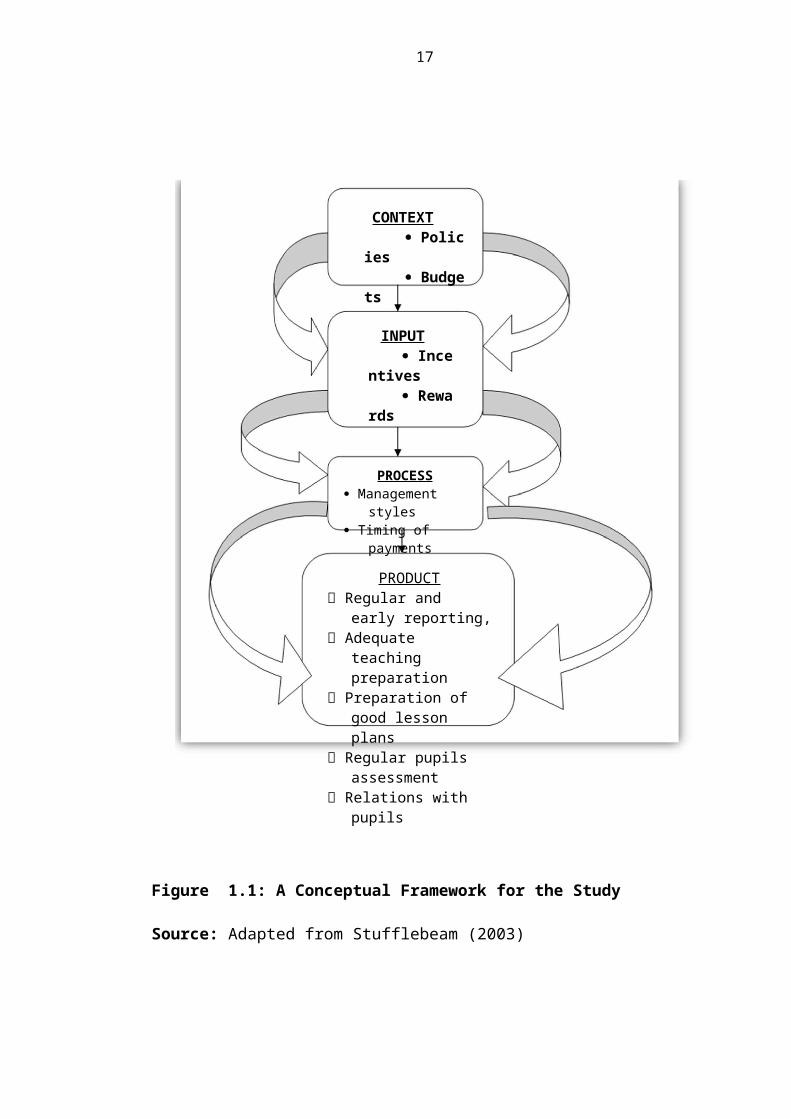
Stufflebream (2003) Context, Input, Process and Product (CIPP) model explain the
evaluation expressed in a sequence manner starting from the context, including the
policies and budgets. The inputs which are independent variables used at the second
9
stage, those are incentives and rewards. But they must go through a process which is
the third stage, for which management styles and timing in payments of the input
have to be observed (Stufflebeam 2003). The products which are then the output
have to complete the CIPP model, hence the outcomes of all of the combined
procedure occurs. For this study the products are of the teachers work performance
which includes regular and early reporting, adequate teaching preparations, good
lesson plan preparation, regular pupils’ assessment and relations with pupils.
10
CONTEXT Policies Budget
s
INPUT Incenti
ves Rewar
ds
PROCESS Management styles Timing of payments
PRODUCT Regular and early
reporting, Adequate teaching
preparation Preparation of good
lesson plans Regular pupils
assessment Relations with pupils

Figure 1.1: A Conceptual Framework for the Study
Source: Adapted from Stufflebeam (2003)
CHAPTER TWO
2.0 LITERATURE REVIEW
2.1 Introduction of the Chapter
The chapter is there as to present the discussion on related literature in discovery of
academic gap for the research problem. This chapter includes the following sub
topics; People management and work performance, incentives, rewards and work
performance motivation and work performance, motivation theories and then
incentives, rewards as motives to work performance, synthesis of the literature
review and a research gap.
2.2 People Management and Work Performance
Mullins (2005) highlighted the fact that in any organisation, though possessing
difference in cultural values, they have elements which are common and exactly
identical. These include people, objectives and structure. For that fact Mullins (2005)
suggestion was that in order for the people how are aiming in achieving the
objectives of the organisation within their structural interactively being positively
supporting value-added process as well as conversely impedes for the process to
succeed. People are the heart of any organisation for the value adding process in
strategic purposes (Mullins, 2005).
The component succeeds when dissemination and application organisation
11

knowledge thus be very essential element. Culture is one which identifies the
organisation, thus the awareness play an important role on organisational context for
which culture depends. The external environment which the organisation operates
becomes the next (Mullins, 2005).
The importance of culture is that which aimed at better understanding influencing
directly the performance and improve the relationship among the members in
everyday activities to which they are part of it (Parker, 2000). The technology is
changing in line to where the organisation operates; therefore there is then the
automatic change in the organisation to shape with the changing technology for
better performance and continuing successions for the given chance (Lassey, 1998).
So members at individual level of the organisation who wishes better performance
and continuing succeeding have to give opportunity to the environmental factors by
suck of technology development within or outside the organisation (Thomson, 2002).
Success is to be achieved when the organisation also gives itself as a learning
organisation. The reality that the organisation future success depends on the
innovative factor to its people maintaining their sense of esteem in their work coming
in response to the continued high level of productivity on their job (Thomson, 2002).
Organisation goal has to be made into consideration for the changing culture as well
as other necessary factors that contributes to effectiveness and management
performance.
The suggestion by Gratton, (2000) on the organisation which has to desire a higher
performance level has to build a model of trust and inspiration. To this type of design
there should be an influence of people understanding of the organisation value and
12

the involvement in decision making for such particular organisation to which their
belong, as well as the context the work as individual are concerned positively and
negatively for the impact of the organisation so as their contribute at a high level of
emotional investment for the success and achievement within their organisations
(Gratton, 2000). It is said that the needs of workers and their managers in
understanding the complexity of their organisation managerial structure and the
process is an important in comprehension of the essential facts in management of the
people within, to conquer the increasing change and uncertainty people may work
and achieve the organisation goal (Mullins, 2005).
A negative outcome may rise as when the staff being considered as a unit resource
more than human being, which will results to reduce the long-term effectiveness of a
given organisation. So people management should be made into consideration thus
strong understanding of psychological perceptivity among employees and make
development of staff work performance in an effective manner (Mullins, 2005). It is
important to look at the relationship between work performance and job satisfaction
of the organisation by viewing more on the related personal feeling of the employee
and their sense of personal achievement (Mullins, 2005). People working in the
organisation have different kind skills, attitudes and abilities for determinant to final
productivity and quality of organisational value adding process. The organisational
behavioural theorists had suggested that behaviour and performance for human being
resources depends on ability, motivation, role perception and situational
contingencies (Bratton & Gold, 1999).
13
The basic understanding and skills necessary for accomplishing the job can be the
ability thus the know-how. Generally thinking the knowledge should also involves
the understanding of the organisation environment with the employees in their
production process. There should be a commitment on the knowledge used in
improving work performance to produce at the pick (Wikstrom & Normann, 1994).
Human beings are subjected to weakness and strengths; therefore the knowledge of
understanding them and the organisation is much essential for clear management in
process. The strategy must base on a clear knowledge which seeks to overcome the
basic organisational activities (Wikstrom & Normann, 1994). For successful working
process, it requires to overcome on their own respective weakness or inner/outside
obstacles when people realises the successful network which make them together to
the organisation as members and part of overcoming the necessary ideas (Brooks,
2003).
This sort of knowledge thus is useful for helping others in their team to overcome
their weakness and at the same time evaluate one’s own performance. Therefore at
this stage innovation is viewed to centralise for that is said as a learning process by
maintaining a dynamic improvement procedure (Hunt, 1992).Through exploiting the
people’s strengths and making use of the weakness the best thing is to put in
strengths of people in a right rule and position in the given organisation of their own
like (Hunt, 1992). For instant some people have more abilities then other individuals
like level of reasoning and better job performance in their related field of their
strengths. Therefore to make things go smooth for better performance it is better to
allocate successful process in terms of existing strengths and weakness of
14

prospective and existing employees being part of this basis knowledge process is as
important as ever (Dunnett and Fleischman, 1982).
The second view is that, in more advanced terms, motivation is comprised of an
individual level on his/her effort, persistence and the direction to which he/she will
attain directly a goal on their effort more often (Brooks, 2003). It is important to keep
the staff motivated in performance of any task within the organisation. The self
motivated employees in an organisation perform at a most achieved level to their
objectives (Mullins, 2005). By understanding their own needs and communicating
with other members of the organisation, it is important for the existence of
organisation for members by their own needs and communicating with other
members of the organisation, it is important for the existence of organisation for the
members by their own initiatives to be motivated and learn from their own needs and
objectives of their organisation (Brooks, 2003).
Negative feedback can also reduce the incidence of too much away level of a certain
standard of life to be managed thus has to balance the situation which is between
encouraging reinforcement and negative effect to shape and control employee’s
behavioural patterns (Brooks, 2003). There is a direct relationship between
incentives/rewards and job satisfaction resulting these rewards and incentives for
individual employees. This reflects the entire level of expectation to the suggested
outcome for the desired in the organisation after the level of motivation (Mullins,
2005). In future people may cheat on their performance to which are not of their
level so as to get those incentives and rewards favour to the reality of other people in
the given organisation.
15

Finally individual difference has been considered. For it means when considering the
effectiveness of the organisation it is vital to be aware of what others believe and the
way people sees the world as there is a situation unique feeling and thinking among
people (Mullins, 2005). On psychological base the sensory awareness, the all
process of perception is described as an information process system which is to view
at one end of the process, then interprets and translate into action (Mullins, 2005).
The potential risks of misunderstanding with the organisation employees network
and can then reduce the effectiveness of work performance, resulting to the way in
which information can be used as a base of judgement. For this base Mullins (2005)
insisted that people and organisation knowledge is very important in an organisation
network in the way that it has to be intermediate between all those variables for the
perceptions found at the organisation to the employee in the entire dimension for
betterment of the organisation. More skilled workers are therefore exposed to their
skill in performance compared to others in the team to the typical control last
allocated between them (Armstrong, 2003).
This results to the strong sharing in organisation channel of process, its perception
resulting among them by selecting the same information to their organisation
environment, which enhances cooperation in work performance and reduces the
effect of effectiveness of situation as conflicts among the organisation for allowing
the individuals to work effectively and productively by increasing motivation and
flexibility, but can elsewhere depends on the effective knowledge application
(Hansen, Nohria and Tierney, (2001).
16

2.3 Incentives and Work Performance
Incentives in work place have benefits for both employees (teachers and employers
when recognized for stellar performance and productivity, employers (teachers) have
increased morally, job satisfaction and involvement in the school organizational
functions (Shields, 2007). As a result school experience greater efficiency work
performance. Hence motivate to working.
Motivation is a drive or urge to achieve a goal (Mushi, 1977). Thus motivation is an
act of making teachers feel that their work is recognised and valued (Nyakunda,
2012). At work place motivators include monetary and non- monetary incentives,
one example of monetary incentives is mutual funds. And those non- monetary
include flexible work houses, training opportunities and ability to work
independently. Herzberg’s two factors theory was developed by Federick Herzberg
(1993), a psychologist who theorized that job satisfaction and job dissatisfaction are
independent to each other. This theory concentrates on the importance of internal job
factors as motivating forces for employees. He designed it to increase job enrichment
for employees and creating opportunities for employees to take part in planning,
performing and evaluating their work.
According to Herzberg (1996), the two-factor theory (also known as Herzberg’s
motivation hygiene theory and dual factor theory) states that there are certain factors
in the workplace that cause job satisfaction, while a separate set of factors cause
dissatisfaction. Those, which satisfy workers, are motivational factors, and they
include recognition, sense of achievement, growth and promotional opportunities,
responsibility and meaningfulness (Herzberg 1993). According to Herzberg (1993),
17

the hygiene factors cannot be regarded as motivators. The motivational factors yield
positive satisfaction; these factors are inherent to work performance. The motivators
symbolize the psychological needs that are perceived as an additional benefit.
Hygiene factors including pay, company policies and administration policies, fringe
benefits, physical working conditions, status, interpersonal relations and job security
are those job factors which are essential for existence of motivation at workplace
(Herzeberg, 1993). These do not lead to positive satisfaction for long-term, but if the
same factors are non-existent at workplace, then they automatically lead to
dissatisfaction. In the other words, hygiene factors are those factors which when
adequate in a job, pacify the employees and do not make them dissatisfied. The
hygiene factor symbolizes the physiological needs which the individuals want and
expect to be accomplished.
Further, the theory concludes by viewing that, intrinsic motivators such as
challenging work, recognition, and responsibility produce employee satisfaction,
while extrinsic hygiene factor including status, job security, salary and fringe benefit
if absent produce dissatisfaction (Herzberg, 1993). Therefore, if any management
wish to increase satisfaction on the job, it should concerned with nature of work
itself- the opportunities it presents employees for gaining status, assuming
responsibility, and archiving self-realization. On the other hand, management wish to
reduce dissatisfaction, then it must focus on the job environment- policies,
procedures, supervision, and working condition (Herzberg, 1996). Finally, it
discusses that in order to ensure a satisfied and productive workforce; managers must
give attention to both set of job factors.
18

The theory has considerable amount of practical as well as theoretical influence. In
fact, from practical perspective, the influence of Herzberg theory can be seen at
every organization level as well as within department. Also the two theory factor can
be used to analyze any evidence of de-motivated employee at work. Through
applying Herzberg model, the evidence may include low level of productivity, poor
employee- employer relationship, strikes concerning payment and working condition
compliant. Therefore, the theory is very useful in explaining motivation of teachers
because:
i. The two-factor theory implies that the managers must stress upon
guaranteeing the adequacy of the hygiene factors to avoid teachers’
dissatisfaction.
ii. This theory emphasizes upon job-enrichment so as to motivate the teachers.
The job must utilize the teachers’ skills and competencies to the maximum,
and focusing on the motivational factors can improve work quality.
This theory has however been criticized, because the separation of satisfaction and
dissatisfaction has been shown to be an artefact of the Critical Incident Technique
(CIT) used by Herzberg to record events (King, 1970). This theory also does not
allow for individual differences, such as particular personality traits, which would
affect individuals’ (Hackman, 1976). Nevertheless, by considering the motivational
and demonization factors as illustrated in this theory, the institution should be aware
of both factors that bring motivation to workers as well as factors that de motivate
workers so as to increase efficiency at work.
19

Also the theory has been criticized because the two factor theory assumes that
happily worker produce more. It does not consider what motivate one individual
might be a de-motivator for another individual. Finally, the theory does not account
for individual personality traits that could provide different response to a motivator
or hygiene. By applying theoretical perspective Herzberg theory appears parallel to
Maslow theory. According to Maslow (1943), Maslow’s hierarchy of needs theory
states that through the terms physiological, safety, belongingness, love, esteem, self-
actualization and self-transcendence needs to describe the pattern that human
motivations generally move through. This theory arranges the needs from the highest
to lowest, but this theory was criticized that no clear evidence was shown that human
needs are classified into five categories Maslow developed his theory by studying
people whom he considered successful to see if he could find the secret of their
success in life. The hierarchy of needs has had a powerful influence on modern
thought in regards to personal development in motivation of workers ( Koltko, 2006).
Maslow’s theory (1943) still has application in modern day workplace, because if a
manager or organization understands that lower-level needs must be met before a
person has to satisfy higher-level needs, then the manager or organization is better
positioned to meet those needs, and in the order they must be met. Physiological
needs can be met by offering a fair competitive wage lunch breaks, fitness facilities
and company so that teachers feels comfortable that his or her basic needs are
satisfied (Cangemi, 2009). There are many possibilities for applying these needs to
drive worker’s motivation. It may not always be very clear what needs to be done,
20
but this is why it’s important for managers to understand these needs theories so that
they can apply when the opportunity arises.
Maslow’s hierarchy of needs theory fails to illustrate and expand up the difference
between the social and intellectual needs of those rose in individualistic societies,
and those raised in collectivist societies. The needs and drives of those in
individualistic societies tend to more self-centred than those in collectivist societies,
the needs of acceptance and community will outweigh the needs for freedom and
individuality (Hofstede, 1984).
Maslow’s hierarchy of needs theory has also been criticized as being individualistic,
because of the position and value of sex on the pyramid. Maslow’s pyramid puts sex
on the bottom rung of physiological needs, along with breathing and food. It views
sex from an individualistic and not collectivist perspective: as individualistic
physiological needs that must be satisfied before one moves on to higher pursuit
(Kenrick, 2010). For that matter then, the decisions on what motivations would be
given to workers they should not precede the course of researching workers’
individual needs one by one so as to weigh balance between individualistic needs and
collectivistic needs, hence this balance will help to create a good management of
classes and gender differences among the workers.
2.4 Rewards and Work Performance
Rewards are provided as outcomes that are due to the positive employees’
performance. The results then are assigned in line with the goals of the organisation.
An employee is rewarded by the organisation when he/she makes the achievement of
21

the goal of a certain organisation reached. Intrinsic and extrinsic rewards are the two
general types of rewards that motivate people.
2.4.1 Intrinsic Rewards
Intrinsic motivation is internally moral of a person is something that you offer by
your own or a drive within yourself on the benefit of the working environment. This
spells the intrinsic motivation as a point where a self existence for achievement of it
is independent. It is believed that the most powerful rewards come from inside a
person.
By viewing the sense of accomplishment you feel once you have overcome a
significant challenge or completed an assignment or work project that required a
good deal of effort. Intrinsic motivation provides that personal pat on the back or
natural high that reflects a person's ability, competency, growth, knowledge and self-
control over their endeavours. Employees who are intrinsically motivated tend to
work at higher levels of productivity and strive to develop professionally, thus work
to serve (Herzberg, 1996). Intrinsic rewards include things such as: personal
achievement, professional growth, sense of pleasure and accomplishment.
In economical know how the greatest assist a worker offers an organisation is the
intelligence experience, ability to solve problems, personal attitude towards work,
internal rewarding ability comes a very important aspect for such employees.
Herzberg (1996) studied most of workplace motivation and found that intrinsic
rewards are more effective than those given as cash rewards in the role of employee
22
motivation. Additionally employees will not seek in need of monetary reward most
rather than money will mean not more in the maximizing the motivation factor for
most of the employees. People are more precise to feel like their contributions
matters. For instance a person may reach a sales quota for the bonus feels sense to be
accompanied to the success to the employee quota made motivation to achieve the
intended quota becomes less powerful. In order to help employees’ intrinsic
motivation, managers must do the followings;
i. provide meaningful work
ii. allow employee get a choice on high level of autonomy
iii. provide with the opportunities to employees on showing their competence in
areas of expertise
iv. facilitate professional development to expand employees’ level of knowledge
v. frequency offering opportunities for employees to reward themselves
vi. allow employees the opportunity to connect to the available feedback system
vii. Give them the way to monitor their progress and mind on their milestone
along their path.
2.4.2 Extrinsic Rewards
Extrinsic motivation involves the tangible rewards. Different to the extrinsic
motivation which is within oneself but extrinsic motivation is focused to be the
external factor which is provided to an individual and is typically offered by a
supervisor or a manager how hold power upon the employee. Most extrinsic rewards
are monetary, such as raise in salaries, bonus or pay of overtime. Sometimes
23

extrinsic rewards can be simply of getting a better office, verbal praise, public
recognition promotion and some added responsibility to the employee.
Being important to most of the workers those material rewards may sometimes de-
motivate workers if underpaid, overworked and unappreciated hence those are so
important for simply because he/she may after rewards. For example an employee
may not be interested on the selling activities for the company but can put more
effort in need to have a reward. Providing employees with extrinsic reward is directly
related with the built of into performance on one individual projects. They are useful
for a short-term process of motivating employees, which then works on reward for a
specific organisational goal.
A little reward can be a powerful motivator when you want workers to do something
especially when you what it to be done quickly and without an argument. But like all
lures, material rewards can produce unexpected and unwanted results with workers.
Gifts for good grades or money for teachers’ chores can have a down side (Omari,
2011). There is nothing wrong with rewarding teachers for an exceptional job, the
problem occurs when rewards are held like baits in front of teachers to compel them
to do something. Used too often, rewards can send to employee negative message
that employers may not recognize. Rewards used to attract or invite teachers into
behaving better can work at first, but the results are often temporary. The basic
danger when you tell teachers “Do this and you will get this” is that it shifts their
focus away from the behaviour that needs improving and simply sends them into a
rush to get that tangible reward.
24

A mother learnt the truth this way: In an effort to motivate her son to do better in
standard four, she promised him a pair of shoes if he behaves well, and a watch for
grades. The rewards worked at first, but as his enthusiasm for the goodies declined,
so did his performance. When explained to the child that he had to do better in school
or else he would have to repeat the class while his friends moved ahead, that really
sunk in “It is something he didn’t want to happen” (Omari, 2011). When his mother
rewarded his achievements with hugs and praise, the child continued to improve.
The most serious concern about rewards is that they can cripple self-motivation.
Rewards may make it difficult for individuals to develop their own internal
motivation for doing things. With their attention fixed on a reward, some individuals
are less likely to learn what it feels like to be proud of doing something (Omari,
2011).
2.5. Differences between Incentives and Rewards
Table 2.1: Differences between Incentives and Rewards
INCENTIVES REWARDS
1. Is given before the performance of
the job
2. The idea is to encourage better
performance from workers who may
not be meeting desired goals
3. When incentives are working, they
may come to produce rewards at the
end, hence causes of rewards.
4. Incentives may be provided but still,
work may be not done, hence plan
1. Is given after the expected job is
done
2. The idea is to show appreciation to
the employee, to encourage him/her
to continue achieving
3. The rewards may come after
incentives program, hence they are
effects of incentives
4. Rewards may be terminated, hence
results to Job Dissatisfaction.
25
with risk
5. An incentive is an encourage to
perform better, as it is offered before
predicted performance
6. Incentive are granted to worker that
perform below par, and to
encourage them to achieve the desired
level of perform or set goal
7. Example of incentives includes,
recognition to workplace, provision
of work security, making one to work
independently
Performance may decline
5. Once the employee meets the
expected goal the incentives becomes
a reward in which the employee gets
the promised benefit
6. A reward is given to an employee
once after he/she has provided
evidence of his/her positive
behaviour and achievement.
7. Example of rewards are cash, gift
certificates, plagues, panties or even
just a pat on the back to say “great
job”
Source: e3 journal of Business Management and Economics Vol. 3(1) Pp 001-009
2.6 Effectiveness of Incentives and Rewards at Workplace
A number of employers become frustrated and spend a lot of money thousands or
more even hundreds of thousands of dollars on rewarding their employees and has
not yet seen any measurable outcomes for the exercise. Nevertheless of being famous
on the reward strategies to which hundreds of researchers has deduced from varies
studies on human being motivation theories and work reinforcement but they find
themselves still spending most of their resources to reward employees.
Bigger also as always to have a big opportunity and the values of incentives and
reward are practiced which when lead to claim that effective employee incentives
and reward increases work performance to employees will just be motivated to
26
increase their work quality and quantity, thus align their performance with
organizational objectives. They can there be a very powerful influence on employee
behaviour, motivation and performance, for then should be an integrate component in
any organization strategy.
Table 2.1 are results from a survey of 165 US executives who were asked about their
current employee incentives and rewards compensation plans. Result from the
survey shows that there is a relationship between the most frequently used
incentive/reward types and the most effective incentive/reward types. It is therefore
argued that managers and executives scrutinize their incentives and rewards
programs hence measure the effect they have on the employees and the organization.
Table 2.2: Effectiveness of Incentives and Rewards for 165 US Executives
S/N Incentive and Reward type Percentage (%)
Companies
Percentage (%)
effectiveness
1 Annual bonus 74 20
2 One-time rewards 42 38
3 Individual incentives 39 27
4 Long-term incentives 32 44
5 Lump-sum merit pay 28 19
6 Profit sharing 22 43
7 Employee stock ownership plan 21 33
8 Suggestion/purpose program 17 19
9 Team-based pay 15 4
10 Skill/knowledge-based pay 12 58
11 Group incentives 11 24
12 Pay for quality 9 29
13 Gain sharing 8 38
27

14 Competency – based pay 22 31
Source: HR focus; April p.3 “Incentive pay Plans which ones work and why”?
The impact of employee incentive and rewards programs in the workplace have
greater employee productivity, higher profits, better cash flow, stronger stock market
and great stock value than those without rewards system (Mc Adam, 1996). In
general in creative and reward system has a positive effect to both employee
performance, and organisation performance as well. However it seems that not all
incentive and reward programs are effective. In effective reward systems can
decrease employee motivation. Increase scepticism and contribute to opposition in
the work place. Thus managers should understand that constitutes an effective
incentive-reward system, knowing what behaviours to reward and how the shape
employee behaviour using incentives and rewards.
There are individual differences in response to incentive or reward type. Some
employees will be more motivate by social rewards and incentives (example, praise
and recognition) than monetary rewards. It is therefore important to understand the
motivational factors of each individual employee and distribute rewards based on
employee preference and the resulting degree of motivation. Individual difference
should be considered as for what employees prefers type of incentive/reward. A large
number of employees can prefer monetary reward contrary to others how will
perform better if rewarded by non-monetary system of similar value (Jeffrey, 2009).
Therefore there must be a balancing situation between monetary rewards and non-
monetary rewards for an effective strategy on workplace incentive reward system in
the organisation.
28

The effectiveness employee incentive/reward system can motivate employees to
increase their work performance also encouraging them to insist much on their
performance towards the organization’s objective. Thus therefore it is essential that
managers understand that constitutes an excellent employee incentives/rewards
program, and how to implement it and when making necessary changes. By doing
that can have a major impact on the company’s climate culture and bottom line.
2.7 Motivation and Work Performance
Motivation is the development of an employee pursuit to perform tasks to their finest
ability based on their own initiatives (Rudolf and Kleiner, 1989). Also by carefully
observation motivation can be as the level of which an employee has to be doing
something for the company, an important function to succeed (Evenson, 2003).
Motivation also means employees reaching top performance each time; to improve
results, carrying about their motivators’ organisation and employers (Evenson,
2003).
Motivation leads to belief of employees to perform specific task. Other advantages
include increase of employees’ performance to the management and organisation at
large. This means a direct connection to improvement of employees to levels of
motivation. Some survey have shown that centred motivation is then a determinant to
job performance and the vice versa may result to employees turnover, expenses,
negative enthusiasm and the more time of management in the organisation. So it the
employees which have to be made known to their aspiratory factor as not to be
29

misallocated (Robbins, 1993). Linking motivation with education also important for
the success connected to the motivation point of view. Employer should not neglect
education as it is a chief concern in motivation, Education will being about
motivation to workers for channelling all efforts forward towards success (Darmon,
1994).
2.7.1 Intrinsic and Extrinsic Motivation
Intrinsic motives are those internal reinforce and are which do not dependent on
external goals. On the other hand extrinsic motives depend on needs that must be
satisfied by external reinforces. According to Jerome Bruner (1976), discussion
which emphasis that learning will be far more last longer when it is sustained by
intrinsic motivation more than when it is driven by the push of external reinforces.
Bruner, (1976) do argue, however, that extrinsic motivation may be necessary at the
initial stage starting with the learner to initiate certain actions or to get the learning
process started. But when it is on its way, the sometimes fragile process of learning is
better nourished and sustained by intrinsic motives. Intrinsic motivation may
sometimes require an external reinforcement to get it on its way, but once it comes to
function automatically it becomes independent to external rewards (Bruner, 1976).
Salvin (2006) pointed out more that extrinsic motivation involve doing something to
obtain something else (a means to an end). Extrinsic motivation is often influenced
by external forces such as rewards and punishments. For instant, a student may study
hard for a test in order to obtain a good grade in the examination. To the fact on this
the behavioural perspective emphasizes the importance of extrinsic motivation in
30

achievement, the humanistic and cognitive approaches acting upon the importance of
intrinsic motivation in achievement. Intrinsic motivation is dealing with the internal
motivation to do something for its own sake (an end in itself). For instant, a student
may study hard for a test because he or she enjoys the content of the course (Salvin,
2006).
Recent evidence strongly favours establishing a classroom climate in which learners
are intrinsically motivated to learn. Learners are more motivated to learn when given
choices and become absorbed in challenges that match their skills, and then receive
rewards that have informational value but are not used for control (Salvin, 2006).
i. Extrinsic motivation. The external motivation to do something to obtain
something else ( a means to an end)
ii. Intrinsic motivation. The internal motivation to do something for its own sake
(an end in itself). Learning for its sake, for internal pleasure.
2.7.2 Theories of Motivation
Let see what motivates employees. Here are some of the different ideas to what
motivates workers. These are the most commonly theories worked upon by most
important theorists over a hundred years yet these theories have never reached the
common conclusion.
2.7.2.1 Maslow's Hierarchy of Needs’ Theory
Naturally people have many needs. Maslow (1954) proposed a hierarchy of needs as
in figure 2.1. In Maslow’s theory, needs that are lower will at least, be partially
31
satisfied before a person tries to satisfy higher-level needs next. If a need lower the
hierarchy is attained it gives room for the next level to take place. For insist, a
hungry man or one who is in physical danger will be less considering about
maintaining a positive self-image better than looking for the alternative about
obtaining food or safety; but once that person is no longer hungry or afraid, self-
esteem needs will now be a preoccupation.
Normally a distinction is made between deficiency needs and growth needs (Maslow,
1954). Deficiency needs (physiological, safety, love, and esteem) are those that are
critical to physical and psychological well-being, these needs must be satisfied first,
but once they are done, a person’s motivation to satisfy them diminishes. In contrast,
growth needs, such as the need to know one self and others, can never be satisfied
completely. In fact, the more people are able to meet their need to know and
understand the world around them, the greater their motivation might become to
learn still more (Maslow, 1954).
According to Maslow (1954) Self-Actualization includes the concept or desire for
self-actualization, which he defines as “the desire to become everything that oneself
is able to become”. Self-actualization then characterized with accept to self and
others, spontaneity, openness, relatively deep but democratic alignment with others,
creativity, humour, and independence (Maslow, 1954).
32
Physiological needs: Free from hunger, thirst, pain, sex urge, respiration problem
2. Safety needs: feel good, secure, safe, out of danger
3. Belongingness and love needs: to affiliate with others, fit and be accepted, belong to groups
4. Esteem needs: To achieve, be competent, gain approval, be liked, gain recognition, conger, and master
5. Cognitive needs: seek to know, understand, create, explore and discover
6. Aesthetic needs: Looking for order, symmetry, and beauty and elegance
7. Self-actualization needs: find Self-fulfilment, realize dreams & potential
7
6
5
4
3
2
1
Figure 2.1 Maslow’s Hierarchy of Human Needs
Source: Adapted from Omari (2013)
2.7.2.2 Herzberg's Motivation- Hygiene Theory
Herzberg and his fellows, in 1959 wrote proposing one of the most famous and
controversial theories of job satisfaction. Herzberg (1957) did not look directly at
motivation, but at the causes of job satisfaction and dissatisfaction with the aim of
trying to understand what motivates people. He took a psychological, but yet a
contemporary view based on two human needs: the need to avoid pain and the need
to grow. This theory is known as the "Two Factor," "Dual" or "Motivator- Hygiene
Theory." The basis of this theory was that there are two entirely separate sets of
33
Growth needs:# 4, 5, 6, & 7
Deficiency needs:# 1, 2, & 3

factors that contribute to employees’ behaviour at work. One set was termed hygiene
factors and the other motivators (Herzberg, 1993).
Hygiene factors prevent dissatisfaction even though their presence does not motivate.
This includes factors like working conditions, company policies and administration,
pay and interpersonal relationships. Motivators were considered as 'high level needs'
believed to include achievement, recognition, responsibility and opportunity for
growth. Additionally, jobs had specific factors, which were related to job satisfaction
or dissatisfaction (Herzberg, 1993). Herzberg did not however, believe that all jobs
can be enriched to bring about job satisfaction. The highlight of Herzberg's findings
was that the hygiene factors listed above do not motivate, but prevent dissatisfaction
and pain. They provide the right environment for work (Herzberg, 1996).
i. Hygiene seekers as Job context continuum
ii. Good hygiene factors as Satisfaction as Poor hygiene factors as
Dissatisfaction
iii. Motivation seekers as Job content continuum
The following table presents the top six factors causing dissatisfaction and the top six
factors causing satisfaction, listed in the order of higher to lower importance. The
motivator and the hygiene factors are as follows:
Table 2.3: Motivator and the Hygiene Factors
Motivator Factors Hygiene Factors
The job itself Environment
Achievement Policies and Administration
34

Recognition and Accomplishment Supervision
Challenging work Working condition
Increased responsibility Interpersonal relation
Growth and Development Money, status, security
Source: Adopted from Herzeberg’s (1959)
Poor motivation factors Good motivation factors Negative growth Positive growth
later research by Padilla-Velez (1993) and Bowen (1980) also named the following
as motivator- hygiene factors: Recognition, achievement, possibility of growth,
advancement, salary, interpersonal relations, supervision, responsibility, policy and
administration, working conditions and the work itself. Herzberg's theory has
however been criticised by Mooley (1977), Padilla-Velez (1993), Poling (1990),
Steers and Porter (1992), Bowen (1980). Bowen's assertion was that Herzberg's
theory was not applicable to certain categories of workers like educators in
Agriculture; as his theory was born out of studying accountants and engineers.
Moreover, Bowen views all the factors as related to job satisfaction except that the
hygiene factors explained a higher proportion of job satisfaction as compared to the
satisfiers. Vroom’s assertion of the two factor theory was that, it was just one of
many conclusions that could be drawn from a research. Mullins (2005) has also
commented that Herzberg's model has at least five theoretical interpretations.
The two general criticisms are therefore that the theory least applies to unskilled
workers and people whose jobs are mostly repetitive and monotonous even though
they happen to be in the majority and are the very people who often present
35

management with the biggest problem of job satisfaction and motivation. Moreover,
some workers do not seem to be interested in the job content of their work, or with
motivators or growth factors. The second general criticism is with the methodology
employed by Herzberg. The view was that the method used had an influence on the
responses. That is the critical incident method and the description of the sequence of
events that give rise to good or bad feelings. Furthermore, the descriptions from the
respondents were interpreted by interviewers who could also be influenced. It was
argued that people were likely to attribute satisfying incidents at work (motivators)
as a favourable reflection on their own performance.
The dissatisfying incidents (hygiene factors) are more likely to be attributed to
external influences and the efforts of other people (Mullins, 2005). In spite of the
criticisms of Herzberg's theory, it is believed to be a good attempt to practically look
at the study of motivation. His work also drew attention to job design and job
enrichment. According to Crainer and Dearlove in Mullins (2005) 'the current
emphasis on self-development, career management and self-managed learning can be
seen as having evolved from Herzberg's insight'.
2.7.2.3 Equity Theory of Motivation
Equity theory (Adams, 1963) considers the working situation as a combined
relationship of benefits and contributions along with employers and employees, for
which benefits include salary, recognition and promotions. Contributions involve
employee's education, experience, effort, and ability (Daft, 2003). The principle
governing equity theory says that people can be evaluated by the fairness of their
input and output in a balanced manner to by their perception of the input and
36
outcome balance of another, for others may be another person, a class of people, an
organisation, or the individual relative to the one’s experiences from initial point in
time (Daft, 2003). The equity model explains that under conditions of fully equity the
individual experiences job satisfaction. For the some reason, under conditions of
perceived inequity (under-rewarded or over-rewarded relative to others) the
individual experiences dissatisfaction. This state of equity may only exist wherever
the ratio on input and output are on one level (Daft, 2003)
According to Martin (2005) this may lead in tension and some psychological
uncomfortable situation. Also may be followed by a desire to do things about it or
take action so as to make the tension less as previous. The suggestion from Adams
(1963) on the actions that an employee could use to ease the mode of tensions
includes modify of inputs, modify outputs and perception of self with the perception
of comparator thus change comparator or leave the situation (Mullins, 2005). This
balances the feelings as it is believed. The equity theory though considered as a
straight forward, it cannot cover every concern (Martin, 2005). Martin further
insisted that whenever the inequities are perceived, employees are able to tolerate for
just a short time but when time comes no tolerance is observed. Martin (2005)
assertion is that employees are subjective to comparisons. Therefore job is matched
directly with wage/effort bargaining power. Manager has to make strong reasons on
making rewards functioning in accordance with the rewarding system to conquer
with the equity related to individuals as relevant. Secondary it needs for the manager
to re-design a compensation system for the suck of avoiding destroying of
performance and lastly to ensure that the new designed manner do not lead to over
37

rewarding performance, and will not be granted at higher productivity or improve
performance (Martin, 2005).
2.7.2.4 Alderfer’s Theory of Motivation
Alderfer’s Existence, Relatedness and Growth theory from 1969 condenses
Maslow’s five human needs into three categories; Existence, Relatedness and
Growth.
Existence Needs; Those include all materials and physiological desires (example;
Food, water, clothing, safety, physical love and affection) Maslow’s first two levels.
Relatedness Needs; Encompass social and external esteem, relationships with others
like family, friends, co-workers and employers. This also means to be recognised and
feel secure as part of a group or family. Maslow’s third and fourth levels (Alderfer,
1972).
Growth needs; Internal esteem and self actualization, these impel a person to make
creative or productive effects on him and the environment (example, to progress
towards one’s ideal self) Maslow’s fourth and fifth levels. This includes desire to be
creative and productive’ and to complete meaningful tasks.
Even though the priority of these needs differ from person to person, Alderfer’s ERG
theory prioritises in terms of the categories concreteness. Existence needs are most
concrete and easiest to verify. Relatedness needs are less concrete than existence
needs, which depend on a relationship between two or more people. Finally, growth
needs are the least concrete in that their specific objectives depend on the uniqueness
of each person (Alderfer, 1972).
38

2.7.3 The Attention, Relevance, Confidence and Satisfaction Model of
Motivation
To conquer with Keller’s facts, “There is nothing as practical as a good theory.” An
American philosopher William James worked on this observation. Keller (1984) at
Attention, Relevance, Confidence, and Satisfaction did the fact on purposefully
approach to attempt the model acronym ARCS meaningfully, consistently and easier
to communicate. As a result its focus on matching motivation factor to the unique
affective characteristics to who is learning and a clear suggestion for strategies, the
ARCS Model is as practical as it is. Keller initially referred to the ARCS Model in a
one graphically model (1983 b) published while in The Netherlands were the
research was conducted. He then discussed the ARCS Model in relation with teacher
training. Keller (1987 a, b, c) has then to define and describe the basic components of
the ARCS Model in a series of three key articles to be read by the larger public.
The final edition of the ARCS Model, certain terms where changed to fit the
acronym. “Interest” becomes “attention,” and “expectancy” becomes “confidence”
(Keller, 1987a, b, c). Keller (1987a) notes simply: “The ARCS Model is a method
for improving the motivational appeal of instructional materials”. It has three distinct
features. First, to show the connection with motivational theory, which are four
motivational concepts: Attention, Relevance, Confidence and Satisfaction (Keller,
1987a) then, to enhance the appeal of instruction, sets of strategies are involved.
Third, the ARCS Model utilizes a systematic working process. Keller (1987a)
emphasizes that the ARCS Model is solving the problem, approaches empirically to
applying motivation to instructional design.
39

Motivation does not deal with the learner’s responsibility but with also the instructor
or design one how is responsible. Thus factor of the ARCS Model has three
elements, which Keller (1987b) delineates. First, Attention involves perceptual
arousal--use of strategies to attain initial interest; inquiry arousal—use of solving
problems, questioning, a sense of mystery and progressive disclosure to increase
interest; variability- use of variety (lecture with visuals, group activity, or game) the
suck for a change of pace. Second, Relevance, which is the concept to link the
content to the learner’s essential needs and wants, which includes: goal orientation,
which may mean outcome of learning like obtaining a job, reward, and so on, or may
imply the means of learning; motive matching including the learner’s choices about
strategies of learning, like by group interaction, competition, or individual work;
familiarity or connect to what an individual already believes and understands such as
realistic graphics, people’s names, personal learning experiences (Keller,1987b).
Third, Confidence, which provides a sense of self-worth and ability to succeed in
challenging tasks, involves strategies to: to bring about learning requirements in the
form of clear objectives; provide success opportunities as earlier and easy enough to
establish the learner’s belief in his or her ability to perform successfully. Give out
personal control on the type of learning with choices of content, objectives and
activities (Keller, 1979). This relates success to individual’s choices and effort.
Fourth, Satisfaction includes strategies to: increase the natural consequences for the
use of the content, simulations, projects, real-life activity; provide positive
consequences--both intrinsic and extrinsic rewards wit incentives; assure equity of
rewards so that they go together with achievements.
40
Keller (1987a) argues that designers often had overlooked on motivational design
components simply because they believe motivation cannot be measured on aspect
of learning and there as motivation is too “unpredictable and changeable, subject to
many influences” over which the teacher or facilitator has no control. Keller notified
that, however, that motivation cannot be predicted and at the same time not assumed.
But motivation can, for sure, be approached systematically with a model rooted in
Instructional Systems Design (Keller, 1979).
2.7.4 Components of Human Motivation
Keller’s (1998) ARCS model involves these four major components of human
motivation: The curiousness in one is that is he /she interested as an Attention.
Relevance- Makes one value the matter. Confidence- Is the readiness of doing it and
Satisfaction meaning how one can like the matter. The absence of these components
in a balanced manner, the employee has less opportunity to perform as required and
requested. However, “motivation follows a curvilinear relationship with
performance. As motivation increases, performance increases, but only to an optimal
point. Afterward, performance decreases as motivation increases to levels where
excessive stress leads to performance decrements” (Keller, 1998). It may results to
stress accompanies motivation and those employees can such situation of over or
under motivated in any of those components. Here the manager has to make a careful
analysis to motivational problem which may arise to alert on those stress.
Factors of motivating employees A “good manager” helps sub-ordinates feel strong
and responsible, rewards them properly for good performance and sees that things
41

are organised in such a way that subordinates feel they know what they should be
doing” Managements should reward their employees for their performance and
loyalty. Rewards can take two forms; extrinsic rewards or intrinsic rewards (Rudolph
and Kleiner 1989). Rudolph and Kleiner (1989) viewed the fact on extrinsic reward
and also Susan (1989) that basic material requirement for management must meet the
employment. These requirements include salary, fringe benefits, promotion and
many others for the betterment of the organisation.
Darmon, (1974) then said that money or all those monetary incentives are the
motivators for employees’ behaviour and thus used to arise within a given
organisation. Dauten (1998) also outlines how workers are motivated by having the
own success. So management must tie their performance with the bonuses, which
will act as motivator as to which has to be presented to them in achievement of
management goal and for great performance for the reward received. On intrinsic
reward Rudolph and Kleiner (1989) as a psychological incentive, this includes input,
thanks, job rotation, and job enlargement and so on. The intrinsic rewards are as
important as they lead to build a climate and environment of trust and cooperation
within the members of the organisation. Also Sujan (1986) showed that the
employees when intrinsically motivated they enjoy performing job-related tasks,
such as influencing customers and learning about the company”.
These employees which then have the respect among the members and being
involved in informed developments of their organisation in a meaningful and
interested manner can perform excellently. According to Nelson (2003) these
methods as good motivation tools including the use of recognition. The importance
42

being, “recognition is not just for the person who performed well – it also sends a
message to other employees as it communicates the standard of the company”
(Nelson, 2003). Recognition will improve the level of work performance whenever
done in the organisation. He believes that the uses of monetary rewards are then
becoming “viewed as a right as opposed to reward and therefore the ability for
money to serve as incentive is diminished”.
Financial tool has then become a concentrating factor among the members of the
organisation. For that then Nelson (2003) created a motivation standard that can not
involve great money costs. Much importance has been placed on intrinsic motivation
in social psychology, because it is perceived as a type of motivation leading to highly
valued outcomes such as creativity, quality, spontaneity, and vitality (Kruglanski,
Friedman and Zeevi 1971; Deci 1978). Edward Deci has in particular stressed the
importance of intrinsic motivation as it is associated with human well-being through
the satisfaction of three universal psychological needs; autonomy, competence, and
social relatedness (Deci and Ryan 2000; Gagné and Deci 2005). Within this stream
of research, intrinsically motivated behaviour is perceived as behaviour freely
engaged in, which the individual finds interesting and derives spontaneous
satisfaction and enjoyment from (Deci 1971; Lepper et al., 1973; Gagné and Deci
2005). This type of motivation has recently been labelled “enjoyment-based intrinsic
motivation” (Lindenberg, 2001).
In contrast, extrinsic motivation, intrinsic motivation is most often associated with
the engagement in activities because they lead to desirable consequences separate
43

from the activity such as tangible rewards. Hence, the behaviour is a means to an end
and not involved in for its own sake (Deci 1972; Lepper et al., 1973; Gagné and Deci
2005). In comparison the intrinsic motivation which involves in complex tasks,
extrinsic is involved to claim the importance in relationship to the simpler tasks
(Osterloh and Frey 2000; Gagné and Deci 2005). Nevertheless both those types of
motivation are needed in the organisation.
2.7.5 Interaction between Intrinsic and Extrinsic Motivations
From the consideration of social studies both extrinsic and intrinsic motivations
cannot be cumulatively, but the two can be associated to illustrate the existence of
motivation like for design of a particular organisation ( Deci 1971; Lepper et al.
1973; Rummel and Feinberg 1988; Wiersma 1992; Tang and Hall 1995; Kohn
1999). However, this not seen effect is likely to be or not be depending on the type of
reward given. The literature in particular is differential between five kind of extrinsic
rewards; verbal, unexpected tangible, expected and tangible, task-non-contingent,
expected and tangible task-contingent, and expected and tangible performance
contingent (Feinberg 1988; Wiersma 1992).
At low-cost the manager call employees into the office and say “thanks”
Acknowledge at an individual achievements; Create employee “hall of fame”; Many
collage of successful project and the people who worked on it; Put to display
memos/posters on the wall as recognition of work of employees in their help in
achieving organisation goals; Behind – the – scenes awards for some case are of
limelight; Certificate program; Most importantly, be timely, sincere and specific
44

(Tang and Hall 1995; Kohn 1999). A wide range of variety of definitions and
measures of organizational commitment exist. Beckeri, Randal, and Riegel (1995)
have defined the term in a three dimensions:
i. A strong desire to remain a member of a particular organization;
ii. A willingness to exert high levels of efforts on well being of the organization;
iii. A define attitude in and acceptability of the values and goals of the
organization.
To Northcraft and Neale (1996), commitment is an attitude that reflects an
employee's loyalty to the organization, and an upcoming process through which
organization members explains their concern for the organization and its continued
success and well being. Organizational commitment is determined by that number of
factors, which involves personal factors (example; age, tenure in the organization,
disposition, internal or external control attributions); organizational factors (job
design and the leadership style of one's supervisor); non-organizational factors (the
other alternatives). All of those things affect subsequent commitment (Nortcraft and
Neale, 1996). Mowday et al., (1982) taught that commitment as attachment and
loyalty. They then described three components of commitment as:
i. An identification on the goals and values of the organization;
ii. A moral desire to belong to the organization; and
iii. A willingness to put out the effort on behalf of the organization.
A similar definition of commitment emphasizes the most importance of behaviour in
creating it. Salancik (1977) conceives commitment as a way of being in which an
individual becomes together by his actions and it is these actions that sustain his
activities together with involvement. Then the definition can be inferred that three
45

features of behaviour are important in binding individuals together to act: visibility
of acts, the extent to which the results are irrevocable; and the degree to which the
person is doing the action voluntarily.
To Salancik (1977), commitment can be increased and joining together to obtain
support for the organizational base of interests through such things as participation in
decision-making. By viewing on the multidimensional nature of organizational
commitment, there is ongoing support for a three component model proposed by
Meyer and Allen (1991). All three parts have implications for the continued
participation of the individuals in the organization. The three components are:
i. Affective Commitment: Psychological alignment to organization.
ii. Continuance Commitment: The costs associated with leaving the organization.
iii. Normative Commitment: Perceived obligation to remain part within the
organization.
Guest (1991) concludes that high organizational commitment is working together
with lower turnaround time and absence, but there is yet not linked to performance. It
is probably wise if one do not expect too much from commitment as a means of
making a direct and immediate value on performance. It makes contrary to
motivation. Commitment is a wider concept and seems to withstand transitory
aspects of an employee's job. It makes the possibility for dissatisfied with a certain
feature of a job while retaining at advanced level of commitment to the organization
as it is.
When creating a commitment strategy, Armstrong (1999), asserts that “it is difficult
46

to deny that it is desirable for management to have defined strategic goals and values.
And it is equally desirable from management point of view for employees to behave
in a way that supports those strategies and values." Building up commitment includes
communication, education, training programmes, and initiatives to create
involvement and ownership and the development of work performance and reward
management systems. Surveys on commitment have resulted to strong evidence that
affective and normative commitments are positively related and continuance
commitment is gone opposite in connected with organizational outcomes like
performance and citizenship behaviour (Armstrong, 1999).
Today the knowledge of motivation has a contribution to the overall working culture
for a particular organisation, hence found the organisation commitment which then
influences the organisational effectiveness. This views not only on the exceptive
situation, but where motivation are practiced they are necessary translating factor in
to production Due to individual difference ,different people have different motivation
factor, some people are concerned with material motivation factor but others with
non-material factors like fair procedure of which is very important factor on the
organisation (Armstrong, 1999). For workers working under materialized motivation
come more committed to distributive justice, contrary to those on non-material,
which then work under fair procedure in performance of work.
The supervisor or manager has to be able to maintain both justice distributions with
those to the fair procedure in business opportunity. Justice produces excellent
opportunity and stronger employee commitment for gain of total tough-to-copy
47

commitment as “culture of justice”. There is relationship between motivation and
organizational Commitment for both private and public sectors, hence the
organisation need to maintain these two variables which are work motivation and job
satisfaction for positive achievement in the organisational commitment. When
variables are controlled there is an organisation commitment increment, hence those
work motivation results to job satisfaction (Armstrong, 1999).
In order to increase job satisfaction human resources have to be maintained at a
balanced level with the reward at work place including incentives and motivation is
automatically the work performance is observed which the leads to job satisfaction.
The increase in material and non-material motivation factor hence make employees’
commitment to the organisation production objective and results to efficiency and
great outputs which an organisation desire. Hardworking employees are mainly a
result to a fair motivation programme for an organisation on the integrate part of
recognisation of needs to the employees. Motivation play a very important role in
investment to people for business strategies made for the resources available and of
the benefit of an organisation in enhancing programme with human resources
(Mullins, 2005).
2.8 Influence of Teachers’ Recognition and Work Performance
Therkildensen (2007) did his study on HRM practices and organizational
performance in public sector organization in Tanzania and Uganda. The focus was to
look onto the rules of hiring, firing transfer and promotion in central government and
assess how these practices affect motivation at individual and organizational level.
48

The finding revealed that employee recognition is regarded as the most important
motivation factors. Furthermore, employees perceived allowances more income than
normal fixed monthly pay.
Lupenza (2007) conducted a study to examine the factors hindering effective
performance in National Insurance Corporation (NIC) in Tanzania. This study
employed both qualitative and quantitative research design. The researcher found
that, ignorance of existing employees; salary and upward mobility motivational
framework contribute for the worker’s probability of not claiming what they deserve
because of lacking the basis. Hence, they remain silent but demoralised then
affecting performance or productivity. Also, it was found that the existing salary
related motivational framework largely inhibited employees’ positive work attitudes
and employees effective performance. Therefore, this study concludes that
motivation related to salaries increase in any organization stimulates positive work
performance.
Michael (2010) conducted a study with an aim to examine whether inadequate pay of
salaries and rewards to primary and secondary school teachers could be the main
factor relating to inefficient of teachers’ performance resulting to students’ failure in
examination. The study employed qualitative research design and found out that job
security, interesting work, working condition, good salaries, rewards and promotion
are the among satisfying reasons that could result to performance. Researcher
recommended that government of Tanzania should eliminate all facts clearly pointed
out to incredibly dire working conditions for schoolteachers, low salaries and other
49
incentives such as rewards. This study failed to show directly the influence of the
rewards in increasing the performance of the teachers and motivation.
Bangi (2008) did a study to investigate the influence of non-salary factors on
teachers’ mobility in private secondary schools in Dar es Salaam region. Both
qualitative and quantitative research design were used to meet the objectives of this
study. The findings suggested that major non-monetary incentives given in private
secondary schools in Dar es Salaam includes housing, lunch, transport and medical
services, teachers promotion, participating in decision making and professional
development.
Also, Bangi (2008) found that rewards were given to teachers whose students
performed better in their national examination whereas the performance was used as
a benchmark for one to be rewarded. For example, teachers from reward system
argued that rewards are given in terms of funds whereby each subject grade was
charged. Therefore, teachers’ interest in this case was to struggle for their students to
pass their subjects so as to earn more money (Bangi, 2008). On the basis of these
findings teachers are intrinsically motivated and they can struggle to teach so as to
achieve their goal.
Sima (2010) with the study of exploring the effect of motivation practices on
employees attitude, which employed qualitative research design, found that main
motivation considered included recognition, working condition, rewards, pay
package, training compassionates, security and allowances and this could positively
increase workplace performance. Researcher recommends that salaries overtime pay
and rewards should be reviewed for better performance and reduction of turnover,
50

despite the analysis that showed the effect of motivation practices the study did not
show how it has the consequences in the organization performances.
2.9 Provision of Accommodation and Improvement of Teachers’ Work
Performance
Ngailo (2010) also did a study examining the effectiveness of the criteria’s used by
the employer to promote their employees in relation to effective performance of
working organization. The study employed qualitative approach whereby
questionnaire and documentary review were used as instrument to get data. The
findings showed that employees show resistance to appraisal system because they did
not believe that the system reflects supervisor bias. Again, the study examined those
employees’ claims that no adequate notice was given for the promotion process,
addition to that no job description was given for the promotion process and employee
do not participate in setting goal and agree with their supervisor/manager. Therefore,
Ngailo (2010) finalizes that the respondents are not aware on the application of
promotion. But the study has failed to show the impact of motivation on workers
performance since respondents showed negative response to be involved in
motivation process.
Ruchoro (2002) conducted a study investigating how motivation of workers impacts
productivity and economic performance. The study employed the use of desk study,
questionnaires, interviews and observations instrument in collection of data. The
study found that the provision of houses and transport assistance functions as inputs
to create work ability and confidence, but this was contrary to some of workers since
only few workers are given this privilege. Due to that circumstance Ruchoro (2002)
51

concludes that motivation is an input to promote workers creation and production in
the project is still poor. Hence this signifies poor performance since workers are not
motivated. Therefore it may be connected with the influence of incentives and
rewards to work performance.
Mwanvi (1995) in the study of assessing the factors leading to poor production
performance of the enterprises used a contingency approach as propounded by Fred
Fieldler which states that the performance of group is contingent upon both the
motivational system of the leader. The findings of the study showed that
accommodation needs influence workers performance. Furthermore, workers use a
lot of amount of their salaries in renting house, while the renting cost keeps going up
and not matching with the amount of the salaries’ that is raised by the government.
Given example from his study (Mwanvi, 1995) identifies that employees were forced
to rent houses of three rooms, one for the parents, the second one for boys and third
one for girls, while the cost for one room estimated to range between 2000/-
2500/=per month. To minimize the cost of renting houses, teachers were forced to
find house in remote area that were far from their working area. Hence the situation
decreases teachers work performance.
Mwakilembe (1981) did the study to survey the opinions of teachers regarding the
relationship of lack of motivation and exodus of teacher. The study employed
questionnaires in collection of data. The findings reveal that, teachers have intrinsic
interest in the teaching profession; there is high correlation between extrinsic
motivation and teachers’ exodus. Furthermore, the study revealed that some extrinsic
motivation factors that attract teacher out of the ministry are more fringe benefits and
52

incentives, higher salaries, good administration. Others demands proposed by the
respondents were accommodation, more chance for teacher and better administration
and stable education procedures. Although the study showed the demands of
teachers, it didn’t show how these demands influence teachers work performance.
2.10 Increase in Salaries and Allowances and Work Performance
Steffeseen (1965) in his study of differentiating teachers’ salaries noticed that most
of the United States public school teachers are paid in accordance with a salary
policy which recognizes two dimensions level of educational attainment and years of
experience. Attempts to introduce a “merit” dimension have usually been abandoned.
Proponents of this system have frequently justified their position on the theme of
“improvement of instruction”, but it is difficult to accept the claim that there is a
unique relationship between the differential and motivation regardless of the amount
of the differential.
The findings showed that schools regardless of their salary programs carried out
thorough evaluation and supervision programs. Yet, considerable interest existed in
increasing maximum salary levels on a differential basis, if only to attract to teaching
the most capable university graduates. The study suggested that one possible solution
is the adoption of additional payments for positions of responsibility, preferably with
the teachers’ organizations having a voice in the determination of the rank and pay of
their colleagues.
Inayatullah (2009) did a study to examine the effects of motivation on job
performance in public and private schools of Peshawar city in the Province of
53
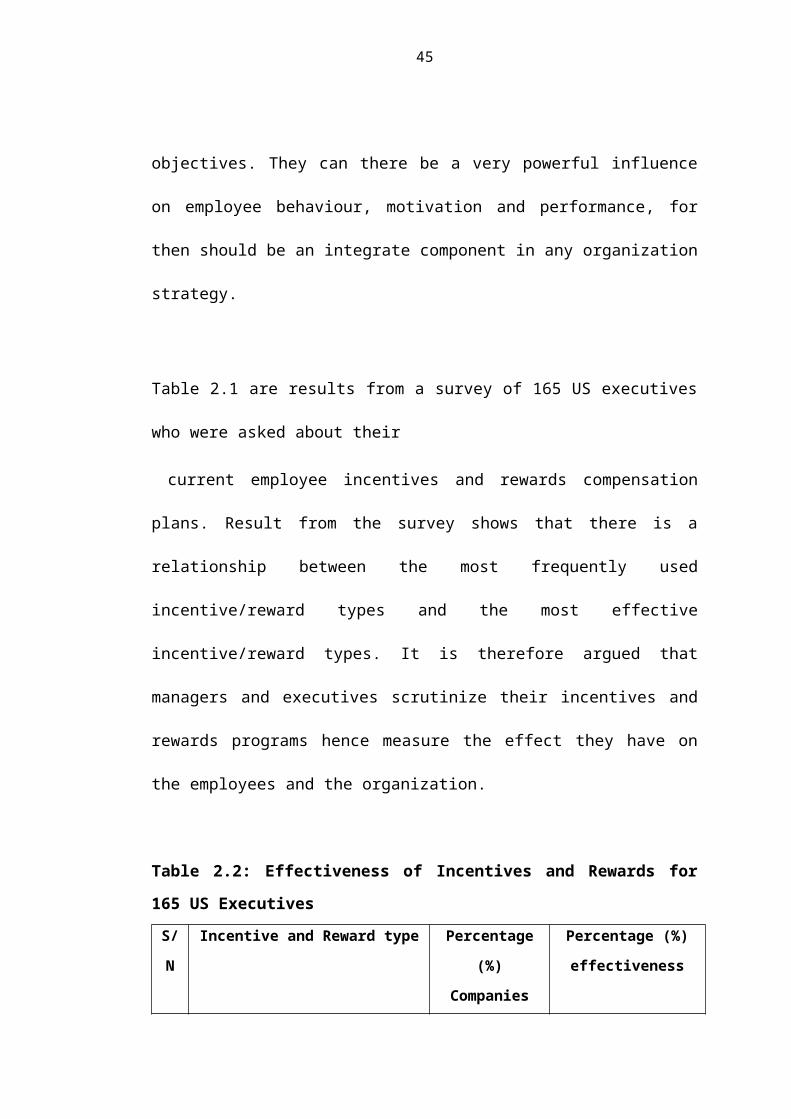
Khyberpakhtunkhwa. The collected data was analysed through SPSS software. The
findings of the study revealed that there is a significant and positive relationship
between teacher’s motivation and their job performance. There have been studies on
the influence of motivation on performance among teachers and such motivations
include increased salaries and allowances, transport cost, and other fringe benefits.
Therefore, the study would help schools and colleges to improve the motivation level
of teachers that would lead to better job performance however the study has failed to
show the various salaries and wages paid to teachers determine teacher’s work
performance.
Adam and Naphcha (2007) in their study of attempting to determine to what extent
the salary level of teachers working in public educational systems is connected with
the trend towards privatization, they reveal that privatization has become now days a
prominent phenomenon in educational systems around the world. With a use of a
secondary analysis of the 2003 data coming from 29 organisation for Economic Co-
operation Development (OECD) countries was conducted attempting to reveal what
educational as well as economic antecedents other than the GDP per capital may
account for the differences among various countries in the salary level of teachers
working in public education.
The findings provided evidence that teacher’s salary level is correlated with the
degree of privatization characterizing a particular educational system. Specifically,
the evidence suggests that if less than 15 percent of the students study in private
schools in a given state, teachers’ salaries is likely to be below the expected salary
according to the state’s GDP per capital. The study concluded by stating that the
54
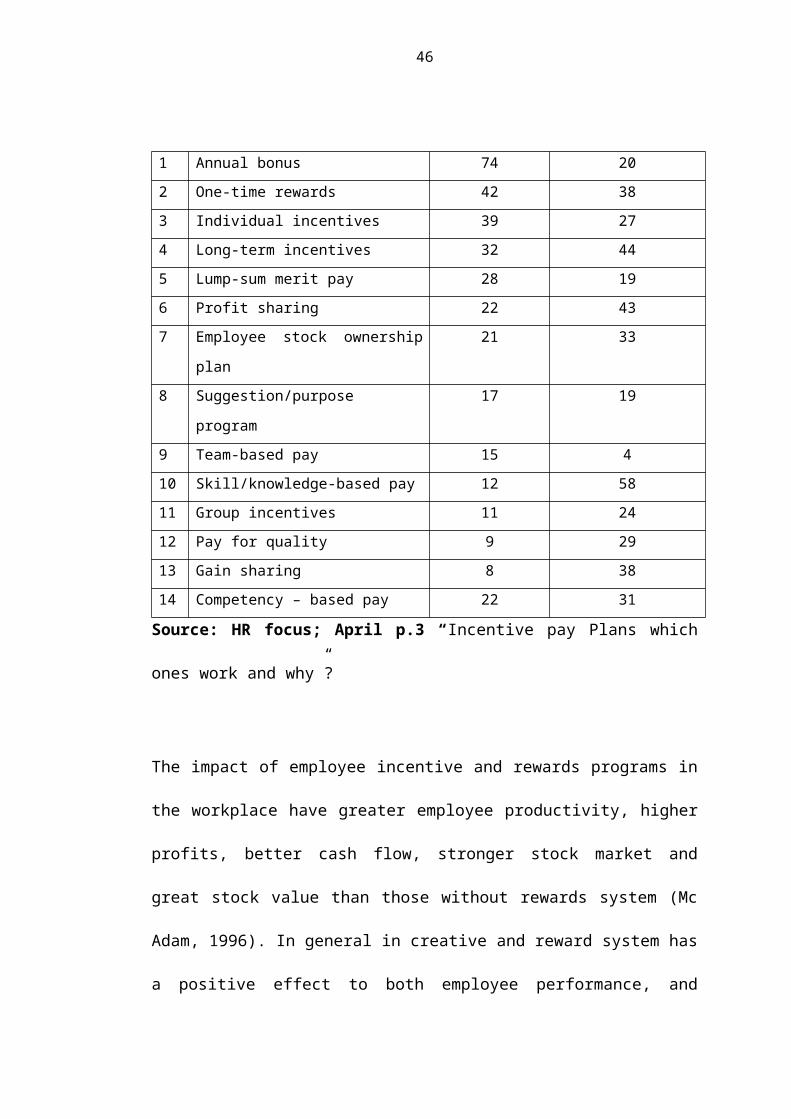
existence of a private sector alongside the public one may indirectly contribute to an
increase of the salary level of teachers working in the public education sector even
though the author has not stated clearly how different salaries and wages have
facilitated teacher’s work performance.
Anorld (1967) in his study for comments and green for goal argues that teachers
regard themselves as low-paid workers but this is not their image in the labour
movement. In addition, they are struggling to reconcile the trade unions with the
government’s wages policy so that to help in decision to grant teachers a substantial
rise. Findings of the study revealed that teachers persuaded the government to offer
nothing more than a nominal increase that they wished. And the teachers, always,
were in a quarrelsome mood.
The study went further commenting that if substantial offer can be made the situation
will be of uncommon interest educationally as well as politically. Findings suggested
that inadequate payment causes some dissatisfaction among the teachers, but
promotions may be better than salary increase promotions are also one of the most
important rewards in an organization and such, they must be allocated in a way that
gives hope and motivation to a maximum number of employees (Chilumba, 1994:
44).
Chilumba (1994) in his study observed that one way of undermining the status of
salaried workers is to create purposely some irregularities in the process of monthly
payments. Teachers experienced difficult lives because their monthly payments were
not forthcoming. Situations, in which salaries were not adequate, delayed and often
55

not paid at all in which teaching was not seen an activity meriting esteems and in
which the governments attached representatives of teachers. The author states that in
general, more than a half of the sampled teachers were dissatisfied with the salaries
they received. Apart from knowing the problem of payments of teachers’ salaries
through educational studies, the societal itself has fresh incidences.
Olouch (2006) conducted a study on challenges seen from different perspectives in
Africa. The author focused his study on teachers from Tanzanian mainland. The
study revealed that most of the developing countries including Tanzanian, teachers
are given inadequate incentives. According to the study, some developing countries
are giving incentives as follows:-
i. Lesotho: 60,000 Maloti per month to locate and teach in some mountainous
areas.
ii. Malawi: 20% of the monthly salary as hardship allowance for working in
remote rural areas.
iii. Mozambique: 100% of the salary for teachers in subjects experiencing great
shortages of teachers.
iv. Uganda: 20% percent of the monthly salary for going to hard to teach areas.
v. Zambia: Teachers are provided with accommodation at once they start
working.
Thus from the study it is then perfect by comparison to those developing countries
that The Tanzanian system has done nothing to motivate teachers to their workplace.
Teachers have been in frequent misunderstandings with the government and hence
the Work performance is automatically declining.
56
Salary structure for the Education Sector Staff in Tanzania;
Teachers and administrators in the ministries, regions and districts share the same
salary Scale. The followings are the educational levels and scales;
Form IV with Training (2 years) Salary Scale Monthly
Pay
Grade A Teacher: Level III TGTS. B1-B 244,400 – 280,800
: Level II TGTS. C2 325,700 – 402,700
: Level I TGTS. D1 469,200 – 551,100
: Senior Teacher TGTS: E1-E2 618,300 - 726,300
Form VI with Training Diploma (2 years)
Diploma Teacher: Education Officer II TGTS: D1 – D 469,200 – 551,100
: Education Officer I TGTS: E2 - E 268,300 – 726,300
: Senior Education Officer TGTS: F2 803,800 – 980,200
Form VI with University Education (3 years)
Graduate Teacher: Principal Education Officer II
TGTS – GI-G2-G3 1,059,600 – 1,305,800
: Principal Education Officer I
TGTS – H1 – H2 1,370,000 – 1, 832,000
Note: the scales are in terms of Tanzanian Shillings
Source: Salary scales Education sector, civil servants in Tanzania
Some of the issues about this scale include;
i. The most recurrent complaint from teachers was that their salaries do not
provide a living wage. They say that are paid less than civil servants in other
categories with similar numbers of years of education such as health workers.
57

The Tanzania Government salary structure for 2010/2011 given below shows,
for example, that new employees in health have unit recently started at with a
salary of Tsh. 290,000, while a Grade A teacher started with 196,500 or Level
A1. Recently the government has increased the starting level for teachers to
Shs 244,400 or level B, but the health person, at Scale, will be getting shs.
462,000.
ii. In general, salaries under the set schemes without additional benefits do not
provide a living wage. They are so low that they encourage teachers to look
for other means of earning income. These activities in turn reduce the amount
of attention and time teachers spend either in the school or professional
activities such as preparation and marking. Even with the recent upgrade of
salaries, there in still little incentive for bright young people to go into
teaching.
iii. The latest comparison of salaries taken from the World Bank (2011) shows
that Tanzania had the third lowest salaries in the whole of Africa.
iv. There is no special incentive for university graduates in areas of high demand
such as science, mathematics and English to become teachers. Science
teachers used to receive an additional increment over other teachers but this
was dropped some years ago for financial reasons.
v. Teachers complain that the range within the schemes of service is inadequate,
with a maximum of five grades in each scheme; a teacher arrives at the bar of
his or her scale after 12 to 15 years while he or she may have 20 or even 30
years more to go until retirement. This is a long period when the teacher
receives no increase in salary.
58

vi. Because the salaries of the grades overlap and a teacher is required to pass
through the entry point of each new grade, a teacher who upgrades his or her
education and thus moves from one scheme to another may find himself or
herself at an official lower salary level than before. A certificate teacher, for
example, moving from the Senior Teacher TGTS E (Tsh 618,300) to become
a diploma teacher, Assistant Education Officer III would officially be at the
lowest salary of the new scheme TGTS C (Tsh 325,700). Similarly, the
degree teacher who moves to Education Officer II would officially be at the
lowest salary TGTS D (Tsh 469,200). In each case, the teacher’s salary would
not decrease but he or she would have to spend at least three years at lower
level without a salary increment.
vii. There is no increase in salary or provision of additional benefits such as
transport, utilities, housing, or responsibility allowances when teachers take
on the role of head teacher, headmaster or teachers college principal etc. This
means that there is little incentive for teachers to assume the additional
management and administrative responsibilities, and it is also harder for the
Ministry or the districts to hold headmasters accountable, they have nothing
to lose.
viii. Ministry of education and vocational training (MoEVT) has recently agreed
to provide incentive to encourage teachers to take up assignments in difficult
areas. According to the Guardian (20/7/2011), the Minister allowance of Tsh
500,000. Experience in providing incentives suggests that a more effective
way would be payments of Shs 500,000 at regular intervals e.g., annually
over a five year contract with an additional gratuity at the end of the contract
59
period.
The findings of the study also indicate that there is different in salaries and wages
between government and private owned schools. Most of the private schools were
found to offer good salary and hence enhance many teachers to left government
schools. Taking example from graduate teachers from university of Dar es Salaam
whereby author has indicated that poor contract and low amount of salary from
government forced them to switch to private schools or looking for other job with
high salary.
Olouch (2006) went further and showed that, teachers are earning less than what is
required for human survival. For instance a teacher with a Diploma in Education in
public schools is less than Tshs. 100,000; the expenditure for a single teacher per
month in rural areas is estimated at a cost of Tshs. 150,000. For a teacher with a
family of one child, the estimated expenditure was found to be TShs. 324,000. This
finding is almost the same as another finding where teachers mentioned that the
minimum salary for beginner per month should be at a range of Tshs. 250, 000 -
300,000. However, the study hasn’t shown that different salaries and wages among
teachers can influence their working performance in their workplace.
2.11 Synthesis and Research Gap
For the case of Tanzania, many literatures have explained on the issues that relate
reasons for motivations in work place including schools and other institution but they
do not directly show how provision of incentives and rewards can lead to the
performance. This study is therefore; attempt to fill in this gap by exploring the
60

influence of incentives and rewards on teachers’ work performance using the case of
Mbeya Region, Tanzania.
61

CHAPTER THREE
3.0 RESEARCH METHODOLOGY
3.1 Introduction of the Chapter
This chapter states how the study was done and the procedures used in collecting and
analysing the research findings. The chapter explains the approach on how the
research was designed, the study area, sample size taken, sampling procedures made,
and methods of data collection used reliability and validity of used instruments and
the way data was analysed.
3.2 Study Area
The research was conducted in Mbeya region involving teachers in secondary
schools such as Mbeya Day, Loleza Girls, Samora Machel, Sinde , Iyunga Technical
and Ilomba secondary schools. The two major reasons for selecting Mbeya Region as
a study area were: firstly the region has many schools thus it was easy to access
teachers and obtain required information. Also, Mbeya Region has to present the all
picture of Tanzanian schools as it should be possible to get the same results as
obtained at Mbeya Region, even if taken from the other regions.
3.3 Research Approach
This study employed both qualitative and quantitative research approach. The
approach was done by triangulation combining or associating both qualitative and
quantitative forms of research (Creswell, 2009). Bryman (2008) observes that,
integrating both qualitative and quantitative research approaches is a strategy of
overcoming each method’s weaknesses and limitations. The qualitative approach was
used to get specified analytical information derived from interviews on Heads of
62

Schools and Districts Education Officers (DEO), while the quantitative approach was
used to collect quantifiable data from questionnaires on teachers. This study was
dominated by qualitative approach as its emphasis is on deep understanding of the
phenomena by looking closely at people’s words, actions and records on incentives
and rewards on influencing on the work performance of teachers.
3.4 Research Design
Kothari (2004) defines research design as conceptual understanding of conditions for
data collection and analysis in a style that aims at combining research relevance with
economic procedures. A research design provided a framework for the collection and
analysis of data (Bryman, 2012). In general, the purpose of research design was to
facilitate the smooth sailing of various research operations, thereby making research
as efficient as possible yielding maximal information with minimal expenditure of
effort, time and money. Also it helped to guide a researcher control the process of
data collection and data interpretation (Kothari, 2004).
3.5 Sampling Procedures
Sampling procedure is a process of selecting a number of individuals or objects from
a population such that selected group contains element of representative
characteristics found in the whole group (Kothari, 2004). Sampling techniques are
divided into two: probability sampling and non-probability sampling. Secondary
school has been selected from three categories: urban secondary schools, semi urban
secondary schools and rural secondary schools. For urban secondary schools Mbeya
day secondary school and Loleza secondary school were involved. Semi urban
secondary school involved Sinde secondary school and Samora Machel secondary
63

school. For rural secondary schools the research involved Iyunga Technical and
Ilomba secondary school.
3.6 Sample and Sample Size
A sample is a small group of subjects drawn from the population in which the
research is interested in gaining the information and drawing conclusions about the
universe (Kothari, 2004). Moreover, it enables the research to achieve objectives
with reduced resources (Bernard, 1995). The sample of this study were teachers from
Mbeya Day, Loleza Girls, Iyunga Technical, Ilomba, Samora Machel and Sinde
secondary schools beind among the 113 schools in Mbeya Region.
The actual sample size was determined by the saturation of information from the
source of information and availability of those sources of information, although it
aimed at all teachers at those six schools but it was possible to take the data from 239
present teachers out of the registered 266 teachers, from where the questionnaires
were corrected and interviewed four Heads of Schools from six targeted, three
Districts Education officers, the Region Education Officer and other educational
stake holders (namely a TSD officer and a School Inspector).
3.7 Respondents’ Profile
This section presents general characteristics of the sample and the profile of the
respondents who responded to the questionnaires and interviews of this study. This
part is useful as it gives the general features of the respondents such as gender, age,
level of education and employment status of respondents.
64
3.7.1 Gender of Respondents
Out of 239 respondents for this study, 109 respondents equivalent to 46% were males
and 130 respondents equivalent to 54% were females. This implies that the sample of
this study was representative as both genders were included to give out their
opinions. Moreover, the number of the female respondents was larger than that of
male respondents due to the fact that most women prefer teaching to other carriers.
The gender profile of the respondents is presented in Table 4.1 and Figure 4.1.
Table 3.1: Distribution of Respondents by Gender
SCHOOL MALE FEMALE TOTAL
Mbeya Day 21 33 54
Loleza Girls 15 30 45
Samora Machel 14 16 30
Sinde 10 22 32
Iyunga Tech. 29 15 44
Ilomba 20 14 34
GRANT TOTAL 109 130 239
Figure 3.1: Distribution of Respondents by Gender
65

3.7.2 Age of Respondents
Out of 239 respondents who were asked to respond to the study questions, 116
respondents equivalent to 48% fell in the category of 31-40 years, 71 respondents
equivalent to 30% fell in the category of 21-30 years, 45 respondents equivalent to
19% fell in the category of 41-50 years, 5 respondents equivalent to 2% fell in 51-60
years and 2 respondents equivalent to 1% fell in the category of above 60 years (on
contract base). Hence, this shows that all respondents of this study were adults and
that undoubtedly are teachers found at Loleza girls, Mbeya day, Iyunga technical,
Samora Michael, Ilomba and Sinde secondary schools in Mbeya region. This shows
that most of the teachers are aged between 31-40 years. The age profile summary of
the respondents is shown in Table 4.2 and Figure 4.2.
Articles from journals and pamphlets and technical papers and dissertations. The fact
that secondary data have been collected for another different purpose is one of the
limitations of the secondary sources of data (Kane and O’Reilly, 2001), but the
researcher was aware of this limitation. This fact led to the need of the use of primary
data as well. The main purpose of using secondary data in this study was to know the
severity or magnitude of the problem and to understand in the wide range how
incentives and rewards influence teachers work performance in Tanzania. Some data
were obtained from the Regional Educational office and used for helpful information
for discussions.
66
Table 3.2: Distribution of Respondents by Age
Age
(yrs)
Mbeya Day Loleza Girls Samora Machel Sinde Iyunga Tech. Ilomba Total
Gender M F T M F T M F T M F T M F T M F T M F T
21-30 08 04 12 03 06 09 07 06 13 06 13 19 06 02 08 05 05 10 35 36 71
31-40 05 24 29 09 20 29 03 06 09 01 06 07 17 10 27 10 05 15 45 71 116
41-50 05 04 09 03 04 07 04 04 08 03 03 06 05 03 08 04 03 07 24 21 45
51-60 02 01 03 00 00 00 00 00 00 00 00 00 00 00 00 01 01 02 03 02 05
Above 60 01 00 01 00 00 00 00 00 00 00 00 00 01 00 01 00 00 00 02 00 02
Grand Total 21 33 54 15 30 45 14 16 30 10 22 32 29 15 44 20 14 34 109 130 239
Note: The above 60 years old teachers were found as technical teachers working at Mbeya Day and Iyunga Technical schools at contract bases.
And significance for age to the respondents was that at early age the experience is more as less than that of the mid age which the most working age
67
Figure 3.2: Distribution of Respondents by Age
3.7.3 Highest Education Level Attained by Respondents
Out of 239 respondents who were requested to respond to this study, 83 respondents
equivalent to 35% had attained at Degree level education, 135 respondents
equivalent to 56% had attained Diploma education, 15 respondents equivalent to 6%
had attained Postgraduate education, and 6 respondents equivalent to 3% had
attained other kind of education. This indicates that the study had considered all
levels of education and that the responses given out by the respondents differed due
to the different levels of education they have. This signifies that the findings of the
study are representative. The education profile summary of the respondents is
presented in Table 4.3 and Figure 4.3.
68
Table 3.3: Distribution of Respondents by Educational Levels
Level Mbeya Day Loleza Girls Samora Machel Sinde Iyunga Tech. Ilomba Total
Gender M F T M F T M F T M F T M F T M F T M F T
Diploma 05 19 24 07 15 22 06 13 19 08 12 20 16 10 26 14 10 24 56 79 135
Degree 12 09 21 07 11 18 08 03 11 02 10 12 07 04 11 06 04 10 42 41 83
Post-
Graduate
03 03 06 01 04 05 00 00 00 00 00 00 03 01 04 00 00 00 07 08 15
Others 01 02 03 00 00 00 00 00 00 00 00 00 03 00 03 00 00 00 04 02 06
Grand
Total
21 33 54 15 30 45 14 16 30 10 22 32 29 15 44 20 14 34 109 130 239
Note that the education level attained at others category were lessened technician teachers and domestic science teachers at schools.
69

Figure 3.3: Distribution of Respondents by Highest Education Level Attained
3.7.4 Employment Status of Respondents
Out of 239 respondents for this study, 5 respondents equivalent to 2% had worked
less than a year, 93 respondents equivalent to 39% worked within 1-5years, 76
respondents equivalent to 32% worked within 6-10 years, 41 respondents equivalent
to 17% worked within 11-15years and 24 respondents’ equivalent to 10% worked
above 15 years. This implies that the respondents are well experienced teaching
carrier. The employment status of the respondents is presented in Table 4.4 and
Figure 4.4.
70

Table 3.4: Distribution of Respondents by Employment Status
Status
(yrs)
Mbeya Day Loleza Girls Samora Machel Sinde Iyunga Tech. Ilomba Total
Gender M F T M F T M F T M F T M F T M F T M F T
Less than 1
year
00 00 00 00 00 00 01 01 02 01 00 01 00 00 00 00 02 02 02 03 05
1-5 03 08 11 05 09 14 02 09 11 02 16 18 08 07 15 14 08 22 34 59 93
6-10 06 11 17 07 13 20 08 05 13 05 04 09 07 03 10 03 04 07 36 40 76
11-15 10 10 20 02 05 07 02 01 03 00 01 01 08 02 10 02 02 24 17 41
Above 15 02 04 06 01 03 04 01 01 02 01 03 06 03 09 01 01 13 11 24
Grand Total 21 33 54 15 30 45 14 16 30 10 22 32 29 15 44 20 14 34 109 130 239
Note that the employment status implies the experience the teachers posses on working as employees.
71
Figure 3.4: Distribution of Respondents by Employment Status
3.8 Data Collection Instruments
Both primary and secondary data collection methods were used to collect
information, whereby primary data methods included interview and questionnaires.
Each of these methods is described below:
3.8.1 Primary Sources of Data
3.8.1.1 Interview for Heads of Schools and Districts Education Officers
According to Kothari (1985: 120), interview is regarded as face-to-face discussion
that is used when gathering certain information. It also involves presentation of all
verbal stimuli and reply in terms of oral-verbal responses. In social research
interview, the aim is for the interviewer to elicit from the interviewee or respondent
as he/she frequently called in survey research in all manner of information (Kane and
O’ Reilly, 2001). In this study, structured interview was used in order to explore the
influence of incentives and rewards on teachers work performance in Tanzania.
Districts Education Officers and heads of secondary schools were interviewed. The
72

purpose of using structured interview is for all interviewees to be given exactly the
same context of questioning.
3.8.1.2 Questionnaires for Teachers
Questionnaires were used to be collected from informants focusing in obtaining
relevant information from teachers who teach secondary schools at Mbeya Region.
Generally, the method helped trace some weakness in personal interviews because
some respondents would not be able to give immediate responses, as sometimes they
are busy with teachings. The then present secondary school teachers of those
government and community secondary schools (Ward secondary schools) were
provided questionnaires. This techniques does not exert much pressure on the
respondents hence make them to be more comfortable (Kothari, 1985: 14;
Rwegashora, 2006). The teachers present were enough to give the required
information for the region as then as a sample for the entire nation.
3.8.2 Secondary Sources of Data
A significant ingredient practically of all researches is the review of the literature,
which makes secondary data essential if the researcher wants to carry out a good
piece of work. Secondary data already exist and are collected for some other
purposes but can be used in current research project (Kothari, 2004). One of the
basic advantages of using secondary data is that it helps the researcher to save time
and money. If the information that answers the research questions already exists, it
would be wastage of time to collect it again through primary data. Secondary data
used in the study include both published and non-published materials (see from the
reference). The former are different books, articles from journals and pamphlets and
73

technical papers and dissertations. The fact that secondary data have been collected
for another different purpose is one of the limitations of the secondary sources of
data (Kane and O’Reilly, 2001), but the researcher was aware of this limitation. This
fact led to the need of the use of primary data as well. The main purpose of using
secondary data in this study was to know the severity or magnitude of the problem
and to understand in the wide range how incentives and rewards influence teachers
work performance in Tanzania. Some data were obtained from the Regional
Educational office and used for helpful information for discussions.
3.9 Validity and Reliability of Instruments
Validity explains the accuracy and truth of the data and findings in the research,
while reliability means that if the respondents or independent observers repeat the
research with the same methods, they will get the same results or data (Kothari,
2004). In order to achieve validity and reliability, the questionnaires were designed
in such a way that they can capture relevant information for the research objectives
(see the sample questionnaires in the appendices). Also, field data collection was
well monitored during data processing, the supervisor refined information. But also
sample questionnaires in Likert scale format were used to ensure validity and
reliability of the instruments.
The research ethics were maintained as to the incident that no respondent had to
write his or her name on the questionnaire and also there were not allowed to write
done their schools. The aspect of educational advancement from an interviewee was
suggested to be linked with many issues including a chance to join colleges or
universities for further studies.
74

The teachers complained that only some teachers being permitted for further studies
while the remaining stay to work for them who are promoted for as recognition.
One experienced female teacher complained:
“Due to various reasons I have failed to get a chance to join the
university. Now, I have being working for 20 years, am still working.
Teachers who were absent for further studies for 3-5 years are promoted
to get better working conditions matching with their educational levels
while we, who remained teaching are not considered for promotion,
hence not recognized. Indeed, am discouraged.”
One educational stakeholder (Inspector) commented:
“The government does not provide to teachers houses for accommodation
at school compounds, something which makes them depend much on
public transport to and from school. They usually report at school very
late for the same reason. This denies them time for teaching preparation
and consultation with the students. In some cases they have to leave
school earlier in order to cope with public transport crisis and therefore,
they do not have adequate time to provide remedial teaching for slow
learners.”
The quotation indicates that since teachers have no houses and reliable transport,
their teaching morale is low and dissatisfied with their job. This consequently makes
them unable to deal with students’ academic problems hence poor performance.
One of the educational officers shared the following with the researcher:
“Many people despise teachers due to the salaries they receive and their
living conditions. Currently, when they borrow from shops, most
businessmen reject by saying that they cannot pay back the money.”
75

Teachers complained that they were facing difficulties in their daily lives because
teaching profession was the only source of earning for their living. In addition, they
complained that they were not allowed to engage in private tuitions. They further
complained that their profession was being treated unfairly compared to other professions
such as the medical practitioners and lawyers who are allowed to establish and engage in
private firms.
76

CHAPTER FOUR
4.0 DATA PRESENTATION AND ANALYSIS
4.1 Introduction of the Chapter
This chapter presents presentation and analysis of the research findings of the study.
It discusses the major findings and describes the information obtained from
instruments of the study. In this chapter, the findings were discussed in order to
provide answers to each of the research questions.
4.2 Teachers’ Recognition and Work Performance
It was the first objective of the study that aimed at determining whether teacher’s
recognition influence teachers’ work performance. The study evaluated the issue of
teacher’s recognition through the questionnaires and interviews with the
respondents. The respondents were required to agree or disagree on the variables
considered to be the tools for answering the above-mentioned objective. In a general
view, the variables include provision of certificate of appreciation, provision of part
time payments, awarding to week routine duties for good performers, rewards for
higher performers, provision of trips and tours, medical assistance to family
members, provision of loans for purchase of vehicles, burial support, children
education support and annual announcements for good performers. Two hundred and
thirty nine (239) respondents were given questionnaires while ten (10) respondents
were intensively interviewed by the researcher.
The aspect of educational advancement from an interviewee was suggested to be
linked with many issues including a chance to join colleges or universities for further
studies.
77

The teachers complained that only some teachers being permitted for further studies
while the remaining stay to work for them who are promoted for as recognition.
One experienced female teacher complained:
“Due to various reasons I have failed to get a chance to join the
university. Now, I have being working for 20 years, am still working.
Teachers who were absent for further studies for 3-5 years are promoted
to get better working conditions matching with their educational levels
while we, who remained teaching are not considered for promotion,
hence not recognized. Indeed, am discouraged.”
Table 4.1 Specific objective (i) Responses: To Examine How Teachers’
Recognition Influence Teachers’ Work Performance
The following provision influence work performance
Responses
SD D A SA Total1 Provision of certificates of appreciation 02 02 128 92 2392 Provision of part time payments 22 19 81 117 2393 Rewarding routine duties good
performing teachers22 70 83 64 239
4 Rewarding for high performers in academics
- 04 72 163 239
5 Provision of trips and tours for high performers
- 08 131 100 239
6 Medical assistance to family members 13 22 88 116 2397 Provision of loans for purchase of
vehicles14 34 104 87 239
8 Provision of Burial support 03 24 100 112 2399 Children education support 04 14 94 127 23910 Annual announcements for good
performers10 04 115 110 239
Key;
SD: Strongly Disagree
D: Disagree
A: Agree
SA: Strongly Agree
78
4.3 Provision of Accommodation and Work Performance
It was the second objective of the study that aimed at determining whether provision
of accommodation in standard form can improve teachers’ work performance.
Although most of the variables were not at present being provided, the aim of the
researcher was to investigate for the fact that if those items were to be provided, how
will those influence the teachers work performance, that is to say if water rent,
electricity rent has to be paid, security and gardening assurance will all this influence
teachers work performance. The study evaluated the issue of provision of
accommodation through the questionnaires and interviews with the respondents.
The respondents were required to agree or disagree on the variables considered to be
the tools for answering the above-mentioned objective. In a general view, the
variables include given accommodation according to family size, reasonable distance
from teacher’s residence to school, negotiated house rents, high security provided,
assistance to water rent payment, assistance to electricity rent payment, standard
toilet provided, availability of garden at teachers’ houses, standard kitchen provided
and security guard unit available. Two hundred and thirty nine (239) respondents
were given questionnaires while ten (10) respondents were intensively interviewed
by the researcher.
There is a difficulty in the availability of facilitated accommodation, cheap and
reliable public transport facilities had negative implication on both teachers and
students’ performance. One educational stakeholder (Inspector) commented:
“The government does not provide to teachers houses for accommodation
at school compounds, something which makes them depend much on public
79

transport to and from school. They usually report at school very late for the
same reason. This denies them time for teaching preparation and
consultation with the students. In some cases they have to leave school
earlier in order to cope with public transport crisis and therefore, they do
not have adequate time to provide remedial teaching for slow learners.”
The quotation indicates that since teachers have no houses and reliable transport,
their teaching morale is low and dissatisfied with their job. This consequently makes
them unable to deal with students’ academic problems hence poor performance.
Table 4.2 Specific objective (ii) Responses: To Assess How Provision of
Accommodation Improves Teachers’ Work Performance
The followings provisions improves work
performance
Responses
SD D A SA Total
1 Given accommodation according to family size 16 30 114 79 239
2 Reasonable distance from teachers’ residence to
school
09 07 120 103 239
3 Negotiated house rents 14 26 102 97 239
4 High security provided 14 14 98 113 239
5 Assistance for water rent paid 08 42 88 101 239
6 Assistance for electricity rent paid 09 24 96 110 239
7 Standard toilets provided 10 28 106 95 239
8 Availability of garden at teachers’ houses 13 24 112 90 239
9 Standard kitchens provided 06 27 112 94 239
10 Secured housing for teachers provided 10 37 107 85 239
Key;
SD: Strongly Disagree
D: Disagree
A: Agree
SA: Strongly Agree
80

4.4 Salary Levels and Allowances and Work Performance
It was the third objective of the study that aimed at determining whether salary levels
and allowances improve teachers work performance. The study evaluated the issue
of provision of salaries and allowances through the questionnaires and interviews
with the respondents. The respondents were required to agree or disagree on the
variables considered to be the tools for answering the above-mentioned objective. In
a general view, the variables include provision of hourly allowances, reasonable time
of salary payment, doubling teachers’ salary, increase teachers’ salary by 50%,
regular annual increase of salary and wages, provision of annual bonuses, doubling
transport allowance, provision of transfer allowance, provision of hardship
allowance and provision of education studies allowance.
Two hundred and thirty nine (239) respondents were given questionnaires while ten
(10) respondents were intensively interviewed by the researcher. Most of the
variables like provision of bonuses, hourly allowances, and provision of settlement
allowances were by the time not done, but the researcher intended to know for what
extend if the items were being provided may improve work performance. Payment of
salaries in time for present was found to be not a problem.
The teachers complained that they were performing the basic role of building the
nation yet they were despised by being given very meagre salaries.
One of the educational officers shared the following with the researcher:
“Many people despise teachers due to the salaries they receive and their
living conditions. Currently, when they borrow from shops, most
81

businessmen reject by saying that they cannot pay back the money.”
Teachers complained that they were facing difficulties in their daily lives because
teaching profession was the only source of earning for their living. In addition, they
complained that they were not allowed to engage in private tuitions. They further
complained that their profession was being treated unfairly compared to other professions
such as the medical practitioners and lawyers who are allowed to establish and engage in
private firms.
Table 4.3 shows (iii) Responses: To Find Out if Salaries and Allowances Improve
Teachers’ Work Performance.
Table 4.3 Specific objective
The following items improve teachers work
performance
Responses
SD D A SA Total
1 Provision of hourly allowances 10 12 89 128 239
2 Salaries payments in time 00 02 92 145 239
3 Doubling teachers salary 06 29 83 121 239
4 Increase teachers’ salary by 50% 06 25 54 154 239
5 Regular annual increase if salary and wages 08 14 76 141 239
6 Provision of annual bonuses 04 26 74 135 239
7 Doubling transport allowance 05 25 64 145 239
8 Provision of transfer transport allowance 10 11 63 155 239
9 Provision of hardship settlement allowance 08 18 71 142 239
10 Provision of education studies allowance 10 13 77 139 239
Key;
SD: Strongly Disagree
D: Disagree
A: Agree
SA: Strongly Agree
82
4.5 Visual Presentation of Responses to Individual Items
i. Incentives and rewards are human resource management techniques used by
employers to manage their work force effectively.
ii. Incentives and rewards are used within the work place for motivation, to
improve morale, increase productivity and encourage workers to contribute
their best quality of work.
One difference between an incentive and a reward is the time line. You offer
incentives before work starts and offer rewards after the work is completed. You
give rewards to employees who directly perform well, while offering incentives to
employees who aren’t yet up to par. The reward is the prize that you give your
employee as a result of offering the incentive program, so in this way the incentive is
a cause and the reward is an effect.
4.5.1 Incentives Items for Respondents
4.5.1.1 Medical Assistance to Family Members
Another variable in this objective required to measure whether medical assistance to
family members increase teachers work performance. Among 239 respondents were
asked whereas, 116 respondents equivalent to 49 % strongly agreed, 88 respondents
equivalent to 37% agreed, 22 respondents equivalent to 9% disagreed and 13
respondents equivalent to 5% strongly disagreed that medical assistance to family
members increase teachers work performance. Respondents’ response is shown in
Figure 4.1. This was extracted from Table 4.1
83

Figure 4.1: Respondents’ Opinion on Medical Assistance to Family Members
The pie chart above shows that 86% of the respondents agreed to the question.
Therefore, this implies that medical assistance to family members improve teachers
work performance.
4.5.1.2 Provision of Loans for Purchase of Vehicles
The researcher intended to know whether provision of loans for purchase of vehicles
increases teachers work performance. 104 respondents equivalent to 44% agreed and
87 respondents equivalent to 36% strongly agreed that provision of loans for
purchase of vehicles make teachers work extremely good. While 34 respondents
equivalent to 14% disagreed, 14 respondents equivalent to 6% strongly disagreed
that loans for purchase of vehicles improve performance of teachers. The summary
of the responses are shown in figure 4.2. This was extracted from Table 4.1
84
Figure 4.2: Respondents’ Opinion on Provision of Loans for Purchase of
vehicles
The figure above shows that 80% of the respondents agreed to the question. This
implies that loan make teachers work well.
4.5.1.3 Provision of Burial Support
For the variable whether provision of burial support influence teachers work
performance, the variable intended to examine the role of burial support. About 239
respondents were questioned for this purpose whereas 112 respondents equivalent to
47% strongly agreed 100 respondents equivalent to 42% agreed, 24 respondents
equivalent to 10% disagreed and 3 respondents equivalent to 1% strongly disagreed.
The respondents’ response is shown in figure 4.3. This was extracted from Table 4.1
85

Figure 4.3: Respondents’ Opinion on Provision of Burial Support
The pie chart above shows that 89% of the respondents agreed to the question.
Therefore, this implies that burial support influence teachers work performance.
4.5.1.4 Children Education Support
Other question required respondents to reply as to whether children education
support makes teachers to work harder. Among 239 respondents questioned
whereby, 127 respondents equivalent to 53% strongly agreed, 94 respondents
equivalent to 39% agreed, 14 respondents equivalent to 6% disagreed and none of
the 4 respondents’ equivalent to 2% strongly disagreed. Respondents’ response is
shown in figure 4.4. This was extracted from Table 4.1
86
Figure 4.4: Respondents’ Opinion on Children Education Support
Most of the respondents replied to the question agreed equivalent to 92% therefore,
they supported that children education support facilitate teachers work performance.
4.5.1.5 Given Accommodation According to Family Size
The researcher intended to examine whether the accommodation was to be given
according to family size improves teacher’s work performance. About 239
respondents were questioned for this purpose whereas 30 respondents equivalent to
12% disagreed and 16 respondents equivalent to 7% strongly disagreed that size
according to family size influence teachers work performance. On the other hand,
114 respondents equivalent to 48% agreed and 79 respondents equivalent to 33%
strongly agreed that the accommodation were given according to family size
influence teachers work performance. The summary of the responses is shown in
Figure 4.5. This was extracted from Table 4.2
87

Figure 4.5: Respondents’ Opinion on the Accommodation Given According to
Family Size
The figure above shows that 81% of the respondents agreed that the accommodation
were to be given according to the family size influence the teachers work
performance. This implies that the accommodations have to be given according to
the family size make teachers to perform well.
4.5.1.6 Reasonable Distance from Teachers’ Residence to School
The researcher intended to know whether there should be reasonable distance from
teacher’s residence to school. Seven (7) respondents equivalent to 3% disagreed and
9 respondents equivalent to 4% strongly disagreed that there is reasonable distance
from teacher’s residence to school. While 120 respondents equivalent to 50% agreed,
103 respondents’ equivalent to 43% strongly agreed that there should be reasonable
distance from teacher’s residence to school. The summary of the responses are
shown in Figure 4.6. This was extracted from Table 4.2
88

Figure 4.6: Respondents’ Opinions on Reasonable Distance from Teacher’s
Residence to Schools
The figure above shows that 93% of the respondents agreed that there is reasonable
distance from teacher’s residence to school. This implies that reasonable distance
from teacher’s residence make teachers work harder hence high performance.
4.5.1.7 Negotiated House Rent
The researcher intended to know whether the negotiated house rent will increase
teachers work performance. 102 respondents equivalent to 43% agreed and 97
respondents equivalent to 40% strongly agreed that there should be negotiated house
rent. While 26 respondents equivalent to 11% disagreed, 14 respondents equivalent
to 6% strongly disagreed that there is negotiated house rent. The summary of the
responses are shown in Figure 4.7. This was extracted from Table 4.2
89

Figure 4.7: Respondents’ Opinion on Negotiated House Rent
The figure above shows that 83% of the respondents agreed that negotiated house
rent increase teachers work performance. This implies that negotiated house rent
brings comfort ability of teachers hence improve teacher’s work performance.
4.5.1.8 Secured Housing Provided
For the variable on whether there should be high security provided in teachers’
housings. About 239 respondents were questioned for this purpose whereas 113
respondents equivalent to 49% strongly agreed, 98 respondents equivalent to 41%
agreed, 14 respondents equivalent to 6% disagreed and14 respondents equivalent to
6% strongly disagreed that there is high security provided in teachers’ residence. The
respondents’ response is shown in Figure 4.8. This was extracted from Table 4.1
90
Figure 4.8: Respondents’ Opinion on Secured Housing Provided
The pie chart above shows that 88% of the respondents agreed to the question.
Therefore, this implies that high security provided to teachers’ residence influence
teachers work performance.
Most of the respondents replied to the question agreed equivalent to 79% therefore,
they supported that reasonable water rent payment facilitate teachers work
performance.
4.5.1.9 Standard Toilet provided
The researcher intended to know whether standard toilet provision may increase
teachers work performance. Here 106 respondents, equivalent to 44% agreed and 95
respondents equivalent to 40% strongly agreed that standard toilet make teachers
work extremely good. While 28 respondents equivalent to 12% disagreed, 10
91

respondents’ equivalent to 4% strongly disagreed that existence of standard toilet in
teacher’s house can improve performance of teachers. The summary of the responses
are shown in Figure 4. This was extracted from Table 4.2
Figure 4.9: Respondents’ Opinion on Standard Toilet Provided
The figure above shows that 84% of the respondents agreed to the question. This
implies that standard toilets make teachers work well.
4.5.1.10 Availability of Garden at Teachers’ Houses
On the question whether availability of garden may influence teachers work
performance, the variable intended to examine for the presence of garden to
teachers’ homes impact. About 239 respondents were questioned for this purpose
whereas 90 respondents equivalent to 38% strongly agreed 112 respondents
equivalent to 47% agreed, 24 respondents equivalent to 10% disagreed and 13
92

respondents equivalent to 5% strongly disagreed. The respondents’ response is
shown in Figure 4.20. This was extracted from Table 4.2
Figure 4.20: Respondents’ Opinion on Availability of Garden at Teachers’
Houses
The pie chart above shows that 85% of the respondents agreed to the question.
Therefore, this implies that availability of garden to teachers’ residence can
influence teachers work performance.
4.5.1.11 Standard Kitchen Provided
Other question required respondents to reply as to whether standard kitchen provided
can make teachers to work harder. Among 239 respondents questioned whereby, 94
respondents equivalent to 39% strongly agreed, 112 respondents equivalent to 47%
agreed, 27 respondents equivalent to 11% disagreed and 6 respondents equivalent to
3% strongly disagreed that existence of standard kitchen provided in teacher’s house
93
will make teachers to perform well. Respondents’ response is shown in Figure 4.31.
This was extracted from Table 4.2
Figure 4.31: Respondents’ Opinion on Standard Kitchen Provided
Most of the respondents replied to the question agreed equivalent to 83% therefore,
they supported that standard kitchen provision facilitate teachers work performance.
4.5.1.12 Security Guard Unit Available
Another variable in this objective required to measure whether availability and
provision of security guard unit may increase teachers work performance. Among
239 respondents were asked whereas, 85 respondents equivalent to 36% strongly
agreed, 107 respondents equivalent to 45% agreed, 37 respondents equivalent to
15% disagreed and 10 respondents equivalent to 4% strongly disagreed that
availability of security guard unit increase teachers work performance. Respondents’
response is shown in Figure 4.42. This was extracted from Table 4.2.
94

Figure 4.42: Respondents’ Opinion on Security Guard Unit Available
The pie chart above shows that 81% of the respondents agreed to the question.
Therefore, this implies that security guard unit available can improve teachers work
performance.
4.5.1.13 Salaries Payment in Time
The researcher intended to know whether salaries were paid in time. Two (2)
respondents equivalent to 1% disagreed and none of the respondents strongly
disagreed that there is reasonable time of salary payment. While 92 respondents
equivalent to 38% agreed, 145 respondents’ equivalent to 61% strongly agreed that
there was reasonable time of salary payment. The summary of the responses are
shown in Figure 4.53. This was extracted from Table 4.3
95

Figure 4.53: Respondents’ Opinions on Salaries Payment in Time
The figure above shows that 99% of the respondents agreed that there was salaries
payment in time. This implied that reasonable time of salary payment increases
teachers work performance.
4.5.1.14 Regular Annual Increase of Salary and Wages
Other question required respondents to respond to whether the regular annual
increase of salary and wages may influence teachers’ performance. Among 239
respondents questioned whereby, 141 respondents equivalent to 59% strongly
agreed, 76 respondents equivalent to 32% agreed, 14 respondents equivalent to 6%
disagreed and 8 respondents equivalent to 3% strongly disagreed that regular annual
increase of salary and wages can influence teachers’ performance. Respondents’
response is shown in Figure 4.14. This was extracted from Table 4.3
96
Figure 4.14 Respondents’ Opinion on Regular Annual Increase of Salary and
Wages
Most of the respondents replied to the question agreed equivalent to 91% therefore,
they supported that regular annual increase of salary and wages facilitate teachers
work performance.
4.5.1.15 Doubling Transport Allowance
The researcher intended to know whether doubling transport allowance increases
teachers may work performance. Among 239 respondents, 64 respondents equivalent
to 27% agreed and 145 respondents equivalent to 61% strongly agreed that doubling
transport allowance make teachers work extremely good. While 25 respondents
equivalent to 10% disagreed, 5 respondents equivalent to 2% strongly disagreed that
97
doubling transport allowance improves performance of teachers. The summary of the
responses are shown in Figure 4.15. This was extracted from Table 4.3
Figure 4.15: Respondents’ Opinion on Doubling Transport Allowance
The figure above shows that 88% of the respondents agreed to the question. This
implies that doubling transport allowance can make teachers work well.
4.5.1.16 Provision of Transfer Transport Allowance
On the question whether provision of transfer transport allowance influence teachers
work performance. About 239 respondents were questioned for this purpose whereas
155 respondents equivalent to 65% strongly agreed, 63 respondents equivalent to
26% agreed, 11 respondents’ equivalent to 5% disagreed and 10 respondents
equivalent to 4% strongly disagreed that provision of transfer allowance may
98
influence teachers work performance. The respondents’ response is shown in figure
4.16.This was extracted from Table 4.3
Figure 4.16: Respondents’ Opinion on Provision of Transfer Transport
Allowance
The pie chart above shows that 91% of the respondents agreed to the question.
Therefore, this implies that provision of transfer transport allowance will influence
good performance among teachers.
4.5.1.17 Provision of Hardship Settlement Allowance
Other question required respondents to reply as to whether provision of hardship
settlement allowance make performance of teachers to be good in performance those
leaving in remote areas. Among 239 respondents questioned whereby, 142
respondents equivalent to 59% strongly agreed, 71 respondents equivalent to 30%
99
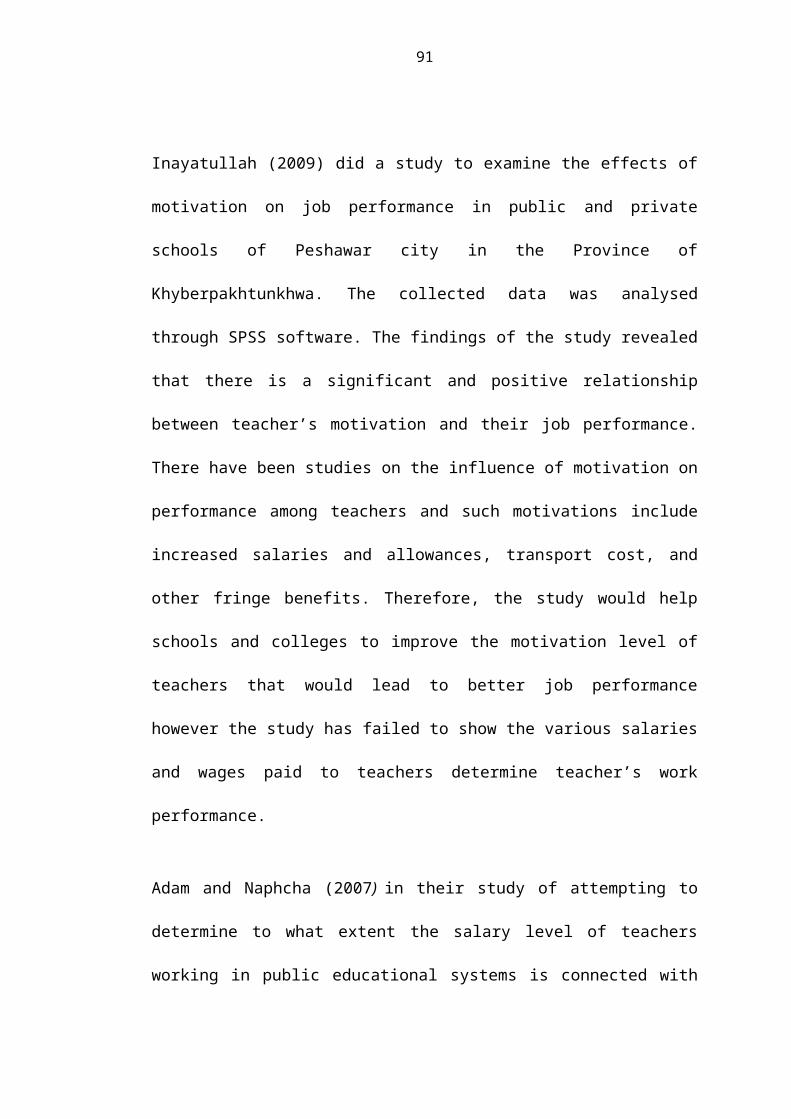
agreed, 18 respondents equivalent to 8% disagreed and 8 respondents equivalent to
3% strongly disagreed that provision of hardship settlement allowance will influence
teachers’ performance in their work place. Respondents’ response is shown in Figure
4.17. This was extracted from Table 4.3
Figure 4.17: Respondents’ Opinion on Provision of Hardship Settlement
Allowance
Most of the respondents replied to the question agreed equivalent to 89% therefore,
they supported that provision of hardship settlement allowance facilitate teachers
work performance.
4.5.1.18 Provision of Education Studies Allowance
Another variable in this objective required to measure whether provision of
education studies allowance increases teachers work performance. Among 239
respondents were asked whereas, 139 respondents equivalent to 58% strongly
100

agreed, 77 respondents equivalent to 32% agreed, 13 respondents equivalent to 6%
disagreed and 10 respondents equivalent to 4% strongly disagreed that provision of
education studies allowance increases teachers work performance. Respondents’
response is shown in Figure 4.18. This was extracted from Table 4.3
Figure 4.18: Respondents’ Opinion on Provision of Studies Allowance
The pie chart above shows that 80% of the respondents agreed to the question.
Therefore, this implies that provision of studies allowance improve teachers work
performance.
4.5.2 Rewards Items for Respondents
4.5.2.1 Provision of Certificates of Appreciation
The researcher intended to examine whether the provision of certificate of
appreciation influence teachers work performance. About 239 respondents were
questioned for this purpose whereas 17 respondents equivalent to 7% disagreed and
2 respondents equivalent to 1% strongly disagreed that the provision of certificates
of appreciation influence teachers works performance. On the other hand, 128
101

respondents equivalent to 54% agreed and 92 respondents equivalent to 38%
strongly agreed that the provision of certificates of appreciation influence teachers
work performance. The summary of the responses is shown in Figure 4.19. This was
extracted from Table 4.1
Figure 4.19: Respondents’ Opinion on the Provision of Certificates of
Appreciations
The figure above shows that 92% of the respondents agreed that provision of
certificates of appreciations influence the teachers work performance. This implies
that the provision of certificate of appreciation make teachers to perform well.
4.5.2.2 Provision of Part Time Payments
The researcher intended to investigate whether the introduction of part time
payments may influence teachers work performance. Part time payments by now are
not provided in government schools. The part time payments are payments which are
to be given to teachers after working beyond their working hours. For instance a
teacher has to work with extra class activities to teach or the remedial class for
102
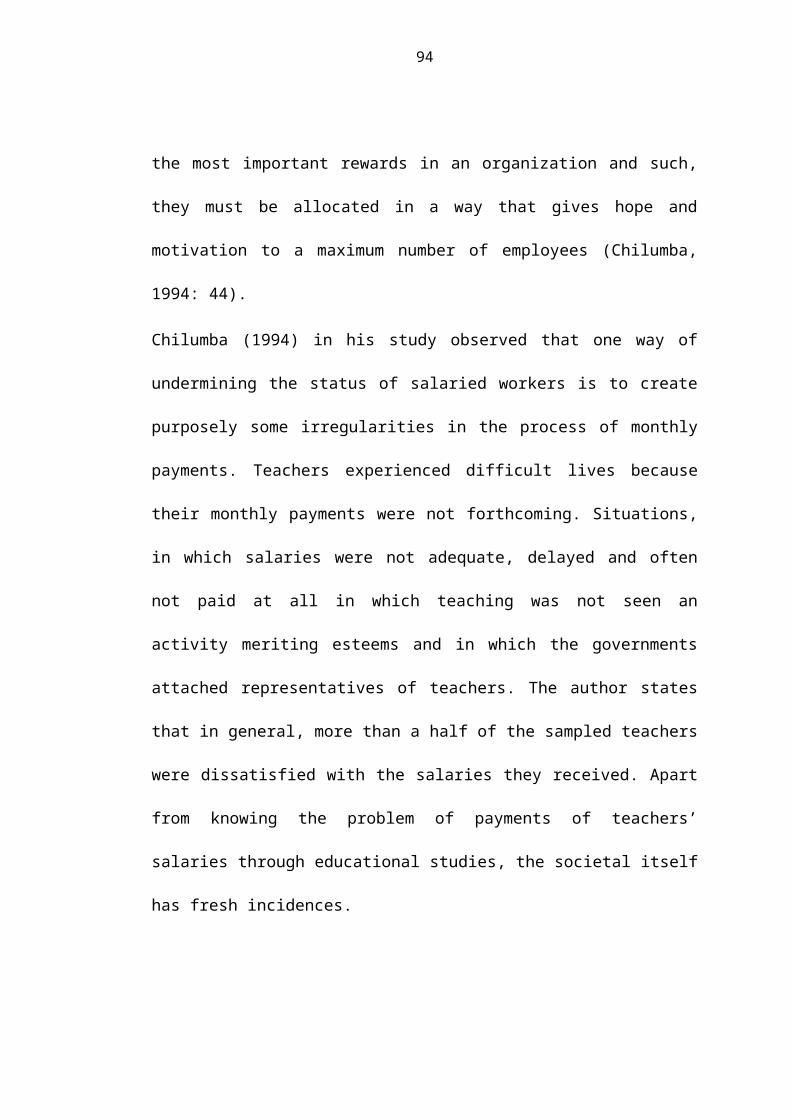
performing extra teaching after working hours. Due to the fact that the government
do not allow teachers to teach extra class teaching by tuition bases, then the
government need to pay the teachers them as part time payments officially. 19
respondents equivalent to 8% disagreed and 22 respondents equivalent to 9%
strongly disagreed that provision part time payments influence teachers work
performance. While 81 respondents equivalent to 34% agreed, 117 respondents
equivalent to 49% strongly agreed that part time payments influence teacher’s work
performance. The summary of the responses are shown in Figure 4.20. This was
extracted from Table 4.1.
Figure 4.20: Respondent s’ Opinions on Provision of Part Time Payments
The figure above shows that 83% of the respondents agreed that if part time
payments will be provided it may influence teachers’ work performance. This
103

implies that the part time payments will make teachers work harder hence high
performance.
4.5.2.3 Rewarding Better Teachers in Routine Duties performance
The researcher intended to investigate the rewarding better week routine duties
teachers may increases teachers work performance. The exercise is not now
practised. 83 respondents equivalent to 35% agreed and 64 respondents equivalent to
27% strongly agreed that rewarding week routine duties for good performers
influence teachers work performance. While 70 respondents equivalent to 29%
disagreed, 22 respondents equivalent to 9% strongly disagreed that when awarding
week routine duties for good performers will increase teachers’ performance. The
summary of the responses are shown in Figure 4.21. This was extracted from Table
4.1.
104

Figure 4.21: Respondents’ Opinion on Rewarding better teachers in Routine
Duties Performance
The figure above shows that 62% of the respondents agreed that rewarding better
teachers in routine duties will increase teachers work performance. This implies that
if week routine duties are rewarded for good performers teachers will perform well.
4.5.2.4 Rewarding High Performers
On the question whether the rewards for high performer in academics influence
teachers work performance, the variable intended to examine the role of rewards to
teachers. About 239 respondents were questioned for this purpose whereas 163
respondents equivalent to 68% strongly agreed 72 respondents equivalent to 30%
agreed, 4 respondents equivalent to 2% disagreed and none of the respondents
strongly disagreed that rewarding high performers influence teachers work
105

performance. The respondents’ response is shown in Figure 4.22. This was extracted
from Table 4.1
Figure 4.22: Respondents’ Opinion on Rewarding High Performers
The pie chart above shows that 98% of the respondents agreed to the question.
Therefore, this implies that rewards for high performers influence teachers work
performance.
4.5.2.5 Provision of Trips and Tours for High Performers
Other question required respondents to reply as to whether provision trips and tours
make teachers to work harder. Among 239 respondents questioned whereby, 100
respondents equivalent to 42% strongly agreed, 131 respondents equivalent to 55%
agreed, 8 respondents equivalent to 3% disagreed and none of the respondents
strongly disagreed that trips and tours for high performers influence teacher’s
106

performance. Respondents’ response is shown in Figure 4.23. This was extracted
from Table 4.1.
Figure 4.23: Respondents’ Opinion on Provision Trips and Tours for High
Performers
Most of the respondents replied to the question agreed equivalent to 97% therefore,
they supported that trips and tours facilitate teachers work performance.
4.5.2.6 Annual Announcements for Good Performers
Another variable in this objective required to measure whether annual
announcements for performers increase teachers work performance. Among 239
respondents were asked whereas, 110 respondents equivalent to 46 % strongly
agreed, 115 respondents equivalent to 48% agreed, 4 respondents equivalent to 2%
disagreed and 10 respondents equivalent to 4% strongly disagreed that annual
107

announcements for performers increase teachers work performance. Respondents’
response is shown in Figure 4.24. This was extracted from Table 4.1
Figure 4.24: Respondents’ Opinion on Annual Announcements for Good
Performers
The pie chart above shows that 94% of the respondents agreed to the question.
Therefore, this implies that annual announcements for good performers improve
teachers work performance.
4.5.2.7 Assistance for Water Rent Paid
Other question required respondents to reply as to whether water rent was paid
around teacher’s house. Among 239 respondents questioned whereby, 101
respondents equivalent to 42% strongly agreed, 88 respondents equivalent to 37%
agreed, 42 respondents equivalent to 18% disagreed and 8 respondents equivalent to
108

3% strongly disagreed that water should be paid around teacher’s house.
Respondents’ response is shown in Figure 4.25. This was extracted from Table 4.2
Figure 4.25: Respondents’ Opinion on Assistance for Water Rent Paid
4.5.2.8 Assistance for Electricity Rent Paid
Another variable in this objective required to measure whether assistance to
electricity rent payments will increase teachers work performance. Among 239
respondents were asked whereas, 110 respondents equivalent to 46% strongly
agreed, 96 respondents equivalent to 40% agreed, 24 respondents equivalent to 10%
disagreed and 9 respondents equivalent to 4% strongly disagreed that electricity rent
payment may increase teachers work performance. Respondents’ response is shown
in Figure 4.26. This was extracted from Table 4.2.
109

Figure 4.26: Respondents’ Opinion on Assistance for Electricity Rent Paid
The pie chart above shows that 86% of the respondents agreed to the question.
Therefore, this implies that electricity rent payment can improve teachers work
performance.
4.5.2.9 Provision of Hourly Allowances
The researcher intended to examine whether the provision of hourly allowance may
improves teacher’s work performance. About 239 respondents were questioned for
this purpose whereas 12 respondents equivalent to 5% disagreed and 10 respondents
equivalent to 4% strongly disagreed that provision of hourly allowances influence
teachers work performance. On the other hand, 89 respondents equivalent to 37%
agreed and 128 respondents equivalent to 54% strongly agreed that provision of
hourly allowances influence teachers work performance influence teachers work
110

performance. The summary of the responses is shown Figure 4.27. This was
extracted from Table 4.3
Figure 4.27: Respondents’ Opinion on the Provision of Hourly Allowances
The figure above shows that 91% of the respondents agreed that provision of hourly
allowance influence the teachers work performance. This implies that provision of
hourly allowance make teachers to perform well.
4.5.2.10 Doubling Teachers’ Salary
The researcher intended to know of whether the doubling teachers’ salaries will
increases teachers work performance. Eighty three (83) respondents equivalent to
35% agreed and 121 respondents equivalent to 51% strongly agreed. While 29
respondents equivalent to 12% disagreed, 6 respondents equivalent to 2% strongly
disagreed that doubling teachers’ salary increases teachers’ work performance. The
summary of the responses are shown in Figure 4.28. This was extracted from Table
4.3.
111

Figure 4.28: Respondents’ Opinion on Doubling Teachers’ Salary
The figure above shows that 86% of the respondents agreed that doubling the salary
increase teachers work performance. This implies that doubling the salary make
teacher perform well.
4.5.2.11 Increase Teachers’ Salary by 50%
On the question whether there should be an increase teachers’ salary by 50%. About
239 respondents were questioned for this purpose whereas 154 respondents
equivalent to 64% strongly agreed, 54 respondents equivalent to 23% agreed, 25
respondents equivalent to 10% disagreed and 6 respondents equivalent to 3%
strongly disagreed that increase salary by 50% can influence good performance
among teachers. The respondents’ response is shown in Figure 4.29. This was
extracted from Table 4.3.
112

Figure 4.29: Respondents’ Opinion on Increase Teachers’ Salary by 50%
The pie chart above shows that 87% of the respondents agreed to the question.
Therefore, this implies that teachers’ salary increase of 50% influence teachers work
performance.
4.5.2.12 Provision of Annual Bonuses
Another variable in this objective required to measure whether provision of bonuses
may increases teachers work performance. Among 239 respondents were asked
whereas, 135 respondents equivalent to 56% strongly agreed, 74 respondents
equivalent to 31% agreed, 26 respondents equivalent to 11% disagreed and 4
respondents equivalent to 2% strongly disagreed that provision of bonuses may
increases teachers work performance. Respondents’ response is shown in Figure
4.34. This was extracted from Table 4.7.
113
Figure 4.30: Respondents’ Opinion on Provision of Annual Bonuses
The pie chart above shows that 87% of the respondents agreed to the question.
Therefore, this implies that provision of annual bonuses may improve teachers work
performance.
114

CHAPTER FIVE
DISCUSSION OF THE FINDINGS
5.1 Introduction of the Chapter
This chapter presents the discussion of the collected and analysed data. Also, this
chapter presents the researcher’s standpoint based on what it has been revealed. For
clarity reasons, it is discussed basing on specific objectives of the study.
5.2 Findings from Specific Objectives
5.2.1 Teachers’ Recognition and Teachers’ Work Performance
Based on the fact that 94% of the respondents agreed that teachers’ recognition
influence work performance and that only 6% of the respondents disagreed that
teachers’ recognition influence work performance, it implies that it is important to
recognize teachers because it makes them to be committed to their work. These
results support Michael (2010) who conducted a study and revealed that job security,
interesting work, working condition, good salaries, rewards and promotion are the
among satisfying reasons that could result to performance.
Almost all respondents agreed that teacher’s recognition influence good performance
of teachers. Teacher’s recognition is regarded as the most important motivation
factors. Respondents claimed that bonuses are to be given to teachers who perform
better in their duties. About 60% of the educational stake holders interviewed argued
that bonuses are better to be given at the mid of month and 40% proposed that at the
end of academic year. Further, they are added that provision of certificates of
appreciation, part time, trip and tours, reward for higher performer and annual
announcements for good performers can be used to influence a teacher to perform
115
better. If higher performers are rewarded, lower performer will be influenced to work
hard so as they can be rewarded as well. In addition, rewards should be reviewed for
better performance and reduction of turnover.
Usually rewards are given to teachers whose students performed better in their
national examination whereas the performance was used as a benchmark for one to
be rewarded. For example, teachers from reward system argued that rewards are
given in terms of funds whereby each subject grade was charged. Therefore,
teachers’ interest in this case is to struggle for their students to pass their subjects so
as to earn more money. On the basis of these findings teachers are intrinsically
motivated and they can struggle to teach so as to achieve their goal. When
recognised the Maslow (1954) motivation theory has then been worked on as the
employees when gain the self-actualization towards their living standards.
To sum up, the findings collected though questionnaires and interviews for this
objective revealed that teachers recognition improve teachers working performance.
Thus, it is better for teachers to be recognized so as they can work harder to achieve
their goal.
5.2.2 Provision of Accommodation and Teachers’ Work Performance
Based on the findings that 80% of the respondents agreed that good provision of
accommodation facilities improve teachers’ performance and that 20% of the
respondents disagreed that provision of accommodation improves teachers’ work
performance. This implies if teachers are well accommodated by the government,
they will perform extremely well. The results of this study do support (Mwanvi,
116

1995) who identifies that employees were forced to rent houses of three rooms, one
for the parents, the second one for boys and third one for girls, while the cost for one
room estimated to range between 2000/= - 2500/=per month. Almost all respondents
agreed that good provision of accommodation facilities such as security, reasonable
distance from teacher’s residence to school, presence of standard toilets influence
good performance of teachers. This is because once teachers are given good
accommodation facilities; they will be in a good position to work in a comfortable
environment hence improved working performance.
Further, they argued that electricity and water bills once paid to teacher’s house can
make teachers to work well. However, teachers’ houses are a big problem in the city
and it is one of the sources of low in effective performances in cities. For example,
teachers use a lot of amount of their salaries in renting house, while the renting cost
keeps going up and not matching with the amount of the salaries’ that is raised by
the government. But some respondents argued that if teachers are provided with
good accommodation facilities, they will perform higher in terms of adequate
preparation of teaching lesson, notes, scheme of works, teaching aids and they will
be evaluating pupils regularly. Thus, provision of sufficient of accommodation
facilities is highly recommended by many teachers because they will be motivated to
perform well. Provision of houses and transport assistance will function as inputs to
create work ability and confidence among teachers.
To sum up, the findings collected though questionnaires and interviews for this
objective revealed that provision of good accommodation facilities to teachers make
teachers perform well. Thus, it is better for teachers to be given good houses,
117

electricity and water bills to be paid, standard toilets, standard kitchen and security at
residents. Furthermore the safety need which has then secured the workers feeling
good and out of danger giving the application to the Maslow (1954) motivation
theory at the second level of the hierarchy of human needs.
5.2.3 Salary Levels and Allowances and Teachers’ Work Performance
Based on the fact that 90% of the respondents agreed that salaries and allowances
improve teachers work performance, while 10% of the respondents disagreed that
salaries and allowances improve teachers work performance. This implies that little
salaries and absence of allowances cannot improve teachers’ work performance.
These findings are consistence with the findings of Inayatullah (2009) who did a
study to examine the effects of motivation on job performance in public and private
schools of Peshawar city in the Province of Khyberpakhtunkhwa in Pakistan. The
findings of the study revealed that there is a significant and positive relationship
between teacher’s motivation and their job performance. There have been studies on
the influence of motivation on performance among teachers and such motivations
include increased salaries and allowances, transport cost, and other fringe benefits.
Almost all respondents agreed that increases in salaries and allowances improve
teachers working performance. Through the provision of hourly allowances,
doubling teacher’s salary, annual increase of salary and wages and reasonable time
for salary payment can improve the performance of teachers. However, teachers
receive wages and salary that are considerably below of necessary to ensure their
adequate motivation hence poor performance. Further, they argued that increase in
salaries and allowance will change performance on work. This is because if salaries
118

and wages are not paid on time and insufficient to teachers, they will make teacher to
underperform. However, they claimed that now days the government pay teacher’s
salary on time hence there some improvements in teacher’s working performance.
But some respondents argued that those teachers working in difficult environment
should be given extra allowance so as they can be motivated to perform well. This
will make many teachers to sustain these harsh environments. It will attract other
teachers to teach in these unfriendly environments. Respondents claimed that
bonuses are to be introduced to teachers and hence to be given at the end of each
academic year. The Herzberg’s motivation theory to two factors motivator- hygiene
can work to the facts that salary issues may act as hygiene factors but the
achievement due to such issues can automatically be motivation factors. To sum up,
the findings collected though questionnaires and interviews for this objective
revealed that increases in salaries and allowances improve performance. Thus, it is
better for teachers to be paid on time so as to improve their working performance.
5.3 Incentives and Rewards as Determinants of Work Performance
Incentives and rewards can be an effective way to encourage positive behaviour;
however, it is important that workers are not given food for rewards, because this
can interfere with natural hunger cues. The power of a simple word “You did a great
job” can be a very effective form of recognition.
5.3.1 Incentives for Improvement of Work Performance
Incentives in the workplace have benefits for both employees and employers.
When recognized for stellar performance and productivity, employees have
119
increased morale, job satisfaction and involvement in organizational functions. As a
result, employers experience greater efficiency and an increase in sales and
productivity. Through workplace incentives, employers and workers enjoy a positive
and productive work environment.
Monetary incentives include employee stock options, profit sharing plans, paid time
off, bonuses and cash awards. Additional monetary incentives include annual or
semi-annual bonuses, such as mid-year and end-of-year rewards. These incentives
encourage friendly competition between associates when linked to job performance.
Monetary incentives motivate employees to produce optimally.
Non-monetary incentives employee performance is through perks and opportunities.
These rewards include flexible work hours, training opportunities and the ability to
work independently. The rewards and incentives are valuable to an employee
because they allow workers to learn new skills and pursue advancement
opportunities. For example, a recent graduate may view an exemplary training
program within an organization as more valuable than a higher base salary because
he feels the learning opportunity will benefit his career.
Employees who receive recognition for their work accomplishments tend to have
increased morale and positive workplace attitudes. Employee recognition is an
incentive employers utilize to offer feedback and encouragement to employees.
Employee recognition includes verbal praise, award ceremonies and public
announcements for a job well done. Workplace recognition occur frequently such as
at the end of the day, week or at the conclusion of the sales month.
120
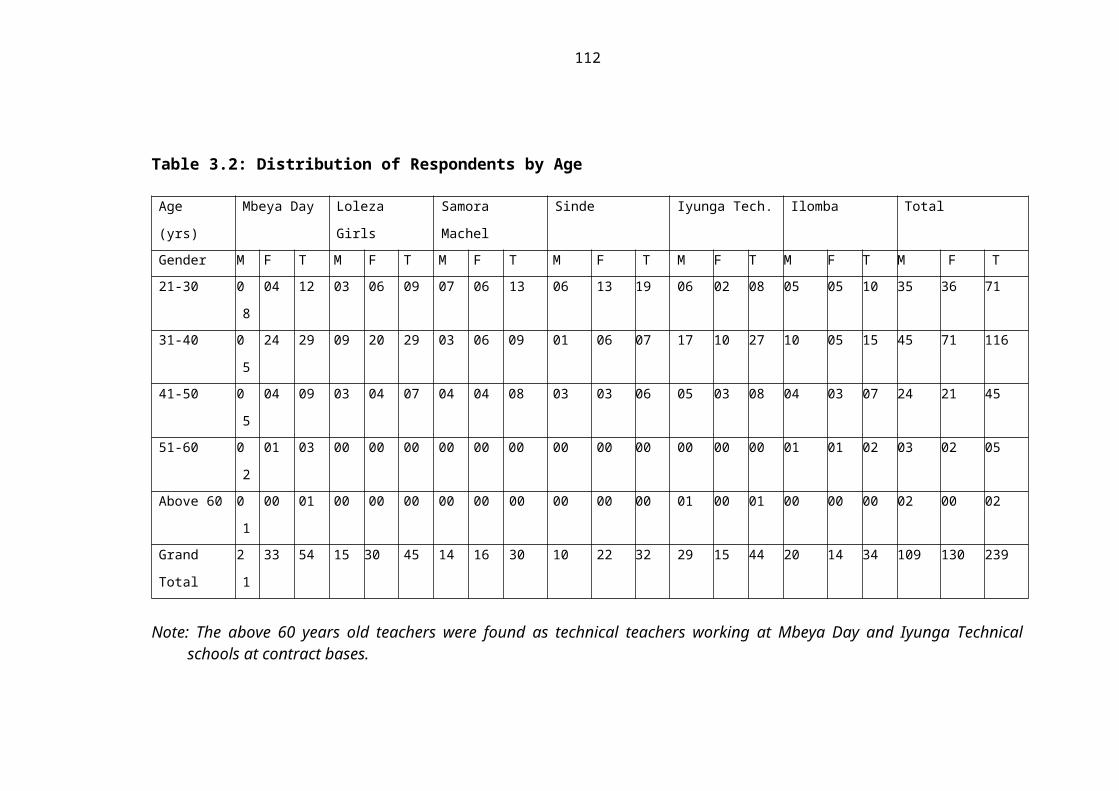
Many employers offer incentives through employee assistance programs. These
programs help workers maintain a balance between work and home life by
supporting workers' mental and physical well-being. For example, many programs
provide counselling services to help cope with stress, family issues and substance
abuse. Employee assistance programs also offer discounts to join fitness centres to
encourage an active and healthy lifestyle. Some programs help working parents find
day care and other activities for their children. The purpose of these programs is to
support workers with their home responsibilities so they can remain focused on their
jobs while they are at work. Employer (government) must provide reliable services
to employees (teachers) essential for work performance. The services include the
reliable monthly salaries paid in time, transport service, regular increase of salaries
and annual bonuses. All those will increase morale, job satisfaction and involvement
in workplace functions.
5.3.2 Rewards for Improvement of Work Performance
One effective way of motivating workers is to provide rewards for excellent
performance and recognition for a job well done. We sometimes forget these tools
because we feel that people are paid to do a good job already. In the rush to move on
to the next job that needs to be done, we also forget to say thank you. People do
respond well to when rewarded for good performance and to recognition for doing
especially good work. Employers shouldn’t forget this if they want great
performance.
Sometimes workers are told in advance what kind of rewards they will get if they
reach a certain goal either individually or on a team basis. Some employers and
121

employees are uncomfortable with this approach, so you have to use your judgment
about whether it will work in your company. Rewards come after results and work
especially well if you are trying to promote specific targets. In this case the reward is
more likely to come after the fact. This is a sign that you appreciate the effort made.
Employer should make use of rewards for the target reached, thus encouragement of
the employees.
Rewards don’t have to be expensive -- no trips to Hawaii are necessary unless the
company can afford it and the performance was really, really outstanding!!! What is
important is that when you have special promotions or a busy time is coming up, you
get in the habit of planning rewards and doing something about it when you notice
people doing things right. Thus incentives function well than rewards. That is
rewards may be omitted then less the work performance. In workplaces incentives
are better than rewards.
A motivated workforce can be a significant factor in organizational success. When
employees are motivated to work at higher levels, productivity of the organization as
a whole runs more efficiently and is more effective at reaching its goal. This is in
contrast to an unmotivated workforce, who can negatively disrupt an organization
and distract employees from work. For this reason, it is imperative that managers
understand the power of reward systems and how they are used to influence
employee behaviour.
Rewards are positive outcomes that are earned as a result of an employee’s
performance. There rewards are aligned with organizational goals. When an
122
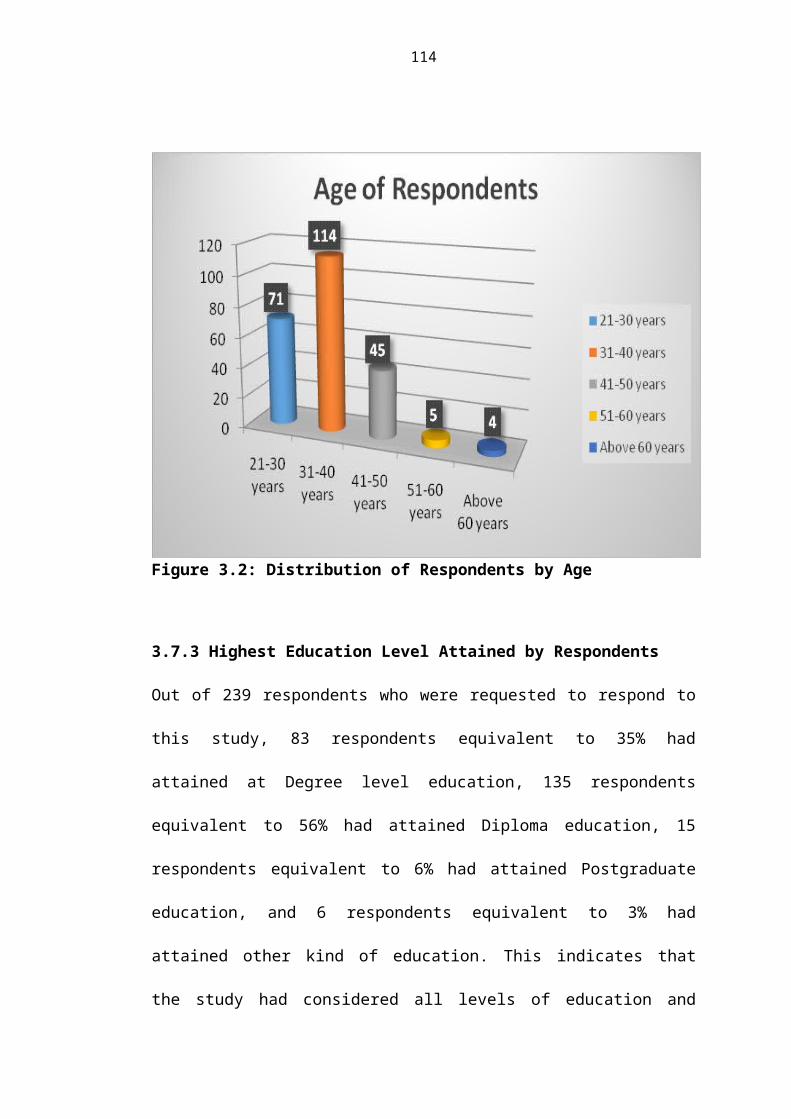
employee helps an organization in the achievement of one of its goals, a reward
often follows. Rewards are often used as reinforcement tool, but when such
reinforcement is stopped, it may lead to retardation of work performance.
123

CHAPTER SIX
SUMMARY, CONCLUSIONS AND RECOMMENDATIONS
6.1 Introduction of the Chapter
This chapter presents summary, conclusion and recommendations with regards to the
study that aimed at exploring the influence of incentives and rewards on teachers’
work performance in Mbeya Region, Tanzania. This chapter is divided into three
parts which include: summary, conclusion, and recommendations of the research
study.
6.2 Summary of the Study
This study basically focused on exploring the influence of incentives and rewards on
teachers work performance in Mbeya Region, Tanzania. Mbeya Region has by when
133 secondary schools, to which 4 are government schools and 129 community
schools. A sample of 6 schools was taken among them, 3 being government owned
and 3 community owned schools. It employed literature sources, interviews and
questionnaires.
The study found out that it is important for the government of Tanzania to recognize
teachers in terms of providing certificates of appreciation, provision of part time
payments, provision of trips and tours for high performers, rewarding high
performers, children education support and annual announcements for good
performers. This will lead to good performance among teachers. Also the study
revealed that provision of accommodation to teachers improves the performance of
teachers in their working place. Also, the study uncovered that regular increase of
124

salaries and allowances make teachers to over perform. For instance, once teachers
are well paid without any delay, they will report early in their schools, they will
prepare adequate teaching lesson plans and notes and they will assess and evaluate
pupil’s performance.
It is learnt that if bosses want to motivate workers, conventional wisdom dictates a
simple solution, offering a clear path to a raise, promotion or other reward. But
psychologists argue that such tactics can actually hurt performance. The most
valuable employees are those who work because they want to do well, not to check
boxes. Great teachers don’t just “teach to the test”, great doctors don’t just order
profitable procedures. It’s on managers, then, to foster that impulse keeping job
descriptions general, for example, so workers think holistically about their goals. Of
course, good work should be rewarded, financially or otherwise. But, there is no
substitute for the integrity that inspires people to go beyond on their own. It makes
sense as a manager to set up an employee recognition program that uses both
incentives and rewards. This way you can target all employees, from one who
experience challenges to the top producers. Communicate your incentives program
to all employees to encourage them to stand making improvements. Reward
employees publicly as another way to motivate other workers to best performance
level.
6.3 Conclusions of the Study
First, based on what that has been discussed in the previous chapter, this study found
out that 94% of the respondents agreed that teachers’ recognition influence work
performance, it implies that recognizing teachers namely provision of certificate of
125

appreciation, provision of part time payments, awarding routine duties teachers for
good performers, rewards for high performers, provision of trips and tours for high
performers, medical assistance to family members, loans for purchase of vehicles,
provision of burial support, children education support and annual announcements
for good performers brings positive performance in their working places. Therefore,
it is suggested that there is need for the government of Tanzania to recognize
teachers so as to stimulate positive work performance. This may result to good
performance among students. Thus treat teaching profession as other professional
post in the government.
Second, based on what it has been found by this study, that many respondents
equivalent to 80% agreed that good provision of accommodation facilities improve
teachers’ performance, this implies that if teachers are well accommodated by the
government, it will be easier for them to assist students because all the time they are
near them or to make less distance from school to resident houses, the teachers
transport should be made available to ferry them to and from schools. Thus, it is
important for the government of Tanzania to build teacher’s houses and put all
necessary requirements for teachers to live comfortable around school premises. The
accommodation facilities should involve the houses given according to the family
size, reasonable distance from the school place, negotiable house rent, high security
provision, water rent paid, electricity rent paid, standard toilets provided, security
guard unit available, availability of garden and standard kitchen provision.
Lastly but no least, respondents agreed by 90% that salaries and allowances improve
teachers work performance, this implies that little salaries and absence of allowances
126
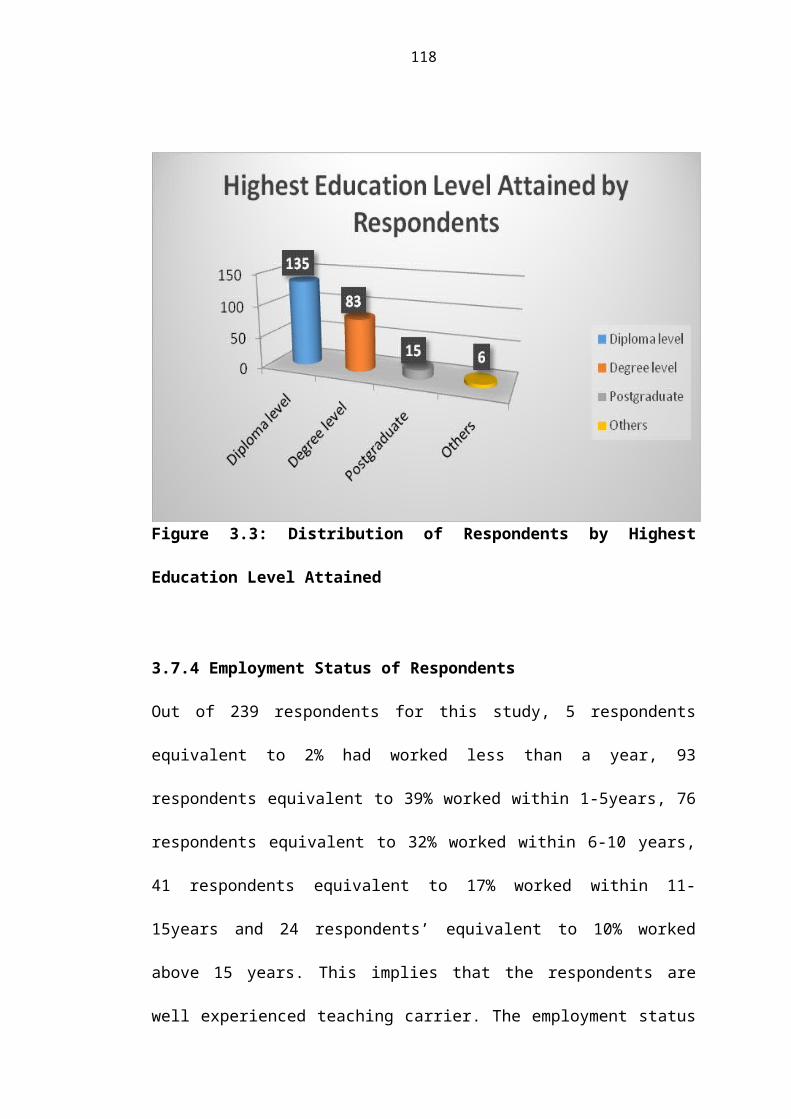
cannot improve teachers’ work performance. It can be suggested that the government
of Tanzania should increase salaries and wages to teachers so as to increase their
working performance. The government have to introduce annual bonuses to teachers
and all necessary allowances for modern worker benefits.
Evidence is accumulating suggesting that teachers respond to incentives for
accepting, reporting, and staying in hard to reach areas. The incentives have to be
reasonable and differentiated by the levels of difficulties associated with working in
those areas. The difficulty is in determining and deciding which areas and thus
schools deserve such incentives. It is becoming clear that it is not just the distance
from areas of civilization and greater opportunities. Above all, you have to factor in
cultural variables like witchcraft, devil worship, and evil minds trained teams of
assessors need to be assembled to identify these iconologies and locations. Some
preliminary criteria should include:-
i. Distance from centres of business for purchase of essentials goods.
ii. Availability of essential services water, electricity, transport.
iii. Risks of wars, tribal strive, boarder thefts, communal outbursts.
iv. Unfriendly cultures such as the beating and raping of teachers and pupils.
One shot incentives do not work as effectively as those scheduled over time. For
instance giving teachers a lump sum of sh. 500,000 as currently conceived at
reporting time, is not likely to be very effective. Using Skinnerian principles, the
schedule should be variable but certain and predictable and could include:
i. One lump sum at predictable intervals such as at the end of each year.
ii. A percentage of monthly each month;
127

iii. End of the year bonus as a percentage of the annual salary
iv. Hand shake package after 5, 10, 15, 20 – 25 years, especially if there is
rotation among teachers.
6.4 Recommendations for Actions and Further Research
The researcher has proposed the following recommendations to be taken by
government and other stakeholders so as to curb the problem of importation of
substandard products:
i. The government of Tanzania should introduce the system of recognizing
teachers who are good performers. Teacher’s recognition includes provision
of certificates of appreciation, rewards for higher performers, part time
payments, children education support and annual announcement for good
performance. When good performers are recognized they will continue
working hard so as to maintain their status. This will bring excellent
performance among students.
ii. The researcher recommends on maintenance of regular salary payment in
time making teachers motivated to their work by the system itself rather than
the outsider motives. This is because inadequate payment causes some
dissatisfaction among the obeying the Hertzberg Two-Factors Theory Thus,
it is important for the government of Tanzania to promote teachers job
satisfaction hence avoid dissatisfaction.
iii. It is recommended by the researcher for the government of Tanzania to build
quality houses around school premises. This will facilitate teachers to teach
smoothly without any challenges of transport and it will be easier for them to
128
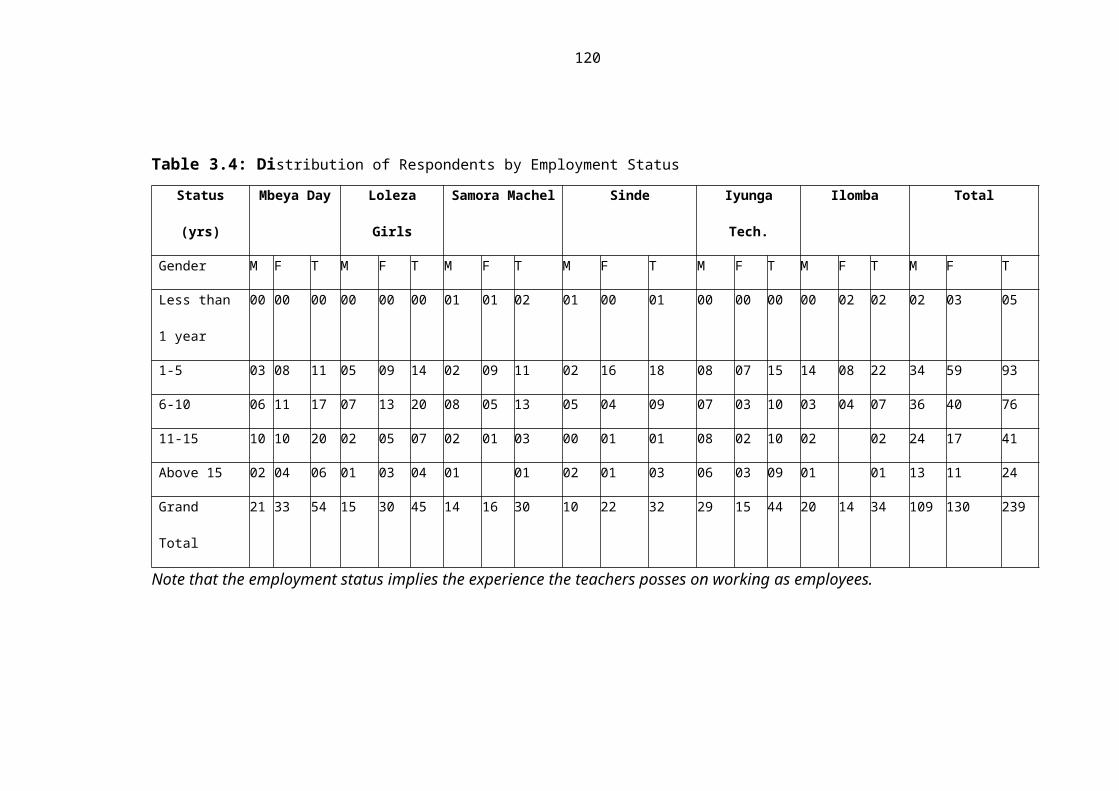
assist students because all the time they are near them. This will make
students to perform better disciplinary, culturally and academically.
iv. The recommendation to the educational officers and administrative organs is
that, they should ensure that teachers are aware of their rights, but also are
met without waiting for teachers’ unnecessary reactions. For example,
teachers should get their rights as stipulated in the standing order including
promotion on time and opportunities to attend teachers’ professional training
programmes.
v. Since some schools are located in remote areas within Mbeya City it is
recommended that the government should offer incentives in form of
hardship allowance to teachers in such areas to motivate them.
vi. The study covered only a small geographical area, Mbeya City, it is therefore
impossible to generalize the findings country wide. There is consequently a
need for further studies covering wide geographical area for comparative
purposes. There is need to conduct quantitative research in similar areas in
order to test incentives and rewards variables against work performance.
Such a study can provide us with more opportunity to prove various
hypotheses with statistical significance.
129

REFERENCES
Adam, E. and Naphacha, M. (2007).Teachers’ salaries in public education between
myth and fact. International Journal of Education Management. 21(4): 67-
76.
Adams, J. S. (1963). 'Toward an understanding of inequity.' Journal of Abnormal
Behaviour. 2(1) 34-36.
Aldefer, C. P. (1972). Existence, Relatedness and Growth. New York: Free Press.
Armstrong, M. (1996). ‘How Group Effort Can Pay Dividends’, People
Management. [http://www.ukessays.co.uk/essays/business/people-
management-essay-php#] site visited on 08/09/2015
Armstrong, M. (2003). A Handbook of Human Resource Management Practice,
London: Kogan Page.
Arnold, B. (1967). Comment: Green for go, Education and Training. New York,
Emerald Group. Vol. 9 (8): 54-67.
Bangi, Y. I. (2008) The Influence of New-Salary Factors on Teachers Mobility in
Private Secondary Schools in Tanzania: The case of Dar es Salaam City.
University of Dar-es- Salaam, Dar-es Salaam: Tanzania.
Beckeri, T. E., Randal, D. M. and Riegel, C. D (1995). The Multi dimentional View
of Commitment and Theory of Reason Action: A Comparative Evaluation.
Journal of Management 21(4), 617-638
Bernard, H. R. (1995). Research Methods in Anthropology. Quantitative and
Qualitative Approaches, London: Atlamira Press.
Best, J. W. and Kahn, J.V. (1993). Research in Education. New Delhi: Prentice Hall
of India.
130

Bratton, J. and Gold, J. (1999) Human Resource Management: Theory and Practice,
New York: Palgrave.
Brooks, I. (2003) Organisational Behaviour: Individuals, Groups and Organisation
2nd Edition, London: Prentice Hall, Pearson Education Limited.
Bruner, J. S. (1976).From communication to language: A psychological perspective
cognition, New York:Plenum Press. 3(1) 255-287.
Bryman, A. (2008) “The End of the Paradigm Wars”: In Alasuutari, P., Bickman, L.
and Brannen, J. (Eds.) Social Research Methods. London: Sage Publications.
Bryman, A. (2012). Social Research Methods. New York: Oxford University Press.
Cangemi, J. (2009). Analysis of an Adversarial labour management situation in a
Latin American Industrial Setting: A case study using Maslow’s hierarchy of
needs. Organization Development Journal, 27(1): 37-47.
Carrel, M. R. and Dittrich, J. E. (1978). Equity Theory: The journal Recent
Literature, Methodological Considerations and New Directions. 3(2): 202-
210.
Chilumba, J. J. (1994). Factors Affecting Occupational Status of Teachers in
Tanzania Mainland: Southern an Opinion Survey of Tutors in Colleges of
Education in the zone, University of Dar es Salaam, Dar es Salaam: Tanzania
Creswell, J. W. (2009) Research Design: Qualitative, Quantitative and Mixed
Methods Approaches. London: Sage Publications, Inc.
Creswell, J. W. (1994). Research Design. Qualitative and Quantitative Approaches.
Thousand Oaks, California: Sage.
Daft, R.L. (2003). Management Learning. London: Thomson Press.
131

Darling-Hammond, L. (1997). Doing What Matters Most: Investing in Quality
Teaching. The National Commission on Teaching and America's Future.
New York: Sage
Darmon, R.Y. (1974). Salesman’s response to financial incentives: an empirical
study. Journal on Market Research, 11(3): 418 – 426.
Dauten, D. (1998). The best way to motivate employees: have them bet on their own
success. New Hampshire Business Revised Journal, 20(13): 8 –9.
Deci, E. L. (1971). Effects of Externally Mediated Rewards on Intrinsic Motivation.
Journal on Personality and Social Psychology, 18: 105-115
Deci, E. L. (1972). Intrinsic Motivation, Extrinsic Reinforcement, and Inequity.
Journal on Personality and Social Psychology, 22: 113-120
Deci, E. L. (1975). Notes on the Theory and Met theory of Intrinsic Motivation.
Organizational Behaviour and Human Performance, 15: 130-145
Deci, E. L. (1978). Applications of Research on the Effects of Rewards. In Lepper,
M. R. and Greene, D. (Eds.) (1978). The Hidden Cost of Rewards: New
Perspectives on the Psychology of Human Motivation. Hillsdale, New
Jersey: Lawrence Erlbaum Associates, Publishers.
Deci, E. L., Koestner. R., Ryan, R.M. (1999). A Meta-Analytic Review of
Experiments: Examining the Effects of Extrinsic Rewards on Intrinsic
Motivation. Psychology Bull Journal., 125: 627-668.
Deci, E. L. and Ryan. R.M. (2000). The “What” and “Why” of Goal Pursuits:
Human Needs and the Self-Determination of Behaviour. Psychology Inquiry
Journal 11: 227-268.
DeStefano, J. (1985).Teachers Training and Deployment in Malawi. International
132
Perspectives on Education and Society. Vol.19. New York: Emerald Group
Publishing Limited.
Dunnett, M. and Fleishman, E.A. (1982) Human Capability Assessment, New York:
Lawrence Erlbaum Publishers.
Esther, D., Hanna, R., Ryan,S.P. (2012). Incentives Work: Getting Teachers to
Come to School. London: Financial Times, Prentice Hall.
Evenson, R. (2003). Motivating to develop an all-star team. American Salesman
Journal, 48 (10): 21- 27.
Gagné, M. and Deci, E.L. (2005). Self-Determination Theory and Work Motivation.
Journal on Behaviour., 26: 331-362.
Gratton, L. (2000) Living Strategy: Putting People at the Heart of Corporate
Purpose, London: Financial Times, Prentice Hall.
Guest, E.A. (1991). Human resource management. London: McGraw-Hill.
Hackman, J. (1976). Motivation through the Design of work: Test of a theory.
Organizational Behaviour and Human performance, 16(2): 250-279.
Hansen, M., Nohria, N., Tierney, T. (2001) ‘What’s Your Strategy for Managing
Knowledge, in Harvard School’, Harvard Business Review on
Organisational Learning, New York: Harvard Business School Press.
Harackiewicz, J. M., Manderlink, G., Sansone, C. (1984). Rewarding Pinball
Wizardry: Effects of Evaluation and Cue Value on Intrinsic Motivation.
Journal of Personality and Social. Psychology. 47: 287-300
Herzberg, F. (1957) The Motivation to Work. New York: John Wiley
Herzberg, F. (1993). The Motivation to Work. New York: Transaction
Publisher.Herzberg, F. (1996).Work and Nature of Man. Cleveland: World
133

Publishing.
Herzberg, F., Mausner, B., Peterson, R.O., Capwell, D.F. (1957). Job Attitudes:
Review of Research and Opinion. New York, Psychological Service of
Pittsburg.
Hofstede, G. (1984). The cultural relativity of the quality of life concept. Academic
Management Review, 9(3): 389-398.
Huczynski, A. A .and Buchanan, D.A. (1991). 'Organizational Behaviour'-An
Introductory text. London: Prentice Hall (UK) Ltd. Pp 436- 466.
Hunt, J. (1992) Managing People at Work: a Manager Guide to Behaviour in
Organisations, London: McGraw-Hill Publishing Company.
Inayatullah, A. and PalwashJehangir (2009). Teachers Job Performance: The Role of
Motivation, Journal of Social Sciences, Vol. 5, No. 2.
Jobber, D. and Lee, R. (1994). A comparison of the perceptions of sales management
and sales people towards sales force motivation and demotivation. Journal on
Market., 10(4): 325 – 332.
Jeffrey, S.A. (2009). Justifiability and the motivational power of tangible non-money
incentives. Human Performance Journal, 22(1)143-155
Kabuje, R. (2010). Training and Development programs and its impact on
employee’s performance in the Tanzania work Organization. A lesson from
Parastatals Pension Fund (PPF), University of Dar es Salaam, Dar es Salaam.
Kane, E. and Reilly, B. (2001).Doing our own Research. London: Marion Boyars
Publisher.
Katunzi, B. N. (1981). The 1978 Inspectorate Reform in Tanzania and its Influence
on the Teachers Attitudes: A Case of Selected Secondary Schools in the
134

Eastern Dar es Salaam. University of Dar es Salaam. Dar-es-Salaam:
Tanzania.
Keller, J. M. (1987b). Strategies for stimulating the motivation to learn.
Performance and Instruction. New York: Lawrence Erlbaum Associates
26(8): 1-7.
Keller, J. M. (1979). Motivation and instructional design: A theoretical perspective,
Thousand Oaks, London: Sage. Affective commitment with perceived
organizational support. Journal on Applied Psychology. 78: 774-780.
Keller, J. M. (1983 a). Motivational design of instruction. In C.M. Reigeluth (Ed.),
Instructional design theories and models. New York: Lawrence Erlbaum
Associates: Pp 383-433.
Keller, J. M. (1984) The Use of the ARCS Model of Motivation in Teachers Training.
In K. Shaw & A.J. Trott(Eds). Aspects of Educational Technology: Staff
Development and Career Updating, Volume xviii. London: Kogan Page.
Keller, J. M. (1987a). Development and use of the ARCS model of instructional
design. Journal on Instruction Development 10(3): 2-10.
Keller, J. M. (1999). Motivatinal Systems. In H.D. Stolovitch & E. J. Keeps (Eds).
Handbook of Human Performance Technology, San Franscisco: Jossey-Bass.
Pp 373-374.
Kenrich, D. T. (2010). Renovating the pyramid of needs contemporary extensions
built upon Ancient foundation. Perspectives on psychological science, 5(3):
292-314.
King, N. (1970). Clarification and Evaluation of the Two-factor theory of jobs
satisfaction. Psychological Bulletin, 74(1): 18-31.
135
Kohn, A. (1999). Punished by Rewards: The Trouble with Gold Stars, Incentive
Plans, A'S, Praise, and Other Bribes. Boston: Houghton Mifflin Press.
Koltko, R. (2006). Rediscovering the later version of Maslow’s hierarchy of needs.
Self-transcendence and opportunities for theory, Research and unification.
Review of General psychology, 10(4): 302-317.
Kothari, C. R. (1985). Research Methodology: Methods and Techniques. 2th revised
edition. New Delhi: New Age International (P) Limited
Kothari, C. R. (2004). Research Methodology. New Delhi: New Age International
Kruglanski, A.W., Friedman, I., Zeevi, G. (1971). The Effects of Extrinsic
Incentives on Some Qualitative Aspects of Task Performance. Journal on
Personality, 39: 606-617
Lassey, P. (1998) Developing a Learning Organisation, London: Kogan Page
Limited.
Lepper, M. R., Greene,D., Nisbett, R. E. (1973). Undermining Children’s Intrinsic
Interest with Extrinsic Reward: A Test of the “Over justification”
Hypothesis. Journal on Personality and Social Psychology, 28: 129-137.
Lindenberg, S. (2001). Intrinsic Motivation in a New Light. Motivation Journal 54:
317-342.
Lupenza, B. M. (2000). A Critical Appraisal of Salary and Upward Mobility in
Tanzania: The case of National Insurance Corporation (T) Limited.
University of Dar-es-Salaam: Dar es Salaam, Tanzania.
Martin, J. (2005). Organizational Behaviour and Management. London: Thomson
learning. Pp 420-466.
Maslow, A. H. (1943). “A Theory of Human Motivation”. Psychological Review,
136

50(4): 370-396.
Maslow, A. H. (1954). Motivation and Personality. New York: Harper and Row
Maslow, A. H. (1968). Toward a Psychology of Being. New York: D. Van Nostrand
Company.
Mc Adam, J. (1996). The reward plan advantage. A manager’s guide to improve
business performance through people. San Fransisco: Jassey-Bass
Publishers.
Meyer, J.P., Allen NJ (1997). Commitment in the workplace: Theory, research, and
Mowday, R.T., Porter, L.W., and Steer, R.M. (1982). Employees’
organization linkages. New York: Idris and Wan Publishers
Michael, S. J. (2010). Motivation of Teachers and Students Failure in Examination
in Tanzania: The Case Study of Primary and Secondary Teachers in Dar es
Salaam City, MBA Dissertation, University of Dar es Salaam. Dar-es-
Salaam, Tanzania.
Mlynsi, J. P. (1991). Social Security in Tanzania: An Analysis of the Conditions
Influencing the Plight of Retired Teachers in Dar es Salaam, University of
Dar es Salaam, Dar es salaam, Tanzania.
Mooday, R.T., Porter, L.W, & Steer, R.M. (1982) Employment Organisation
Linkage. New York: Academic Press
Moshi, E. E. (1977). The Preparation of Creation of Self-Reliant Teachers: A
Conceptual Model for Tanzania. University of Dar es Salaam. Dar es Salaam,
Tanzania.
137
Mullins, L. (2005) Management and Organisational Behaviour. London: Pearson
Education Limited.
Muze, S. M. (1987). Shortage and Job Satisfaction among Teachers in Public
Schools in Tanzania Mainland. University of Dar es Salaam. Dar es
Salaam,Tanzania.
Mwakilembe, A. S. (1981). Lack of Motivation as the Factor Leading to Teachers
Exodus: An Opinion Survey of Secondary School Teacher in Tanzania.
University of Dar-es-Salaam: Dar-es-Salaam, Tanzania.
Mwanvi, A. D. J (1995). The Impact of Workers Motivation on Performance: A
comparative Study on Public and Private Enterprises in Tanzania 1987-1993.
University of Dar-es-Salaam: Dar-es-Salaam, Tanzania.
Nelson, B. (2003). Money is not the root of all motivation. Health Care Registration,
12(10): 7 – 9.
Ngailo, B. (2010). Assessment of effectiveness of criteria used by Employers to
promote their Employees in Relation to effective Performance in Work
organization: a Case of National Microfinance Bank Njombe Branch in
Iringa. MBA Dissertation, University of Dar-es-Salaam. Dar-es-Salaam,
Tanzania.
Northhcraft, T. & Neale, H. (1996) Organisation Behaviour. London: Prentice Hall
Nyakundu, K. J. (2012). Factors Affecting Teachers Motivation in Public Schools in
Thika West District Kiambu. University of Kenyatta. Nairobi, Kenya.
Nyondo, A. M. (1994). The Role and Performance of Teachers Service Commission
in Development of Teachers Morale: A case study of Lindi Region,
University of Dar es Salaam. Dar es Salaam.-, Tanzania.
138

Olouch, E. (2006). Policy Choices in Secondary Education in Africa: Challenges
seen from different Perspectives in an African country, a case study of
Tanzania Mainland as seen by Tanzania Teacher’s Union (TTU). Oslo,
Norway.
Omari, I. M. (2011). Educational Psychology for Teachers. Dar es Salaam: Oxford
University Press, Pp 14-22
Omari, I. M. (2011) Concepts and Methods in Educational Research. Oxford
University Press (T) Ltd. Dar es Salaam.
Omari, I.M (2011). Motivation, Instruction, Learning and Human Performance.
Oxford University Press(T) Ltd. Dar es Salaam.
Omari, I. M. (2013).The Education Sector Human Resources Production and
Management Crisis in Tanzania. Dar es Salaam: Delah Investment Limited.
Osterloh, M.and Frey, B. (2000). Motivation, Knowledge Transfer, and
Organizational Form, Organization Science Journal. 11: 538-550.
Parker, M. (2000) Organisational Culture and Identity, London: Sage Publications
Ltd.
Rudolph, P. A. and Kleimer, B. H. (1989). The art of motivating employees. Journal
of Managerial Psychology, 4 (5): 1 – 4.
Rummel, A. and Feinberg, R. (1988). Cognitive Evaluation Theory: A meta-
Analytic Review of the Literature. Social, Behaviour and Personality
Journal, 16: 147- 164
Runyoro, K. E. J. (2002). A study of Workers Motivation in Project Management in
Relation to Impacts on Innovation, Productivity and Economic Performance:
A case Study of Engineering Project. University of Dar-es-Salaam. Dar es
139
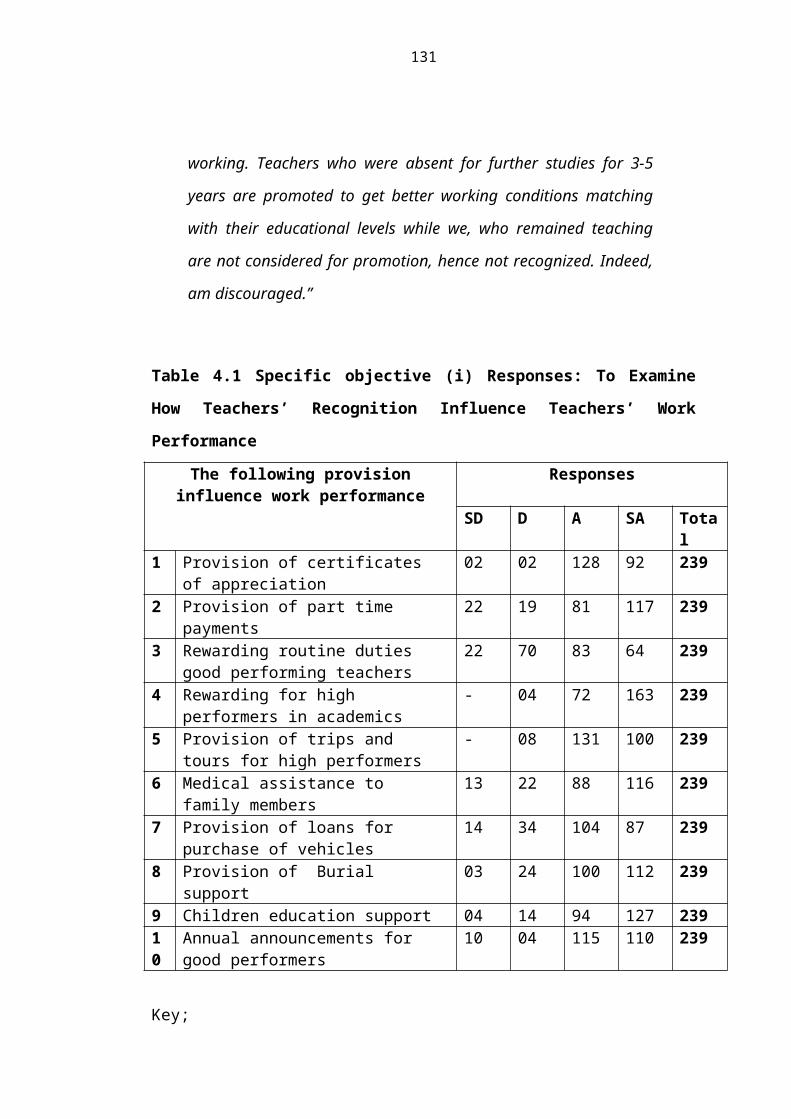
Salaam, Tanzania.
Rwegashola M. M. H. (2006). A Guide to Social Science Research. Dar es Salaam.
Mkuki na Nyoka Publishers.
[http://www.2007. runescope.wikia.com/wiki/category.shield] visited on 02/08/2015
[http:// www.books.google.co.tz/books=mushi1997& sources] visited on 27/01/2016
Salancik, G. R. (1977) Commitment and the Control on Organisational Behaviour
and Belief. In B. Staw and G. salancik (ed) New Direction in Organisational
Behaviour. Chicago : St clair Press Pp 1-59
Shore, L,M, and Wagner, S.J. (1993). Commitment and employees behaviour.
Comparison of Staw and G. Salancik (Ed), new direction in organizational
behaviour. Chicago: St Clair Press, Pp. 1-59.
Sima, J.(2010). Effect of Motivation Practices on Employee Attitude: Case Study of
Kibaha Town Council, MBA Dissertation, University of Dar es Salaam. Dar-
es Salaam, Tanzania.
Skinner, B. F.(1938). The Behaviour of Organisms. New York: Appleton-Century
Crofts.
Slavin, R. E. (2006). Education Psychology. The Theory and Practice. 8th edition.
Boston; Pearson-Allyn and Bacon.
Soulders, J & Jobber, D. (1994). Product Replacement: Strategies for Simulteneous
Product Detection and Launch. Journal of Product Innovation Managemnt.
22: 43-57. Emerald Group.
Steffeesen, J. P. (1965). Differentiating Teachers’ Salaries, Journal of Education
Management, 21(4): 89-96. Emerald Group
Stevrevska, V. (2002).The Effects of on Job Training Wages in Sweden,
140

International Journal of Manpower. 23(4): 65-79. Emerald Group.
Stufflebeam D, (2003). The CIPP Model of Evaluation in Schools. The Inter
National Handbook of Educational Evaluation (chapter 34) Boston: Kluwer
Press.
Sujan, H. (1986). Smarter versus harder: an exploratory attribution analysis of
salespeople’s motivation. Journal of Marketing Research, Pp. 41 – 49.
Tang, S. and Hall, V. C. (1995). The Over justification Effect: A Meta-Analysis.
Applied Cognitive Psychology, 9, 365-404 Trott, A.J. (Eds.). Aspects of
Educational Technology, Volume XVII. London: Kogan Page, Pp 140 - 145.
The Guardian, (2011). [http://www.theguardian.com/world/series/2011_in_review]
site visited on 06/12/2015
Therkildesen, J. (2007). Staff Management and Organizational Performance in
Tanzania and Uganda Public Servant Perspective. Danish Institute of
International Studies and Dege Consultant.
Thomson, R. (2002). Managing People. 3nd Edition, London: Butterworth-
Heinemann, Oxford Press.
Tyagi, P. K. (1982). Perceived organisational climate and the process of
salesperson motivation. Journal on Market Reserve. 19 (2): 240 – 254.
Wagner, G. (1967). Professor on the Picket line Education and Training. New
York: Emerald Group, 9(8): 23-45.
Wiersma, U. J. (1992). The Effects of Extrinsic Rewards in Intrinsic Motivation: A
Meta Analysis Journal on Occupation and Organizational Psychology. 65:
101-114.
141
Wikstrom, S., and Normann, R. (1994). Knowledge & Value: a new perspective on
corporate transformation, New York: Routledge.
APPENDICES
APPENDIX I: Questionnaires for Teachers
Part A: Introduction
I am a student at the Open University of Tanzania pursuing Masters of Education. I
am carrying-out a research on the influence of incentives and rewards on teachers’
work performance. I am requesting you to provide information of your own view in
order to come-up with a much honest report. The information you give will be
treated with highest degree of confidentiality. Thank you in advance for devoting
your time to do this job.
Part B. Background Information about Teachers
(Please tick the right option or fill the right answer in the spaces provided)
B1.School ……………………………………………………………………………..
……………………………………………………………………………..
B2. What is your age range? (Please tick under only one of them).
Age
21-30 31-40 41-50 51-60 61+
B3. Marital status (Tick)
142

1. Single 2. Married
B4. Gender (Tick)
1. Male 2. Female
B5. Highest education level attained (Please tick under only one of them).
QualificationOrdinary Level
Advanced Level
Diploma Degree PostGraduate
Others (Please specify)
B6. How long have you been employed as a teacher?
1. Less than a year 2. 1- 5 years 3. 6-10 years
4. 11-15years 5. Above 15 years
B7. Type of the school
1. Government 2. Community (ward)
Part C: Specific objective (i) to Examine how Teachers’ Recognition Influence
Teachers Work Performance. (Please, indicate the extent to which you agree or
disagree with the items, by marking against the scales provided)
SCALENo. ITEM I
/R
StronglyDisagree
Disagree Agree Strongly Agree
1 Provision of certificates of appreciation
R
2 Provision of Part time payments
R
3 Rewarding better teachers for good performers
R
4 Rewarding for high performers in academics
R
5 Provision of Trips and tours for high performers
R
6 Medical assistance to family members
I
143
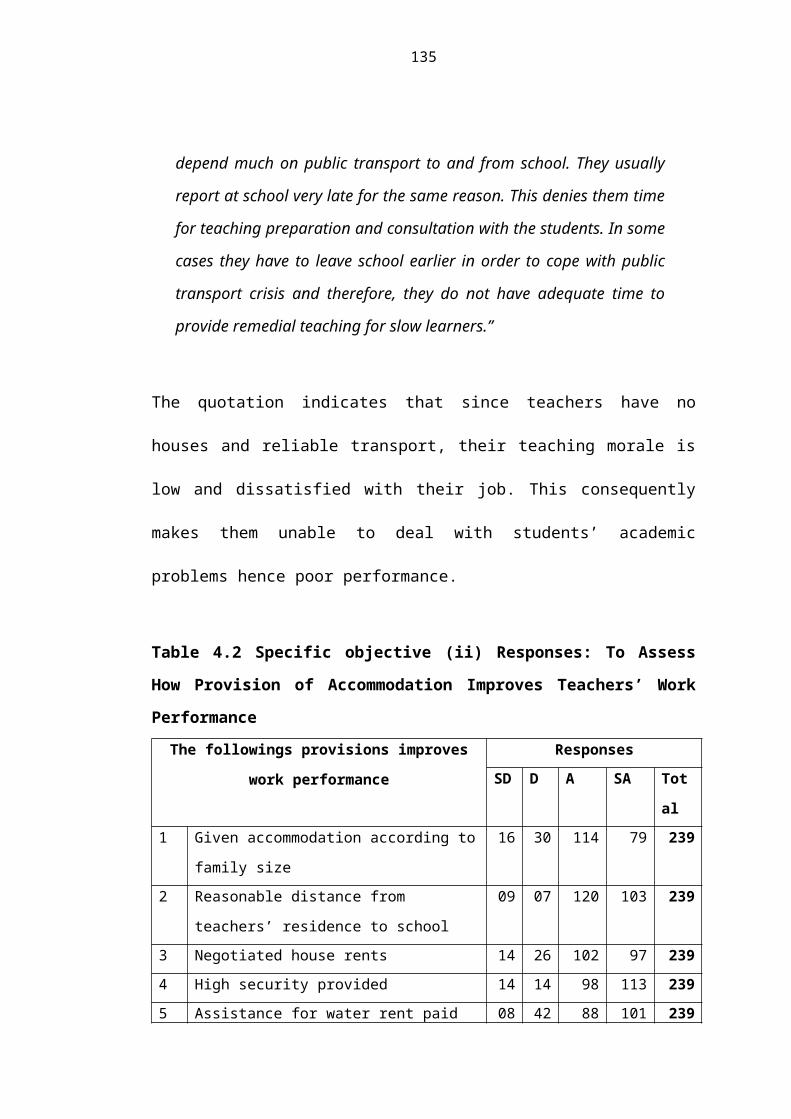
7 Provision of Loans for Purchase of vehicles
I
8 Provision of Burial support I9 Children education support I10 Annual announcements for
good performersR
Key;
I: Incentives
R: Rewards
Part D: Specific objective (ii) to Assess how Provision of Accommodation
Improves Work Performance. (Indicate the extent to which you agree or disagree
with the items, by marking against the scales provided)
SCALE
No.
ITEM I/R
Strongly Disagree
Disagree Agree Strongly Agree
1 Given accommodation according to family size
I
2 Reasonable distance from teacher’s residence to school
I
3 Negotiated house rents I4 Secured housing provided I5 Assistance for water rent
paymentR
6 Assistance for electricity rent payment
R
7 Standard toilet provided I8 Availability of garden at
teachers’ housesI
9 Standard kitchen provided I10 Security guard unit provided I
Key;
I: Incentives
R: Rewards
144
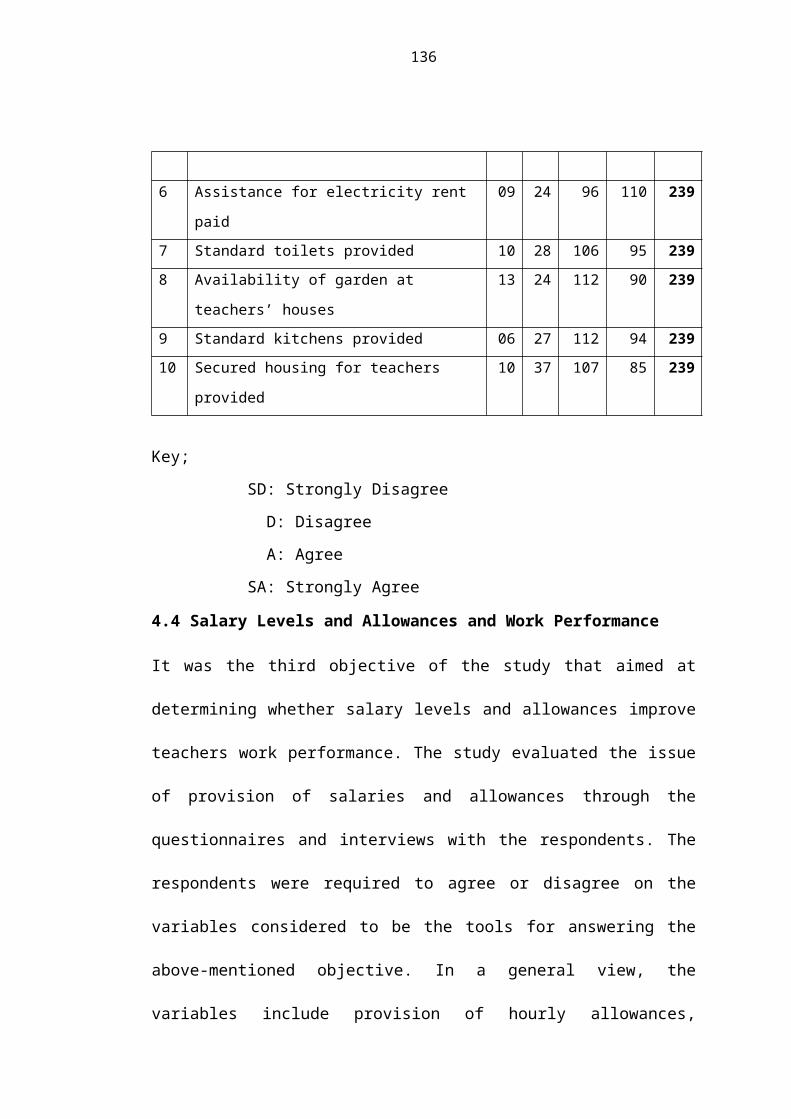
Part E: Specific objective (iii) to Find out if Increases in Salaries and
Allowances Improve Work Performance. (Indicate the extent to which you agree
or disagree with the items, by marking against the scales provided)
SCALE
No. ITEMI/R
Strongly Disagree
Disagree Agree Strongly Agree
1 Provision of hourly allowances R2 Salaries payment in time I3 Doubling teachers’ salary R4 Increase teachers’ salary by
50%R
5 Regular annual increase of salary and wages
I
6 Provision of annual bonuses R7 Doubling transport allowance I8 Provision of transfer transport
allowanceI
9 Provision of hardship settlement allowance
I
10 Provision of education studies allowance
I
Key;
I: Incentives
R: Rewards
Thank you for Your Cooperation!
145

APPENDIX II: Interview for the Heads of Schools and Districts Education
Officers
I am a student at the Open University of Tanzania, pursuing a Master’s Degree in
Education. I am carrying out a research on the influence of incentives and rewards
on the work performance of teachers in Tanzania: a case study of secondary school
teachers in Mbeya Region. I kindly request you to provide me with information. It
will be treated as confidential and used for academic purposes only.
PART A: BACKGROUND INFORMATION ABOUT TEACHERS (tick the
right option or fill the right answer in the spaces provided)
A1.School / DEO district…………………………………………………
A2. What is your age range? (Please tick under only one of them).
Age21-30 31-40 41-50 51-60 61+
A3. Gender (Tick)
1. Male 2. Female
A4. Highest education level attained (Please tick under only one of them).
QualificationOrdinary
levelAdvanced
levelDiploma Degree Post
GraduateOthers (Please specify)
146
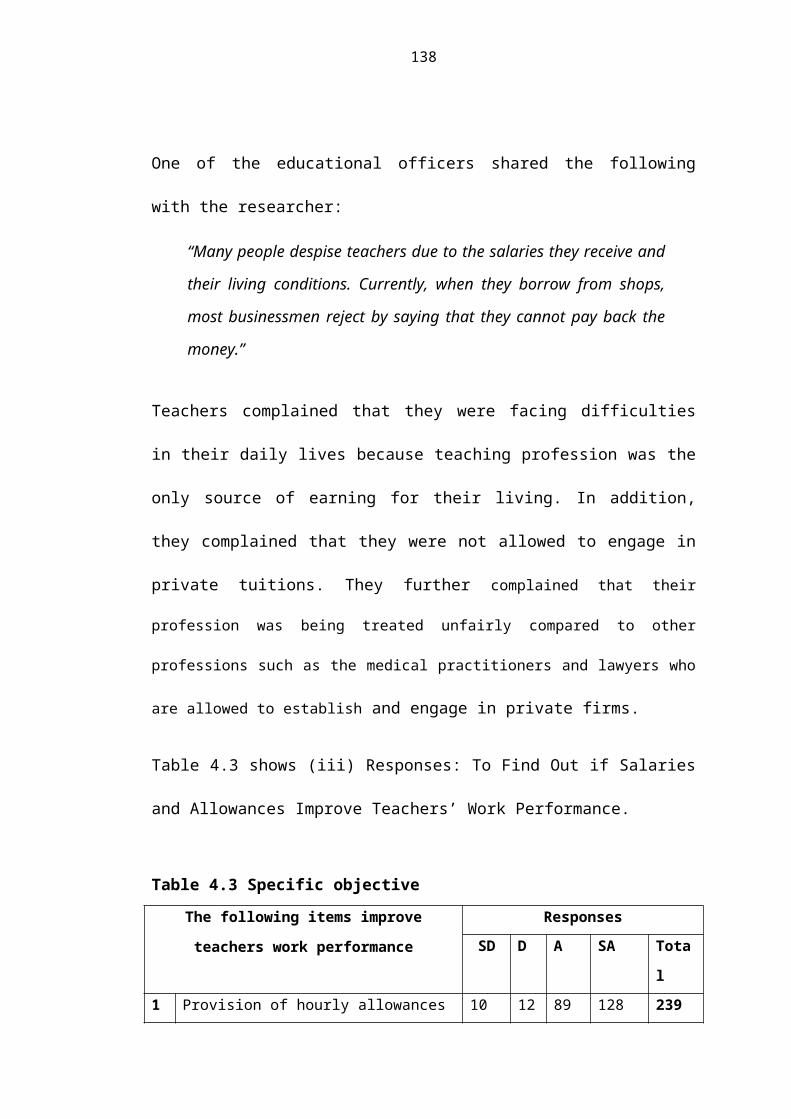
A5. How long have you been the Head of school/DEO?
1. Less than a year 2. 1- 4 years 3. 5-8 years
4. 9-12 years 5. Above 12 years
A6. Type of the school/Type of district
1. Government 2. Community (ward)
A7.Location area of school
1. Urban 2. Semi Urban 3. Rural
147

Part B: Interview Topics for Heads of Schools and Districts Education Officers
B1. Specific objective (i) on Teachers Recognition
(i) Do you think it is necessary to introduce part time payment to
government and community schools? What are your expectations?
________________________________________________________
________________________________________________________
________________________________________________________
_________
(ii) What is the impact to the lower performers if the higher performers
are rewarded? How do you think should be done to low performers?
________________________________________________________
________________________________________________________
________________________________________________________
_________
(iii) Is it necessary to award teachers performing well their routine duties?
How can they be awarded?
________________________________________________________
________________________________________________________
________________________________________________________
_________
148
B2. Specific objective (ii) on Accommodation
(i) Are the teachers ready to share the cost for the type of housing they
need to stay at their own favourite?
________________________________________________________
________________________________________________________
________________________________________________________
_________
(ii) How feasible is it to have teachers’ houses near the school? What is
your experience here? How big is the distance here?
______________________________________________________________
______________________________________________________________
______________________________________________________________
_________
(iii) Do you think if you pay electricity and water bills by 100% will lead
to better work performance?
________________________________________________________
________________________________________________________
________________________________________________________
_________
B3. Objective (iii) on Increase of Salaries and Allowances
(i) How big is the problem of late payments of salaries here and do it
bring the effect? What suggestions do you have to solve this problem
if exist here?
149

________________________________________________________
________________________________________________________
________________________________________________________
_________
(ii) Do you think teachers can change on work performance when salaries
and allowances are increased? Increase the difference by 10%, 20,
30%, 40%, 50% or 100%?
________________________________________________________
________________________________________________________
________________________________________________________
(iii) How do you see if teachers operating in difficult environments given
an extra allowance? How much more than other allowances and how
should it be given?
________________________________________________________
________________________________________________________
________________________________________________________
(iv) If teachers are given bonuses will it influence them to better work
performance? How do you think it has to be given?
________________________________________________________
________________________________________________________
________________________________________________________
________________________________________________________
____________
Thank yu for Your Cooperation
150

Appendix III: Data at the Region Education Officer
I am a student at the Open University of Tanzania, pursuing a Master’s Degree in
Education. I am carrying out a research on the influence of incentives and rewards
on the work performance of teachers in Tanzania: a case study of secondary school
teachers in Mbeya Region. I kindly request you to provide me with information. It
will be treated as confidential and used for academic purposes only.
C1: Schools and Teachers, Mbeya Region
(i) Region Schools samples size
Registered Schools Government Community(ward) Total
Mbeya Region
Mbeya City
Sampled Schools
(ii) Number of Teachers and Qualifications
SecondarySchool
GenderQualification
TotalOrdinary Level
Advanced Level
Diploma Degree Post Graduate
Others (specify)
MbeyaDay
MaleFemale
SamoraMachel
MaleFemale
Ilomba MaleFemale
IyungaTechnical
MaleFemale
LolezaGirls
MaleFemale
Sinde MaleFemale
Sub Total MaleFemale
GrandTotal
Thank you for Your Cooperation
151

Appendix III: Various Letters to Allow Field Research
152

153
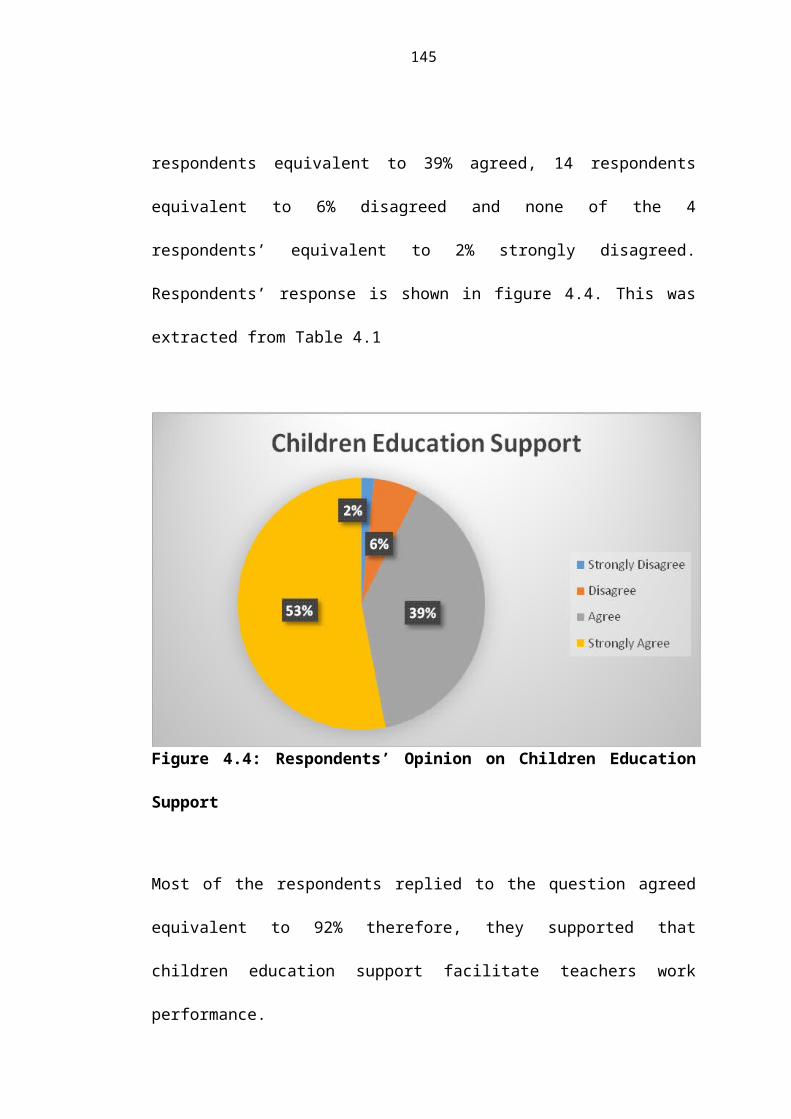
154
155


