Page 1
University of Rhode Island University of Rhode Island
DigitalCommons@URI DigitalCommons@URI
Open Access Master's Theses
2019
THE INFLUENCE OF PLASTIC BAG BANS ON PRO-THE INFLUENCE OF PLASTIC BAG BANS ON PRO-
ENVIRONMENTAL BEHAVIORS IN RHODE ISLAND COASTAL ENVIRONMENTAL BEHAVIORS IN RHODE ISLAND COASTAL
COMMUNITIES COMMUNITIES
Eva Touhey University of Rhode Island, [email protected]
Follow this and additional works at: https://digitalcommons.uri.edu/theses
Recommended Citation Recommended Citation Touhey, Eva, "THE INFLUENCE OF PLASTIC BAG BANS ON PRO-ENVIRONMENTAL BEHAVIORS IN RHODE ISLAND COASTAL COMMUNITIES" (2019). Open Access Master's Theses. Paper 1468. https://digitalcommons.uri.edu/theses/1468
This Thesis is brought to you for free and open access by DigitalCommons@URI. It has been accepted for inclusion in Open Access Master's Theses by an authorized administrator of DigitalCommons@URI. For more information, please contact [email protected] .
Page 2
THE INFLUENCE OF PLASTIC BAG BANS ON PRO-
ENVIRONMENTAL BEHAVIORS IN RHODE ISLAND
COASTAL COMMUNITIES
BY
EVA TOUHEY
A THESIS SUBMITTED IN PARTIAL FULFILLMENT OF THE
REQUIREMENTS FOR THE DEGREE OF
MASTER OF ARTS
IN
MARINE AFFAIRS
UNIVERSITY OF RHODE ISLAND
2019
Page 3
MASTER OF ARTS THESIS
OF
EVA TOUHEY
APPROVED:
Thesis Committee:
Major Professor David Bidwell
Richard Burroughs
Aaron Ley
Nasser H. Zawia
DEAN OF THE GRADUATE SCHOOL
UNIVERSITY OF RHODE ISLAND
2019
Page 4
ABSTRACT
One of the greatest threats to the natural environment is marine debris
pollution. Single-use plastics, one of many contributors to marine debris, are causing
the greatest harm, affecting the well-being of humans and animals. In an effort to
mitigate plastic pollution, environmental policies are implemented to reduce the
availability of single-use plastic products to the consumer. This research looks
explicitly at single-use plastic bag policies to see if implemented plastic bag bans
promote pro-environmental behaviors and broader support for plastic bag policies.
This study sampled two communities in Rhode Island, one with a single-use plastic
bag ban, Middletown, and one without a single-use plastic bag ban, Warwick,
performing face-to-face surveys with 50 individuals in each community (N = 100).
The findings do not show support of a behavioral spillover effect; however, people
living in the town with the implemented plastic bag ban used reusable bags more
frequently than individuals in Warwick and showed greater support for a statewide
plastic bag policy. In addition, age, gender, and environmental worldview (NEP) were
predictors for some pro-environmental behaviors. In all, plastic bag polices could have
broader implications for supporting similar and different environmental policies
moving forward.
Page 5
iii
ACKNOWLEDGMENTS
I first want to thank my major professor, David Bidwell, for guiding and
helping me through completing the master’s thesis process! I also want to thank my
committee members Richard Burroughs and Aaron Ley for their input, support and
great interest in my thesis topic. A huge thanks to my Clean Ocean Access team for
inspiring my thesis topic and supporting my research to learn more about the plastic
bag bans we implemented on Aquidneck Island. Thank you to my entire marine affairs
family; we got through this process together! Lastly, thank you to my mom, dad and
sister for supporting me through my graduate school studies.
Page 6
iv
TABLE OF CONTENTS
ABSTRACT .................................................................................................................. ii
ACKNOWLEDGMENTS .......................................................................................... iii
TABLE OF CONTENTS............................................................................................ iv
LIST OF TABLES ...................................................................................................... vi
LIST OF FIGURES ................................................................................................... vii
CHAPTER 1 ................................................................................................................. 1
INTRODUCTION ......................................................................................................... 1
CHAPTER 2 ................................................................................................................. 4
REVIEW OF LITERATURE ........................................................................................ 4
2.1 MARINE DEBRIS ................................................................................................... 4
2.2 THE PLASTIC ISSUE............................................................................................. 6
2.3 EVOLUTION OF THE PLASTIC BAG ................................................................. 8
2.4 PLASTIC BAG SOLUTIONS ............................................................................... 10
2.5 BEHAVIOR AND POLICY SPILLOVER EFFECTS .......................................... 16
2.6 RESEARCH QUESTION ...................................................................................... 19
2.7 STUDY CONTEXT ............................................................................................... 19
CHAPTER 3 ............................................................................................................... 22
METHODOLOGY....................................................................................................... 22
CHAPTER 4 ............................................................................................................... 29
FINDINGS ................................................................................................................... 29
4.1 POPULATION DEMOGRAPHICS ...................................................................... 29
4.2 ENVIRONMENTAL ORGANIZATION AFFILIATION .................................... 31
Page 7
v
4.3 KNOWLEDGE OF PLASTIC BAG POLICY ...................................................... 32
4.4 PRO-ENVIRONMENTAL BEHAVIORS ............................................................ 34
4.5 SUPPORT FOR STATEWIDE POLICY .............................................................. 36
DISCUSSION .............................................................................................................. 38
CHAPTER 6 ............................................................................................................... 44
CONCLUSION ............................................................................................................ 44
APPENDIX A: SURVEY .......................................................................................... 46
APPENDIX B: TOWN OF MIDDLETOWN PLASTIC BAG ORDINANCE .... 49
BIBLIOGRAPHY ...................................................................................................... 56
Page 8
vi
LIST OF TABLES
TABLE PAGE
Table 1. New Ecological Paradigm Scale ................................................................... 28
Table 2. Description of demographic and pro-environmental behavior variables ...... 30
Table 3. Description of environmental organization affiliation variables .................. 32
Table 4. Description of environmental organization affiliation variables .................. 33
Table 5. Multiple Linear Regression Results .............................................................. 37
Page 9
vii
LIST OF FIGURES
FIGURE PAGE
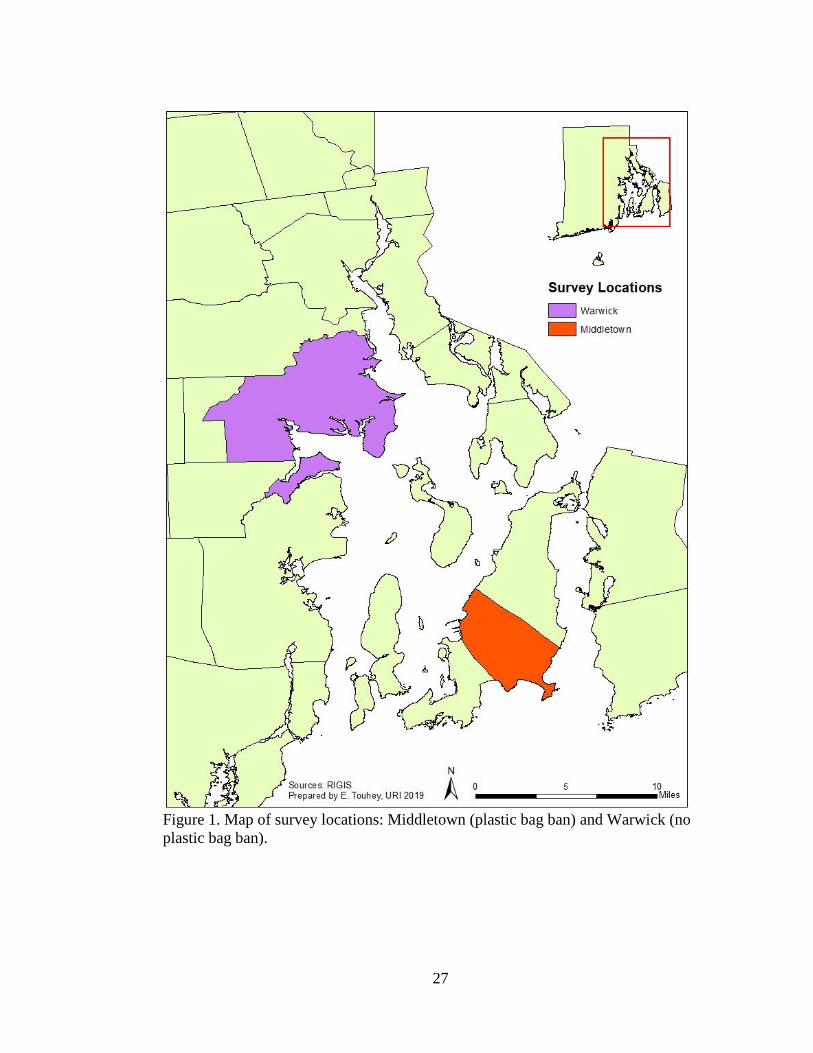
Figure 1. Map of survey locations: Middletown (plastic bag ban) and Warwick (no
plastic bag ban) ........................................................................................................... 27
Page 10
1
CHAPTER 1
INTRODUCTION
Marine debris, the accumulation of manufactured materials in the natural
environment, is classified as a global environmental issue (Sheavly & Register, 2007).
Depending on geographic location, the approach to solve this issue will vary.
Remediation plans may include implementing a new waste management system to
cope with the influx of consumer waste, while other plans may focus on limiting the
consumer to a specific resource through law and policy and general education about
marine debris pollution and preventative actions an individual can take to help
mitigate the issue on a local-scale.
Rhode Island, the smallest state in the United States, suffers from marine
debris pollution, where marine debris build-up is found along most segments of the
state’s coastline. Marine debris is a complex topic because once debris enters the
environment, it is hard to determine the origin of the debris – was it from recent
nearby shoreline activities or did the debris wash in from off-shore? From the personal
to the industrial to the governmental level it is easy to point fingers at an opposing
party to take responsibility for the accumulation of marine debris. Once marine debris
enters the natural environment, however, it becomes a public issue no matter the
source.
One way that the communities in Rhode Island have started to address the
build-up of marine debris in the environment is through policy, specifically plastic bag
policies. Many studies have shown the detrimental effects of plastic bags on the
Page 11
2
environment, starting off as litter on land and becoming marine debris, and then
eventually harming organisms through ingestion and entanglement (Barnes et al. 2009;
Derraik, 2002). Plastic bag policies range from local to state levels (as seen in the
United States) to national levels. Bangladesh, the first country to pass a law banning
single-use plastic bags, created this policy because plastic bag litter was causing a
public health issue for citizens through the clogging of storm drains, which began to
increase flooding after large storms (UNEP, 2018). However, in industrial nations
with established waste management practices that can handle the proliferation of
single-use products, public health is not the main driver for implementing plastic bag
policies. In the United States, plastic bag policies are an accessible first step towards
protecting sacred marine life and set the scene for other future environmental policies.
There is mixed support for plastic bag policies at the individual and municipal
and state level governments. Some argue that education and raising awareness about
the marine debris issue at large will be sufficient in solving marine debris pollution
because the surplus of information will influence individuals to participate in
environmentally friendly behaviors; however, the environmental behavior literature
suggests that education alone is not sufficient in addressing environmental issues
(Kollmuss & Agyeman, 2002). On the other hand, a combined approach of education
and policy is said to be an effective measure at reducing forms of marine debris
(Sheavly & Register, 2007). Currently in the United States, there is an influx of
communities adopting various forms of plastic bag policies as a way to address
littering behaviors and marine debris pollution; however, it is still unclear how this
particular environmental policy is directly impacting the environment and people
Page 12
3
living within communities with the implemented legislation. This research investigates
whether an implemented plastic bag ban in one Rhode Island coastal community
influences residents to participate in pro-environmental behaviors in both public and
private-sphere environmentalism.
Page 13
4
CHAPTER 2
REVIEW OF LITERATURE
2.1 MARINE DEBRIS
Marine debris pollution, commonly defined as unnatural solid waste that
intentionally or accidentally finds its way into the terrestrial or marine environment,
has become a widely accepted and acknowledged public phenomenon over the past
decade (NOAA, 2008). Sheavly and Register, authors of “Marine Debris & Plastics:
Environmental Concerns, Sources, Impacts and Solutions” (2007), identify the most
pervasive forms of marine debris to be from consumer waste, boating and vessel
activities, and all methods of fishing activities (recreational, local and commercial). As
a result, consumer marine debris is often comprised of food wrappers, beverage bottles
and cans, cigarettes and cigarette filters and other hard plastics; boating and vessel
related debris includes Styrofoam, buoys, and ropes; while fishing related activities
leave behind derelict and ghost fishing gear such as traps, netting and line.
The sources of marine debris are attributed to both land-based and ocean-based
activities; however, research has proposed that 80 percent of all marine debris
pollution comes from land-based sources (UN, 2016; Sheavly & Register, 2007,
Barnes et al., 2009). Sheavly and Register (2007) suggest that of the land-based
sources, both “legal and illegal waste handling practices contribute to marine debris”
in the environment. Illegal dumping, littering, transportation of waste via truck,
sewage treatment plants and overflows, and factories and industrial sites, are all
Page 14
5
credited for adding to the marine debris crisis on land. No matter the source, marine
debris is a pollutant that is negatively impacting all living organisms.
Countless research studies have indicated that marine debris is directly
impacting animals of all trophic levels either through ingestion, entanglement or a
combination of the two. Derriak (2002) discusses the effects of ingestion and
entanglement on marine organisms in a literature review. Marine organisms become
trapped in derelict fishing gear and discarded packaging materials, which often leads
to death from drowning, starvation from decreased mobility and ability of reaching a
food source, and/or results in intense wounds which can inhibit long-term movement
and eventually cause death. Some large marine animals are lucky enough to become
naturally untangled from debris with time or receive human help if they are near shore
or are found while boating, but many are not this fortunate.
Ingestion of marine debris occurs because organisms mistake debris for their
natural food source, but also marine debris is so pervasive in the marine environment,
it is often hard to not consume debris with the natural food source (this is common for
filter feeders). The most common form of ingested debris is plastics. Flexible plastics,
like plastic bags, often get mistaken for jellyfish by sea-turtles, resulting in ingestion
and often times entanglement (Derraik, 2002; Barnes et al., 2009). Derriak (2002)
shares that another prolific example of ingestion of debris is in seabirds; many species
of seabirds consume plastic pieces because they are indistinguishable from the natural
food sources and end up feeding this plastic to their chicks. Ingestion of plastic at any
size fills an organism’s digestive tract leaving them feeling full but lacking any
sustenance, leading to starvation and death.
Page 15
6
Marine debris is an environmental issue that is wreaking havoc on marine and
terrestrial ecosystems through indirect and direct human actions. However, there are
scalable solutions for marine debris pollution, beginning with education and outreach,
creating laws and policies that are directly related to waste management practices, and
proper management and enforcement of these environmental regulations (Sheavly &
Register, 2007). Marine debris is a global issue; however, addressing this issue on a
local scale will help to address specific issues and needs tailored to a community.
2.2 THE PLASTIC ISSUE
Before it became recognized as a global environmental pollutant, plastic was
admired for its durability, flexibility, and resiliency – it was the latest and greatest
material for any and all product manufacturing. Industrial plastic began when
polyethylene, a common form of plastic, was accidentally created by two chemists
working at Imperial Chemical Industries plant in 1933. It took five years of
experimentation to finally recreate this ‘accident’ at levels great enough for industrial
use (BBC, 2010). Production of this type of plastic proliferated during World War II,
both in Europe and the United States, because British defenses were using
polyethylene to help insulate their radar cables (BBC, 2010). During World War II,
plastic production increased by 300 percent in the United States alone (Science
History Institute, 2016). World War II kickstarted the industrial age for plastics, and as
a result, an estimated 8.3 billion metric tons of (mostly disposable) plastics have been
created and used globally (Geyer et al., 2017). Plastic soon became the newest and
greatest innovation; constituting most toys, food packaging, clothing and other
consumer items. “Plastics heralded a new era of material freedom, liberation from
Page 16
7
nature’s stinginess,” creating uniformity, convenience and affordability, and color
(Freinkel, 2011). However, reveling in the new world of plastics would only last for a
short amount of time.
During the developmental years of plastic, Americans were using an estimated
30 pounds of plastic products each year. Fast forward to today – the average American
now consumes over 300 pounds of plastics products a year (Freinkel, 2011). In 1960,
plastics comprised less than one percent of the United States total municipal solid
waste; however, by 2005, plastics constituted almost 10 percent of municipal solid
waste in reported countries around the globe (Jambeck et al., 2015). It is estimated that
only 30 percent of all plastic produced in the past 70 years is still being used today
(Geyer et al., 2017), suggesting that the remainder of all the plastic ever produced has
either been recycled, incinerated, disposed into landfills, or are forms of litter in our
terrestrial and marine ecosystems. Even if disposed properly, “plastic persists in
landfill sites…durability of plastic ensures that wherever it is, it does not ‘go away’;
that is, by placing plastics in landfills we may be storing a problem for the future”
(Barnes et al., 2009).
One important characteristic of plastics that has not been discussed is their
mode of degradation. Plastics only breakdown via photodegradation, meaning that the
sunlight breaks down plastic into smaller pieces (Andrady, 1990). However, using the
term ‘degradation’ is a bit of a falsehood because plastic never fully degrades; plastic
just breaks down into smaller pieces, becoming micro- and eventually nano-plastics.
As a result, plastics have been monitored in every ocean, ranging from surface water
to the deep sea (Li et al., 2016).
Page 17
8
In addition, there is curiosity regarding the “lifespan” of plastics, and some
estimates suggest plastic will last from hundreds to thousands of years (Barnes et al.,
2009). There is still much uncertainty about the impacts of plastics and whether the
chemical composition of plastic will have greater impacts on the environment than just
the tangible implications such as debris, entanglement or ingestion.
As previously noted, when plastics enter the natural environment, they infect
every marine trophic level through ingestion and cause death by entanglement, but
there is also evidence that plastics release toxic chemicals into the ocean from
degradation, destroy marine habitats, and spread invasive species throughout the water
column via floating marine plastic (UN, 2016). Plastics are so pervasive in the natural
environment that “plastic is now considered as a geological marker of the
Anthropocene, the emerging epoch in which human activities have a decisive
influence on the state, dynamics and future of the Earth system” (Villarrubia-Gómez et
al. 2018). Once a novelty, plastic has become a normal attribute in the natural
environment and will remain part of varying ecosystems into the immediate and
foreseeable future.
2.3 EVOLUTION OF THE PLASTIC BAG
Shortly after the birth of plastic came the plastic bag, a more durable, less
expensive and lighter-weight alternative to the normal paper or cloth bag (Gardner et
al. 2004). Versions of plastic bags began entering American households in 1957 via
plastic “snack” bags, a new alternative for packing and carrying sandwiches and fruit,
while by the 1960s people began using plastic trash bags to dispose of daily household
waste (Gardner et al., 2004). In the meantime, Sten Gustaf Thulin, an engineer
Page 18
9
working for Celloplast, a Swedish company that focuses on product engineering,
created the single-use shopping bag from polyethylene in 1960. In 1965, this plastic
shopping bag was patented by Celloplast and took hold in the European market
(UNEP, 2018). Celloplast fought to maintain the patent for single-use plastic shopping
bags in the United States but lost this battle to Mobil in 1977, the leader in
petrochemical engineering at the time and arguably still the leader today (Rutan,
2015). By 1979, the plastic bag had officially entered the United States as a widely-
accessible consumer product and was being marketed by many American companies.
The popular grocery store chains, Safeway and Kroger, officially made the switch
from paper bags to plastic bags in 1982, supporting a plastic future (UNEP, 2018).
Through the successive entrance of plastic bags into the United States, the use
of plastic bags in many aspects of daily life quickly became the consumptive norm. By
2014, the United States alone consumed 103,465 billion single-use plastic bags
(Wagner, 2017). The rapid increase and proliferation of the plastic bag in society has
framed itself for disaster. In just a short time, plastic bags have wreaked havoc to
waste management systems and the environment. Because of the thin and flexible
design, the plastic bag has a very low recyclability rate in the United States and, if it is
recycled, the bag often lowers the effectiveness of automated recycling machines
(Wagner, 2017). If plastic bags are not recycled by the consumer, they often end up in
landfills where they will remain indefinitely or become litter in the natural
environment due to improper disposal. Due to the product’s light weight, plastic bags
quickly become airborne, becoming stuck in trees, clogging storm drains, and
eventually becoming marine debris (Barnes et al., 2009). As soon as plastic bags
Page 19
10
become litter, this creates an opportunity to harm terrestrial and marine organisms
through entanglement and ingestion.
2.4 PLASTIC BAG SOLUTIONS
There are two ways that plastic bag pollution is currently being addressed:
environmental policy and behavior change. In order to manage the number of plastic
bags ending up in waste management facilities and the ecosystem, governments, both
at the local and the state level, have and are continuing to implement environmental
policies focused on limiting the use of single-use plastic bags. There are three widely
recognized types of single-use plastic bag legislation in practice: (1) Bag fee where a
fee is required for use of all carryout bags in a store, (2) Second Generation Ban – ban
on thin plastic bags and a fee for using carryout bags that are paper, reusable or
compostable, (3) First Generation Ban – ban only on thin plastic bags (Romer, 2018).
Documented citizen science research has shown that first generation plastic bag bans
are effective in reducing the amount of single-use plastic bags entering the land and
coastline (COA, 2019). Currently in the United States, California is the only state to
have a statewide uniform plastic bag law that uses a fee, while there are 311
communities in 24 states across the country that have unique community bag
ordinances (Romer, 2018). Although there is evidence that environmental policies like
the single-use plastic bag ban and tax, are effective at decreasing environmental
impacts, the limiting factors of any effective policy are compliance and enforcement
of the regulations.
Page 20
11
The second way that plastic bag pollution can be addressed is through behavior
change. The environmental conservation behavior literature provides many examples
to help contextualize why individuals perform specific behaviors and how to influence
behavior changes. De Young (1993) discusses three approaches for stimulating
behavior change, the first being an informational technique. This technique uses
informational messaging to educate people about why they need to change their
behaviors to accommodate an environmental problem, and how they can then change
their behaviors to consider the said environmental condition. This model was created
in the 1970s and is referred to as the information deficit model of public understanding
and action, as well as the linear model. Many social science experiments that use this
model illustrate that the more environmental knowledge that a person has, does not
guarantee a change in their attitude, and therefore does not drive more
environmentally friendly behaviors (Kollmuss & Agyeman, 2002).
De Young (1993) suggests that individuals are more inclined to change their
attitudes about an environmental problem (and therefore their behaviors) once they
have experienced an environmental concern first-hand. This attitudinal shift was found
in an experiment that looked at attitudes towards marine litter after participating in a
beach cleanup. Researchers found that participating in a beach cleanup increased
levels of well-being in individuals and these participants had greater short-term pro-
environmental behavioral intentions, however, the study did not show that these
intentions resulted in performance of behaviors (Wyles et al., 2017). Ideally, once
people have a personal experience with the environment, they can more confidently
Page 21
12
change a behavior because they have a deeper understanding and responsibility
towards the environmental issue of concern (De Young, 1993).
The second approach that De Young (1993) suggests to influence behavior
change is through the use of positive motivational techniques. This method uses
incentives and self-recognition to influence behaviors. Studies that use a monetary
incentive for participating in a behavior or provide a form of social acknowledgement
after an individual performs a behavior result with positive behavior changes. The
third approach involves using a coercive motivational technique, which provides a
more negative approach to behavior change by disincentivizing certain actions with
implementing a tax, producing negative and fearful advertisements, and creating
physical barriers to restrict the behavior from occurring, such as a ban. Plastic bag
policies are a type of coercive motivational behavioral technique because variations of
the policy place a tax or a fee on either plastic bags or alternative paper bags to deter
the consumer from using plastic bags, or a ban is placed on plastic bags altogether,
completely preventing the consumer from using plastic bags into the future.
Depending on the environmental problem and the human behavior that needs
to be changed, one of the previously described techniques may be more appropriate to
use than the others. However, it is first important to understand when and why people
are more inclined to participate in pro-environmental behaviors. Stern (2000) mentions
in his early work that “personal norms to take pro-environmental action are activated
by beliefs that environmental conditions threaten things the individual values and that
the individual can act to reduce the threat.” Here, the theoretical research focuses on
the personal and how the individual reacts to behavior changes. However, Kollmuss &
Page 22
13
Agyeman (2002) expand beyond the individual and suggest, “attitudes do not
determine behavior directly, rather they influence behavioral intentions which in turn
shape our actions. Intentions are not only influenced by attitudes but also by social
(‘normative’) pressures.” Therefore, an individual’s behaviors are influenced by both
their own beliefs and self-interest, as well as, the beliefs of persons in their
surrounding community or social environment. These theories are essential for
analyzing the behavior response to a specific environmental problem.
Furthermore, Stern (2000) defines the two types of environmentalism, also
understood as categories of environmental behaviors: public-sphere environmentalism
and private-sphere environmentalism. Public-sphere environmentalism involves
participating in environmental activism or supporting environmental policy, both of
which indirectly achieve an environmental goal. Other behaviors, such as volunteering
for or donating to environmental organizations, fall into this category of
environmentalism. Participating in public-sphere behaviors may result in a large
environmental impact depending on the size of the policy and environmental
organization being supported (Stern, 2000). Private-sphere environmentalism on the
other hand, focuses on individual behaviors such as purchasing environmentally
friendly products and disposing of household materials in an environmentally
responsible way. Whereas public-sphere behaviors were indirect, private-sphere
behaviors have a direct impact on the environment, however, unless these behaviors
are performed by a group at large, they will have a relatively small positive impression
on the natural environment (Stern, 2000).
Page 23
14
The sparse literature on plastic-bag related behaviors focus on private sphere
behaviors in communities that do not have a plastic bag policy. One study that takes
place in Japan, used a “voice-prompt intervention” at the point of purchase, asking
shoppers whether they would like a plastic bag, rather than automatically providing
them one. The findings of this study report a five percent decrease in plastic bag usage
after the voice-prompt intervention method was put in place. The authors claim that
although this is not a large decrease in bag use, they only collected data for a week
across four different grocery stores, so a longer period of data collection could
attribute to a larger change in behavior (Ohtomo & Ohnuma, 2014).
Another study (Jones et al., 2013) looked at the effectiveness of messaging as a
way to reduce plastic bag use and encourage reusable bag use. Researchers used three
forms of messaging: (1) injunctive normative messaging that stated, “Shoppers in this
store believe that re-using shopping bags is a worthwhile way to help the environment.
Please continue to use your reusable bags;” (2) personal normative messaging that
stated, “We thank you for helping the environment by continuing to reuse your bags;”
and (3) combined normative messaging that used both previous statements as one new
statement. The authors found that the combined messaging approach was the most
effective at reducing plastic bag use, while the injunctive normative message and
personal normative messaging were also effective at smaller degrees. This study
shows that environmental messaging alone was not enough to deter people from using
plastic bags, and the authors state that the most effective way to reduce plastic bag
consumption is by not offering them for free or making them available at the point of
purchase.
Page 24
15
Participation in behaviors that fall within private and public sphere
environmentalism are rooted in an individual’s fundamental values towards the
environment. These values can be measured using two survey-based instruments. Two
common approaches are: New Ecological Paradigm (NEP) and Connectedness to
Nature. NEP is a common measure in environmental behavior literature that considers
an individual’s environmental worldview more broadly (Dunlap et al., 2000). The
literature suggests that the NEP scale is composed of three ecological dimensions:
“balance to nature, limits to growth, and human domination of nature” (Dunlap et al.,
2000), all of which are embraced through a series of standardized questions regarding
the environment. Research has shown that high NEP scores, which correlate to high
environmental values, have been significant predictors of pro-environmental behaviors
(Gatersleben et al., 2014). On the other hand, Connectedness to Nature measures how
much an individual’s self is related or connected to the natural world (Shultz et al.
2005; Mayer & Frantz, 2004). Unlike the NEP measure, Connectedness to Nature is a
self-reported score through the use of a visual aid that features a series of seven
different Venn-diagrams, all containing one circle representing “self” and the other
“nature.” Depending on how an individual perceives their personal relationship with
nature, the respondent will circle the Venn-diagram with the appropriate level of
overlap between “self” and “nature.” Research has also found connectedness to nature
to be a significant predictor of pro-environmental behaviors and environmental
concerns as well (Davis et al., 2009).
Page 25
16
2.5 BEHAVIOR AND POLICY SPILLOVER EFFECTS
A great deal of plastic bag policy research has focused on analyzing the after
effects of implemented bag policies using the framework of behavioral and policy
spillover effects.
Behavioral spillover effect describes the extent to which performing an
environmentally behavior will lead to the performance of another pro-environmental
behavior (Nilsson et al., 2016). There are two major types of behavioral spillover
effects, positive and negative. A positive spillover effect occurs when performing one
environmental behavior increases the chance of an individual performing the same or
new pro-environmental behavior again over a period of time. A negative spillover
effect occurs when performing a pro-environmental behavior reduces the chance of
performing another pro-environmental behavior, often resulting in the previously
described ‘licensing effect.’ (Nilsson et al., 2016). The literature has shown evidence
of positive behavioral spillover effects for pro-environmental behaviors such as an
increase in recycling habits and a reduction in overall resources, and the consumption
of organic foods and increased recycling (Thomas et al., 2016); however, most of
these behavioral spillover effects are based on correlational evidence rather than
statistically significant relationships (Poortinga et al., 2013). To date, plastic bag
policy research has not definitively concluded that plastic bag policies create
behavioral spillovers (Poortinga et al., 2013, Thomas et al. 2016). Understanding the
potential effects of behavioral spillover on environmental policies is important
because often times governments want to know that the proposed policy will be a
Page 26
17
valuable tool to solve an environmental concern, above and beyond the original intent
of said policy (Thomas et al., 2016).
Despite the limited amount of statistically significant research regarding plastic
bag policies and behavioral spillover to non-bag related behaviors, there is a
substantial amount of research about spillover to bag-related behaviors. One study in
particular looked at a community with a plastic bag policy to see if the use of reusable
bags promoted more environmentally friendly shopping behaviors (Karmarkar &
Bollinger, 2015). The researchers concluded that people who brought their own bags
to shop were more likely to buy organic and indulgent foods. This finding is supported
by literature about consumer choice and the licensing effect. It is found that when
people engage in “good” behaviors, in this case using a reusable bag, this decreases
the negative connotations that an individual might have when thinking of buying a
“luxury” item, which is unhealthy foods in this study (Kahn & Dahr, 2006). In this
case, the use of a reusable bag did not directly impact the physical environment, but
instead both negatively and positively influenced the shopping behaviors of the
consumer through private-sphere environmentalism.
A different study tried to understand consumer behavior as well as the
motivations for certain bag use by (1) observing shoppers’ plastic bag use before and
after a charge for plastic bags was implemented in food stores and (2) asking
consumers their reasoning for either agreeing or disagreeing with implemented plastic
bag policy. In the end the researchers observed an increase in reusable bag use at the
stores with the implemented policy than at the stores with no bag fee implementation.
Additionally, support for the plastic bag fee was associated with intrinsic concerns,
Page 27
18
mainly personal care for the environment; however, some people who opposed the
plastic bag fee used reusable bags for financial reasons, mostly so they would save
money (Jakovcevic et al., 2014). This plastic bag research suggests that an established
and enforced plastic bag policy results in more reusable bag use, however, policy
support and subsequent behaviors were contingent on an individual’s inherent
motivations and values.
Policy spillover is similar to behavioral spillover effects, except they explore
the effects of an implemented policy causing support for different, but similar
environmental policies. Thomas et al. (2019) examines policy spillover in their recent
study assessing the effects of the plastic bag charge in the United Kingdom. They
found that individuals who had greater support for a plastic bag fee were more likely
to support a fee for purchasing plastic bottles and unnecessary packaging, illustrating
that “support for the plastic bag charge predicted greater support for policies of similar
scope and size.” The authors note that there may be a limit to the effect of policy
spillovers, meaning that the spillover is constrained to the original policy sphere in
question, which in the study was single-use plastic and packaging. However, this
acknowledgement does not suggest a downfall to the potential effects of policy
spillover because this means many environmental policies regarding marine debris
pollution have the potential of gaining public support. This study also notes that if or
when behavioral spillover occurs, performance of behaviors is also restricted to
context because conceptual connections are stronger among comparable behaviors and
situations. Therefore, not only do environmental policies have the potential of
Page 28
19
influencing more pro-environmental behaviors, but they also could be a catalyst for
greater support of environmental policies at large.
2.6 RESEARCH QUESTION
This research analyzes the effects of implemented plastic bag bans in Rhode
Island, using two coastal communities, one with a plastic bag ban and the other
without, as a case study. The current bans on single-use plastic bags in Rhode Island
were suggested and implemented to reduce the amount of litter in the environment,
with the hopes that the policy would also raise community awareness and shed light to
the greater issue of marine debris. This research is comprised of two main objectives
(1) identify whether implemented plastic bag bans influence community members to
participate in additional pro-environmental behaviors within private and/or public-
sphere environmentalism; and (2) understand individual’s general awareness of the
plastic bag policy established in their community of residence.
2.7 STUDY CONTEXT
This section provides background information on marine debris pollution and
current plastic bag policies specific to Rhode Island. Citizen science data collected
during marine debris cleanups illustrates the effects of municipal level plastic bag
policies on the natural environment.
As of January 1, 2019, the state of Rhode Island comprises 10 municipal
ordinances that feature first generation plastic bag bans, meaning all retail stores no
longer have plastic bags available at the site of purchase and are required to carry
paper bags as a free alternative. These ordinances were designed to encourage reusable
bag use, not a sudden prioritization to paper bags. At this point in time, all of the
Page 29
20
plastic bag bans in the state are uniform and are implemented in the following
communities (listed in order of implementation date): Barrington, Newport,
Middletown, New Shoreham, Jamestown, Portsmouth, Warren, Bristol, South
Kingston, North Kingston (Bag Laws, 2019).
Empirical data on the success of these policies has been collected primarily by
a single nonprofit organization on Aquidneck Island. Clean Ocean Access is a
nonprofit organization situated in Middletown, Rhode Island that focuses on
addressing ocean health issues on and around Aquidneck Island. Clean Ocean Access
is a community-driven organization whose environmental efforts are completed
working with community members and the three municipalities on Aquidneck Island
through citizen science and advocacy work. Citizen science programs such as
shoreline cleanups have increased overall awareness of the marine debris issue both at
the local, national and international level, however “while identifying the types and
amount of debris that are frequently found on beaches is an important first step,
understanding the impacts of those consumer items is critical if effective voluntary or
regulatory measures are to be implemented to limit their impacts” (Wilcox et al.
2016). Clean Ocean Access has recorded the types of items found at all shoreline
cleanups since 2013, documenting the impact of the cleanup and then using this data
to influence environmental advocacy efforts.
More specifically, the organization used the citizen science data signifying the
number of plastic bags removed from various stretches of coastline around Aquidneck
Island to illustrate why a single-use plastic bag ban is necessary for protecting the
environment and would be effective in reducing one type of single-use plastic
Page 30
21
commonly found on and around beaches. As of 2018, Clean Ocean Access removed
20,266 single-use plastic bags from marine debris cleanups.
At the end of 2018, Clean Ocean Access had an entire year’s worth of data to
illustrate the impact of the ban on single-use bags had on local environment. In the
two years leading up to the plastic bag ban, volunteers helped to remove 4,112 plastic
bags in 2016 and 4,687 plastic bags in 2017, the largest number of bags recorded in
one year to date. In 2018, 3,698 plastic bags were found at marine debris cleanups,
989 fewer plastic bags than the previous year.
Since the scope of the plastic bag policy research focuses on specifically two
communities within Rhode Island, Middletown and Warwick, it is necessary to see
how the implemented plastic bag ban impacted the coastline of Middletown, the
community with the passed plastic bag ordinance. Similar trends were found to that of
all cleanups where 1,284 plastic bags were removed in 2016, 1,815 removed in 2017,
and 1,311 in 2018, 504 bags less than the previous year. Overall, the data reflects that
the ban on single-use plastic bags is effective in reducing the number of plastic bags
found on around the Aquidneck Island coastline, in addition to shoreline locations
specific to Middletown.
Page 31
22
CHAPTER 3
METHODOLOGY
In order to capture the effects of plastic bag bans on pro-environmental
behaviors and knowledge about plastic bag policies, face-to-face surveys were
conducted in two Rhode Island coastal communities, one with an implemented plastic
bag ban and one without a plastic bag ban, as a case study. The Town of Middletown
was chosen as the community with an implemented plastic bag ban, where a plastic
bag ban went into effect on December 1, 2017. The City of Warwick was chosen as
the community without an implemented plastic bag ban (Figure 1). As of June 2018,
Warwick was one of the few coastal communities in Rhode Island that had not
discussed the possibility of a plastic bag ban at the municipal level, so it was chosen as
the control. According to Gerring (2004), case study research “is an intensive study of
a single unit for the purpose of understanding a larger class of (similar) units,” where a
unit is identified as a person, state, community etc. and is “observed at a single point
in time or over some delimited period of time.” Therefore, this study looks into the
effects of a plastic bag ban only post-implementation to understand how the policy is
affecting people living within or outside one community with a plastic bag ban in
Rhode Island, with the intention of analyzing the broader implications of the findings
from this study at the state-level.
In order to understand how implemented plastic bag bans influenced the
average person in each community, purposive sampling was used to select
neighborhoods in each community. First, neighborhoods that were comprised of
Page 32
23
similar median household incomes in each community were identified using census
tract data, and second, neighborhoods within these identified areas were selected to
make sure each survey sample was comparable. According to the 2013-2017
American Community 5-Year Estimates, the median household income in Middletown
is $65,799 and is $71,191 in Warwick (DADS, 2017). Neighborhoods were chosen
using an interactive map of the 2017 American Community 5-Year Estimates that
mapped census tracts and census blocks within Newport County (Middletown) and
Kent County (Warwick) according to median household income (DADS, 2017).
A series of five neighborhoods were chosen within each community and
identified with a number. On the day of survey collection, numbers were pulled out of
hat to ensure a random order. Face-to-face surveys were conducted by a single
surveyor in both communities, ensuring reliability of the samples. The surveyor visited
every house in a neighborhood and asked a year-round resident over the age of 18 to
participate in the survey; these were determined by demographic questions that
addressed age and residency. If the individual said ‘yes’, they participated in an
anonymous verbal survey. If the individual said ‘no’, this counted as a ‘no response.’
If the door was unanswered, the surveyor returned to the unanswered house once more
before identifying the no answer as a ‘no response’. To minimize the number of ‘no
answers’, surveys were administered during weekday evenings and weekend days
from August to September 2018. Surveys were administered using a quota sampling
technique because surveying ended once 50 individuals in each community were
sampled, reaching a total sample size of 100 (Robson, 2011).
Page 33
24
The survey was comprised of six sections, the first section asking basic
demographic questions such as age, gender, highest level of education, annual level of
household income, town of residence and if the home was their primary address.
Highest level of education was measured on a 5-point scale, where 1 = less than high
school, 2 = high school, 3 = associate or junior college degree, 4 = bachelor’s degree
and 5 = professional or graduate degree. Age, gender, town of residence and
household income were open-ended questions that required a hand-written answer by
the participant, ensuring reliability of the sample (Table 2).
The next section measured an individual’s Connectedness to Nature using a
diagram from Davis et al. (2009) that uses a series of Venn-diagrams to describe how
a person depicts their relationship with the environment. Connectedness to Nature was
measured on a 7-point scale where 1 = no personal connection to the environment and
7 = a deep personal connection with the environment. The participant circled one of
the seven diagrams. This diagram controlled for the possibility of proximity to the
coastline influencing answers to pro-environmental behaviors questions because
people who live near the coastline may have a higher personal connection to nature,
which could impact behavioral intentions (Table 2).
The third section measured an individual’s environmental worldview using the
New Ecological Paradigm (NEP) Scale presented by Whitfield et al. (2009). Whitfield
et al. (2009) used a series of seven questions that were answered using a 7-point Likert
scale. This survey used the same seven questions, but respondents answered on a scale
of agree, disagree or undecided. The NEP scale measures both pro- and anti-
environmental worldviews, where positive environmental worldviews are the
Page 34
25
agreeable answers for questions 1 through 4 and are the disagreeable answers for
questions 5 through 7. The answers to questions 5 through 7 were reverse coded for
each participant. After reverse coding, the answers to each of these seven questions
were added together to create a NEP index that ranged from 1 to 7, which was used for
data analysis (Table 1).
The fourth survey section gaged an individual’s participation in environmental
behaviors, also known as private-sphere environmentalism, by asking if they purchase
bottled water, use a reusable water bottle, bring reusable bags to the grocery store, and
recycle at home. These four questions were measured on a 4-point scale, where 1 =
never, 2 = occasionally, 3 = frequently, and 4 = always (Table 2). The variables
purchasing bottled water and using a reusable water bottle were chosen because like
plastic bags, plastic bottles directly contribute to marine debris pollution, and using a
reusable water bottle is a behavior that is similar in scope and size to using a reusable
bag.
The fifth section looked at an individual’s affiliation with environmental
organizations, a form of public-sphere environmentalism, by asking how often they
volunteer for an environmental organization, and if they donate and/or have a
membership to an environmental organization. Frequency of volunteering was
measured on a 4-point scale where 1 = never, 2 = once a year, 3 = once a month and 4
= weekly, however for data analysis this variable was recoded into 1 = has volunteered
and 0 = has not volunteered. Donation and memberships to environmental
organizations were measured on a 2-point scale, where 1 = yes and 0 = no (Table 3).
Page 35
26
The sixth survey section measured knowledge of plastic bag policies through a
series of seven questions. To control for potential biases, individuals were asked how
often they shop for groceries in their town of residence on a 4-point scale where 1 =
never, 2 = occasionally, 3 = frequently and 4 = always. If an individual was not
shopping always shopping in their town of residence, they were asked what other
towns they shopped for groceries in. Then, they were asked if their town of residence
had a plastic bag ban, if there was an existing statewide plastic bag ban, and if plastic
bag were available at the checkout counters at the grocery stores. Participants were
given the options of yes, no or unsure. Participants were asked if there were fees on
any bags at the grocery store, this variable was measured on a 4-point scale where 1 =
no, 2 = paper bags only, 3 = plastic bags only and 4 = paper and plastic bags. The last
question asked whether the individual supported a statewide plastic bag ban on a 4-
point scale where 1 = not at all, 2 = somewhat, 3 = mostly and 4 = definitely (Table 4).
In order to interpret the results, independent sample T-tests, chi-square
goodness of fit tests and multiple linear regression were used for data analysis using
IBM SPSS V.25.
Page 36
27
Figure 1. Map of survey locations: Middletown (plastic bag ban) and Warwick (no
plastic bag ban).
Page 37
28
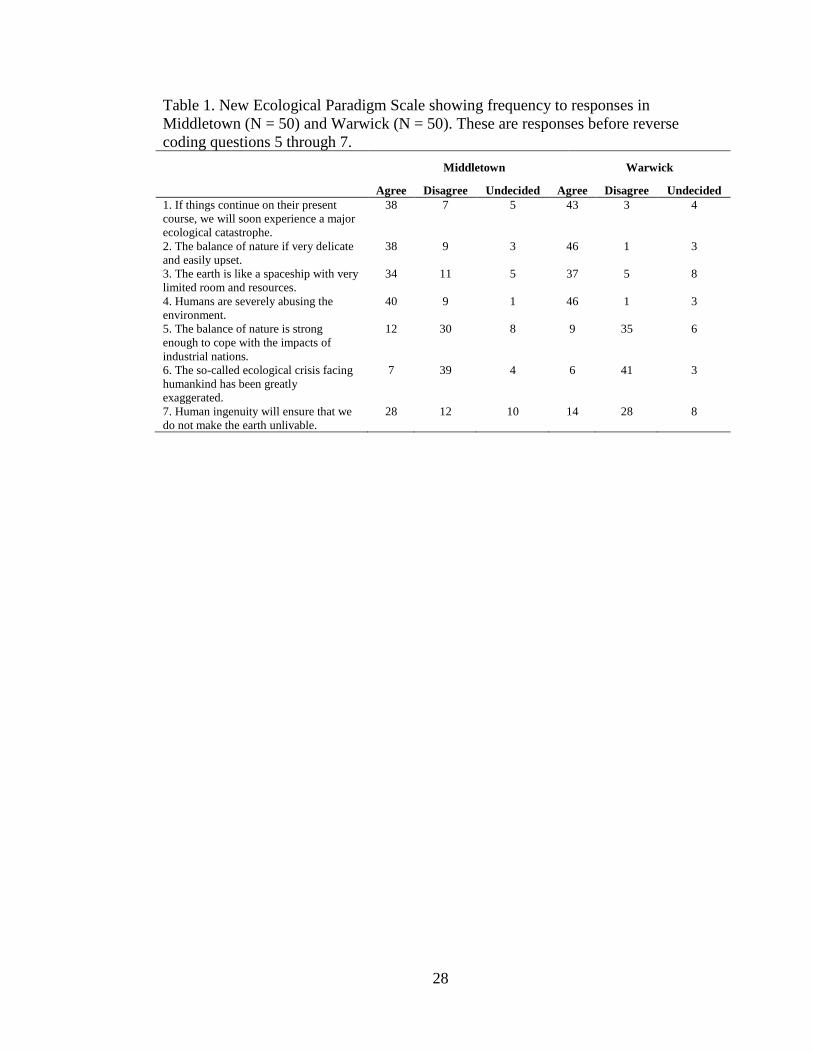
Table 1. New Ecological Paradigm Scale showing frequency to responses in
Middletown (N = 50) and Warwick (N = 50). These are responses before reverse
coding questions 5 through 7.
Middletown Warwick
Agree Disagree Undecided Agree Disagree Undecided
1. If things continue on their present
course, we will soon experience a major
ecological catastrophe.
38 7 5 43 3 4
2. The balance of nature if very delicate
and easily upset.
38 9 3 46 1 3
3. The earth is like a spaceship with very
limited room and resources.
34 11 5 37 5 8
4. Humans are severely abusing the
environment.
40 9 1 46 1 3
5. The balance of nature is strong
enough to cope with the impacts of
industrial nations.
12 30 8 9 35 6
6. The so-called ecological crisis facing
humankind has been greatly
exaggerated.
7 39 4 6 41 3
7. Human ingenuity will ensure that we
do not make the earth unlivable.
28 12 10 14 28 8
Page 38
29
CHAPTER 4
FINDINGS
4.1 POPULATION DEMOGRAPHICS
The survey included 100 participants, sampling 50 adults in both Warwick and
Middletown, Rhode Island. The total sample included 47 males and 53 females, who
ranged in age from 20 to 86 years old. Other descriptive variables describing the
demographics of the total survey population (N = 100) are listed in Table 2. There are
minor differences between the two-survey populations. The mean age was higher for
Middletown participants than Warwick participants, amounting to 59 and 50 years old,
respectively. After running an independent sample T-test, there was a statistically
significant difference in the mean education levels between the towns, with
Middletown participants having a significantly higher (p = 0.006, t = 2.816) mean
level of education (M= 3.54) than that of Warwick participants (M=2.94) (Table 2).
The annual income for Middletown respondents was higher than Warwick
respondents, averaging $76,577and $60,069, respectively (Table 2). According to the
2013-2017 American Community 5-Year Estimates, the median household income in
Middletown is $65,799 and is $71,191 in Warwick (Census 2017). The discrepancy
between annual income levels from the survey sample and the census tract data may
be attributed to missing survey data. Of the completed surveys, 23 Middletown
respondents and 21 Warwick respondents failed to provide their annual income level.
For this reason, annual income was not used as a predictive variable for data analysis.
Page 39
30
Table 2. Description of demographic and pro-environmental behavior variables for the
general survey group (n=100), Middletown respondents (n=50) and Warwick
respondents (n=50); reporting the mean and standard deviation. Bolded values indicate
statistical significance between town of residence (T-test p < 0.05).
Total Sample Middletown Warwick
Variable Description Mean SD Mean SD Mean SD
Gender Dummy Variable (Male =1 and Female = 0)
0.47 0.50 0.46 0.50 0.48 0.51
Age Age of the participant 54.61 17.89 58.86 18.50 50.28 16.31
Education Level Highest level of education
of the participant
3.24 1.10 3.54 1.15 2.94 0.98
Annual Income Annual income of the
participant
$67,873 $36,757 $76,577 $36,275 $60,069 $36,020
Connectedness to Nature
A 7-point scale measuring personal connection to the
environment, where 1 = no
connection and 7 = total connection with nature.
4.84 1.78 4.56 1.78 5.12 1.76
Environmental Worldview
(NEP)
A sum of responses to seven statements where 7
represents the strongest
environmental worldview.
5.07 1.88 4.62 1.98 5.52 1.68
Purchasing
Bottled Water
A 4-point scale measuring
the behavior of purchasing bottled water, where 1 =
never and 4 = always.
2.30 1.07 2.18 1.10 2.42 1.03
Reusable Water Bottle
A 4-point scale measuring the behavior of using a
reusable water bottle,
where 1 = never and 4 = always.
2.54 1.22 2.42 1.28 2.66 1.15
Reusable Bags A 4-point scale measuring
the behavior of bringing
reusable bags to the grocery store, where 1 =
never and 4 = always.
2.94 1.20 3.18 1.08 2.70 1.27
Longevity of Reusable Bag
Use
The number of years a participant has used
reusable bags
4.91 55.54 4.24 5.92 5.58 8.73
Recycle
A 4-point scale measuring the behavior of daily
household recycling,
where 1 = never and 4 = always.
3.98 0.20 3.98 0.20 3.98 0.20
The measure Connectedness to Nature was comparable between the two
communities, where the mean response on the 7-point scale for Middletown and
Warwick respondents was 4.56 and 5.12, respectively (Table 2). An individual’s
Page 40
31
environmental worldview was measured using the New Ecological Paradigm (NEP)
scale, a series of seven questions that were answered on scale of agree, disagree or
undecided. NEP score was calculated by determining the number of statements that
each individual responded to with an agreeable answer; agreeable answers varied
depending on the format of each question, which resulted in reverse coding the
answers to questions 5 through 7 (Table 1). A new variable, total NEP score, was
created through the summation of the agreeable answers for each participant, resulting
with Warwick respondents having a higher mean total NEP score (M = 5.52) than
Middletown respondents (M = 4.62) (Table 2).
4.2 ENVIRONMENTAL ORGANIZATION AFFILIATION
Individuals were asked about their affiliations with environmental
organizations regarding volunteering, donating and membership. Volunteering
behaviors were similar between the sample populations, where 10 of 50 Middletown
participants and 14 of 50 Warwick participants said they volunteer for environmental
organizations (Table 3). 18 of 50 Middletown participants and 17 of 50 Warwick
participants said that they have donated to an environmental organization in the past
12 months. Lastly, 10 of 50 Middletown participants and 5 of 50 Warwick participants
said they have a membership to an environmental organization (Table 3).
Memberships to environmental organizations included nonprofits that ranged from the
local and state levels, to nationally recognized: Clean Water Action, Arbor Day
Foundation, Clean Ocean Access, World Wildlife Fund, Save The Bay, Sierra Club,
Nature Conservancy, Climate Action and Surfrider Foundation. Data analysis did not
Page 41
32
find any of these variables to have statistically significantly differences in their means
and were not significant predictors in regression analysis.
Table 3. Description of environmental organization affiliation variables for the general
survey group (n=100), Middletown respondents (n=50) and Warwick respondents
(n=50); reporting frequencies. Total Sample Middletown Warwick
Variable Description Yes No Yes No Yes No
Volunteering If the participant has volunteered for an environmental
organization in the past.
24 76 10 40 14 36
Donation If the participant has donated to an environmental organization in
the past 12 months.
35 65 18 32 17 33
Membership If the participant has a membership to an environmental organization in the past 12 months.
15 85 10 40 5 45
4.3 KNOWLEDGE OF PLASTIC BAG POLICY
Individuals in each community were asked about their knowledge of plastic
bag policies in their town of residence and at the state-level. To reduce the amount of
incorrect knowledge about plastic bag policies within each community, respondents
were asked how frequently they grocery shop within their town of residence, therefore
accounting for any towns or stores they were shopping in that may or may not have
complied with the bag policy established in their town of residence. Respondents in
both communities reported a high degree of loyalty to shopping within their respective
towns, with an average response of 3.62 in Middletown and 3.60 in Warwick (Table
4).
Second, when asked about current plastic bag policies within their community,
48 of 50 Middletown participants correctly responded that there was an implemented
plastic bag ban in Middletown, while 46 of 50 Warwick participants correctly
answered that there was not an implemented plastic bag ban in Warwick (Table 4).
Page 42
33
Third, when asked about whether plastic bags are available at the checkout
counters at grocery stores within each community, 39 of 50 Middletown participants
correctly responded that plastic bags are not available at the checkout counter, while
49 of 50 Warwick participants correctly answered that there are plastic bags available
at the checkout counter (Table 4). Fourth, when asked about whether there were fees
for bags (paper or plastic) at the grocery stores in each community, 35 of 50
Middletown participants and 42 of 50 Warwick participants correctly answered that
there are no fees for any bags at the grocery store in their respective communities
(Table 4). Fifth, when individuals were asked if there was an existing statewide plastic
bag ban in Rhode Island, 29 of 50 Middletown participants and 46 of 50 Warwick
participants correctly responded that there was not an existing statewide ban in Rhode
Island (Table 4).
Table 4. Description of plastic bag knowledge variables for Middletown respondents
(n=50) and Warwick respondents (n=50); reporting frequencies, mean and standard
deviation. Bolded values indicate statistical significance between town of residence
(T-test p < 0.05). Variable Description Middletown Warwick
Yes No Unsure Yes No Unsure
Town Plastic Bag
Ban
Knowledge if there is a plastic bag ban in
towns of residence.
48 2 0 1 46 3
Plastic Bag
Availability
Knowledge if there are plastic bags available at
the checkout counters in grocery stores.
8 39 3 49 1 0
Existing Statewide Ban
Knowledge if there is a current statewide plastic bag ban in RI.
11 29 10 0 46 4
Mean SD Mean SD
Shopping for
Groceries
A 4-point scale measuring the frequency of
shopping for groceries in town of residence,
where 1 = never and 4 = always.
3.62 0.67 3.60 0.57
Fees for bags at the
grocery store
A 4-point scale measuring whether there are
fees for bags at grocery stores, where 1 = no
fee, 2 = paper bags only, 3 = plastic bags only and 4 = paper and plastic bags)
1.22 0.58 1.14 0.50
Support for a
Statewide Plastic
Bag Ban
A 4-point scale measuring the support for a
statewide plastic bag ban, where 1 = not at all
and 4 = definitely.
3.66 0.77 3.28 1.01
Page 43
34
4.4 PRO-ENVIRONMENTAL BEHAVIORS
A series of multiple linear regression models were created to understand how
several factors, including town of residence, related to the performance of pro-
environmental behaviors and environmental policy support, while controlling for other
predictive variables. Individuals were asked about their participation in the following
pro-environmental behaviors: purchasing bottled water, using a reusable water bottle,
bringing reusable bags to the grocery store, household recycling, and the duration of
reusable bag use. For all regression analyses the model runs for dependent variables
consisted of six predictors: gender dummy, town dummy, age, education level,
Connectedness to Nature and total NEP (Table 5). For gender and town, dummy
variables were created; males and the town of Middletown were used as the reference
variable.
On average, responses to purchasing bottled water were in the middle of the 4-
point scale, with a mean response of 2.18 for Middletown participants and 2.42 for
Warwick participants (Table 2). Further data analysis did not find bottled water
purchases to be predicted by any of the six predictor variables.
There was a difference between the mean frequencies of reusable water bottle
use in Middletown (M = 2.42) and Warwick participants (M = 2.66) (Table 2). When
classified as an independent variable in a regression model, gender, age and total NEP
score were statistically significant predictors for reusable water bottle use. Gender and
age both showed a significant negative relationship for reusable water bottle use. Male
participants reported using reusable water bottles less frequently than female
participants (p = 0.041, β = -0.205), while reusable water bottle use decreases as age
Page 44
35
increases (p = 0.006, β = -0.282). Lastly, there was a significant positive relationship
between total NEP score and reusable water bottle use (p = 0.021, β = 0.235),
indicating that higher NEP totals result in greater reusable water bottle use. This
model run had an R Square value of 0.181 and age is noted as more effective predictor
for reusable water bottle use than gender. Town of residence, education level and
Connectedness to Nature were not statistically significant predictors for reusable water
bottle use (Table 5).
Furthermore, there was variation in the mean frequencies of bringing reusable
bags to the grocery store for Middletown (M = 3.18) and Warwick respondents (M =
2.70) (Table 2). An independent-sample T-test concluded that there was a statistically
significant difference between these means (p = 0.044, t = 2.038), suggesting that
reusable bag use is significantly higher in Middletown than Warwick. In addition, the
multiple regression model for reusable bag use revealed town of residence, total NEP
score and age as statistically significant predictors for the behavior, all of which
exhibited significant positive relationships within the model. As a predictor, town of
residence (p = 0.035, β= 0.227) explains that Middletown participants bring reusable
bags to the grocery more frequently than Warwick participants. Similarly, higher total
NEP scores (p = 0.008, β= 0.272) result with bringing reusable bags to the grocery
store more frequently. Age produces an almost significant result (p = 0.056, β= 0.198),
suggesting that an increase in age also results in more frequent reusable bag use. The
R squared value for this regression model was 0.183. Gender, education level and
Connectedness to Nature were not statistically significant predictors for bringing
reusable bags to the grocery store (Table 5).
Page 45
36
A new variable was computed to determine how many participants started
using reusable bags at the grocery within the past year in each community. A chi-
square goodness of fit test suggests that there was a statistically significant association
between residence and starting to use reusable bags within the past year (p = 0.002, x2
= 9.756), indicating that Middletown respondents began to use reusable bags in the
past year significantly more than Warwick respondents.
In addition, the responses for participating in household recycling in
Middletown and Warwick was rated highly on the 4-point scale, averaging a response
of 3.98 in both communities (Table 2). Participants were asked about the duration of
their reusable bag use at grocery stores; where on average Middletown respondents
have used reusable bags for an average of 4 years, Warwick respondents have used
reusable shopping bags for an average of 5.5 years (Table 2). Neither of these
variables showed any statistical significance in data analysis.
4.5 SUPPORT FOR STATEWIDE POLICY
Individuals were asked about their support for a statewide plastic bag ban in
Rhode Island, resulting with a mean response that equated to a high degree of support
for both Middletown (M = 3.66) and Warwick (M = 3.28) participants. An
independent sample T-test concluded that there was a statistically significant
difference in the means between town of residence and support for a statewide plastic
bag ban (p = 0.037), suggesting that Middletown participant’s support for a statewide
plastic bag ban was significantly higher than Warwick participants. In addition, when
classified as the dependent variable in the multiple linear regression model, town of
residence and total NEP score were significant positive predictors for support for a
Page 46
37
statewide plastic bag ban. Middletown participants were more likely to support a
statewide plastic bag ban than Warwick participants (p = 0.008, β = 0.279), while
individuals that scored higher total NEP scores had greater support for a statewide
plastic bag ban (p = 0.000, β = 0.361). The R Square for this regression model was
0.212. Total NEP score had a higher standardized coefficient (0.361) than town
residence (0.279), suggesting that total NEP score is a somewhat more effective
predictor for support for a statewide ban. Education level, connectedness to nature,
gender and age were not significant predictors for support of a statewide plastic bag
ban (Table 5).
Table 5. Multiple Linear Regression Results. Bolded values indicate statistical
significance between town of residence (p < 0.05).
Reusable Water Bottle Reusable Bags Support for a Statewide Ban
Variable
Standardized
Coefficient P-Value
Standardized
Coefficient P-Value
Standardized
Coefficient P-Value
Gender Dummy -0.205 0.041 0.006 0.951 -0.036 0.711
Town Dummy 0.017 0.872 0.227 0.035 0.279 0.008
Age -0.282 0.006 0.198 0.056 0.063 0.524
Education Level 0.084 0.396 0.021 0.831 0.072 0.463
Connectedness to
Nature 0.089 0.376 0.065 0.523 0.126 0.204
Total NEP 0.235 0.021 0.272 0.008 0.361 0.000
R Square 0.181 0.164 0.212
Page 47
38
CHAPTER 5
DISCUSSION
This research had two main objectives (1) identify whether implemented
plastic bag bans influence community members to participate in additional pro-
environmental behaviors within private and/or public-sphere environmentalism; and
(2) understand individual’s general awareness of the plastic bag policy established in
their community of residence.
Middletown respondents had a significantly higher level of education than
Warwick participants; however, since education level was not a significant predictor
in the behavioral analysis, this difference is inconsequential. All other data involving
personal characteristics such as age, gender, Connectedness to Nature and total NEP
score were uniform between the two communities. The analysis of environmental
organization affiliation showed that the majority of participants in both communities
are not active volunteers and do not donate or have a membership to environmental
organizations. Therefore, this specific study does not support that living in a
community with a plastic bag ban encourages community members to become
outwardly involved or more financially supportive of environmental organizations,
both of which fall within the public-sphere environmentalism.
Regarding participant’s knowledge of plastic bag policies in their town of
residence, there were no significant differences between the two samples, suggesting
that participants in each community were ‘correct’ about the respective plastic bag
policy in their community of residence. More specifically, Middletown participants
Page 48
39
acknowledged that there was an implemented plastic bag ban in the town of
Middletown, plastic bags are not available at the checkout counter in grocery stores,
there is no fee for plastic bags in grocery stores, and there is currently not a statewide
plastic bag ban in Rhode Island. However, despite being correct, only 29 out of the 50
respondents in the Middletown sample answered the question about an existing
statewide plastic bag policy correctly, suggesting that many people living in the
community with the plastic bag ban were unsure whether this was due to a local or a
statewide policy. Comparatively, 42 of 50 Warwick respondents answered this
question correctly. Warwick respondents also correctly answered that there is not an
implemented citywide ban, plastic bags are still available in the grocery stores and
there is not a fee for any bags currently in grocery stores. Therefore, the majority of
respondents in both communities are knowledgeable about the presence or absence of
a plastic bag policy in their community.
When analyzing whether the plastic bag ban influenced individual pro-
environmental behaviors, recycling and purchasing bottled water did not yield any
significant results. It was found that age, gender and total NEP score were all
significant predictors for reusable bottle use. This suggests that overall, females use
reusable bottles more frequently then male participants; reusable water bottles are used
more frequently with younger participants; and individuals that scored a higher NEP
score are more likely to use a reusable water bottle. Although these results are not
significant between the two communities, they do point out overall trends within the
sample population. Literature on environmentalism reveals that historically, females
report greater participation in environmental behaviors than males (Zelezny et al.,
Page 49
40
2000). Also, as mentioned in the literature review, there is evidence for high NEP
scores leading to the practice of environmentally friendly behaviors (Gatersleben et
al., 2014). In addition, there is extensive research regarding the use of age as a
predictor for environmental behaviors. Research has shown discrepancies between age
and environmental attitudes and pro-environmental behaviors; however, these
differences can be attributed to the various dimensions of environmentalism. Overall,
studies have supported that younger individuals participate in more pro-environmental
behaviors and have a greater concern for the environment than older individuals
(Wiernik et al., 2013).
Furthermore, the results show that reusable bag use is significantly higher
among Middletown respondents than Warwick respondents, suggesting that the
implemented plastic bag ban in Middletown most likely caused residents to start
bringing reusable bags to the grocery store. This conclusion is further supported by the
significant result that Middletown participants began using reusable bags significantly
more within the past year compared to Warwick respondents. Surveying for this study
was performed almost an entire calendar year after the ban on single-use plastic bags
went into effect in Middletown (implementation date December 1, 2017), suggesting
that the plastic bag ordinance likely caused this behavioral change through the
encouragement of using reusable bags. In addition, it is important to note that this
plastic bag policy provides Middletown residents with a free choice of paper bags and
the option of purchasing or bringing their own reusable bags. Therefore, even with a
choice of using the free alternative, there was still an increase in reusable bag use
overall, further justifying this significant finding.
Page 50
41
In addition, reusable bag use hinted to trends among the entire sample because
total NEP score and age were also significant predictors of this behavior. Similar to
reusable water bottle use, a higher total NEP score resulted with more frequent
reusable bag use. Also, older participants reported more frequent reusable bag use;
however, this result was not quite significant at p <0.05. The finding that older people
use reusable bags more frequently is consistent with other studies exploring the effects
of plastic bag policies on demographics (Thomas et al., 2019), therefore supporting
this almost significant result.
Lastly, it was found that town of residence and total NEP score were
significant predictors of support for a statewide plastic bag ban. The results show that
Middletown respondents were more supportive of a statewide plastic bag ban than
Warwick participants, and, similar to reusable water bottle and reusable bag use,
participants with a higher NEP score showed greater support for a statewide plastic
bag ban. This study suggests that NEP is a predictor for both private-sphere and
public-sphere environmentalism, however, within the public-sphere it was only a
predictor for supporting policies, not involvement in environmental organizations.
NEP is an important control in this study because since there was not a significant
difference between total NEP scores among the two communities, this means
respondents in both communities have equivalent environmental worldviews, showing
that the implemented plastic bag ban is the likely cause for the changes in reusable bag
use and support for a broader plastic bag policy in the state, not the respondents view
on environmental issues. In addition, the significance of town of residence and support
for a statewide ban suggests that people are more likely to support a scalable
Page 51
42
environmental policy once they have experienced the policy firsthand. Because policy
spillover refers to supporting different but similar environmental policies, the support
for a broader plastic bag policy in Rhode Island does not support this framework in
particular since the support is for the same environmental policy; however, previous
studies have found that support for plastic bag charge increased after a month of its
implementation, which helps to support this result (Poortinga et al., 2013; Thomas et
al., 2019).
There were a few methodological weaknesses in this study that need to be
acknowledged. First, annual income could not be used as a predictor for multiple
linear regression analysis because almost half of the total sample population failed to
provide a value for income, resulting with an inaccurate mean representation of
income levels. To address this in future studies, providing a scale or range of income
levels that the participant can circle instead of voluntarily write in will make the
participant more inclined to answer the question. In addition, there needs to be a better
record of survey participation results documenting the number of houses approached,
number of refusals and number of no answers. This information was not recorded
while administering surveys for this project.
This research reveals the need for further research on plastic bag reduction
policies. Even though the results of this research did not find that an implemented
plastic bag ban has behavioral spillover, this does not mean that behavioral spillover
did not occur within Middletown. The survey that was administered provided a very
select group of behaviors to analyze, so perhaps expanding the list of private-sphere
environmentalism behaviors will include a better representation of the behaviors being
Page 52
43
performed in the community and the results would therefore be more applicable to the
behavioral spillover framework. In addition, it would be interesting to see if there is
policy spillover to support other environmental policies such as a bottle tax or a ban on
the release of balloons, two environmental policies that are popular topics of
conversation among Rhode Island residents. Furthermore, asking an individual’s
political affiliation as a survey question could provide insight into what people within
each community are more supportive for a broader plastic bag policy, as well as,
general support for other environmental policies. Lastly, it would have been
interesting to gather a sense of an individual’s fundamental understanding of
environmental policy, such as defining the main goal of environmental policy at large
and what purpose the plastic bag policy serves in their community.
Likewise, there are opportunities to improve the methodology of this research,
first by reaching a larger sample. Data collection within this study was restricted to
about two months, so with a longer survey period, the researcher could obtain a much
larger sample. A more robust data set could result with more statistically significant
results as well. Second, a longitudinal study could be performed, capturing pre- and
post-implemented bag ban. This type of methodology could measure the differences in
support of the policy and more clearly delineate behavioral and policy spillover
effects. Lastly, this study only measured one community with an implemented plastic
bag ban in Rhode Island; moving forward more than one community with an
implemented plastic bag ban could be surveyed to identify whether the trends found in
Middletown are consistent across other communities with plastic bag bans in the state.
Page 53
44
CHAPTER 6
CONCLUSION
This study investigated the effects of a first-generation plastic bag ban on
behavioral spillover of additional pro-environmental behaviors in both the private and
public-spheres of environmentalism. It also assessed community member’s knowledge
of plastic bag policies within their community of residence. Face-to-face surveys were
completed within two communities in Rhode Island: Middletown, a town with an
implemented plastic bag ban, and Warwick, a community without a plastic bag ban.
The major results of the study found that NEP, an indicator for environmental
worldview, was a significant predictor for using reusable bags and reusable water
bottles, and for supporting a statewide plastic bag policy in Rhode Island. Age was
also a significant predictor of reusable bag and reusable water bottle use; however, age
range was inversely related to these two these behaviors. Additionally, gender was a
predictor for reusable water bottle use. Lastly, the most noteworthy finding illustrated
that town of residence was a significant predictor for reusable bag use and support for
a statewide plastic bag ban in Rhode Island, suggesting that people who lived in a
community with an implemented plastic bag ban had greater support of a plastic bag
policy at the state level and used reusable bags more frequently.
This study provides a preliminary look into the possible effects of plastic bag
policies on environmental behaviors and environmental policy in the state of Rhode
Island. The results of this study could suggest broader support of environmental
policies in the state; however, a study encompassing more than one community with
an implemented plastic bag policy needs to be completed in order to be more
Page 54
45
conclusive about this recommendation. In addition, even though this study did not
show behavioral spillover, this does not indicate that the plastic policy did not
influence other environmental behaviors that were not included in this study.
For policymakers, the findings in this study suggest that implemented plastic
bag bans in Rhode Island lead to greater use of reusable bags, even when the
consumer has the choice of using a free paper bag at the point of purchase. In addition,
this study illustrates that to some degree, the establishment of local environmental
policies can create the opportunity for support of similar statewide policies. Therefore,
studying the effects of environmental policies is important to assess current policy and
the implementation of future policies at the local and state-level. Single-use plastics,
like the plastic bag, are littering the environment and causing harm to all living
organisms, while their complete effect on ecosystems is still unknown. Nevertheless,
research focusing on marine debris solutions provides important insight about the
global issue and how to improve remediation plans moving into the future.
Page 55
46
APPENDIX A: SURVEY
Demographic Questions
What is your age?
What is your gender?
What is the highest level of education you have completed? (please check a box below)
Less than High School
High School
Associate’s or Junior College
Bachelor’s degree
Graduate or Professional degree
What is your annual level of income?
What town do you live in?
Is this your primary address?
Connectedness to Nature
Page 56
47
New Ecological Paradigm Scale
Scale: Agree, disagree or undecided
1. If things continue on their present course, we will soon experience a major ecological catastrophe
2. The balance of nature is very delicate and easily upset
3. The earth is like a spaceship with very limited room and resources
4. Humans are severely abusing the environment
5. The balance of nature is strong enough to cope with the impacts of modern industrial nations
6. The so‐called ecological crisis facing humankind has been greatly exaggerated
7. Human ingenuity will ensure that we do NOT make the earth unlivable
Individual Behaviors
• Do you use purchase bottled water?
o Never, Occasionally, Frequently, Always
• Do you use a reusable water bottle?
o Never, Occasionally, Frequently, Always
• Do you bring reusable bags to the grocery store?
o Never, Occasionally, Frequently, Always
o If O/F/A, when did you start using reusable bags? ____________________________
• Do you recycle at home?
o Never, Occasionally, Frequently, Always
Participation in Environmental Organizations
• How often do you volunteer for environmental organizations?
o Never, Once a year, Once a month, Weekly
• Have you donated to an environmental cause in the past 12 months?
o Yes/No
• How aware are you of the following groups?
World Wildlife Fund Not at all, Somewhat, Familiar, Very Aware
Nature Conservancy Not at all, Somewhat, Familiar, Very Aware
Sierra Club Not at all, Somewhat, Familiar, Very Aware
Ocean Conservancy Not at all, Somewhat, Familiar, Very Aware
Save the Bay Not at all, Somewhat, Familiar, Very Aware
Page 57
48
Surfrider Foundation Not at all, Somewhat, Familiar, Very Aware
Clean Ocean Access Not at all, Somewhat, Familiar, Very Aware
• Do you have a membership to any environmental organizations?
o Yes/No, if yes, what are they __________________________
Awareness of Plastic Bag Ban
• When you shop for groceries, how often do you shop in (Middletown) or (Warwick)?
o Never, Occasionally, Frequently, Always
• When you are not shopping in (Middletown) or (Warwick), what town are you shopping for
groceries?
o _____________________________________________________
• Does your community have a plastic bag ban?
o Yes/No
• To your knowledge is there a statewide plastic bag ban in Rhode Island?
o Yes/No
• Are plastic bags available in your grocery store at the checkout counter?
o Yes/No
• Are there fees for the following types of bags in the grocery store in (Middletown) or (Warwick)?
o No
o Yes, for paper bags
o Yes, for plastic bags
o Yes, for both
• To what degree do you support a statewide plastic bag ban?
o Not at all, Somewhat, Mostly, Definitely
Final Questions?
• Is there anything else you would like to share after answering these survey questions?
• Do you have any questions about the current state of plastic bag bans in Rhode Island?
• Provide them with a fact sheet if they would like more information
Page 58
49
APPENDIX B: TOWN OF MIDDLETOWN PLASTIC BAG ORDINANCE
CHAPTER 92B: PLASTIC BAG REGULATIONS
Section
92B.01 Legislative findings and intent
92B.02 Purpose
92B.03 Definitions
92B.04 Prohibited acts
92B.05 Exemptions
92B.06 Enforcement; violations; penalties
92B.07 Hardship variance
92B.08 Effective date
§ 92B.01 LEGISLATIVE FINDINGS AND INTENT.
(A) The Town Council has the authority under Article 13 of the Rhode Island
Constitution and the Middletown Town Charter to regulate issues of solid waste, litter
and pollution as a local concern.
(B) The production, use and disposal of plastic checkout bags, which are
commonly not recycled, has been shown to have significant detrimental impacts on the
environment, including but not limited to contributing to pollution of the terrestrial
and coastal environment, clogging storm water drainage systems, and contributing to
the injury and death of terrestrial and marine life through ingestion and entanglement.
(C) The manufacture, transport and recycling of plastic checkout bags requires
substantial energy consumption and contributes to greenhouse gases.
Page 59
50
(D) Plastic checkout bags create a burden to solid waste collection and recycling
facilities.
(E) Prohibiting the use of plastic checkout bags is necessary to protect the
environment and the public health, safety, and welfare of all residents and visitors.
(Ord. 2017-7, passed 5-1-17; Am. Ord. 2017-15, passed 11-20-17)
§ 92B.02 PURPOSE.
The purpose of this chapter is to improve the environment in and around the town
and the health, safety, and welfare of its residents by reducing the number of plastic
and paper bags being used, encouraging the use and sale of reusable checkout bags
and banning the use of plastic bags for retail checkout of goods.
(Ord. 2017-7, passed 5-1-17; Am. Ord. 2017-15, passed 11-20-17)
§ 92B.03 DEFINITIONS.
For purposes of this chapter the following definitions shall apply unless the context
clearly indicates or requires a different meaning.
BUSINESS ESTABLISHMENT. Any commercial enterprise that provides carryout
bags to its customers, including sole proprietorships, joint ventures, partnerships,
corporations, or any other legal entity, and includes all employees of the business
and any independent contractors associated with the business. BUSINESS
ESTABLISHMENT does not include sales of goods at yard sales, tag sales, other
sales by residents at their homes, and sales by nonprofit organizations.
CARRYOUT BAG. A bag provided by a business establishment to a customer,
typically at the point of sale, for the purpose of transporting purchases.
Page 60
51
DOUBLE-OPENING PLASTIC BAGS. Any thin plastic bag with a double opening
(top and bottom) to protect clothing or other items for transport.
PLASTIC BARRIER BAG. Any thin plastic bag with a single opening used to:
(1) Transport fruit, vegetables, nuts, grains, small hardware items, or other
items selected by customers to the point of sale;
(2) Contain or wrap fresh or frozen foods, meat, or fish, whether prepackaged
or not;
(3) Contain or wrap flowers, potted plants, or other items where damage to a
good or contamination of other goods placed together in the same bag may be
a problem; or
(4) Contain unwrapped prepared foods or bakery goods.
PLASTIC CARRYOUT BAG. Any plastic carry-out bag that is provided by a
business establishment to a customer, typically at the point of sale, for the purpose of
transporting purchases. PLASTIC CARRYOUT BAG does not include plastic barrier
bags or double-opening plastic bags, as defined herein, or plastic bags measuring
larger than 28 inches by 36 inches.
RECYCLABLE PAPER BAG. A paper bag that is fully recyclable overall and
contains a minimum of 40% post-consumer recycled content and contains no old
growth fiber. The bag should display the words "Reusable" and "Recyclable" or the
universal recycling logo on the outside of the bag.
REUSABLE BAG. A bag with handles that is specifically designed and manufactured
for multiple reuse and is made primarily of cloth or other nonwoven textile or
Page 61
52
durable plastic with a minimum thickness of four mils. Any straps must be stitched
and not heat fused.
(Ord. 2017-7, passed 5-1-17; Am. Ord. 2017-15, passed 11-20-17)
§ 92B.04 PROHIBITED ACTS.
(A) No business establishment shall provide or make available any plastic carryout
bag (either complementary or for a fee) for any sales transaction or other use to
members of the public, that does not comply with the definition of a reusable bag
under § 92B.03 of this chapter.
(B) All business establishments that provide plastic barrier bags or double opening
bags shall offer a recycling opportunity onsite for the recycling of any plastic bags or
clean plastic bag film as defined by the Rhode Island Resource Recovery Corporation
RESTORE program.
(C) Nothing in this section shall preclude business establishments from making
reusable bags or recyclable paper bags, as defined in § 92B.03 of this chapter,
available to customers, by sale or otherwise.
(Ord. 2017-7, passed 5-1-17; Am. Ord. 2017-15, passed 11-20-17)
§ 92B.05 EXEMPTIONS.
This chapter does not apply to:
(A) Laundry dry cleaning bags, door-hanger bags, newspaper bags, or packages of
multiple bags intended for use as garbage, pet waste, or yard waste;
(B) Bags provided by pharmacists or veterinarians to contain prescription drugs or
other medical necessities, provided that the bags are recyclable within the state's
recycling program; and
Page 62
53
(C) Plastic barrier bags, double opening plastic bags and bags used by a consumer
inside a business establishment to:
(1) Contain bulk items, such as produce, nuts, grains, candy, or small
hardware items;
(2) Contain or wrap frozen foods, meat, or fish, whether or not prepackaged;
(3) Contain or wrap flowers, potted plants or other items to prevent moisture
damage to other purchases;
(4) Contain unwrapped prepared foods or bakery goods; or
(5) Bags used by a non-profit corporation or other hunger relief charity to
distribute food, grocery products, clothing, or other household items.
(Ord. 2017-7, passed 5-1-17; Am. Ord. 2017-15, passed 11-20-17)
§ 92B.06 ENFORCEMENT; VIOLATIONS; PENALTIES.
This chapter shall be enforced by the Police Department, or any other Town
Department designated by the Town Administrator. Any person who violates any of
the provisions of this chapter shall be subject to the following penalties:
(A) For a first offense, the person charged with a violation of this chapter shall be
served with a warning letter by delivering it to him or her personally, or by posting a
copy upon a conspicuous portion of the retail sales establishment and sending a copy
of the same by certified mail to the person to whom the notice is directed. The warning
letter shall inform the person charged of the nature of the violation and that it must be
corrected within 14 days of the date of the letter, and shall include a copy of this
chapter.
Page 63
54
(B) For a second offense more than 14 days after service of a warning letter, a fine
of $150. The person charged shall, for a second offense, be given the opportunity to
pay the fine assessed by mail, which shall be indicated on the summons issued by the
charging officer. Should the alleged violator elect not to pay the fine assessed by mail,
said person shall be entitled to a hearing before the Municipal Court.
(C) For a third or subsequent offense, a fine of $300, and a hearing before the
Municipal Court shall be required.
(D) Each occurrence of a violation more than 14 days after service of a warning
letter, and each day that such violation continues, shall constitute a separate violation
and may be cited as such.
(Ord. 2017-7, passed 5-1-17; Am. Ord. 2017-15, passed 11-20-17)
§ 92B.07 HARDSHIP VARIANCE.
The Town Administrator may grant a variance from the requirements of this chapter
only after determining that:
(A) Application of this chapter would cause undue hardship based upon unique
circumstances; or
(B) Application of this chapter would deprive a person or business of a legally
protected right.
(C) The requested variance shall be submitted on the towns prescribed forms.
(D) Any variance granted under this section must be the minimum variance
necessary to address the hardship.
(E) The Administrator shall prepare a written report of findings to support the grant
or denial of the variance.
Page 64
55
(Ord. 2017-7, passed 5-1-17; Am. Ord. 2017-15, passed 11-20-17)
§ 92B.08 EFFECTIVE DATE.
This chapter shall take effect on passage and its provisions shall supersede any
inconsistent or contrary provision in any other ordinance, provided however, that
enforcement shall be stayed until November 30, 2017.
(Ord. 2017-7, passed 5-1-17; Am. Ord. 2017-15, passed 11-20-17)
Page 65
56
BIBLIOGRAPHY
Andrady, A. (1990). Weathering of Polyethylene (LDPE) and Enhanced
Photodegradable Polyethylene in the Marine Environment. Journal of Applied
Polymer Science, 39(2), 363-370.
Bag Laws. (2019). Rhode Island - Bag Legislation. Retrieved from
http://www.baglaws.com/legislation.php?state=Rhode_Island, accessed March
11, 2019.
Barnes, D., Galgani, F., Thompson, R., & Barlaz, M. (2009). Accumulation and
Fragmentation of Plastic Debris in Global Environments. Philosophical
Transactions of the Royal Society of London. Series B, Biological Sciences,
364(1526), 1985-98.
BBC News. (2010, September 29). History of the World: The first piece of polythene.
Retrieved from
http://news.bbc.co.uk/local/manchester/hi/people_and_places/history/newsid_9
042000/9042044.stm, accessed March 11, 2019.
Clean Ocean Access. (2019). Retrieved from http://www.cleanoceanaccess.org,
accessed March 11, 2019.
Data Access and Dissemination Systems (DADS). (2017). American FactFinder.
Retrieved from https://factfinder.census.gov/
Davis, J., Green, J. & Reed, A. (2009). Interdependence with the Environment:
Commitment, Interconnectedness, and Environmental Behavior. Journal of
Environmental Psychology, 29(2), 173-180.
Derraik, J. (2002). The Pollution of the Marine Environment by Plastic Debris: A
Page 66
57
Review. Marine Pollution Bulletin, 44(9), 842-852.
De Young, R. (1993). Changing Behavior and Making it Stick. Environment and
Behavior, 25(3), 485-505.
Dunlap, R., Van Liere, K., Mertig, A., & Jones, R. (2000). New Trends in Measuring
Environmental Attitudes: Measuring Endorsement of the New Ecological
Paradigm: A Revised NEP Scale. Journal of Social Issues, 56(3), 425-442.
Freinkel, S. (2011). Plastic: A Toxic Love Story. Boston: Houghton Mifflin Harcourt.
Gardner, G., Assadourian, E., & Sarin, R. (2004). State of the World, 2004: A
Worldwatch Institute Report on Progress Toward a Sustainable Society.
London, England: Earthwatch, 2004.
Gatersleben, B., Murtagh, N., & Abrahamse, W. (2014). Values, Identity and Pro-
environmental Behaviour. Contemporary Social Science, 9(4), 374-392.
Gerring, J. (2004). What Is a Case Study and What Is It Good for? American Political
Science Review, 98(2), 341-354.
Geyer, R., Jambeck, J., & Law, K. (2017). Production, Use, And Fate of All Plastics
Ever Made. Science Advances, 3(7), E1700782.
Jakovcevic, Steg, Mazzeo, Caballero, Franco, Putrino, & Favara. (2014). Charges for
Plastic Bags: Motivational and Behavioral Effects. Journal of Environmental
Psychology, 40, 372-380.
Jambeck, J., Geyer, R., Wilcox, C., Siegler, T., Perryman, M., Andrady, A., . . . Law,
K. (2015). Marine Pollution. Plastic Waste Inputs from Land into the Ocean.
Science (New York, N.Y.), 347(6223), 768-71.
Jones, K., Abrahamse, W., & de Groot, J.I.M. (2013). Persuasive Normative
Page 67
58
Messages: The Influence of Injunctive and Personal Norms on Using Free
Plastic Bags. Sustainability, 5(5), 1829-1844.
Khan, U., & Dhar, R. (2006). Licensing Effect in Consumer Choice. Journal of
Marketing Research, 43(2), 259-266.
Karmarkar, U., & Bollinger, B. (2015). BYOB: How Bringing Your Own Shopping
Bags Leads to Treating Yourself and the Environment. Journal of Marketing,
79(4), 1-15.
Kollmuss, A. & Agyeman, J. (2002). Mind the Gap: Why Do People Act
Environmentally and What Are the Barriers to Pro-Environmental Behavior?
Environmental Education Research, 8(3), 239-60.
Li, W.C, Tse, H.F. & Fok, L. (2016). Plastic Waste in the Marine Environment: A
Review of Sources, Occurrence and Effects. Science of the Total Environment,
566-567, 333-349.
Marine Debris. (2016). In United Nations (Ed.), The First Global Integrated Marine
Assessment: World Ocean Assessment I (pp. 389-408). Cambridge:
Cambridge University Press.
Mayer, F. & Frantz, C. (2004). The Connectedness to Nature Scale: A measure of
individuals’ feeling in community with nature. Journal of Environmental
Psychology, 24(4), 503-515.
Nilsson, A., Bergquist, M., & Schultz, W. (2016). Spillover Effects in Environmental
Behaviors, Across Time and Context: A Review and Research Agenda.
Environmental Education Research, (Vol. 23). Routledge.
Ohtomo, S. & Ohnuma, S. (2014). Psychological Interventional Approach for Reduce
Page 68
59
Resource Consumption: Reducing Plastic Bag Usage at Supermarkets.
Resources, Conservation & Recycling, 84(C), 57-65.
Poortinga, Whitmarsh, & Suffolk. (2013). The Introduction of a Single-use Carrier
Bag Charge in Wales: Attitude Change and Behavioural Spillover Effects.
Journal of Environmental Psychology, 36(C), 240-247.
RIRRC. (2015). Rhode Island Solid Waste Characterization Study. Retrieved from
https://www.rirrc.org
RIRRC. (2017). How Is My City / Town Doing | RIRRC. Retrieved from
https://www.rirrc.org/about/reports-data/how-is-my-city-town-doing, accessed
March 11, 2019.
Robson, C. (2011). Real World Research (3rd ed.). Oxford: Wiley.
Romer, J. (2018, March 5). Plastic Bag Laws in the U.S. Retrieved from
https://www.plasticbaglaws.org/, accessed March 11, 2019.
Rutan Poly Industries, Inc. (2015, June 30). The History of Plastic Bags. Retrieved
from http://rutanpoly.com/the-history-of-plastic-bags/, accessed March 11,
2019.
Science History Institute. (2016, December 20). The History and Future of Plastics.
Retrieved from https://www.sciencehistory.org/the-history-and-future-of-
plastics, accessed March 11, 2019.
Sheavly, S.B., & Register, K.M. (2007). Marine Debris & Plastics: Environmental
Concerns, Sources, Impacts and Solutions. Journal of Polymers and the
Environment, 15(4), 301-305.
Schultz, P., Gouveia, V., Cameron, L., Tankha, G., Schmuck, P., & Franěk, M.
Page 69
60
(2005). Values and their Relationship to Environmental Concern and
Conservation Behavior. Journal of Cross-Cultural Psychology, 36(4), 457-
475.
Stern, P. (2000). New Environmental Theories: Toward a Coherent Theory of
Environmentally Significant Behavior. Journal of Social Issues, 56(3), 407-
424.
Thomas, G.O., Poortinga, W., & Sautkina, E. (2016). The Welsh Single-Use Carrier
Bag Charge and Behavioural Spillover. Journal of Environmental Psychology,
47(C), 126-135.
Thomas, G.O., Sautkina, E., Poortinga, W., Wolstenholme, E. and L. Whitmarsh.
(2019). The English Plastic Bag Charge Changed Behavior and Increased
Support for Other Charges to Reduce Plastic Waste. Frontiers in Psychology,
10, 266.
UN Environment. (2018, April 25). From Birth to Nan: A History of the Plastic
Shopping Bag. Retrieved from https://www.unenvironment.org/news-and-
stories/story/birth-ban-history-plastic-shopping-bag, accessed March 11, 2019.
US Department of Commerce, & National Oceanic and Atmospheric Administration.
(2008, November 14). What is Marine Debris? Retrieved from
https://oceanservice.noaa.gov/facts/marinedebris.html, accessed March 11,
2019.
Villarrubia-Gómez, P., Cornell, S., & Fabres, J. (2018). Marine Plastic Pollution as a
Planetary Boundary Threat – The Drifting Piece in the Sustainability Puzzle.
Marine Policy, 96, 213-220.
Page 70
61
Wagner, T. (2017). Reducing Single-Use Plastic Shopping Bags in the USA. Waste
Management, 70, 3-12.
Wiernik, B.M., Ones, D. S., & Dilchert, S. (2013). Age and Environmental
Sustainability: A meta-analysis. Journal of Managerial Psychology, 28(7/8),
826-856.
Wilcox, Mallos, Leonard, Rodriguez, & Hardesty. (2016). Using Expert Elicitation to
Estimate the Impacts of Plastic Pollution on Marine Wildlife. Marine Policy,
65, 107-114.
Whitfield, S., Rosa, E., Dan, A., & Dietz, T. (2009). The Future of Nuclear Power:
Value Orientations and Risk Perception. Risk Analysis, 29(3), 425-437.
Wyles, K., Pahl, S., Holland, M., & Thompson, R. (2017). Can Beach Cleans Do
More Than Clean-Up Litter? Comparing Beach Cleans to Other Coastal
Activities. Environment and Behavior, 49(5), 509-535.
Zelezny, L., Chua, P., & Aldrich, C. (2000). New Ways of Thinking about
Environmentalism: Elaborating on Gender Differences in Environmentalism.
Journal of Social Issues, 56(3), 443-457.